influence of pipe material and surfaces on sulfide related odor and corrosion in sewers
TRANSCRIPT
w a t e r r e s e a r c h 4 2 ( 2 0 0 8 ) 4 2 0 6 – 4 2 1 4
Avai lab le at www.sc iencedi rect .com
journa l homepage : www.e lsev i er . com/ loca te /wat res
Influence of pipe material and surfaces on sulfide relatedodor and corrosion in sewers
Asbjørn Haaning Nielsen*, Jes Vollertsen, Henriette Stokbro Jensen,Tove Wium-Andersen, Thorkild Hvitved-Jacobsen
Section of Environmental Engineering, Aalborg University, Sohngaardsholmsvej 57, 9000 Aalborg, Denmark
a r t i c l e i n f o
Article history:
Received 13 May 2008
Received in revised form
4 July 2008
Accepted 7 July 2008
Available online 17 July 2008
Keywords:
Concrete corrosion
Hydrogen sulfide
Odor
Sewers
Sulfide oxidizing bacteria
* Corresponding author. Section of EnviroEngineering, Aalborg University, Sohngaards
E-mail address: [email protected] (A.H. Nie0043-1354/$ – see front matter ª 2008 Elsevidoi:10.1016/j.watres.2008.07.013
a b s t r a c t
Hydrogen sulfide oxidation on sewer pipe surfaces was investigated in a pilot scale exper-
imental setup. The experiments were aimed at replicating conditions in a gravity sewer
located immediately downstream of a force main where sulfide related concrete corrosion
and odor is often observed. During the experiments, hydrogen sulfide gas was injected
intermittently into the headspace of partially filled concrete and plastic (PVC and HDPE)
sewer pipes in concentrations of approximately 1000 ppmv. Between each injection, the
hydrogen sulfide concentration was monitored while it decreased because of adsorption
and subsequent oxidation on the pipe surfaces. The experiments showed that the rate of
hydrogen sulfide oxidation was approximately two orders of magnitude faster on the
concrete pipe surfaces than on the plastic pipe surfaces. Removal of the layer of reaction
(corrosion) products from the concrete pipes was found to reduce the rate of hydrogen
sulfide oxidation significantly. However, the rate of sulfide oxidation was restored to its
background level within 10–20 days. A similar treatment had no observable effect on
hydrogen sulfide removal in the plastic pipe reactors. The experimental results were
used to model hydrogen sulfide oxidation under field conditions. This showed that the
gas-phase hydrogen sulfide concentration in concrete sewers would typically amount to
a few percent of the equilibrium concentration calculated from Henry’s law. In the plastic
pipe sewers, significantly higher concentrations were predicted because of the slower
adsorption and oxidation kinetics on such surfaces.
ª 2008 Elsevier Ltd. All rights reserved.
1. Introduction filled (gravity) sewers, the hydrogen sulfide gas is emitted
Some of the most challenging problems faced by sewerage
authorities are those related to the build-up of hydrogen
sulfide gas (H2S(g)) in sewers. Hydrogen sulfide is primarily
produced by microbial breakdown of organic matter with
sulfate (SO42�) as terminal electron acceptor. This strictly
anaerobic process mainly takes place in the sediments
and biofilms covering the wetted pipe surfaces. In partly
nmental Engineering,holmsvej 57, 9000 Aalbolsen).er Ltd. All rights reserved
from the wastewater stream into the sewer atmosphere.
The rate of air–water mass transfer of hydrogen sulfide is
controlled by several factors, the most important being
temperature, wastewater pH and the turbulence level
(Yongsiri et al., 2005). Hydrogen sulfide is an extremely
toxic gas with a characteristic smell of rotten egg. Every
year sewer workers are injured or killed due to exposure
to toxic/lethal levels of hydrogen sulfide. The threshold
Department of Biotechnology, Chemistry and Environmentalrg, Denmark. Tel.: þ45 96 358 468; fax: þ45 96 352 555.
.

w a t e r r e s e a r c h 4 2 ( 2 0 0 8 ) 4 2 0 6 – 4 2 1 4 4207
odor limit of hydrogen sulfide is very low and it is known
to be a major constituent of sewer odor (Thistlethwayte
and Goleb, 1972). In addition, hydrogen sulfide is the cause
of microbial induced concrete corrosion, which is
a problem of significant economic impact (Zhang et al.,
2008). The corrosion process results from adsorption of
hydrogen sulfide onto the concrete surfaces exposed to
the sewer atmosphere and subsequent oxidation of the
hydrogen sulfide to sulfuric acid (H2SO4). The oxidation
mechanism has been described to include chemical oxida-
tion of hydrogen sulfide to elemental sulfur, which is then
oxidized microbiologically to sulfuric acid by thiobacilli
(e.g., Vincke et al., 2000). The sulfuric acid reacts readily
with the alkaline components of the concrete. In severe
cases, corrosion rates exceeding 5 mm/year have been
observed (Mori et al., 1991).
Despite the significance of the hydrogen sulfide related
problems, several aspects concerning hydrogen sulfide
build-up in sewers are still not well understood. The rela-
tionship between hydrogen sulfide gas concentrations and
corrosion rates has recently been identified as one of the
main research gaps (Apgar and Witherspoon, 2007).
Hydrogen sulfide levels in the sewer atmosphere are rela-
tively easy to monitor using electrochemical sensors. It
would therefore be valuable if such measurements could
be used for predicting corrosion rates in actual sewers.
One aspect that is likely to play an important role for the
extent of the sulfide related problems is the characteristics
of the pipe surfaces. The corroding pipe surfaces may
frequently be disturbed because of variations of the water
level in the sewer. Such events will possibly remove the
matrix of biofilm embedded in loosely bound corrosion prod-
ucts that cover the concrete pipe surface. This is particularly
relevant for combined sewer systems, which are designed to
operate at full-flow capacity with a certain return period.
The uses of corrosion resistant pipe materials or liners will
possibly also influence the fate of the hydrogen sulfide gas.
Thermoplastics such as high-density polyethylene (HDPE)
and polyvinylchloride (PVC) are among the most widely
used corrosion resistant materials for sewer pipes (Apgar
and Witherspoon, 2007; Stewart, 2005).
Field studies have shown that adsorption and oxidation
of hydrogen sulfide onto concrete sewer pipes exposed to
the sewer atmosphere is a fast process that effectively
reduces the gas-phase concentration to a few percent of
the equilibrium concentration (e.g., Matos and Aires, 1995;
Nielsen et al., 2008). However, it has to the authors’ knowl-
edge not been documented to which extent sulfide adsorp-
tion and subsequent oxidation takes place on plastic pipe
surfaces. On concrete surfaces, sulfuric acid will react with
the alkaline components of the concrete, thereby neutral-
izing the acid (Sand, 1997). The plastic surfaces are inert
and will not neutralize the acid. It is therefore likely that
the pH will eventually become inhibitory for the sulfide
oxidizing bacteria, thereby reducing the rate of sulfide oxida-
tion. This will inevitably lead to higher sulfide concentra-
tions on the pipe surface, which in turn will reduce the
adsorption rate and result in higher hydrogen sulfide
concentrations in the sewer atmosphere and an increased
odor potential. In addition, it can be expected that hydrogen
sulfide gas is transported a longer distance downstream in
the gravity sewer system.
There is a need for better understanding the surface reac-
tion kinetics of hydrogen sulfide adsorption and oxidation
for managing odor and corrosion problems in sanitary sewer
systems. The objective of the present study was to quantify
the kinetics of hydrogen sulfide adsorption and oxidation on
concrete and plastic pipe surfaces under in situ conditions
and to investigate the effect of disturbing the pipe surface.
For the investigations, a pilot plant was constructed and oper-
ated under in situ conditions with intermittent injection of
hydrogen sulfide into the headspace of partially filled sewer
pipe reactors. The intermittent injection of hydrogen sulfide
gas replicates conditions immediately downstream of a force
main where sulfide related concrete corrosion and odor is
often observed.
2. Materials and methods
2.1. Experimental setup
Adsorption and oxidation of hydrogen sulfide gas on concrete
and plastic sewer pipes was studied in a pilot plant comprising
eight individually operated pilot scale sewer reactors. The
reactors were designed with a free water surface to replicate
gravity sewer conditions. Six of the sewer reactors were con-
structed of concrete pipe segments, one reactor was con-
structed of PVC pipe segments and one reactor was
constructed of HDPE pipe segments. The setup was placed in
a sewer research and monitoring station in the town of Frejlev,
a few kilometers west of Aalborg, Denmark. The Frejlev sewer
monitoring station is located below the ground with easy
access to a continuous supply of wastewater from a purely
residential catchment of approximately 2000 inhabitants.
Each sewer reactor comprised of a reaction chamber made
of sewer pipe segments, an air circulation system, a waste-
water circulation system and appurtenances for H2S gas injec-
tion and wastewater supply and removal (Fig. 1). In the
concrete reactors, the reaction chamber consisted of 10
concrete pipe segments of 0.2 m length each, resulting in
a total reactor length of 2 m. The pipe segments were cut
from standard concrete pipes produced from Portland cement
according to Danish National Standards. The reaction
chamber of the plastic pipe reactors consisted of two 1.0 m
long PVC or HDPE pipe segments (Uponor A/S, Hadsund, Den-
mark). The reactor segments were sealed with rubber rings
and a PVC plate with openings for gas and wastewater circula-
tion was mounted at each end of the reaction chamber. The
main characteristics of the pilot scale test reactors are
summarized in Table 1. The air circulation system consisted
of a 3.0 m PVC pipe with an inner diameter of 22 mm and
a centrifugal fan blower. The resulting gas velocity inside
the reaction chamber was 0.053� 0.007 m s�1, corresponding
to a circulation time of approximately 40 s. The gas velocity
is comparable to velocities measured in real sewers (e.g., Mad-
sen et al., 2006). To avoid jet streams at the gas inlet, the circu-
lating air was injected through an air diffuser. A 1 mm drilling
was made in the air circulation pipe in order to allow pressure
equalization of the otherwise airtight setup.

Fig. 1 – Schematic illustration of the pilot scale reactors, c.f. text.
w a t e r r e s e a r c h 4 2 ( 2 0 0 8 ) 4 2 0 6 – 4 2 1 44208
2.2. Run-in of experimental setup
The reactors were run-in for a period of approximately 18
months before the experiments were started. During the
entire run-in period, hydrogen sulfide gas was injected
from a flask containing compressed hydrogen sulfide gas
(Yara Praxair, Fredericia, Denmark) at fixed time intervals.
The hydrogen sulfide concentration in the gas phase was
around 1000 ppmv immediately after injection. The
frequency of hydrogen sulfide gas injections was adapted
to the rate of hydrogen sulfide adsorption and oxidation.
This ensured that unrealistic high hydrogen sulfide concen-
trations did not build up inside the reactor. The time interval
between hydrogen sulfide gas injections was set at 1 h for
the concrete pipe reactors and 12 h for the plastic pipe reac-
tors. Every 2 h, approximately 30% of the wastewater was
replaced by pumping fresh pre-settled wastewater into the
reactor. At the same time, surplus wastewater as well as
part of the sewer gas was pumped out of the reactor. The
wastewater was circulated at a low flow rate (approximately
0.1 L s�1) with the purpose of achieving mixing of the waste-
water without causing disturbance of the corrosion process.
The operation of the setup was automated by a PLC control
system. During the run-in period, the temperature of the
gas phase varied between 20 �C and 3 �C.
Table 1 – Main characteristics of the pilot scale testreactors
Concrete HDPE PVC
Inner diameter of reaction chamber (m) 0.200 0.184 0.188
Water depth (m) 0.050 0.041 0.041
Gas volume (m3) 0.051 0.044 0.047
Wastewater volume (m3) 0.012 0.009 0.009
Surface area of reaction chamber
exposed to the gas phase (m2)
0.838 0.794 0.816
Surface area of air circulation system (m2) 0.207 0.207 0.207
2.3. Hydrogen sulfide oxidation experiments
During experiments for determining the kinetics of hydrogen
sulfide adsorption and oxidation, the reactors were operated
with pulse injection of 1000 ppmv H2S(g) similar to the run-in
period. However, the wastewater circulation was turned off
in order to minimize the loss of hydrogen sulfide resulting
from adsorption by the wastewater. The circulation of sewer
gas was kept unchanged. In each experiment, hydrogen
sulfide removal from the gas phase was measured over
a 96 h period for the plastic pipe reactors and 24 h for the
concrete pipe reactors. This resulted in 8–24 injections of
hydrogen sulfide of which the first 8–10 injections were used
for determination of reaction kinetics.
The hydrogen sulfide gas concentration was measured
using Odalog� gas detectors (App-Tek International Pty Ltd,
Brendale, Australia) fitted to the air circulation pipe (Fig. 1).
The gas detectors were routinely calibrated using 100 ppmv
H2S or 250 ppmv H2S calibration gas balanced in air (Euro-
Gas Management Services Ltd, Plymouth, UK).
The total sulfide concentration of the wastewater was
measured by the methylene blue method (APHA et al., 1995).
The samples for total sulfide determination were preserved
by addition of a 10% w/v zinc acetate solution (25 mL L�1)
into the sampling bottles. The dissolved oxygen concentra-
tion, pH and temperature of the wastewater were measured
using WTW pH/Oxi 340i multi-parameter instruments (WTW
GmbH, Weilheim, Germany).
The concentration of elemental sulfur in the material
deposited on the plastic pipe surfaces was analyzed by ion
chromatography after conversion to thiosulfate. The depos-
ited material was sampled using a small stainless steel
spatula. Before analysis, the material was washed in deion-
ized water and dried to constant weight in a dessicator. The
elemental sulfur was transformed to thiosulfate by reaction
with sulfite (30% w/v) in alkaline solution (1 M NaOH) at
60 �C for 12 h. The thiosulfate concentration was subse-
quently measured by ion chromatography with suppressed
conductivity detection (Dionex, Sunnyvale, Ca, USA) using
potassium hydroxide (KOH) as eluent and an anion exchange
column (Dionex AS11). The same ion chromatography method
w a t e r r e s e a r c h 4 2 ( 2 0 0 8 ) 4 2 0 6 – 4 2 1 4 4209
was also used to measure sulfate, thiosulfate and sulfite in
water droplets collected from the sewer crown.
Total, volatile and fixed solids of the corrosion products
were analyzed according to Standard Methods (APHA et al.,
1995). The alkalinity of the concrete in CaCO3 equivalents
was analyzed according to Snell et al. (1966–1974). The method
was modified for larger samples of approximately 5 g
concrete. The surface pH of the sewer pipe segments was
measured by pressing pH-strips (Merck, Darmstadt, Germany)
that were wetted with deionized water against the moist
surface for about a minute.
2.4. Interpretation of experimental results
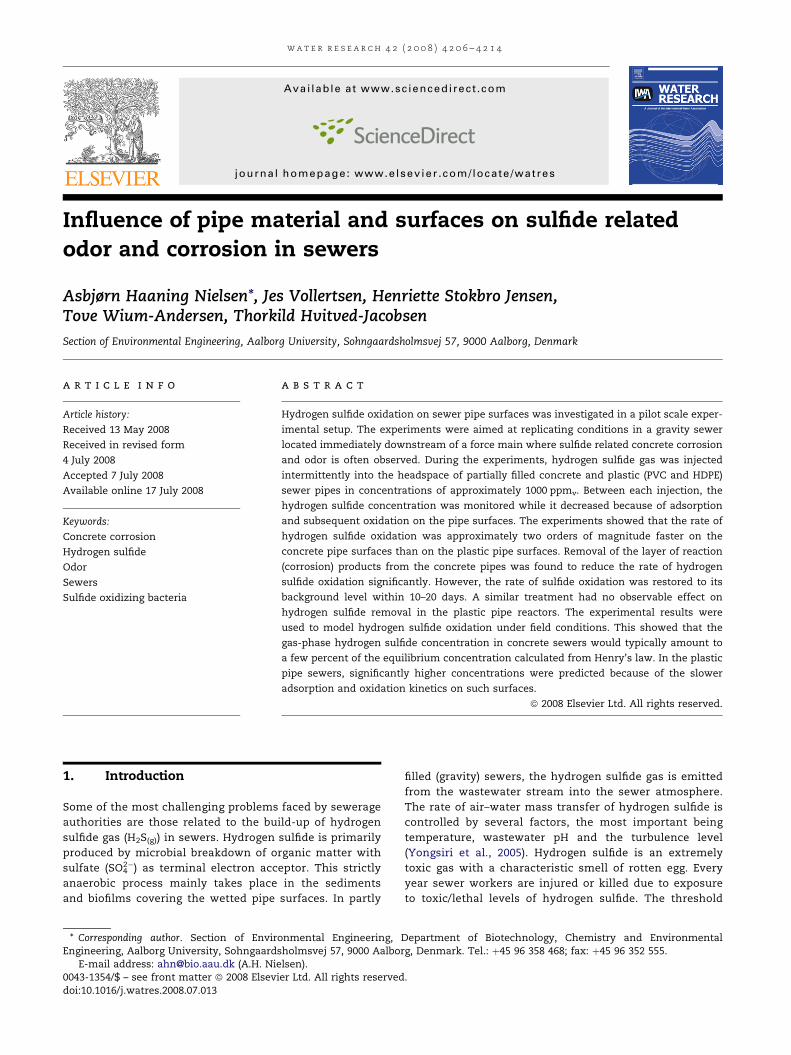
The hydrogen sulfide removal rate was determined from the
slope of the measured hydrogen sulfide concentration versus
time as illustrated in Fig. 2. The removal of hydrogen sulfide
was interpreted by considering two removal mechanisms;
i.e., adsorption and oxidation on the pipe wall exposed to
the sewer atmosphere (designated as oxidation in the
following) and absorption by the wastewater phase. The
kinetics of hydrogen sulfide oxidation was evaluated in terms
of n-order kinetics (Eq. (1)).
�dpH2S
dt¼ knpn
H2S (1)
where pH2S is the partial pressure of H2S gas (ppmv), t is time
(h), n is the reaction order (�) and kn is the oxidation rate
constant (ppmv1�n h�1).
The kinetics of hydrogen sulfide absorption by the waste-
water phase was calculated from the classical rate equation
for air–water mass transfer of gases derived from the two-
film theory (Eq. (2)):
dCSð�IIÞ
dt¼ KL
Aw
Vw
�CH2S;Eq � CH2S
�(2)
Fig. 2 – Example of 48 h of hydrogen sulfide gas-phase measure
corresponding hydrogen sulfide removal rates (lower graphs).
where CS(�II ) is the total sulfide concentration in the waste-
water (g S m�3), KL is the mass transfer coefficient (m h�1),
Aw is the surface area of the wastewater (m2), Vw is the waste-
water volume (m3), CH2S;Eq is the dissolved H2S concentration
of the wastewater at equilibrium with the gas phase
(g S m�3), and CH2S is the actual H2S concentration of the
wastewater at the specific pH (g S m�3).
Considering the ideal gas law and the geometry of the
experimental setup, the overall removal of hydrogen sulfide
gas can be described by Eq. (3):
�dpH2S
dt¼ KL
Aw
Vg
RTabs
MwP106�CH2S;Eq � CH2S
�þ knpn
H2S (3)
where Vg is the volume of gas in the reactor (m3), R is the ideal
gas constant (m3 atm K�1 mol�1), Tabs is the temperature (K),
Mw is the molar weight of sulfur (g mol�1), P is the pressure
(atm).
The water-phase concentration of H2S at equilibrium with
the gas phase can be calculated from Henry’’s law (Eq. (4)):
CH2S;Eq ¼ Mw10�3
�pH2S
HA
�(4)
where HA is the Henry’s law constant for hydrogen sulfide
(L atm mol�1).
Previous investigations have shown that hydrogen sulfide
absorption by the wastewater is negligible compared to
surface oxidation in the concrete reactors (Vollertsen et al.,
2008). This process was therefore omitted when analyzing
data from the concrete pipe reactors. For determining the
value of KL in the plastic pipe reactors, the reactors were
cleaned and the wastewater was replaced with a 1% w/v
zinc acetate solution in six independent experiments. Zinc
acetate effectively precipitates the H2S absorbed by the water
phase, thereby maintaining a CH2S of 0 g S m�3. Eq. (2) was
adapted to the experimental conditions and the value of KL
was determined from the measured hydrogen sulfide gas
ment in the HDPE pipe reactor (upper graphs) and the

w a t e r r e s e a r c h 4 2 ( 2 0 0 8 ) 4 2 0 6 – 4 2 1 44210
concentration and the increase in the water-phase concentra-
tion of zinc sulfide over a period of 48 h (Eq. (5)):
dCSð�IIÞ
dt¼ KL
Aw
VwMw10�3
�pH2S
HA
�(5)
The hydrogen sulfide oxidation rate expressed in units of
ppmv per hour is specific to the geometry of the experimental
setup. For comparison with other systems, the volume-
specific hydrogen sulfide oxidation rate was converted into
a surface-specific hydrogen sulfide oxidation rate (Eq. (6)).
r ¼ knpnH2S
Vg
Ap
PRTabs
10�3Mw (6)
where r is the surface-specific hydrogen sulfide oxidation rate
(mg S m�2 h�1) and Ap is the pipe wall area exposed to the gas
phase (m2).
Because the rate constant and the reaction order vary
between experiments, a comparison of these parameters alone
is not sufficient to characterize the kinetics of hydrogen sulfide
oxidation. Instead, sulfide oxidation rates were calculated for
low (10 ppmv), medium (100 ppmv) and high (1000 ppmv)
hydrogen sulfide concentrations, and labeled r10, r100 and
r1000, respectively. Unless otherwise stated, all rates have
been corrected to 15 �C according to an Arrhenius-type equa-
tion with a temperature coefficient of 1.024, which is typical
for diffusion limited processes (Hvitved-Jacobsen, 2002). While
analyzing the data from the plastic pipe reactors, the area-
specific hydrogen sulfide oxidation rate was assumed identical
for the air circulation system and the reaction chamber. For the
concrete pipe reactors, the contribution to the hydrogen sulfide
removal from the surface of the air circulation system was
neglected according to Vollertsen et al. (2008).
3. Results and discussion
3.1. Run-in of the pilot scale reactors
During the first couple of months of the run-in period, the
removal rate of hydrogen sulfide gas increased significantly
in the concrete pipe reactors. This was most likely due to
Fig. 3 – Pictures of the interior of one of the concrete pipe reactor
8 months of operation.
a colonization of the concrete surface by sulfide oxidizing
bacteria (Islander et al., 1991). On the interior surface of the
concrete pipes, a porous layer of corrosion products developed.
This layer increased the surface area of the pipe exposed to the
sewer atmosphere significantly and thereby probably also
influenced the removal rate. A similar development of the
sulfide removal rates was not observed for the plastic pipe
reactors which remained slow throughout the run-in period.
After approximately 4 months of operation, all concrete
pipes were severely corroded and the surface pH had dropped
below 1–2 (Fig. 3). The porous layer of corrosion products
covering the concrete pipe surfaces exposed to the sewer
atmosphere consisted of loosely bound material with little
mechanical strength. The material was most likely gypsum
(CaSO4$2H2O) and bassanite (CaSO4$0.5H2O) resulting from
the reaction between sulfuric acid and the alkaline compo-
nents of the concrete (Davis et al., 1998). The alkalinity of
the concrete was determined at 0.181 g CaCO3 (g concrete)�1
(�0.014) (Vollertsen et al., 2008). This value is typical for stan-
dard concrete pipes (U.S. EPA, 1974). The dry matter content of
the loosely bound material was 65.0% (� 2.4%) and the weight
loss from ignition at 550 �C constituted 2.7% (� 0.5%) of the dry
matter; i.e., the material was mainly inorganic.
During the run-in period, the interior surface of the plastic
pipes became covered by a thin layer of yellow material
(Fig. 3). Water droplets were retained at the sewer crown
whereas the remaining part of the pipe perimeter remained
fairly dry. In addition, the yellow layer was not evenly distrib-
uted along the perimeter of the pipe. The layer was thickest
near the water line as depicted in Fig. 3. It was therefore not
possible to obtain representative samples for characterization
of the water content. Material sampled near the water line
was analyzed for elemental sulfur, which was found to
comprise 88% w/w (�2.4%) of the dry matter. This demon-
strated that elemental sulfur is a major product of hydrogen
sulfide oxidation on the plastic pipe surfaces. The relatively
low weight loss from ignition of the porous layer of corroded
concrete indicates that elemental sulfur was not a major
part of the corroded material, as it would have evaporated.
During the run-in period, the surface pH of the plastic pipes
rapidly dropped below 1 where it remained throughout the
s (left) and the HDPE pipe reactor (right) after approximately
w a t e r r e s e a r c h 4 2 ( 2 0 0 8 ) 4 2 0 6 – 4 2 1 4 4211
experimental period. This indicates that sulfuric acid was also
produced from the oxidation of hydrogen sulfide. This was
confirmed by analysis of condensate water collected from
the air circulation system, which was found to contain
7.4% w/v (�0.1%) sulfuric acid. The pH value of this solution
should theoretically be 0.1 (Nordstrom et al., 2000). However,
pH measurements on the plastic pipe surfaces using indicator
strips gave slightly higher values between 0.2 and 0.4.
The investigation of hydrogen sulfide loss from absorption
by the wastewater in the plastic pipe reactors showed that this
process was only of minor importance for the overall removal
of hydrogen sulfide gas. When the wastewater was replaced
by a zinc acetate solution, less than 10% of the injected
amount of hydrogen sulfide gas was removed by air–water
mass transfer. The KL value was accordingly determined at
0.045 m d�1 (�0.005 m d�1) for the HDPE reactor and
0.053 m d�1 (�0.003 m d�1) for the PVC reactor. A similar inves-
tigation was omitted for the concrete pipe reactors because
the absorption process was negligible compared to oxidation
on the surface of these reactors (Vollertsen et al., 2008).
3.2. Kinetics of hydrogen sulfide oxidation on plasticand concrete pipes
After the run-in period, the rate of hydrogen sulfide oxidation
had reached a constant level in each reactor and experiments
were conducted to compare the rate of hydrogen sulfide
oxidation on the different pipe surfaces. The experiments
showed that the kinetics of hydrogen sulfide oxidation was
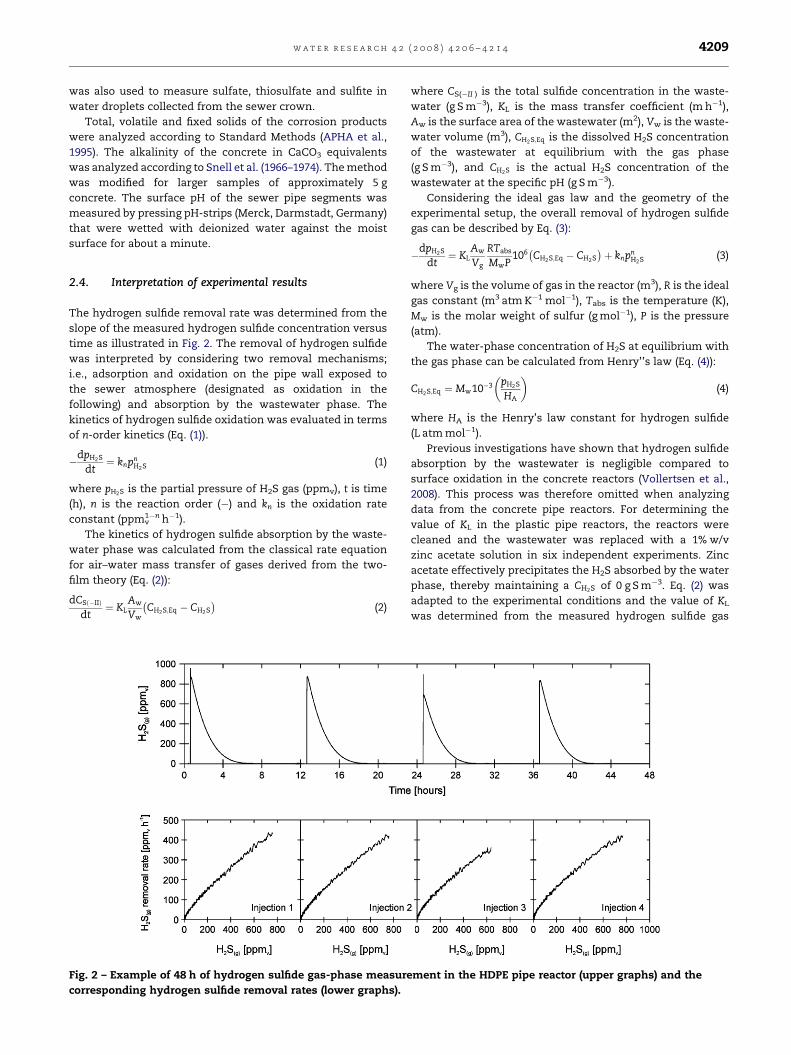
highly dependent on the pipe material. Overall, the reaction
was approximately two orders of magnitude slower on the
plastic pipe surfaces compared to the concrete pipe surfaces
(Fig. 4). The hydrogen sulfide oxidation rates on the PVC and
HDPE pipe surfaces were not significantly different.
The observed hydrogen sulfide oxidation rates for the
concrete pipe reactors are comparable to those reported for
submerged sewer biofilms exposed to sulfide concentrations
up to 5 g S m�3 (Nielsen et al., 2005). To the authors’ knowl-
edge, no previous studies have investigated the kinetics of
adsorption and oxidation of hydrogen sulfide gas on plastic
sewer pipe surfaces. The lower hydrogen sulfide oxidation
rates of the plastic pipes support the explanation that the
pH can become inhibitory for the sulfide oxidizing bacteria,
thereby reducing the rate of sulfide oxidation. The minimum
pH at which sulfide oxidizing bacteria isolated from corroding
Fig. 4 – Box-plot of the hydrogen sulfide oxidation rates of
the concrete, PVC and HDPE pipe reactors after 16 months
of operation. Area-specific oxidation rates at 10 ppmv H2S(g)
(r10), 100 ppmv H2S(g) (r100) and 1000 ppmv H2S(g) (r1000) are
shown. All data are temperature corrected to 15 8C.
concrete sewers are able to grow is around 0.5 (Islander et al.,
1991). This is consistent with pH values measured on the
plastic pipe surfaces. Another important aspect may be
the difference of the surface area of the plastic pipes and the
corroded concrete pipes.
The reaction order with respect to hydrogen sulfide gas
concentration (n) was of the same magnitude for both the
concrete and the plastic pipe reactors. The median values
(�standard deviation) of n were determined at 0.54 (�0.10)
and 0.61 (�0.13) for the concrete and plastic pipe reactors,
respectively. The reaction order does not indicate whether
the process is chemical or biological; e.g., for oxidation of
dissolved sulfide in both active and sterilized cell suspensions,
the reaction order with respect to sulfide is reported in the
range of 0.6–0.8 (Buisman et al., 1990; Nielsen et al., 2003).
The rate constant (kn) was determined at 226.4
(�186.4) ppm1�0.54 h�1 for the concrete pipe reactors and 9.6
(�10.2) ppm1�0.61 h�1 for the plastic pipe reactors. Thus, the
standard deviation was of the same magnitude as the median
value for both reactor types.
For determining the kinetics of hydrogen sulfide oxidation,
the concentration of dissolved H2S in the wastewater (Eq. (3))
was assumed to be zero. This is a fair approximation as the
wastewater pH was generally above 8.0 where more than
90% of the dissolved sulfide is present as HS� ion, which
cannot be transported across the air–water interface. In addi-
tion, dissolved sulfide was constantly removed by oxidation in
the water phase, which is a fast process compared with the
air–water mass transfer of hydrogen sulfide (Nielsen et al.,
2006). This assumption was supported by regular measure-
ments of the total sulfide concentration of the wastewater,
which was always below 1 g S m�3.
The results clearly illustrate that the pipe material has
a marked effect on how much hydrogen sulfide can poten-
tially be removed by adsorption and subsequent oxidation
on sewer surfaces. This will affect the potential build-up of
hydrogen sulfide gas in the sewer atmosphere as well as the
downstream transport of hydrogen sulfide gas.
3.3. Effect of pipe surface characteristics
For investigating the effect of disturbing the pipe surface, the
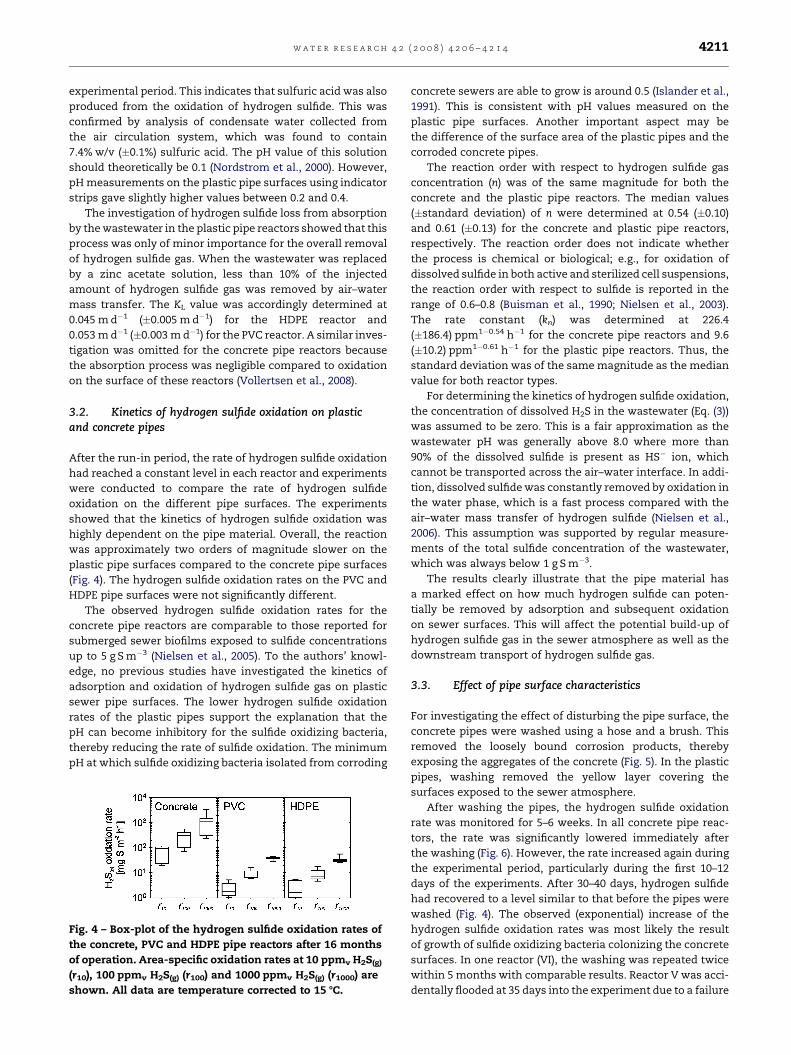
concrete pipes were washed using a hose and a brush. This
removed the loosely bound corrosion products, thereby
exposing the aggregates of the concrete (Fig. 5). In the plastic
pipes, washing removed the yellow layer covering the
surfaces exposed to the sewer atmosphere.
After washing the pipes, the hydrogen sulfide oxidation
rate was monitored for 5–6 weeks. In all concrete pipe reac-
tors, the rate was significantly lowered immediately after
the washing (Fig. 6). However, the rate increased again during
the experimental period, particularly during the first 10–12
days of the experiments. After 30–40 days, hydrogen sulfide
had recovered to a level similar to that before the pipes were
washed (Fig. 4). The observed (exponential) increase of the
hydrogen sulfide oxidation rates was most likely the result
of growth of sulfide oxidizing bacteria colonizing the concrete
surfaces. In one reactor (VI), the washing was repeated twice
within 5 months with comparable results. Reactor V was acci-
dentally flooded at 35 days into the experiment due to a failure
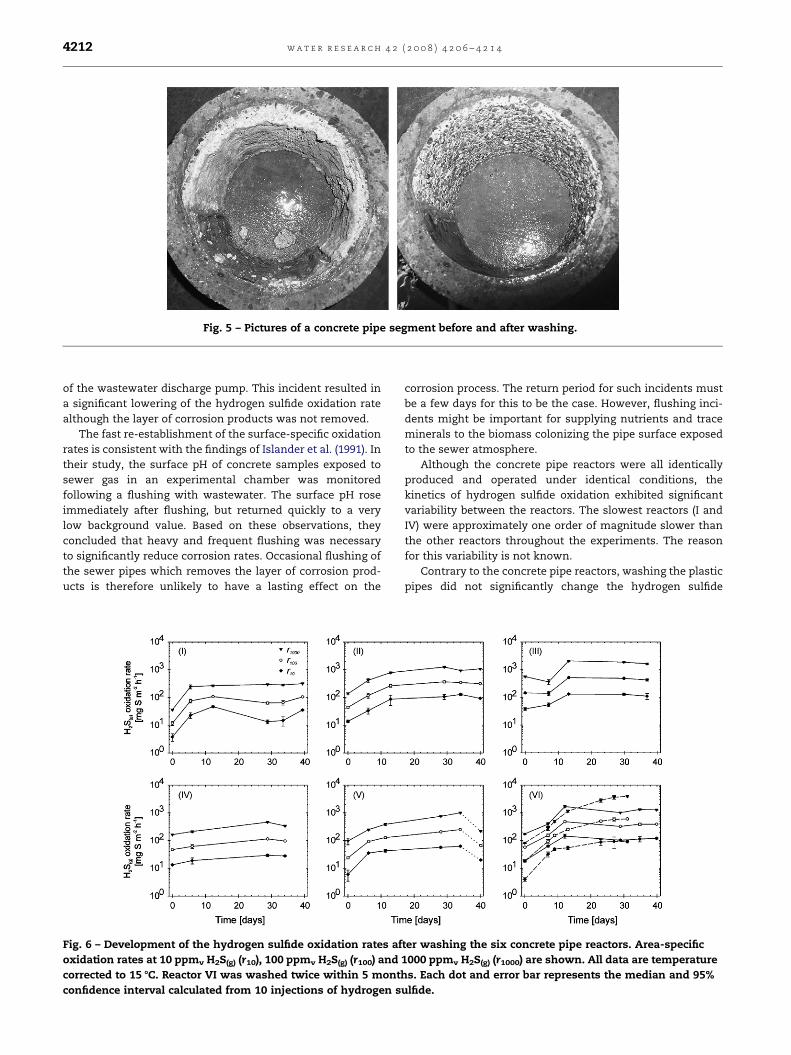
Fig. 5 – Pictures of a concrete pipe segment before and after washing.
w a t e r r e s e a r c h 4 2 ( 2 0 0 8 ) 4 2 0 6 – 4 2 1 44212
of the wastewater discharge pump. This incident resulted in
a significant lowering of the hydrogen sulfide oxidation rate
although the layer of corrosion products was not removed.
The fast re-establishment of the surface-specific oxidation
rates is consistent with the findings of Islander et al. (1991). In
their study, the surface pH of concrete samples exposed to
sewer gas in an experimental chamber was monitored
following a flushing with wastewater. The surface pH rose
immediately after flushing, but returned quickly to a very
low background value. Based on these observations, they
concluded that heavy and frequent flushing was necessary
to significantly reduce corrosion rates. Occasional flushing of
the sewer pipes which removes the layer of corrosion prod-
ucts is therefore unlikely to have a lasting effect on the
Fig. 6 – Development of the hydrogen sulfide oxidation rates af
oxidation rates at 10 ppmv H2S(g) (r10), 100 ppmv H2S(g) (r100) and
corrected to 15 8C. Reactor VI was washed twice within 5 mont
confidence interval calculated from 10 injections of hydrogen s
corrosion process. The return period for such incidents must
be a few days for this to be the case. However, flushing inci-
dents might be important for supplying nutrients and trace
minerals to the biomass colonizing the pipe surface exposed
to the sewer atmosphere.
Although the concrete pipe reactors were all identically
produced and operated under identical conditions, the
kinetics of hydrogen sulfide oxidation exhibited significant
variability between the reactors. The slowest reactors (I and
IV) were approximately one order of magnitude slower than
the other reactors throughout the experiments. The reason
for this variability is not known.
Contrary to the concrete pipe reactors, washing the plastic
pipes did not significantly change the hydrogen sulfide
ter washing the six concrete pipe reactors. Area-specific
1000 ppmv H2S(g) (r1000) are shown. All data are temperature
hs. Each dot and error bar represents the median and 95%
ulfide.
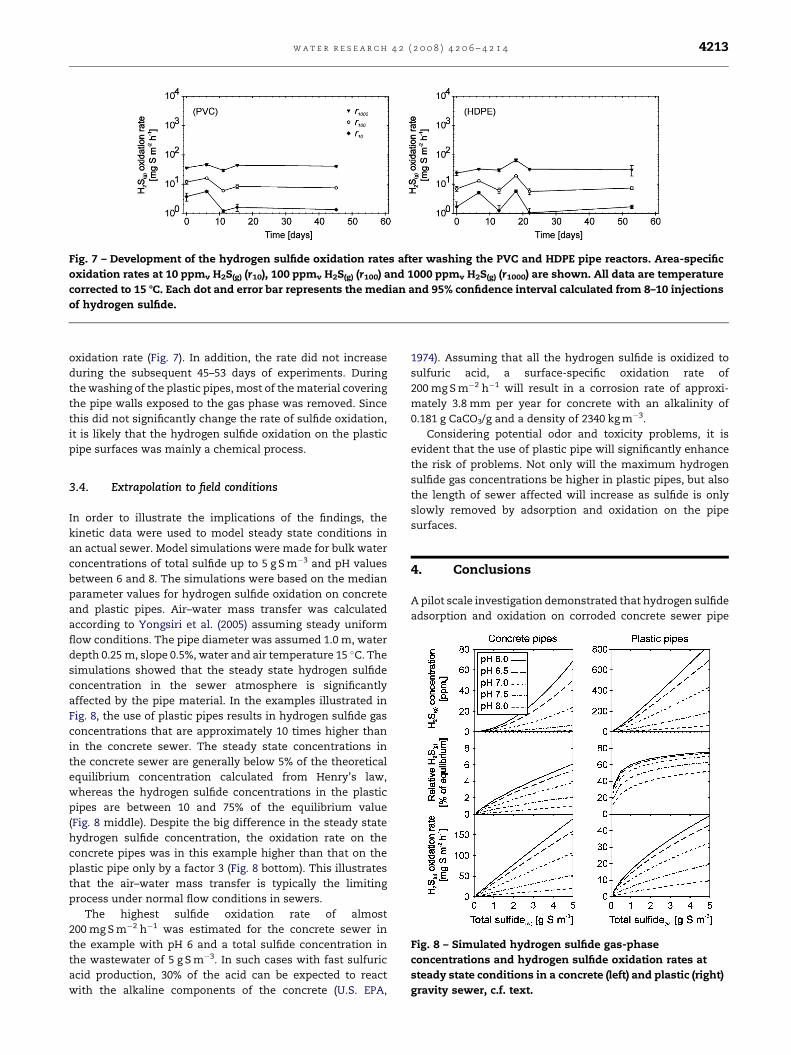
Fig. 7 – Development of the hydrogen sulfide oxidation rates after washing the PVC and HDPE pipe reactors. Area-specific
oxidation rates at 10 ppmv H2S(g) (r10), 100 ppmv H2S(g) (r100) and 1000 ppmv H2S(g) (r1000) are shown. All data are temperature
corrected to 15 8C. Each dot and error bar represents the median and 95% confidence interval calculated from 8–10 injections
of hydrogen sulfide.
w a t e r r e s e a r c h 4 2 ( 2 0 0 8 ) 4 2 0 6 – 4 2 1 4 4213
oxidation rate (Fig. 7). In addition, the rate did not increase
during the subsequent 45–53 days of experiments. During
the washing of the plastic pipes, most of the material covering
the pipe walls exposed to the gas phase was removed. Since
this did not significantly change the rate of sulfide oxidation,
it is likely that the hydrogen sulfide oxidation on the plastic
pipe surfaces was mainly a chemical process.
Fig. 8 – Simulated hydrogen sulfide gas-phase
concentrations and hydrogen sulfide oxidation rates at
steady state conditions in a concrete (left) and plastic (right)
gravity sewer, c.f. text.
3.4. Extrapolation to field conditions
In order to illustrate the implications of the findings, the
kinetic data were used to model steady state conditions in
an actual sewer. Model simulations were made for bulk water
concentrations of total sulfide up to 5 g S m�3 and pH values
between 6 and 8. The simulations were based on the median
parameter values for hydrogen sulfide oxidation on concrete
and plastic pipes. Air–water mass transfer was calculated
according to Yongsiri et al. (2005) assuming steady uniform
flow conditions. The pipe diameter was assumed 1.0 m, water
depth 0.25 m, slope 0.5%, water and air temperature 15 �C. The
simulations showed that the steady state hydrogen sulfide
concentration in the sewer atmosphere is significantly
affected by the pipe material. In the examples illustrated in
Fig. 8, the use of plastic pipes results in hydrogen sulfide gas
concentrations that are approximately 10 times higher than
in the concrete sewer. The steady state concentrations in
the concrete sewer are generally below 5% of the theoretical
equilibrium concentration calculated from Henry’s law,
whereas the hydrogen sulfide concentrations in the plastic
pipes are between 10 and 75% of the equilibrium value
(Fig. 8 middle). Despite the big difference in the steady state
hydrogen sulfide concentration, the oxidation rate on the
concrete pipes was in this example higher than that on the
plastic pipe only by a factor 3 (Fig. 8 bottom). This illustrates
that the air–water mass transfer is typically the limiting
process under normal flow conditions in sewers.
The highest sulfide oxidation rate of almost
200 mg S m�2 h�1 was estimated for the concrete sewer in
the example with pH 6 and a total sulfide concentration in
the wastewater of 5 g S m�3. In such cases with fast sulfuric
acid production, 30% of the acid can be expected to react
with the alkaline components of the concrete (U.S. EPA,
1974). Assuming that all the hydrogen sulfide is oxidized to
sulfuric acid, a surface-specific oxidation rate of
200 mg S m�2 h�1 will result in a corrosion rate of approxi-
mately 3.8 mm per year for concrete with an alkalinity of
0.181 g CaCO3/g and a density of 2340 kg m�3.
Considering potential odor and toxicity problems, it is
evident that the use of plastic pipe will significantly enhance
the risk of problems. Not only will the maximum hydrogen
sulfide gas concentrations be higher in plastic pipes, but also
the length of sewer affected will increase as sulfide is only
slowly removed by adsorption and oxidation on the pipe
surfaces.
4. Conclusions
A pilot scale investigation demonstrated that hydrogen sulfide
adsorption and oxidation on corroded concrete sewer pipe

w a t e r r e s e a r c h 4 2 ( 2 0 0 8 ) 4 2 0 6 – 4 2 1 44214
surfaces was approximately two orders of magnitude faster
than on plastic pipe surfaces. Model simulations based on
kinetic data from the experiments indicated that hydrogen
sulfide gas concentrations in concrete sewers – under steady
uniform flow conditions – would amount to a few percent of
the equilibrium concentration calculated from Henry’s law.
In plastic pipe sewers, the slower surface reaction results in
significantly higher hydrogen sulfide gas concentrations and
thus an increased odor potential.
Removal of the layer of reaction (corrosion) products
covering the pipe surfaces was found to reduce the rate of
hydrogen sulfide oxidation in the concrete pipes significantly,
but had no observable effect in the plastic (PVC and HDPE)
pipes. The high rate of sulfide oxidation in the concrete pipes
was restored within 10–20 days. Thus, such events must
happen frequently in order to have a permanent effect on
corrosion of concrete sewers.
r e f e r e n c e s
Apgar, D., Witherspoon, J., 2007. Minimizationof OdorsandCorrosionin Collection Systems, Phase I. Report No. 04-CTS-1. WaterEnvironment Research Foundation (WERF), Alexandria, VA, USA.
APHA, AWWA, WEF, 1995. Standard Methods for the Examinationof Water and Wastewater, 19th ed., Washington, DC, USA.
Buisman, C., IJspeert, P., Janssen, A., Lettinga, G., 1990. Kinetics ofchemical and biological sulphide oxidation in aqueoussolutions. Water Research 24 (5), 667–671.
Davis, J.L., Nica, D., Shields, K., Roberts, D.J., 1998. Analysis ofconcrete from corroded sewer pipe. InternationalBiodeterioration and Biodegradation 42 (1), 75–84.
Hvitved-Jacobsen, T., 2002. Sewer Processes – Microbial andChemical Process Engineering of Sewer Networks. CRC Press,Boca Raton, Florida, USA.
Islander, R.L., Devinny, J.S., Mansfeld, F., Postyn, A., Shih, H., 1991.Microbial ecology of crown corrosion in sewers. Journal ofEnvironmental Engineering 117 (6), 751–770.
Madsen, H.I., Vollertsen, J., Hvitved-Jacobsen, T., 2006. Gas phasetransport in gravity sewers – a methodology for determinationof horizontal gas transport and ventilation. WaterEnvironment Research 78 (11), 2203–2209.
Matos, J.S., Aires, C.M., 1995. Mathematical modelling of sulphidesand hydrogen sulphide gas build-up in the Costa do Estorilsewerage system. Water Science and Technology 31 (7), 255–261.
Mori, T., Koga, M., Hikosaka, Y., Nonaka, T., Mishina, F., Sakai, Y.,Koizumi, J., 1991. Microbial corrosion of concrete pipes, H2Sproduction from sediments and determination of corrosionrate. Water Science and Technology 23 (7–9), 1275–1282.
Nielsen, A.H., Vollertsen, J., Hvitved-Jacobsen, T., 2003.Determination of kinetics and stoichiometry of chemicalsulfide oxidation in wastewater of sewer networks.Environmental Science and Technology 37 (17), 3853–3858.
Nielsen, A.H., Hvitved-Jacobsen, T., Vollertsen, J., 2005. Kineticsand stoichiometry of sulfide oxidation by sewer biofilms.Water Research 39 (17), 4119–4125.
Nielsen, A.H., Hvitved-Jacobsen, T., Vollertsen, J., 2006. Recentfindings on sinks for sulfide in gravity sewer networks. WaterScience and Technology 54 (6–7), 127–134.
Nielsen, A.H., Vollertsen, J., Jensen, H.S., Madsen, H.I., Hvitved-Jacobsen, T., 2008. Aerobic and anaerobic transformations ofsulfide in a sewer system – field study and model simulations.Water Environment Research 80 (1), 16–25.
Nordstrom, D.K., Alpers, C.N., Ptacek, C.J., Blowes, D.W., 2000.Negative pH and extremely acidic mine waters from IronMountain, California. Environmental Science and Technology34 (2), 254–258.
Sand, W., 1997. Microbial mechanisms of deterioration ofinorganic substrates – a general mechanistic overview.International Biodeterioration and Biodegradation 40 (2–4),183–190.
Snell, F.D., Hilton, C.L., Ettre, L.S., 1966–1974. Encyclopedia ofIndustrial Chemical Analysis, vol. 15. Interscience PublishersDivision, John Wiley and Sons, New York, p. 230.
Stewart, R., 2005. Plastic pipe – corrosion resistance, ease ofinstallation stimulate demand for plastic pipe. PlasticsEngineering 61 (1), 14–21.
Thistlethwayte, D.K.B., Goleb, E.E., 1972. The composition ofsewer air. Advances in water pollution research. Proceedingsof the Sixth International Conference on Water PollutionResearch. June 1972, Jerusalem, Israel. Pergamon Press,Oxford, pp. 281-289.
U.S. EPA (United States Environmental Protection Agency), 1974.Sulfide Control in Sanitary Sewerage Systems. EPA/625/1-74-005. Washington, DC, USA.
Vincke, E., Monteny, J., Beeldens, A., de Belie, N., Taerwe, L., vanGemert, D., Verstraete, W.H., 2000. Recent developments inresearch on biogenic sulfuric acid attack of concrete. In:Lens, P., Pol, L.H. (Eds.), Environmental Technologies to TreatSulfur Pollution. IWA Publishing, London, UK.
Vollertsen, J., Nielsen, A.H., Jensen, H.S., Wium-Andersen, T.,Hvitved-Jacobsen, T., 2008. Corrosion of concrete sewers – thekinetics of hydrogen sulfide oxidation. Science of the TotalEnvironment 394 (1), 162–170.
Yongsiri, C., Vollertsen, J., Hvitved-Jacobsen, T., 2005. Influence ofwastewater constituents on hydrogen sulfide emission insewer networks. Journal of Environmental Engineering 131(12), 1676–1683.
Zhang, L., De Schryver, P., De Gusseme, B., De Muynck, W.,Boon, N., Verstraete, W., 2008. Chemical and biologicaltechnologies for hydrogen sulfide emission control in sewersystems: a review. Water Research 42 (1–2), 1–12.