influence of miraa cultivation on changing agricultural
TRANSCRIPT

INFLUENCE OF MIRAA CULTIVATION ON CHANGING
AGRICULTURAL LAND USE PATTERNS IN MBITA AND KIANJIRU
LOCATIONS, EMBU COUNTY
BY
MUGENDI G. M.
B.A (HONS)
A THESIS SUBMITTED IN PARTIAL FULFILLMENT OF THE REQUIREMENT FOR
THE DEGREE OF MASTER OF ARTS IN PLANNING, DEPARTMENT OF URBAN AND
REGIONAL PLANNING, UNIVERSITY OF NAIROBI
November, 2017

i
DECLARATION
This thesis is my original work and has never been presented in this or any other University for
an award of a degree.
Signed:…………………………………………………………………………………………
Mugendi Geoffrey Moses
Dated: ………………………………………………………………………………………….
This thesis has been submitted for consideration with our approval as the supervisors
Signed:………………………………………………………………………………………….
Mr. Charles Osengo
Dated:…………………………………………………………………………………………..
Signed:………………………………………………………………………………………….
Dr. Karanja Mwangi
Dated:…………………………………………………………………………………………..

ii
DEDICATION
This MA (Planning) thesis project report is dedicated to the late Dennis Macharia Nthiga, (05th
January 1991 to 14th May 2014). I am proud of you my doted nephew. You fought bravely to the
very end. You wore that broad smile in spite of the suffering caused by Leukemia. Rest in peace
Mash till we meet again; in our hearts you live on. Dennis would have graduated from Kenyatta
University in December 2014 with a bachelor of Environmental Planning and Management
Degree.

iii
ACKNOWLEDGEMENT
I acknowledge my supervisors Mr. Charles Osengo and Dr. Karanja Mwangi who guided me and
offered invaluable suggestions and motivation that enabled me to complete this work; Dr.
Samwuel Obiero, Dr. Fridah Mugo, Dr. Herbert Musoga and Plan. Titus Musungu for their
helpful insights. I equally acknowledge the Principal Secretary, Ministry of Lands and Physical
Planning for giving me time off to undertake this course and the Director Physical Planning
Department and staff for their support throughout the time of this study.My student colleagues
who walked every step of the journey with me will ever be remembered for their constructive
criticisms during Theses seminar presentations. Lastly, I would like to thank my wife Waithira
Mugendi, son Mutaari Mugendi and daughter Wokabi Mugendi, and friends for their moral
support and encouragement. Their sacrifice to hold the family together while I was away is a
constant reminder of the useful role of a family. Thanks for the sacrifice.

iv
TABLE OF CONTENTS
DECLARATION ........................................................................................................................ i
DEDICATION ........................................................................................................................... ii
ACKNOWLEDGEMENT ....................................................................................................... iii
TABLE OF CONTENTS .......................................................................................................... iv
LIST OF FIGURES .................................................................................................................. xi
LIST OF TABLES ................................................................................................................. xiii
LIST OF PLATES .................................................................................................................. xiv
ACRONYMS .......................................................................................................................... xvi
ABSTRACT ........................................................................................................................... xvii
CHAPTER ONE: INTRODUCTION ........................................................................................ 1
1.0 Introduction ................................................................................................................. 1
1.1 Statement of Research Problem .................................................................................. 2
1.2 Research Questions ..................................................................................................... 3
1.3 Overall Objective ........................................................................................................ 3
1.4 Specific Objectives ...................................................................................................... 3
1.5 Assumptions of the Study ........................................................................................... 3
1.6 Justification ................................................................................................................. 4
1.7 Significance of the study ............................................................................................. 4
1.8 Scope of the Study....................................................................................................... 5
1.8.1 Theoretical Scope................................................................................................. 5
1.8.2 Geographical Scope ............................................................................................. 6
1.8.3 Structuring Elements of the Study Area .............................................................. 6
1.9 Study Limitations ........................................................................................................ 6
1.10 Operational Definition of Key Terms ......................................................................... 7
1.11 Organization of the Study Report................................................................................ 8

v
CHAPTER TWO: LITERATURE REVIEW ............................................................................ 9
2.0 Introduction ................................................................................................................. 9
2.1 Land-Use and Land-Cover Change ............................................................................. 9
2.2 Nature of Land-Use Change ...................................................................................... 14
2.2.1 Land Cover Conversion Analysis ...................................................................... 15
2.2.2 Land Cover- Modification Analysis .................................................................. 15
2.3 Triggers and Impacts of Land-Use Change............................................................... 15
2.3.1 Natural Triggers and their Implications ............................................................. 15
2.3.2 Direct Human Activity Triggers and Impacts .................................................... 16
2.3.3 Analysis of Triggers and Impacts of Land-Use Change .................................... 20
2.4 Models of Land-Use Change..................................................................................... 22
2.4.1 Empirical Models ............................................................................................... 22
2.4.2 Stochastic Models .............................................................................................. 23
2.4.3 Optimization Models ......................................................................................... 23
2.4.4 Dynamic Simulation Models ............................................................................. 23
2.4.5 Integrated Modeling Approaches ....................................................................... 24
2.5 Classical Models of Land Use ................................................................................... 24
2.6 Land Area of Kenya .................................................................................................. 25
2.7 State of Land-Use in Kenya ...................................................................................... 27
2.8 Land Laws in Kenya ................................................................................................. 27
2.8.1 Pre- Independence Period .................................................................................. 27
2.8.2 Post-Independence Period .................................................................................. 29
2.9 The Constitution of Kenya, 2010 .............................................................................. 29
2.9.1 The Bill of Rights............................................................................................... 30
2.9.2 Principles of Land Policy ................................................................................... 30
2.9.3 Regulation of Land Use ..................................................................................... 30
2.9.4 Minimum and Maximum Land Holdings Acreage ............................................ 30
2.9.5 Constitutional Interpretation of Land................................................................. 30

vi
2.9.6 Role of Government in Land Use Planning ....................................................... 31
2.10 The Physical Planning Act, 1996 .............................................................................. 31
2.11 The Land Act, 2012 ................................................................................................... 32
2.12 Urban Areas and Cities Act, 2011 ............................................................................. 32
2.13 The County Government Act, 2012 .......................................................................... 33
2.14 The Environment Management and Co-ordination Act, 1999 .................................. 33
2.15 The National Land Commission Act, 2012 ............................................................... 33
2.16 The Water Act, 2002 ................................................................................................. 33
2.17 Crop Production and Livestock Act, Chapter 321 .................................................... 34
2.18 Land-Use Policies and Strategies .............................................................................. 34
2.18.1 The Kenya Vision 2030 ..................................................................................... 34
2.18.2 National Land Policy ......................................................................................... 35
2.18.3 National Policy for the Sustainable Development of Northern Kenya and other
Arid Lands ........................................................................................................................ 35
2.18.4 Food and Nutrition Policy .................................................................................. 35
2.18.5 Agricultural Sector Development Strategy 2010-2020 ...................................... 35
2.19 The Agricultural Policy since Independence ............................................................ 36
2.20 Land-Use Changes in Kenya ..................................................................................... 39
2.20.1 Extensification of Land-Uses ............................................................................. 39
2.20.2 Intensification of Land-Uses .............................................................................. 40
2.20.3 Globalization and Land Use Change in Kenya .................................................. 41
2.21 The Future Trend of Land-Use Change in Kenya ..................................................... 41
2.22 Influence of Macro and Micro-Economic Policies on Management of Land ........... 42
2.23 Theoretical Framework of Land-Use ........................................................................ 44
2.24 Conceptual Framework ............................................................................................. 45
2.26 Conclusion ................................................................................................................. 47
CHAPTER THREE: METHODOLOGY ................................................................................ 48
3.0 Introduction ............................................................................................................... 48
vii
3.1 Research Design ........................................................................................................ 48
3.2 Key Target Population .............................................................................................. 48
3.3 Sampling Plan ........................................................................................................... 48
3.3.1 The Sample Frame ............................................................................................. 49
3.3.2 Sampling Techniques ......................................................................................... 51
3.3.3 Sample Size ........................................................................................................ 52
3.3.4 Sampling Procedure ........................................................................................... 53
3.4 Types of Data and Sources ........................................................................................ 53
3.4.1 Secondary data ................................................................................................... 53
3.4.2 Primary Data ...................................................................................................... 54
3.5 Methods of Data collection ....................................................................................... 54
3.5.1 Primary data collection ...................................................................................... 54
3.5.2 Instruments of Data Collection .......................................................................... 55
3.5.3 Pilot Testing and Administration of Household Questionnaire ......................... 55
3.5.4 Cleaning of Collected Data ................................................................................ 55
3.6 Organization of Data ................................................................................................. 55
3.6.1 Coding ................................................................................................................ 55
3.7 Data Analysis ............................................................................................................ 56
3.8 Data Presentation....................................................................................................... 56
3.9 Ethical Requirements and Research Approval .......................................................... 56
3.10 Conclusion ................................................................................................................. 56
CHAPTER FOUR: BACKGROUND OF MIRAA CULTIVATION ..................................... 59
4.0 Introduction ............................................................................................................... 59
4.1 Global Production of Miraa....................................................................................... 59
4.2 Local Production of Miraa ........................................................................................ 59
4.2.1 Onset of Miraa Production in Mbeere South Sub-County ................................. 60
4.2.2 Agricultural Production in the Study Area Prior to Miraa Production .............. 62

viii
4.3 The Economic Value of Miraa .................................................................................. 63
4.3.1 The Social-Cultural Value of Miraa .................................................................. 64
4.3.2 Legal and Policy Framework for Miraa Production .......................................... 65
4.4 Value Chains of Miraa, Cereals and Cotton .............................................................. 66
4.5 Implications of Bio-Fuel Crops Production in Northern Tanzania ........................... 70
4.5.1 Positive Contribution ......................................................................................... 71
4.5.2 Negative Contribution ........................................................................................ 71
4.5.3 Lessons Learnt ................................................................................................... 72
4.6 Conclusion ................................................................................................................. 73
CHAPTER FIVE: THE STUDY AREA ................................................................................. 74
5.0 Introduction ............................................................................................................... 74
5.1 Location Context ....................................................................................................... 74
5.2 Physiographical Context ........................................................................................... 78
5.3 Administrative and Political Units ............................................................................ 85
5.4 Population and Demography ..................................................................................... 86
5.4.1 Settlement Patterns............................................................................................. 88
5.5 Social System and Culture ........................................................................................ 88
5.6 Indigenous and Modern Economies .......................................................................... 88
5.6.1 Indigenous Economy ......................................................................................... 89
5.6.2 Modern Economy............................................................................................... 89
5.7 Land Tenure .............................................................................................................. 90
5.8 Existing Land use Patterns ........................................................................................ 91
5.8.1 General Land-use Pattern ................................................................................... 94
5.8.2 Transport Network ............................................................................................. 94
5.8.3 Communication Services ................................................................................... 95
5.8.4 Other Services .................................................................................................... 96
5.9 Land Sizes ................................................................................................................. 96

ix
5.10 Conclusion ................................................................................................................. 97
CHAPTER SIX: FINDINGS ................................................................................................... 98
6.0 Introduction ............................................................................................................... 98
6.1 Emerging Crop Types, Land Uses and Settlement Patterns...................................... 98
6.1.1 Emerging Crop Types ........................................................................................ 98
6.1.2 Extensification of Land-Use .............................................................................. 98
6.1.3 Intesification of Production.............................................................................. 103
6.1.4 Expansion and Mushrooming of Trading Centres ........................................... 110
6.1.5 Changes in Human Settlement Patterns ........................................................... 114
6.2 Factors Influencing Increased Cultivation of Miraa in the Study Area .................. 115
6.2.1 Geo- Physical factors ....................................................................................... 115
6.2.2 Socio-Economic Factors .................................................................................. 117
6.2.3 Demographic Factors ....................................................................................... 121
6.2.4 Policy Factors................................................................................................... 127
6.3 Emerging Land Use Patterns in the Study Area ...................................................... 130
6.3.1 Individual Farms .............................................................................................. 131
6.3.2 Road Junctions ................................................................................................. 133
6.3.3 Village Markets cum Miraa Collection Points................................................. 134
6.3.4 Central Markets ................................................................................................ 136
6.3.5 Transport Centres ............................................................................................. 138
6.4 Implications of the Changing Land-Use Patterns on Development ........................ 142
6.4.1 Rapid Conversion and Subdivision of Land .................................................... 143
6.4.2 Increased Utilization of Land and Natural Resources ..................................... 143
6.4.3 Increased Uptake of Technology and Innovation ............................................ 144
6.4.4 Revitalization of Trading Centres .................................................................... 145
6.4.5 Increased Land-Use Conflicts .......................................................................... 146
6.4.6 Skewed Physical Development ........................................................................ 147
6.4.7 Abandoning of Traditional Forms of Production............................................. 148

x
6.4.8 Land Degradation............................................................................................. 149
6.5 Conclusion ............................................................................................................... 149
CHAPTER SEVEN: SYNTHESIS OF FINDINGS, CONCLUSIONS AND
RECOMMENDATIONS ....................................................................................................... 150
7.0 Introduction ............................................................................................................. 150
7.1 Land-use Development Options .............................................................................. 150
7.1.1 Food Crop Production ...................................................................................... 150
7.1.2 Livestock Production ....................................................................................... 151
7.1.3 Cash Crop Production ...................................................................................... 151
7.1.4 Urban Development ......................................................................................... 152
7.1.5 Environment Conservation .............................................................................. 152
7.2 Land –use Changes.................................................................................................. 153
7.2.1 Changes in Agricultural Production................................................................. 153
7.3 Main Factors of Miraa Production in the Study Area ............................................. 153
7.3.1 Implications of Miraa Production on Land-uses .............................................. 154
7.4 Emerging Land-Use Patterns .................................................................................. 154
7.5 Conclusion ............................................................................................................... 157
7.6 Recommendations ................................................................................................... 157
7.6.1 Regulating Land Uses and Settlement Patterns ............................................... 157
7.6.2 Establishing a Framework for Agriculture Development ................................ 157
7.6.3 Regulating Commercial Crop Production in the Country................................ 160
7.6.4 Institutional Planning for Rural Development ................................................. 162
7.7 Areas for Further Research ..................................................................................... 164
REFERENCES ...................................................................................................................... 165
APPENDICES ....................................................................................................................... 169
Appendix I: Household Questionnaire ............................................................................... 169
Appendix II: Questionnaire for Traders ............................................................................. 179
Appendix III: Checklist for Key Informants ...................................................................... 182

xi
Appendix IV: Research Permit .......................................................................................... 183
LIST OF FIGURES
Figure 1: Anthropogenic Transformation of the Terrestrial Biosphere ................................... 11
Figure 2: Land Use Changes on the Eastern Slopes of Mt Kenya ........................................... 13
Figure 3: Driving Force-Pressure-State-Impact-Response Framework ................................... 21
Figure 4: Policy Linkages in Land Management and Use Decisions by Households ............. 43
Figure 5: Continuum of Human Settlements ........................................................................... 44
Figure 6: Conceptual Framework ............................................................................................ 46
Figure 7: Mbita and Kirima Sub-locations .............................................................................. 50
Figure 8: Miraa Producing Areas in the Country..................................................................... 61
Figure 9: Value Chain of Miraa Production ............................................................................ 67
Figure 10: Value Chain of Cotton Production ......................................................................... 68
Figure 11: Value Chain of Cereals’ Production ....................................................................... 69
Figure 12: Embu County in the National Context ................................................................... 75
Figure 13: Mbeere South Sub-County in the Regional Context .............................................. 76
Figure 14: Study Area in the Local Context ............................................................................ 77
Figure 15: Relief of the Study Area ......................................................................................... 79
Figure 16: Relief the Upland Parts of the Study Area ............................................................. 80
Figure 17: Agro-Ecological Classification of Embu County ................................................... 82
Figure 18: Soil Types in Embu County ................................................................................... 84
Figure 19: Political Units of Mbeere South Sub-county .......................................................... 86
Figure 20: Land-use Change around Kiritiri Between 1961 and 2001 .................................... 91
Figure 21: Level of Agriculture Production (2003-2013)...................................................... 103
Figure 22: Land Cover along Thiba River in 2005 ................................................................ 104
Figure 23: Changes in Land Cover in 2011 ........................................................................... 104
Figure 24: Source of Water for Irrigating Miraa Farms ........................................................ 106

xii
Figure 25: Trend of Land-Use Practices in the Last 10 Years ............................................... 107
Figure 26: Land Sub-Divisions Trend in the Study Area 2003-2013 .................................... 110
Figure 27: The Trend of Development of Plots 2011- 2014 .................................................. 111
Figure 28: Movement of Miraa from Mbeere South Sub-County ......................................... 116
Figure 29: Average Household Income ................................................................................. 117
Figure 30: Driving Factors of Miraa Production among Producers ...................................... 118
Figure 31: Driving Factors of Miraa Production among Traders .......................................... 119
Figure 32: Age of Miraa traders............................................................................................. 122
Figure 33: Age of Miraa Farmers .......................................................................................... 123
Figure 34: Education Level of Miraa Producers .................................................................... 124
Figure 35: Education Levels of Miraa Traders ...................................................................... 124
Figure 36: Main Occupation of Miraa Farmers ..................................................................... 125
Figure 37: Alternate Occupation of Miraa Farmers ............................................................... 125
Figure 38: Main Occupation of Traders ................................................................................. 126
Figure 39: Alternate Occupation of Miraa Traders ................................................................ 126
Figure 40: Measures for Enhancing Miraa Production .......................................................... 128
Figure 41: Causal - Effect of Miraa Production..................................................................... 129
Figure 42: Spatial Flow of miraa trade .................................................................................. 130
Figure 43: Miraa Integration Options at the Farm Level ....................................................... 131
Figure 44: Spatial Flow of Miraa in the Study Area .............................................................. 140
Figure 45: Space Utilization in Muraru Market ..................................................................... 141
Figure 46: Complementary Activities of Miraa Trade .......................................................... 146
Figure 47: Nature of land-use conflicts associated with miraa production ........................... 147
Figure 48: Former Use of the Land Currently Under Miraa .................................................. 148

xiii
LIST OF TABLES
Table 4: Land-Use and Land Quality Indicators ...................................................................... 21
Table 1: Categories of Land-Use Change Models ................................................................... 24
Table 2: National Land Potential Classification ...................................................................... 26
Table 3: Agriculture Policy Periods since Independence ........................................................ 37
Table 5: Basis for Selecting Sample Villages .......................................................................... 51
Table 6: Data Needs, Sources, Collection Methods and Analysis ........................................... 57
Table 7: Administrative Units of Mbeere Region .................................................................... 85
Table 8: Population Characteristics of Mbeere Region ........................................................... 87
Table 9: Total Population and Demographic Factors of Mbeere Region ................................ 87
Table 10: Categories of Agricultural Land in Mbeere Region ................................................ 89
Table 11: Land-uses in Mbeere Region ................................................................................... 94
Table 12: Condition of Roads in Mbeere Region .................................................................... 94
Table 13: Exploitation of Water Resources in Mbeere Region ............................................. 105
Table 14: Area under Small Scale Irrigation Schemes in Mbeere Region 1996 - 2001 ........ 105
Table 15: County Council plots in Mbita and Kirima Sub-locations (2003-2014) ............... 111
Table 16: Market Prices for Major Commodities in June 2005 ............................................. 120
Table 17: Price of Select Commodities in 2014 .................................................................... 121
Table 18: Gender of Miraa Traders ....................................................................................... 122
Table 19: Gender of Miraa Traders ....................................................................................... 122
Table 20: Summary of Land-Use Changes, Indicators Issues and Possible Interventions .... 155

xiv
LIST OF PLATES
Plate 1: Dilapidated Sections of an Access Road in Kamwimbi village ................................. 95
Plate 2: A Cow Tethered by a Road Side within the Study Area ............................................ 99
Plate 3: A Dry Dam at the Foot of Kiambita Hill .................................................................. 101
Plate 4: Cultivated River Banks of Itabua Stream ................................................................. 101
Plate 5: Ongoing Cultivation on Kiambita hill ...................................................................... 102
Plate 6: A Channel to Direct Storm Water from the Main Road into a Farm ........................ 108
Plate 7: A Water Pan in Mathigameru Village ...................................................................... 108
Plate 8: Mutugu Shopping Centre 2003- 2005 ...................................................................... 112
Plate 9: Kamboya Shopping Centre 2005-2010..................................................................... 112
Plate 10: New ‘Amka Jubilee” Shopping Centre in Kamwimbi Village, 2014 ..................... 113
Plate 11: Mutugu Shopping Centre, 2016 .............................................................................. 113
Plate 12: A Resting Place at a Road Junction in Kamunyange Village ................................. 134
Plate 13: Kamunyange Village Centre in Kirima Sub-Location ........................................... 135
Plate 14: Physical Development of Mutugu Centre in 2009 .................................................. 137
Plate 15: Changes in Physical Development of Mutugu Centre in 2011 ............................... 138
Plate 16: Flurry of Activities in Muraru Market During Miraa Market Session ................... 142
Plate 17: Mixed Physical Development of Mutugu Trading Centre...................................... 144
Plate 18: A Well Tended Miraa Farm .................................................................................... 145

xvi
ACRONYMS
AEZ Agro Ecological Zone
ASAL Arid and Semi-Arid Land
ASL Above Sea Level
BPO Business Process Outsourcing
CSPs County Spatial Development Plans
DFPSIR Driving Force-Pressure-State-Impact-Response
FAO Food and Organization of the United Nations
GDP Gross Domestic Product
HEP Hydro Electric Power
KNBS Kenya National Bureau of Statistics
LUCID Land-use Change, Impacts and Dynamics
LUCC Land-use and Cover Change
LQI Land Quality Indicators
MDG Millennium Development Goals
NACOSTI National Commission for Science, Technology and Innovation
NLuP National Land-use Policy
NERC National Electric Reliability Council
NSP National Spatial Plan
UNEP United Nations Environment Programme
PPP Private, Public Partnership
SAP Structural Adjustment Programme
SRA Strategy for Revitalizing Agriculture
SPSS Statistical Package for Social Sciences
USP Urban Spatial Development Plans

xvii
ABSTRACT
This study focuses on the influence of miraa (Catha edulis) production on land-use patterns in
Mbeere South Sub-County, Embu County. It was borne out of the need to interrogate the
phenomenon of invasive and unregulated land-use practices, particularly agricultural practices
that have far-reaching spatial and socio-economic implications on livelihoods; and seek
mechanisms to safeguard rural areas from negative consequences emanating from the same. The
study endeavored to critically examine and understand the spatial facets of miraa farming in the
study area with a view of providing an integrated and sustainable model for land use in the study
area and in the country at large.
The study area was purposely sampled based on its role as the second largest miraa production
area in the country after Nyambene Hills in Meru County. The study specifically focused on 10
sample villages in Mbita and Kirima Sub-Locations. The study partly involved critical analysis of
theoretical underpinnings informing production of miraa from interrogation of literature and
theories of land use and land cover. The study revealed that miraa production in the study area
has occurred spontaneously and has continued to expand rapidly over the years, tending to
dominate over other forms of production. The production has directly altered the land-use pattern
through extensification and intensification of production and indirectly through multiplicationof
human activities in the region. Further, the production has reconfigured human settlement
patterns. On one hand, there is rapid concentration of population around the emerging
commercial nodes that offer auxiliary services and double as miraa collection centres. On the
other hand, there are scattered settlements around the miraa farms where actual production takes
place. The main drivers of miraa production are its high commercial benefit, high market demand
and the existence of an elaborate trade network.
As part of recommendations, the study proposes efficient land administration, fast tracking land-
use planning universally, from the national to the local level and sectoral planning for agriculture
development including planning for institutional changes so as to fully exploit the value chain of
other agricultural products in the region. The study further proposes the regulation of miraa
production through policy guidelines for provision of alternative sources of livelihoods and
diversification of production.

1
CHAPTER ONE: INTRODUCTION
1.0 Introduction
This chapter is the introductory part of the study and covers the Background to the study,
Statement of the Research Problem, Research Questions, Objectives, Assumptions, Justification
and Significance of the Study. It further covers the Scope and Limitations of the study as well as
the Structure of the Report.
Land is a fundamental factor of production, which has been tightly coupled to economic growth
through much of the course of human history (Richards 1990). Since Stone Age, man has
exploited land and its associated resources for various uses and in varying magnitudes for
survival through provision of shelter, food and clothing. However, land is finite in nature, a factor
that necessitates careful consideration of how it is utilized so as to accommodate various human
activities including agriculture, industry, forestry, energy production, settlement and recreation.
Control of landownership and use is often an object of intense human interactions.
Land use is often inhibited by such as environmental factors as soil characteristics, climate,
topography, and vegetation. Generally, decisions on the most appropriate land-use are usually
based on what is considered best economically, in terms of returns.
The main process of human land transformation has been through agriculture, particularly
intensified agricultural production. On one hand, intensive agricultural production has been
associated with the dramatic global increases in yields in the years 1961 to 1996. Around that
time, yields of food crops (per unit area of land) outpaced global human population growth
whereas globally, the arable land increased by only 10% (Matson et al., 1997 in Lambin et al
2000); Lambin et al, (2001). However, if these trends are extrapolated linearly into the future, it is
deemed that intensification of agriculture will have major negative impacts on non-agricultural
terrestrial and aquatic ecosystems.
Intensification levels can also be a pointer of the ability of land-use systems to adapt to changing
circumstances as a result of policy or climate change. Thus, many extensive land-use systems
have tended to be marginal in productivity as these types of land uses often have little capacity to
adapt (Lambin et al, 2001). The situation has however drastically changed in the recent past and
increased intensification of agriculture has been experienced in the fragile marginal areas as
population pressure in areas that can adapt to land-use change mounts.

2
Land-use and land-cover change is one of the leading driving forces of global environmental
change, and as such it is fundamental in the sustainable development debate. The various changes
have far reaching effects on a range of environmental and landscape attributes including the
quality of water, land and air resources, ecosystem processes and functions as well as on the
climate system through greenhouse gas fluctuations and surface albedo effects (Lambin et al,
2000).
1.1 Statement of Research Problem
Since pre-independence period, land use in the semi-arid Mbeere region has to a great extent been
controlled by environmental factors such as the type of soils, climate and natural vegetation as
well as human factors including the density and distribution of population. The region is
predominantly pastoral characterized by expansive bush land, herding livestock production, bee
keeping and reduced cultivation of indigenous drought resistant food crops in areas with
relatively good rainfall under shifting cultivation.
The region is experiencing significant land use changes characterized by rapid shift of
agricultural production from the traditional system of subsistence production of indigenous food
and cash crops and livestock to an emergent system of commercial production of high-value
crops and exotic breeds of livestock. Similarly, the region is experiencing increased competition
for space as population increases and built environment activities intensify (Ministry of
Agriculture, Mbeere Office, 2008).
Expansion of markets for high value crops has triggered commoditization of agriculture in the
region. This has significantly changed the land use structure. Settlements have become more
concentrated and several urban centers have emerged without elaborate physical development
frameworks, especially along main transport corridors. Land scarcity and changes in land-labour
ratios are on the rise as more land is cleared to pave way for agriculture. The reduced production
of food crops has significantly affected food security and made residents dependent on irregular
supplies from high and medium potential areas.
The land utilization changes in the region, which are largely spontaneous, are likely to push
residents towards impoverishment, if they continue unchecked. This study ventured to examine
the influence of miraa cultivation, one of the favored high value crops in Mbeere South Sub-
County on the changing land use patterns with an aim of promoting sustainable land use
practices.

3
1.2 Research Questions
To achieve the study objectives, this study focused on addressing the following questions;
1. What are the emerging crops and land uses in the study area?
2. What factors have influenced miraa production in the study area?
3. What are the emergent land use patterns in the study area?
1.3 Overall Objective
The study endeavored to examine the spatial distribution of miraa farming and emerging land use
patterns with a view of providing an integrated and sustainable model for miraa production.
1.4 Specific Objectives
The specific objectives of the study were:
1. To evaluate emerging crop types, land uses and settlement patterns in the study area;
2. To determine the factors influencing increased cultivation of miraa in the study area; and
3. To assess and clarify emerging patterns of land uses in the study area.
1.5 Assumptions of the Study
In undertaking the study, three assumptions were made. First it was assumed that increased miraa
production in Mbeere South Sub-County is a response to reduced choices of alternative
commercial agricultural production and sources of livelihood. The production of traditional cash
crops such as cotton, tobacco and sisal has declined in the region over years leaving farmers
without a dependable high value crop. In addition, it was assumed that despite the wavering
global market for miraa, its production in Mbeere South Sub-County as well as in other parts of
the country will continue in the midterm period. This is because miraa market continues to be
lucrative and each day more farmers are venturing in its production.
It was also assumed that miraa production, which is largely spontaneous, has adverse impacts on
the land-use patterns in areas of its production including in Mbeere South Sub-County. Until now
miraa production is not guided by any policy to control its propagation, management and
marketing. This trend can be reversed if its production is integrated properly in the agricultural
production system. As it is, the main driver of miraa cultivation is the lucrative returns. Finally, it
was assumed that farmers engaging in miraa production are not adequately informed about its
implications on land-use.

4
1.6 Justification
Appropriate and sustainable land use practices in rural areas are paramount for rural and at large,
national development. Inadequate enforcement and integration of land-use and agricultural
policies adversely affects the quality of life of rural residents. In addition, inappropriate
agricultural practices such as the advent of new agro- products in the absence of clear policy
guidelines exacerbate the situation.
Universally, expansion of agricultural production, which is the dominant land use in rural areas
and land-use change are strongly linked. Kenya is an agricultural economy and approximately
80% of national population reside in rural areas and derive their livelihood directly from
agricultural practices. However, approximately 80% of the national land surface is classified as
ASAL. These statistics present development paradox necessitating close monitoring of how
residents of rural areas, particularly those from the expansive ASAL region utilize their land to
promote national economic growth.
The focus on miraa production as a research topic was informed by the fact that although it is a
relatively new commercial crop in the country and Mbeere region, it has a tendency to displace
other forms of agricultural production, affect natural resource utilization, particularly land and
water and settlement patterns in areas where it is produced. Production of the lucrative crop has
expanded rapidly over the years despite policy and legislative lacunas, the controversies
associated with its consumption and the highly uncertain global and local markets.
This study was necessitated by the need to regulate land use in rural areas of Kenya so as to
achieve the aspirations of the national development policy, Kenya Vision 2030, while enhancing
household self-food sufficiency. Further, it was borne on the need to improve the quality of life
and economic wellbeing of majority of persons resident in rural areas who engage in unstable
sources of livelihoods, by encouraging adoption of optional sources of livelihoods so as to
eliminate poverty, inequality and unemployment. Regulation of activities that rural residents
engage in will help to protect and conserve fragile ecosystems such as hilltops, steep slopes,
rivers and water sheds and wildlife sanctuaries which are currently threatened by unregulated
land-uses.
1.7 Significance of the study
This study sought to contribute to the development of fresh knowledge on how to deal with
emerging challenges of rural land use so as to avert further degradation of rural ecosystems. The
study provides valuable insights not only to the national government but also to county

5
governments as well as other stakeholders on promoting rural development through regulated
land use. At the national level, promotion of rural development is in line with the National Vision
of becoming a middle income economy with high quality of life by the year 2030. At the county
level, the study will fulfill the Constitutional mandate which requires County Governments to
enact local laws to manage the environment and natural resources.
The study will further contribute to the implementation of the Constitutional aspiration of
promoting sustainable land use and promote public awareness on the importance of regulating
rural land-uses.
Ultimately, the study will contribute to the policy debate on rural development in Kenya and
specifically on land-use options in Mbeere South Sub-County as well as creation of an improved
image of Mbeere South Sub-County and that of Embu County at large.
1.8 Scope of the Study
The study was confined within well-defined theoretical and geographical scopes. Theoretically,
the study focused on the concept of rural development as a complementary part of national
development. Geographically, the study was confined to part of Mbeere South Sub-County
administrative area.
1.8.1 Theoretical Scope
Universally, rural areas are associated with agricultural production and allied activities, village
and cottage industries, crafts, and community services and facilities. Agricultural production
including crop and livestock production is an important component of rural development. Rural
development revolves around improvement of these factors so as to improve the quality of life
and economic wellbeing of people resident in these areas (Katar, 2009). Enhanced quality of life
of rural residents in turn enables them to participate fully in national development which in turn
enhances global competitiveness of a nation. Since it may not be possible to study all the
components of rural development due to time and resource constraints, the study limited itself to
agricultural activities and urban growth activities within the study area.
The study concentrated on analysis of miraa production in Mbita and Kirima Sub-Locations in
Mbeere South Sub-County based on the preposition that a land owner will only put his/her land to
the use that will earn him/her the highest rent.
The study also reviewed policy, legislative and institutional arrangements that govern land-use in
the country with an aim to determine how they have influenced the choice of land-use practices

6
undertaken in the study area, and to propose interventions that can reverse the current land use
trend.
1.8.2 Geographical Scope
Rural areas constitute approximately 85% of the national land surface and are generally utilized
for various forms of agricultural production (Kenya Land Alliance, 2016). The types of land-use
activities promoted in rural areas have direct and indirect impacts on national economic growth
and development. Changes in the utilization of rural areas are evident throughout the country. Of
importance, is the utilization of Arid and Semi-Arid Regions of the country that constitute
approximately 80% of the national land surface.
Studying changes occurring in the utilization of agricultural land in the entire of Mbeere region
though important, would have been time-consuming, and an expensive venture. Again it was not
possible to study the entire Mbeere South Sub-County owing to the same factors. In this respect,
the study focused on changes occurring in Mbita and Kirima sub-locations in Mbita and Kianjiru
Locations in Mbeti South Ward as shown on Figure 7.The two sub-locations cover an area of
approximately 85.01 km2 (850,100 Ha).
Administratively, the larger Mbita Location comprises of Mbita and Gikiiro sub locations while
Kianjiru location comprises of Kirima and Nyangwa sub locations. Five villages from each sub-
location were sampled for administering household questionnaires.
1.8.3 Structuring Elements of the Study Area
Distinctive features within the study area include Thiba and Itabua Rivers, the main sources of
water for domestic use and for small scale irrigation, Kiambita, Kianyangwa and Kianjiru Hills,
which influence the micro-climate of the area and class B7 Embu- Mwingi all-weather road, the
main transportation artery for miraa trade.
1.9 Study Limitations
There are several factors that can influence land-use changes other than agricultural practices.
These include overpopulation in high and medium agricultural potential area leading to
emigration to low potential areas, and the natural increase of population within the study area.
Low educational and socio-economic status of the target respondents necessitated transcription of
the Household Questionnaire into Kiswahili and the local language as administering it in English
was not be feasible. This may have led to alteration of the original meaning. To mitigate this, the
research assistants were taken through the questionnaires prior to the study and the most

7
appropriate interpretation of the questions to the most favored language by respondents
determined to ensure questions were asked and answered as accurately as possible.
The fact that the researcher focused on the implications of miraa production in two sub-locations
may not adequately represent the socio-cultural characteristics of all residents in the country. The
two sub-locations were selected purposively based on their vibrancy in miraa production
Further, the study was faced by institutional bottle-necks. It was difficult to get audience with
some of the people earmarked for interview, especially key informants. This necessitated further
analysis of secondary data to fill information gaps.
The study also faced financial constraints. Available funds were not adequate to cater for an in-
depth study. This occasioned a reduction of the sample size and the number of data collection
methods.
1.10 Operational Definition of Key Terms
Integration of production: The unification of one form of production with another on the same
piece of land based on a careful analysis of the potential of the land and the various land-use
choices so as to arrive at optimal utilization options (LUCID, 2006) .
Implications: The outcomes or consequences of engaging in a particular activity
www.thesaurus.com). In context, these are the consequences, both positive and negative of
undertaking particular land-use practices.
Land Cover: The natural appearance of land and the attributes of the immediate subsurface,
including biota, soil, topography, surface and groundwater, and human structures (Lambin et al,
2000).
Land-use: The purposes for which humans exploit the land cover, or arrangements, activities and
inputs people undertake in a certain land cover type to produce, change or maintain it. This
includes agricultural production and built environment activities.(Lambin et al, 2000; FAO, 1997
and FAO/UNEP, 1991).
Land-use Patterns: The observable structure of land as a result of different human activities
defined by the size, shape and the type of land use undertaken. Also the sequence of areas under
different land uses at any given time(Lambin et al, 2000).
Land-use Change: Either the total replacement of one land cover type by another or the
modification of a particular land cover (Lambin et al, 2000).
Miraa (Catha edulis):A non-food commercial crop grown for its fresh leaves and tops
(twigs)which are chewed as a stimulant (Gessesse, 2013).

8
Pil: -A brand of polythene paper bag that is used for packaging and as a unit measure of miraa
twigs in Mbeere South Sub-County. A full Pil holds approximately 5-6 kgs of miraa.
1.11 Organization of the Study Report
The study is organized into six chapters as follows: -
Chapter One contains the background information of the study. Specifically, it presents the
statement of the problem, the study objectives, the research questions and the scope of the study
Chapter Two is the detailed literature review of the subject matter in line with the objectives. The
chapter explores theory of land-use change and development, local policy and legal framework of
land-use, trend of land-use changes in Kenya and in Mbeere South and an overview of miraa
production in the country. The section is concluded with a conceptual framework of the study.
Chapter Three looks at the methodology of the study. Key to this section are the sampling design,
data needs and their sources, data collection methods, analysis and presentation
Chapter Four analyses global and local production of miraa and the onset of the crop production
in the study area
Chapter Five looks at the baseline information of the study area in terms of location,
physiographic features, population dynamics, land resources potential and agricultural production
practices including land tenure systems, land sizes, existing land use patterns and forms of
production
Chapter Six discusses data analysis key findings of the study
Chapter Seven presents a summary of conclusions and recommendations for ensuring sustainable
production of miraa in the country and appropriate land uses in the study area. It also gives
suggestions for further research

9
CHAPTER TWO: LITERATURE REVIEW
2.0 Introduction
This section encompasses critical literature review on land-use change guided by the study
objectives. The chapter explores theory of land-use change and rural development, legal and
policy frameworks of land-use in Kenya and a theoretical framework of land use. The chapter is
summarized with a conceptual framework for the research.
2.1 Land-Use and Land-Cover Change
Lambin (2000), argues that change in land use occurs either through conversion of land cover
where one land cover is completely replaced by another cover type or by modification of land
cover where subtle changes affecting the land cover’s feature without causing any change on its
general classification occur.
Generally, Land use and land cover changes are driven by three main factors namely natural or
environmental processes including both atmospheric climate changes, wildfire, pest infestation
and wildfire; direct impacts of human activities, like deforestation and physical infrastructure
development. Indirect impact of human activity, for instance, water diversion that results in
alternation of water table. These processes and activities either improve or degrade the state of
the land (Loveland R. et al, 1999).
Changes in land use as well as land cover changes occur not only at the local level, but also at the
regional and global levels. Contemporary change in many realms of the biosphere is principally
the product of human activities. (Loveland R. et al, 1999). These changes starts when a natural
forest is converted into a farming land and the current grassland management by for instance
analyzing the intensity of both fire frequency grazing (Hobbs Et al., 1991; Schimel Et al., 1991;
and Turner, 1989). These kind of activities occur due to various social objectives, such as the
need for food, recreation, living space, and fiber. Thus, they can never be understood without
looking at the underlying factors that either constrains or encourages production as well as
consumption. A percentage of these factors, such as power’s structures and property rights, both
at local and international level, has influence on accessing or controlling land resources. Other
factors like socio-economic development level and population density have impact on the land
demands whilst technology influences the exploitation’s intensity, which is possible. In addition,
other factors, like policies on agricultural pricing, control land-use decisions through creation of
incentives to encourage the individual decision makers.
The consequences of land cover change at the various levels are significant not only for land
cover but for many aspects including regional and global climates, atmospheric composition,

10
biodiversity, forest resources, the cycling of carbon, nitrogen, phosphorus, soil condition,
water and sediment flows. This in turn has significant consequences on food production,
freshwater supply and quality of air. In particular, it has been estimated that one third of the
entire carbon emissions into the atmosphere starting as early as 1850 was a result of changes
in land use.
Across the globe, changes in both Land Use and Land Cover have been a clear indicator of
human footprint as well as the key trigger of biodiversity loss among other types of
environmental degradation.
Approximately 83 percent of the worldwide terrestrial land surface has been affected by the
human footprint while for the just past fifty years, approximately 60 percent of the ecosystem has
undergone degradation (United Nations, 2012). On average, 75 percent of the areas fit for
habitation has undergone moderate or severe disturbance; save for the gist of the Boreal forests
and tropical rainforests, ice-covered surfaces, and deserts that remain relatively untampered with
by human beings (Hannah Et al., 1994). According to Vitousek Et al., (1997), humans have co-
opted around 40 percent of worldwide net primary productivity, while Postel Et al., (1996),
argues that approximately more than 50 percent of the available fresh water supply that is
renewable is under co-option. Since the invention of agriculture, circa ten thousand years ago,
human beings have transformed or modified the land surface as is evident in figure 1. Presently,
approximately one third of the entire world’s land surface is used for grazing animals or growing
crops (Foley Et al., 2003 and National Geographic Maps, 2002). The pace of land clearing for
cultivation has been specifically rapid for the past 300 years. Richards (1990) estimated that, the
world lost 20% of forests and woodlands over the last 300 years, 1% of grasslands and pastures
(although most grasslands were converted to pastures), and croplands expanded by 466%.
Regionally, the exploitation of land has mainly been associated with primary production (both
subsistence and commercial production). Indeed, the history of the continent is punctuated with
scramble for land and land based resources. At present, majority of African economies are still
agro-based, a key determinant of how land is utilized. While the rates of agricultural expansion
production are decreasing in the rest of the world, they still continue to expand within the Latin
American nations and Sub- Saharan Africa (SSA). Agricultural land’s expansion has declined in
the rest of the world largely due to increasing agricultural productivity, which is still low in Sub-
Saharan Africa where the contribution of crops to total production was only 38% from 1961 to
2005 (United Nations, 2012).

11
Figure 1: Anthropogenic Transformation of the Terrestrial Biosphere
Source: http://kelsocartography.com accessed on 15th July 2015

12
Expansion in cultivation within most of the East African regions has led to changes in the land
cover, thus, leading to more agro-ecosystems and a less natural vegetation’s cover. These changes
are driven by the increasing demand for the agricultural products essential for improving food
security and for generating income for both the rural poor and the large-scale investors within the
sector of commercial farming. During the past couple of decades, cultivation area has greatly
increased into double folds in Tanzania and Kenya. In Uganda, this land has moderately changed
because of the enhancement of land policy that protects the numerous wetlands and because most
of the land of this nation was already under cultivation before (Olson Et al., 2004). Misana Et al.,
(2003), reports that Tanzania had significantly expanded cultivation in the Moshi region during
the same period, whereas, Mugisha (2002), argues that in Uganda, agriculture only expanded
across the drier rangelands, excluding the wetter highlands. Scarcity of land within the highlands
forced farmers to step up their land use (by increasing inputs per hectare) since only little land
was available for extending their farms.
Kenya, like other agricultural countries depends entirely on land productivity for subsistence and
socio-economic development (GOK and UNEP, 1997). In contrast, about 80 percent of the
landmass of Kenya is categorized arid and semi-arid, and is occupied by 25% of the total
population (GOK, 2005). However, despite their relative aridity, these lands support over 60
percent of the livestock population, as well as the massive proportion of the wildlife population
(Ngugi, 2005). There has been a swift change in Land-use across Kenya during the past hundred
years. Two principal changes that have taken place are expansion of the mixed crop-livestock
systems into both former pastoral and grazing areas, as well as the agricultural intensification.
These changes respond to various factors that includes land privatization and government
policies, migration and population growth and changing global and national markets for livestock
and crop products. Consequently, most of the natural vegetation has been replaced with crops and
exotic trees such as lack wattle, eucalyptus, cedar and ornamental trees and shrubs. Subsistence
production of traditional food crops such as maize, beans, arrowroots, cabbages, bananas and
sugarcane in high and medium altitude areas has declined over time. In their place, production of
commercial crops such as tea, coffee, pyrethrum and various horticultural crops as well as rearing
exotic breeds of dairy cows such as Guernsey, Friesian and Hereford has thrived. These breeds
have replaced traditional humped types. Landlessness has continued being more acute leading to
re-division of original parcels of land and forcing people to adopt zero-grazing. The production of
goats and sheep has also declined (Mwaniki, 1973:3).
Changes Kenya’s land use have transformed the land cover into human settlements, urban
centers, farmlands, and grazing lands, at an expense of the natural vegetation. Whilst the natural

13
vegetation is lost, plant cover, indigenous plants and also animals biodiversity are also lost.
Similarly, as croplands expand, the productivity of soil in terms of fertility and moisture is
compromised. The transition towards intensive agriculture in Kenya, associated with demand for
higher productivity as farm sizes decline, family sizes increases and expansion of markets for
commodities has allowed many more people to adopt a sedentary lifestyle, and systems show
adaptability and flexibility in the face of the changing political, national and the international
structures (LUCID, 2006)
Figure 2: Land Use Changes on the Eastern Slopes of Mt Kenya
Source: http://kelsocartography.com. Accessed on 15th July 2015
In Mbeere, the study area, land use has largely been controlled by the nature of landscape, the
type of soils, climate and natural vegetation, and the density and distribution of population. These
factors have tied the natives to their traditional activities and limited the space for the inclusion of
foreign activities (Mwaniki, 1973:8). Traditionally, the region, which is semi-arid in nature,
depended on herding livestock production (mainly cattle and goats) and bee keeping, except for
few areas with relatively good rainfall where production of crops at a reduced scale was
undertaken. The natural vegetation provided and has continued to provide nutritive fodder for

14
livestock production. Initially, since land was communally owned, it was easy to move around in
search of pasture and the shifting cultivation gave land time to recover making it less degraded.
The region has undergone significant land cover changes in the last five decades. This can be
attributed to increasing population with time, sedentarization of the once pastoralist community
and a shift from a system of land tenure characterized by communal access and management of
land to one favoring individual ownership and control of land. Olson and his colleagues state that
cultivation in Mbeere expanded by 70 percent during the period between the years 1958 and
2001, leaving only the isolated parts of both bush and forest. The sedentary way of living has led
to cultivation of various foodstuffs. These include pigeon peas, composite maize varieties,
sorghum, varieties of millet, cassava and fast growing bean varieties. Overtime, commercial
crops such as tobacco and cotton have been introduced in the region first on experimentation
basis and later as successful commercial crops. In addition, small scale mining of stones and
crystalline rocks (used as whetting stones) as well as quarrying of building stones by unskilled
prospectors has also been practiced (ibid:9).
There has been rampant land cover and land use changes in Mbeere area since circa 1987 a factor
that can be associated with the diversification of production including enhanced commercial crop
production in the region around the same time, an occurrence that has largely contributed to the
phenomenon of land use changes; amongst other social and economic consequences. In addition,
there has been a great transformation of farm implements employed in the production from
simple traditional tools like pangas and hoes to sophisticated ones like ox-drawn ploughs and
tractors. The mechanization has led to large tracts of land being cultivated, leading to rapid
transformation of the land cover. This in turn has reduced the number of livestock and the amount
of farm produce produced by each household, the reduction of soil nutrients and increased soil
erosion and emergence of new economic activities as the households strive to maximize returns
from the ever reducing land holdings. In the recent past, there has been an influx of skilled
prospectors of minerals found in the region such as mica, pegmites, magnesites, graphites and
other precious stones. Similarly, there has been emergence of production of horticultural products
under small scale irrigation and the production of new varieties of commercial crops such as
Miraa (Catha edulis).
2.2 Nature of Land-Use Change
Universally, there exist two universal approaches of analyzing land-use changes namely the
analysis of land-cover change and that of land-cover modification. While land cover conversion
may occur from natural causes or human activities, land cover modification is frequently
associated with human activities, particularly forms of agricultural production such as changing

15
input levels, farming systems such as fallow cycles, rotation systems or secondary forest re-
growth and intensification of production (ibid, pp 322).
2.2.1 Land Cover Conversion Analysis
This is approach looks at macro changes that lead to full replacement of the original type of land
cover by another (Lambin Et al., 2000). It is ideal for evaluating overt changes such as
deforestation and urbanization. In the case of deforestation, wanton cutting down of trees without
replacement completely displaces forest cover. Similarly, growth of an urban centre in a certain
area completely displaces the original land cover. This approach is however limited by its very
nature of examining major changes only. Thus, it is only applicable in situations where changes
occur on land that was not hitherto exploited. However, it is possible that land that had been
exploited for a certain use is subjected to a higher scale of the same use, as the case at hand where
agricultural land is put into more intensive use.
2.2.2 Land Cover- Modification Analysis
This approach looks at subtler changes on the features of land cover without changing its general
classification, hence, the term modification (ibid). As already mentioned, this type of analysis is
best suited for analyzing changes occurring on agricultural land.
2.3 Triggers and Impacts of Land-Use Change
Triggers and impacts of land-use and land cover change are cyclic. The various triggers have
cumulative impacts that eventually lead to secondary changes. Changes in Land use as well as
land cover may occur locally, regionally or globally (Loveland et al, 1999).
Generally, changes in land cover and Land use are driven by three main factors namely; natural
processes, including climatic and the atmospheric changes, pest infestation wildfires; direct
impacts of human activity, including deforestation and infrastructure construction; and the
indirect effects of human activity, that includes, diversion of water, consequently bringing down
the water table. These processes and activities can either improve or degrade the state of the land
(ibid). In respect of agricultural production land-use change occurs in two distinct forms namely
the intensification of production and intensification of production (LUCID, 2006)
2.3.1 Natural Triggers and their Implications
Abiotic factors such as wildfires, extensive browsing of vegetation by large herbivores such as
elephants, and natural successions could trigger overt changes in land cover such as the transition
between woodland and grassland (Lambin , and Suzanne2001). In addition, climate change may
result to prolonged dry spells or increased precipitation, both of which have far reaching effects
on land. Prolonged drought may have such effects as reduction and extinction of vegetation,
16
increased bush fires and drying of water resources. Increased precipitation on the other hand may
result to flooding and changes in sea levels rendering land wasteland. Climate change may also
lead to emergence of invasive or new species of pests, vegetation and diseases which result to
alteration of land-use and land-cover. A good example is the spread of Prosopis juliflora
(Mathenge) and Acacia reficiens in Kenya which has continued to colonize important ASAL
ecosystems by suppressing the growth of several grassland species (Kenya, 2010).
Browsing of vegetation by wild animals may result to modification of vegetation cover. At the
same time animals are important seed dispersal agents through droppings or by seeds sticking on
their fur. Thus, vegetation might be exported to other regions in this manner leading to
conversion of land-cover.
Bush fires caused by natural phenomena such as volcanic eruptions, lightening or prolonged dry
spells or by human activities such as burning vegetation for crop land, burning charcoal,
traditional harvesting of honey or luxurious lifestyles such as smoking, result to destruction of
huge tracts of bush land, leading to conversion of land-cover.
2.3.2 Direct Human Activity Triggers and Impacts
Lambin (2001), considered three major human activities which have great impact on land cover
and whose impacts are usually underplayed. These are tropical deforestation, rangeland
alterations, agricultural modification and urban growth.
2.3.2.1 Tropical Deforestation
High rates of deforestation are usually associated with population increase, poverty and shifting
cultivation in frontier regions (Mather and Needle, 2000 in Lambin Et al., 2001). Where
deforestation is associated with the increased availability of the shifting cultivators, who trigger
mechanisms that involve changes within the frontier developments, and national policies which
drive migrants into hitherto sparsely occupied areas. Sometimes, shift cultivation exacerbates
deforestation due to the unfamiliarity of agriculturalists with their current environment. In other
times, the farmers come up with understandings new skills that have positive impacts on land use.
To a large extent, tropical deforestation is driven by changing economic opportunities associated
with social, political and infrastructural changes.
In-migration to tropical forest areas is often triggered by government initiatives such as
settlement schemes in frontier regions, development projects, plantations and/or extractive timber
industries. A good example of this in Kenya is the establishment of tea plantations on the fringes
of indigenous forests and the establishment of the shamba system of cultivation where persons

17
residing next to indigenous forests were allowed to clear portions of the forest to grow crops
while replanting trees on other sections.
The government driven projects for exploiting natural resources lead to the development of
requisite infrastructure such as roads, electricity, health facilities and water reticulation systems.
The improved infrastructure attracts land seeking families and consolidates occupation. The
competition for land that ensues with redefinition of rules of land and capital access results to
winners and losers, those increasing land holdings and those pushed/pulled onwards, leading to
the expansion of the agricultural frontier further, where land is still cheap (Lambin Et al, 2001).
This is followed by large-scale conversion of land to pasture resulting to increased land prices,
and further land consolidation.
2.3.2.2 Rangeland Modifications
Generally, large areas of rangelands are maintained in their natural state by the interaction of
human and biophysical factors. Human activities constitute a functional part of these semi-natural
ecosystems. As a result, reducing human or eliminating human activities in such ecosystems will
actuate significant changes (ibid).
Both tropical and temperate rangelands are hardy and highly dynamic, transiting multiple
vegetation states, either through succession sequences or via shifting rapidly in response to the
random biophysical and human drivers. The less arid systems within subtropical and tropical
areas are controlled by the combination of biophysical and human drivers, and they might be at
risk of being developed through change and intensification. The weakened systems of indigenous
pastoralism subvert resource institutions, local economies or leads to the downfall of urban
migration with some rural remittances that may lead to either land alienation or conversion, with
concentration within the remaining areas, degradation and local overstocking. Conversely,
marginalization and decreased grazing results in changes in animals, plant production, and
vegetation cover with implications for conservation of biodiversity or/and animal production
(ibid). In wetter regions, decline in burning of vegetation leads to gradual expansion of
woodlands. This implies that grazing is essential in sustaining lands, particularly the tropical
ones.
Prevailing land tenure systems that favour individualization of land trigger changes in rangelands.
In addition, the intensification of production and mechanization remove the nutrient cycle
between livestock and the arable lands, differentiating the cultivated plains from mountainous
areas and forest regions that are used as grazing areas. The continued conversion of rangelands
leads to gradual loss of biodiversity.

18
2.3.2.3 Agricultural Extensification and Intensification
Land use change from agricultural production occurs either through the extensification or
intensification of production. Extensification is the horizontal expansion of farmland under a
certain agricultural activity either within a particular landholding or to independent holdings
(LUCID, 2006). On the other hand, the concept of agricultural intensification substitutes of
inputs, that includes, capital, labour and skills used for increasing land production, in quantity or
value, from a given area (Lambin, 2000). Simply put, it is increasing the production per unit area
within a given period of time. In terms of other land-uses, it means increasing the density of use
of a unit landholding (LUCID, 2006).
Intensification of agriculture is triggered by land scarcity or by government interventions. Land
scarcity is closely linked to population growth, whether due to natural increase, migration,
incursion of non-agricultural land uses or institutional factors such as land tenure regime (Ostrom
Et al., 1999 in Lambin Et al., 2001). Land scarcity has changed the land-labour ratios, thus
increasing the intensity of cultivation whereby in some instances, it has shifted production toward
market and also to products of a higher value. These systems appear to impact households in
different ways, as they push some towards an increased wage labor, emigration, or
impoverishment. Market oriented production actuates agriculture’s commercial intensification in
a commoditization pathway. Incentives for enhancing production intensify the experimentation
with both new products and crops. Cash crop production and Market opportunities often attract
in-migrants, hence configuring labor ratios, intensity of production and orientation of production
in such a manner that the policy’s role is crucial. Conversely, collapses in product markets propel
declines or changes in production systems.
Land –use intensification may also be triggered by interventions by government, donor or Non-
Governmental Organization (NGO) sponsored projects whose intention is to promote
development within a region, usually via commercial production for both international and
national markets which increase the revenue for the State and the participants (ibid). This mode
of intensification is vulnerable to markets and the changes in donor or government policy, the
public sector financial constraint, and incompetent management. This illuminates the challenges
being faced by the cash crop sector in Kenya where industries for some of the prominent cash
crops such as cotton, sugarcane and nuts have either collapsed or are at the verge of collapsing.
2.3.2.4 Urbanization
Urbanization as a land cover occupies less than 2% of the land surface of the earth. However,
urban lifestyles have far reaching effects on land-use via change of urban-rural connections and
raising consumption expectations (ibid). Given that 60% of the world population is expected to be

19
urbanized by 2025 (United Nations Population Fund, 1991), urban ecological footprint or the
rural-urban linkages plays a crucial role land change assessment.
According to Labin (2001), there are two main urbanization pathways that lead to various impacts
on the rural landscapes. Within the developed world, large-scale urban clusters as well extended
peri-urban settlements fragmentize the landscapes of those huge areas in which there is are
threatened of various ecosystem processes. The ecosystem fragmentation within the peri-urban
regions might be set off by the urban-led demands for recreational land purposes and
conservation. In other instances, politically and economically and powerful urban consumers’
leans towards disconnecting themselves from the resource production’s realities and pay no
attention to the effects of their consumption upon distant areas.
In the less-developed world, urbanization outbids all other land uses for land adjacent to the city,
including prime croplands. Cities attract a significant proportion of the rural population through
permanent and circulatory migration. The wages earned in the city are often remitted by migrants
to rural homelands, in some cases transforming the use of croplands and creating ‘‘remittance
landscapes’’. This mode of urbanization changes ways of life ultimately associated with
demographic transitions, increasing expectations about consumption, and potentially a weakened
understanding of production–consumption relationships evidenced in the well-developed world.
2.3.2.5 Globalization
Globalization includes the worldwide interconnectedness of places and people through global
markets, information and capital flows, and international conventions (ibid). Globalization
processes amplify the driving forces of land-use change by removing regional barriers and
strengthening global ties at the expense of national connections. Incorporation of a region into an
expanding world economy usually results in rapid land-use changes. Global forces rapidly replace
or rearrange the local factors of land uses and building new global cause-connection patterns in
their place. At the same time, global-scale linkages disconnect the sources of demand from the
location of production. The promotion of market cultivation with globalization leads to species
and products specialization, threatening local diversity in land use patterns.
Global forces also affect land use indirectly. Such initiatives as eco-labeling, information
technologies, better forecasts on weather or market prices for farm management, or land
monitoring using Earth Observation Satellites provide control and global sanctioning. Global
markets increase intricacies and uncertainty, raising concerns about risk impacts from global–
local interplay of driving forces.

20
Finally, the globalization’s forces underlay tropical deforestation’s processes by expansion and
liberalization of markets for forest products; modification of range land through the application of
the inappropriate land management systems that have designed elsewhere, and agricultural
intensification leading to agricultural specialization, and urban growth by the diffusion of the
urban culture.
2.3.3 Analysis of Triggers and Impacts of Land-Use Change
The cycle of triggers and influences of land-use changes can best be explained by the Driving
Force, Pressure, State, Impact and Response Model as outlined in Figure 3. According to this
model, the main driving forces or the underlying causative factors of land-use change include
population growth, technology advancement and changes, institutional structures and changes
(political, market, cultural, social), and land laws and markets. These underlying factors exert
pressure on households forcing them to devise various incentives to cope with the situation. For
instance households might resort to clearing forests for farmlands, expansion of cities on
agricultural land, or increased land, water and air pollution by pollutants from industries and
other human activities. The pressures so created impacts on the environment in varying types,
degree, spatial extent and the rates. Changes of the state of environment maybe exemplified by
the stock of natural resources and quality indicators of the environment such as erosion levels,
nutrient stocks, soil quality, pollution levels, changes in areas or quantities of carbon, and loss of
species or habitats.
Continued degradation of environment impacts households in different ways. Indicators of
impacts include measures of vulnerability such as poverty status and food insecurity, access to
land and land based resources, security of tenure; access to market, shelter and other basic human
needs, to safety nets, and the degree of empowerment or political influence.
The impacts trigger various responses, in terms of conscious efforts by households and
governments to remedy the various impacts, particularly the degradation changes. The responses
to address the driving forces, the pressures, the state of environment, or human well-being are
undertaken at local, national and international levels. The interventions vary from short- to long-
term.
Indicators of pressure, state of environment and responses by households are summarized in
Table 1.

21
Figure 3: Driving Force-Pressure-State-Impact-Response Framework
Source: Sioufi, (2010:2)
Table 1: Land-Use and Land Quality Indicators
Issue Pressure indicators State indicators Response indicators
RESOURCE
AVAILABILITY Productivity of arable
land
Encroachment on
marginal lands
Intensive cropping
Change in erosion
Change in productivity
(yield/ha)
Change in water quality
Change in out-migration
Shift to more tolerant
crops
Change in rate of land
abandonment
Change in capital
investment
Change in input use
efficiency
Change in production
systems
Any positive
response action by
government/institutions
SOIL Technologies gaining/declining nutrient increased use of manure

22
Issue Pressure indicators State indicators Response indicators
MANAGEMENT
STRATEGIES
imported from other
dissimilar
environments
Technologies
unrelated to range of
natural
variability/risk
status
gaining/declining organic
matter
gaining/declining yield per
unit area or yield per unit
input
increased/reduced wind
and/or water erosion
increased/reduced
runoff/storm event
increased/reduced
acidification
increased/reduced variability
and residues
change to more tolerant
crops, or to crop to
livestock mix
expansion of cultivated
area/farm
increase in
abandoned/degraded land
formation of farmer
support groups/
conservation clubs
subsidies
Land Quality Indicators (LQIs)
Clusters of Land
Quality Indicators
(LQIs)
Estimates of the intensity
of production, as well as
the range of production
systems used, number and
types of products and the
complexity of systems
used such as area of crop,
pasture or grazing land;
potentially arable and
pasture lands; proportion
of monoculture/mixed
farming
Measurements that express
current quality of the land, as well
as estimates of future land quality
as reflected through land
management practices such as
estimates of actual to potential
biological productivity; extent and
severity of major soil constraints;
a) Automatic effect of the
changes, if not attended
to
b) Policies and programmes
to create awareness of the
problem, improve land
management
technologies, and counter
or ameliorate the impacts
of land degradation
Source: FAO (1997:3)
2.4 Models of Land-Use Change
According to Labin (2000), there are four major categories of land-use models empirical,
stochastic (random), optimization and dynamic (process-based) simulation. These models are
applied to respond to different questions, although they require a different set of preliminary
information (ibid). In general, each of the models seeks to answer such questions as which
environmental and cultural variables contribute the most to an explanation of land- cover
changes, which areas are affected by land-cover changes, or the rate at which land-cover changes
progress.
2.4.1 Empirical Models
Empirical models seek to investigate on factors leading to changes in land-cover through use of
multivariate analysis of likely exogenous contributions towards the empirically-derived change
rates. Multiple linear regressions techniques are used for this purpose. These models are ideal for
predicting changes in land-use intensity where such changes have been measured over the recent
past, an assumption which is not valid in most studies. However, they are limited in application as
findings of statistically significant association do not establish a causal relationship. Thus
findings of a given area cannot be replicated to other areas.

23
2.4.2 Stochastic Models
Stochastic (random) models consist mainly of transition probability prototypes. They describe
stochastically, processes that move in a sequence of steps through a set of states. For land-use
change, states of systems are defined as the amount of land covered for various uses. Transition
probability can be estimated from a sample of transitions occurring throughout some time
interval. Probabilities of transitions are defined for changes from land-cover category to another.
The models only make use of transitions which have been recently observed just like empirical
models. They are limited in their application on land-use intensification. Possible areas of
application could be assessing the uptake of innovation and inputs.
2.4.3 Optimization Models
Optimization models tend to analyze the possible ways that a particular piece of land can be
utilized given its attributes and location so as to earn the highest rent. They tend to advocate
optimization of land-use based either on whole-farm analyses using linear programming at the
general equilibrium or microeconomic level, of the macroeconomic scale. These models are
based on the land rent theory of von Thonon and that of Ricardo.
Models in this category are used to investigate various how policy measures influence land
allocation options, to predict changes that might occur due to a particular intervention. However,
the models are limited in their predictive nature. Also it is difficult to define objective functions
and the non-optimal behavior of people because of the differences existing in their values,
cultures, and attitudes.
2.4.4 Dynamic Simulation Models
They imitate the mix of processes that result into changes occurring in land-use a good example
is the interaction between biophysical and socio-economic processes. They evaluate interactions
among all components of a system. They summarize and condense complex ecosystems into a
smaller number of differential equations in a systematic manner. Thus they are based on a priori
understanding of forces driving changes in a system. For instance, could agricultural
intensification be related to household need and wants, or to population growth?
These models are mainly applicable in subsistence economies for a broader change analysis
rather than individual, local cases. However, they are limited in that they are based on a
mechanistic view and are therefore not suitable for making predictions. They are largely verbal
than spatially explicit for numerical prediction. Table 2 shows summary of land-use change
models

24
Table 2: Categories of Land-Use Change Models
What is already
known on LUCC
What one needs to
know on LUCC
Model category Modeling approach
Where and when in
the past
When in the near
future
Stochastic Transition
probability models
Why in the past
(proximate causes)
Where in the future
(short-term)
Empirical, statistical Multivariate
statistical modeling
Spatial statistical
(GIS-based) models
Where, when and
why in the past
When in future ( long
term)
Process-based,
mechanistic
Behavioral models
and dynamic
simulation models
Dynamic spatial
simulation models
When and where in
the future (long-
term)
Why in the future
(underlying causes)
Analytical, agent-
based, economic
Generalized Von
Thunen models
Why in the future
(underlying causes;
scenarios)
Analytical, agent-
based, economic
Deterministic and
stochastic
optimization models
Source: Lambin et al,( 2000: 324-327)
2.4.5 Integrated Modeling Approaches
These are amalgamated models aimed at dealing with shortcomings of preceding models. This is
done by combining the best elements in appropriate measures for answering specific questions.
Thus they can be used to explain complex land-use systems such as determining the spatial
distribution of agriculture land-use responding to climate change. Such analyses require large,
multidisciplinary research rather than individual effort. These models are used to enhance
understanding of the sequences of intensification at a broader scale
2.5 Classical Models of Land Use
In economic terms, man will always put land to the use which will give him the highest returns
(Lambin et al, 2000). In agricultural production, the agricultural land rent theory of von Thünen
(1966) explains that optimal crop production allocation follows degrees of agricultural intensity.
25
The intensity in turn depends on the manageable economic rent. The rent depends on market
demands within the consumer center, production and transportation costs, and degrees of goods’
perishability for those produced for the primal market.
The economic base theory by Keynes and other thinkers posit that the external demand for
products from a region is the primary determinant of regional prosperity. The economy of any
given region is divided into two interdependent sectors, the export market (basic industries) and
the local market (non-basic/service industries). On one hand, the basic sector directly purchases
goods and services from the non-basic sector. Similarly, workers employed in the basic sector
purchase food, clothing, shelter, public services from the non-basic sector. Greater demand for
exports from a region generates exports sales and income for the basic sector; hence basic-sector
purchases provide income to the non-basic sector. This is called the multiplier effect.
Naturally, the forward- backward linkage between the basic and non-basic sectors results in a
scenario where output growth by producers drives increase in productivity through returns to
scale. this in turn has ripple effects whereby becomes the export sector more price competitive
and in turn stimulates growth in exports as consumers elsewhere buy more of the goods from the
region. This in turn generates further growth in regional output through the multiplier effect. The
growth of production as a result of output growth stimulates an influx of both workers and
investment. However, these linkages are not balanced calling for regulation to avoid a state of
disequilibrium. The dependence of local fortunes on the strength of effective demand for regional
exports, and the tendency for growth trends to become cumulative may strongly affect the spatial
structure of settlement which in turn may affect future economic performance. Investments may
tend to be concentrated in particular locations resulting to emergence of relatively autonomous
centres while establishing an unequal relationship between these cores and peripheral regional
areas. This calls for government intervention to correct the situation.
2.6 Land Area of Kenya
The total national land area is approximately 582,646 km2 or 59,450 million Hectares (Kenya,
2012). Agricultural production potential across the country depends on climate, hydrology and
the terrain.

26
Table 3: National Land Potential Classification
Agro
Ecological
Zone
(AEZ)
Potential Potential Land Use Challenges Distribution Area
(Million
Ha
Percentage
of total
area
I-III Medium
to High
Intensive crop
(particularly cash
crops - Tea, Coffee,
Pyrethrum, Maize
and Wheat),
livestock
(particularly dairy
production), forestry
and water catchment
High population
concentration
Fragmentation of
land into
uneconomic
holdings
Encroachment on
catchment areas
Sprawling urban
areas
Eastern,
central
and
western
highlands
Parts of
Coastal
region
8,600 15
IV-V Marginal
to
medium
Drought tolerant
crops, forestry,
livestock (ranching)
and wildlife
conservation
Likelihood of
crop failure due
to recurrent and
prolonged dry
spells and erratic
rainfall
distribution
Influx of
population from
overpopulated
high and medium
potential areas
Incongruent land
uses
Northern,
Eastern and
Southern
regions of
Central Kenya
11,500 20
VI- VII Marginal Livestock (extensive
pastoralism) and
wildlife conservation
Recurrent
droughts and
erratic rainfall
Incongruent land
uses
Northern,
Eastern and
Southern
regions of
Central Kenya
37,400 65
Source: Kenya (2012: 12)
Agro Ecological Zones IV to VII comprise of the ASALs. Cumulatively, they constitute between
85% and 89% of the total land area. Out of the total ASAL area, 50% of the area is dominated by
nomadic pastoralism while ranching and other livestock keeping occupies about 31 % of the area.
The rest of the land (19%) is used for either rain-fed or irrigated crop production (ibid).

27
Nationally, arable land is distributed at 3% of small holdings, measuring less than 3Ha; 64% of
medium holdings measuring 3- 49 Ha; and 15% of large scale farms of not less than 49 Ha. This
implies that approximately 3.2 million Ha are subdivided into about 3.5 million smallholdings
with an average of 1.2 Ha of land per capita while large holdings occupy about 780 Million Ha,
which is divided among approximately 3600 holdings. Thus, smallholder farmers with less than
1.2 Ha holdings dominate agricultural production in Kenya (ibid).
2.7 State of Land-Use in Kenya
The national land surface is either largely underexploited or under land-use activities that are
incongruent with the ecological zones. In addition, rapid and uneconomic land subdivisions,
particularly in the vicinity of urban areas and unsustainable land-use practices in rural areas result
to rapid land degradation and declining land productivity (ibid). This calls for revision of land-use
policies, particularly on ownership and use of land, and establishment of a land-use master plan to
arrest the excessive parcellation or land hording for speculative purposes.
2.8 Land Laws in Kenya
Land laws play a critical role in the shaping of the land use patterns [Odhiambo & Nyangito,
2002) in Ministry of Agriculture, 2012]. In Kenya, complex systems of formal and informal rules
regulate land ownership and use. The land laws that inform the land-use and ownership in Kenya
can be classified into two periods, the pre-independence period and the post-independence period.
2.8.1 Pre- Independence Period
Before colonialism, Kenyan communities controlled land ownership and use through communal
informal rules/ customary laws. Back then no individual owned land as the land belonged to
communities collectively with individuals having the right to use it in a manner acceptable to the
community (ibid). The communal land tenure system depends on the cultural values, and socio-
economic conditions, geographical factors. Land-use rights and Individual property rights existed
as sub-sets of the joint community rights. Rights to Land access were open to all social group
members and land was distributed equally based on the individual needs. Issues concerning land
ownership and use were governed by community leaders.
The onset of colonial influence in the 1890s, when Kenya became a British Protectorate brought
major changes on the stable and flexible structure of access to land of the pre-colonial Kenya.
Land considered prime for European settlement was acquired and owned and there was
subsequent need for continuous supply of cheap labour for plantation agriculture (ibid).
Colonialists imposed foreign laws especially the Crown lands Ordinance of 1915 bringing into
control all the territory under the Commissioner of East African Protectorate and later the
Governor. After acquisition of land for the settlement, the colonialists introduced English

28
Property Law to govern land ownership and use in areas they occupied hence, replacing the
customary land laws. This marked the origin of individualization of land ownership in Kenya.
The communal land governance henceforth was subjugated and lacked legal mandate. This also
marked the beginning of the settler incursion and settler agriculture in the protectorate.
The colonial government also institutionalized the Transfer of Property Act of India (ITPA) so as
to consolidate their control on acquired land. The law governed property in terms of transfers,
leases, mortgages and covenants. Further, the Registration of Titles Ordinance was enacted in
1920 to ensure security of tenure of settling proprietors. This resulted to the establishment of area
commonly known as African/Native Reserves and setting aside prime land, commonly known as
the white highlands for the settlers. The reserves were detached from the white highlands.
Africans were moved into the reserves en masse and the reserves were administered by native
land trust board.
2.8.1.1 Swynnerton Plan, 1952
This is a landmark policy of the colonial period. It was introduced to govern ownership and
access to land by locals. Prior to it, the white highlands and the native reserves were managed
independently, one by ownership and access to land and the other by customary law. There was
outright dissatisfaction among the ‘natives’ in the reserves due to inconveniences of relocation
and deterioration of living standards due to overstocking that led to rapid land degradation
necessitating urgent redress. The plan was therefore formulated to address these issues and guide
intensified agricultural development in the reserves by encouraging individualization of tenure in
place of communal/customary tenure so as to provide security of tenure through indefeasible
titles. In light of the plan, minimum land holdings were set aimed at helping the natives to invest
labour and profits in the development of the farms and to offer the land as collateral for accessing
credit for developing the farms Swynnerton, (1953) in Kenya, (2012).
The plan adopted adjudication, consolidation and registration principles of land management. The
adjudication rendered the customary law obsolete and ascertained individual or group rights,
hence changing land ownership and the existing governance structure. Land consolidation
endeavored to solve the problem of excessive fragmentation and promote convenience for land
use planning and extension services. Finally, land registration would convert African land into a
marketable commodity over which titles would be obtained and be easily transferable or
chargeable as collateral for development loans. These arrangements later worked against the
natives by negating the economic development they were meant to spur. Instead they furthered
the colonial grip on land resource control so as to secure sources of raw materials and improving

29
marketing and investments of surplus colonial capital. This would lead to eventual resistance of
the law marking the beginning of struggle for independence by the natives.
2.8.2 Post-Independence Period
The struggle for independence in Kenya revolved around land issues. However even after the
independence, the Kenyan government retained most of the colonial land laws and policies and
used them to govern land-use. The new constitution inherited by the independent government had
specific clauses aimed at safeguarding the interests of the settlers who opted to remain in Kenya.
This marked the beginning of the retention of colonial laws and policies and their entrenchment
to this day (ibid).
At independence in 1963, the government enacted the Registered Land Act, Chapter 300, which
was to govern land formerly under the customary law. This law, which was an incarnation of the
English law, encouraged individualization of tenure in line with the agronomic arguments
contained in the Swynnerton Plan.
Five years after independence, the Land Adjudication Act, Chapter 284 was amended to maintain
the status quo in the semi-arid areas, pastoralism. Thus, land individualization in these areas had
little success. Consequently, the enactment of the Magistrates Jurisdiction Amendment Act of
1981 stripped the Magistrate Courts in Kenya of the jurisdiction to hear and determine cases
related to beneficial ownership of land, the division and establishment of boundaries to land,
assertions to occupation or utilization of land, and trespass cases of certain land disputes. The
legislation vested the jurisdiction in councils of elders due to the perceived inability of courts to
handle disputes between registered proprietors and other unregistered claimants.
Several settlement schemes were established during this period to resettle the landlessAfricans
who had been displaced either during the colonial incursion or in the reform process. With the
assistance of the British government, the independent Kenyan government purchased land and
settled the landless. Some of the most elaborate schemes were the ‘million acre settlement
schemes’ located in the Eastern, Central, Rift Valley, Nyanza and Western Provinces of Kenya.
Through these schemes, over a million people were settled in holdings ranging from 10 to 40
acres (ibid).
2.9 The Constitution of Kenya, 2010
This is the supreme law that governs Kenya as a sovereign state as is articulated in article 2 (1).
In the introductory chapter, it defines the territory of Kenya. The constitution further outlines
national values and principles that bind all processes that make or implement public policy
decisions in the country. These include sustainable development which is also the ultimate

30
premise of land-use planning. The processes also need to abide by the principles of inclusiveness
and public participation.
2.9.1 The Bill of Rights
Article 42 on Bill of Rights stipulates right to a clean and healthy environment by everybody,
which warrants under clause (a) that the environment be protected for the benefit of future
generations through proper legislation and regulation. Article 43 (c) entitles every person to
adequate and quality food
2.9.2 Principles of Land Policy
Article 60 outlines the principles of Land Policy, which influence land-uses both at the national
and local levels. Key among them is equitable access to land, sustainable and productive
management of land resources and conservation and protection of ecologically fragile areas.
Article61 classifies land in Kenya thus determining planning interventions in view of the fact that
the same law guarantees property rights.
2.9.3 Regulation of Land Use
Article 66 provides for the State to regulate the use of any land and right over any land in the
country for defense, public safety, public order, public morality, public health or land-use
planning. Article 67 of the Constitution creates National Land Commission and gives it the
mandate to monitor and oversee proper land-use planning throughout the country under Clause
(h).
2.9.4 Minimum and Maximum Land Holdings Acreage
Article 68 (c) (1) provides for prescription of minimum land holdings for private land. Article 64
expounds the categories of private land as registered land held by any person under freehold
tenure; land held by any person under leasehold tenure and any other land declared private land
under an Act of Parliament
2.9.5 Constitutional Interpretation of Land
Article 260 on interpretation gives a wide interpretation of land to include the surface, water
bodies on and under the surface, marine waters in territorial sea and exclusive zone, natural
resources on and under the surface and the air above the surface. This broad definition of land
calls for ardent management measures

31
2.9.6 Role of Government in Land Use Planning
Section 21 of Part 1 and Section 8 of Part 2 of the Fourth Schedule emphasize the important role
Spatial Planning plays at the National and the County Level. Article 186 (1) and the Fourth
Schedule state that the role of the National Government is to provide policy guidance and setting
principles and standards, coordination of planning between counties, capacity building and
preparation of higher level plans. The County Government on the other hand is mandated to
undertake county planning and development as well as surveying and mapping at the county
level. Thus, the national planning outfit is mandated to formulate general principles of land
planning while county planning outfit is supposed to develop a framework for actualizing
national planning principles, including the preparation, approval and implementation of lower
level plans as well as budgeting for identified projects.
2.10 The Physical Planning Act, 1996
This is the main legal framework that guides land-use in Kenya. It provides for the preparation
and implementation of physical development plans and purposes related to physical planning.
Section 3on the interpretation of the Act defines what constitutes development of land. the Act
goes ahead to outline two classes of development namely class A and B development. Class A
development constitutes making any material change in the use or density of any buildings or
land including subdivision of any land. Additionally, Class B development comprises of putting
up new buildings or carrying out building works and operations.
The Act mandates the Director of Physical Planning to prepare two types of physical
development plans for purposes of guiding physical development at different levels. These are of
regional physical development plans for areas within the area of authority of a county council as
provided for under Section 16 of the Act and local physical development plans as per Section 24
of the Act. The regional physical development plans are aimed at large scale improvement of land
by providing for the proper physical development of such land, and securing suitable provision
for transportation, public purposes, utilities and services, commercial, industrial, residential and
recreational areas. Local physical development plans provide a detailed guide for coordinated
development of infrastructural facilities and services in urban centres in the short term or long
term, or for renewal or redevelopment of a particular area.
Section 30prohibits any person from carrying out development within the area of a local authority
without development permission granted by the local authority and provides a clear guideline on
how to address any non-adherence to the provisions.

32
2.11 The Land Act, 2012
This is a Parliament land-use rights that was established under the Constitution’s Article 68 to
provide a comprehensive framework for sustainable administration and management of land and
its resources.
Part Two and Three of the Act vests the mandate of managing and administration of public land
with the National Commission on behalf of both County and the National Governments. Part Five
of the Act vests the power to administer dealings on private land, both freehold and leasehold,
with the Cabinet Secretary. Such dealings include development applications for contracts for sale
of land, land transfers, charges, subleases, subdivision of land and approval of building plans.
Section 8 (1)(a) mandates the National Land Commission to identify public land, prepare and
keep a database of all public land, and to geo-reference and authenticate such land by the
statutory body responsible for survey. Section 11 mandates the National Land Commission to
protect and conserve ecologically sensitive public land by identifying such areas, demarcating
them and taking justified action to conserve them.
Part nine of the Act provides for establishment of settlement progammes by the national
government to provide access to land for shelter and livelihood. The settlement progammes are to
be administered in consultation with the Commission and the respective county governments.
The Act upholds the role of land use planning while undertaking the various forms of land
management and administration.
2.12 Urban Areas and Cities Act, 2011
The Act provides for three aspects that have profound impact on spatial planning namely;
classification of urban areas and cities, governance and management of such areas, and integrated
development planning. In terms of planning, the Act provides for preparation of two types of
land-use plans namely the County Spatial Development Plans (CSPs) and the Urban Spatial
Development Plans (USPs). These are long term physical development frameworks that shall be
prepared for the whole or part of a county to guide development and use of land; provision of
infrastructure and to coordinate sectoral initiatives.
The county spatial plans shall set out broad policies for urban development within the county.
Thus, they will be reference plans for urban spatial planning in term of defining the roles and
functions of the urban centres within the county, infrastructural requirement to support the roles
and functions as well as setting the urban growth limits and guiding population distribution

33
among the urban centres. The CSPs will draw policy direction from regional and national spatial
plans. The urban plans on the other hand will draw policies direction from the CSPs.
2.13 The County Government Act, 2012
The statute, which is established under chapter eleven of the Constitution provides for county
governments' powers, functions and responsibilities to deliver services. It mandates County
Governments to carry out planning functions at the county level. The Act under Section 103 (a)
stipulates that one of the objectives of county planning is to ensure harmony between national,
county and sub-county spatial planning. It therefore enhances a system of planning running from
national to local level.
2.14 The Environment Management and Co-ordination Act, 1999
This Act was enacted to provide an appropriate legal and institutional framework for the
management of the environment. The Second Schedule outlines projects that are considered to
have significant impact on the environment. They include, but not limited to urban development
projects; agricultural projects (such as large- scale production, use of pesticides, introduction of
new crops and animals, use of fertilizers and irrigation); processing and manufacturing industries
and natural conservation areas.
2.15 The National Land Commission Act, 2012
The Act spells out functions, powers and general administration of the National Land
Commission, which was established under article 67 of the Constitution. Section 5 (1)outlines the
core Constitutional functions of the Commission which include managing public land on behalf
of national and county governments, monitoring and overseeing land-use planning in the country.
And conducting research related to the use of natural resources and making recommendations to
various authorities.
Section 6establishes the powers of the Commission. Key among them is the power to take any
measures it deems necessary to ensure compliance with the principles of land policy as spelt out
in article 60 (1) of the Constitution.
2.16 The Water Act, 2002
The Act provides for the management, conservation, use and control of water resources and for
the acquisition and regulation of rights to use water; to provide for the regulation and
management of water supply and sewerage services. It specifically provides for establishment of
a State Corporation known as Water Resource Management Authority (abbreviated WRMA), and
the lead agency in water resources management.

34
2.17 Crop Production and Livestock Act, Chapter 321
This Act was enacted to make provision for the control and improvement of crop and livestock
production including the marketing and processing. Its subsidiary legislations establish several
orders for guiding agricultural production.
2.18 Land-Use Policies and Strategies
Initial land use policies in Kenya were largely sectoral. Lack of a comprehensive national land-
use and/or a national land policy led to the failure of the various government strategies on land-
use and human settlement due to conflicting provisions characterized by either overlaps or glaring
lacunas on land management. This resulted into a land administration system that is complex
(Republic of Kenya, 2009). It is not until the year 2009 that the government of Kenya enacted the
first comprehensive National Land Policy. The first National Land Use Policy (Sessional Paper
No1 of 2017) was prepared in the year 2016. Measures should be formulated and implemented
to ensure that future land use plans at the county level are a prepared in accordance to its
provisions.
2.18.1 The Kenya Vision 2030
This is a long term development blue print for the country for a period of 30 years. It envisages a
globally competitive and prosperous Kenya by the year 2030 by transforming her into a newly
industrialized middle income country providing high quality of life to all citizens and a clean and
secure environment the year 2030.
The policy identifies agriculture as one of the key sectors that shall deliver the envisaged 10%
economic growth rate per annum. This shall be achieved through promotion of innovative,
commercially-oriented, and modern agricultural sector and institutional transformation. The
policy identifies unsustainable land-use as one of the factors ailing the national economy. The
policy recognizes that current land-use practices in the country are incongruent with the
ecological zones where large portions of land in high potential areas have been subdivided into
uneconomic parcels, while some parts of land in the medium and low potential areas are rapidly
being converted into agriculture, despite their fragile environments. The policy proposes
comprehensive land-use planning in the country to counter this trend (Republic of Kenya, 2007).
Several flagship projects to aid the implementation of policy were identified. Key among them is
the preparation of a National Spatial Plan (NSP), a National Land-use Policy (NLuP) and an
Agriculture Master Plan so as to provide a national framework for utilization of land.

35
2.18.2 National Land Policy
The National policy on Land is aimed at addressing issues relating to land administration and
management. It identifies some of the major issues of land-use across the nation. These include
rapid urbanization, inadequate land-use planning, unsustainable production, poor environmental
management, inappropriate ecosystem protection and management. Other issues include land-use
conflicts as a result of competing land-uses, uncontrolled subdivision of land, indiscriminate sale
and purchase of land and overstocking in rangelands.
The Policy proposes inter alia the establishment of legal framework for periodic review of land
use practices so as to reorganize rural settlements and control excessive subdivision of land into
uneconomic units. It also proposes a mechanism of determining minimum land sizes based on the
productivity of land and ensuring conformity of land subdivisions to set minimums. In addition, it
advocates for the development of comprehensive and integrated land use policies for fragile
areas.
2.18.3 National Policy for the Sustainable Development of Northern Kenya and other
Arid Lands
Kenya launched a policy to guide the sustainable development of northern Kenya and other arid
lands in the year 2012. The policy was prepared to align the development of arid regions in the
country with the aspirations of the Kenya Vision 2030, particularly that of ensuring regional
balance. It formulation was premised on the fact that despite the arid areas occupying
approximately 89% of the Kenya Land surface, and are a home to 14 Million People, 70% of
livestock and more than 90% of the wild game, these areas are characterized by under provision
of services, inherent historical injustices and low population densities. It is evident that poverty,
inequality and insecurity in any area of the nation affect the entire nation. Also, accelerated
investment in previously neglected regions is necessary if all Kenyans are to have equal chances
of sharing in the promise and benefits of the Vision 2030.
2.18.4 Food and Nutrition Policy
The policy focuses on the production, storage and access to food by establishing strategic food
reserves. The current policy presents a paradigm shift of promoting uptake of balanced diet
throughout the country by establishing strategic food reserves, which departs from previous
policies that focused only on ensuring access to food by establishment of grain reserves.
2.18.5 Agricultural Sector Development Strategy 2010-2020
The strategy is aimed at achieving a progressive reduction in unemployment, poverty and food
insecurity. The strategy recognizes that the sector contributes about 26% of the GDP and 65% of
exports. It also recognizes that 31% of the High and Medium Rainfall areas, which account for

36
only 5% of the total land area of the country, are under crop production albeit most of this land
remaining idle. Other challenges include poor land-use practices where people engaging in
agricultural activities that do not conform to the specific ecological zones, insecurity of land
tenure as only a third of the country has been adjudicated, uneconomic land subdivisions, climate
change and low uptake of irrigation. Although the country has a high irrigation potential of 1.3
Million Ha, only 114,600 Ha are currently in use.
2.19 The Agricultural Policy since Independence
According to the Monitoring and Analyzing Food and Agricultural Policies Project (MAFAP),
2013, agricultural sector in Kenya has undergone three major policy periods since independence.
The first period, the post-independence aimed at ensuring the newly independent country was
self-food sufficient so as to achieve economic growth, hence the government made deliberate
interventions such as setting prices for commodities, intensifying government control on
agriculture and investing heavily on agriculture to ensure this. This strategy continued until 1980s
when the Structural Adjustment Program (SAP) compelled the government to embrace the free
market policy in its operations, hence the second period of liberalization. The government cut on
its direct investment on agricultural promotion and instead decentralized most of its operations to
the districts. The final period, the stakeholder participatory approach period was initiated in the
year 2001 as the government strived to recover from challenges caused by the SAPs. The period
is still in operation with an agenda of reducing poverty and ensuring economic recovery, wealth
and employment creation. Below is a summary of the periods.

37
Table 4: Agriculture Policy Periods since Independence
Period Strategy
Framework/Policy
Agenda
Focus Interventions Issues and opportunities
Post-
independenc
e (1963-
1980s)
Direct
government
intervention
1. Food self-sufficiency
2. Economic growth through increase in
productive land by promoting access to land
by many smallholders
a) Setting of farm-gate and
consumer prices for all
commodities
b) High public investment in
productive infrastructure - large
irrigation schemes and rural
roads
i. Intensified government control on agri. Sector
through production 7 marketing State
Corporations, boards and farmers cooperatives
ii. Poor governance of State Corporations
iii. Indebtedness and poor services to farmers
iv. Monopolized market structures leading to price
inefficiencies
Liberalizatio
n (from mid
1980s- early
2000s)
“Free market”
policy through
SAPs
1. Achieving food self- sufficiency
2. Liberalization
a) Industrial promotion - through
Industrial Transformation to the
year 2020 strategy
b) Privatization and deregulation
of agri. Sector
c) Reduction of trade barriers
d) Exchange rate adjustments
e) Increased decentralization
i. Collapse of govt. institutions
ii. Poor performance of sector
iii. Incapacity of private sector to take up and
sustain roles abandoned by govt.
iv. Exposure of un-capitalized farmers to market
forces
v. Shift in policy focus from agri. to industrial
development
vi. Liberalization of almost all commodities
Stakeholder
participatory
Approach (
2001
onwards)
Poverty
reduction
Strategy Paper
(PRSP)
1. Creation of wealth and employment
2. Ensuring food security
a) commercial, market oriented
and profitable agriculture
b) Reform and adaptation
c) Participation of both private and
public sectors in economic
growth(consolidation of
institutional , legislative and
regulatory reforms)
i. Revitalization of key institutions
ii. Diversification of production
Economic
Recovery for
Wealth and
Employment
Creation
1. Economic recovery a) maintaining macroeconomic
stability
b) strengthening institutions of
governance
c) rehabilitation of infrastructure
and investment on human
capital
i. Identification of agri. as one of movers of
economy (in addition to trade, industry and
tourism) Launching of Strategy for Revitalizing
Agriculture (SRA)
ii. Endorsing of Comprehensive Africa Agriculture
Development Program (CAADP) in 2003
iii. Joining of African Peer Review Mechanism
(APRM) in 2004
iv. Provision of ltd goods and services and reduced
range of regulatory functions by Govt
v. Modernization and mechanization of farm

38
Period Strategy
Framework/Policy
Agenda
Focus Interventions Issues and opportunities
structures
vi. Improvement of agri. infrastructure
vii. Increase in agri. services and improvement of
access to domestic and foreign markets
viii. Increase in national GDP from 0.6 to 7%
between 2003 and 2007
Kenya Vision 2030
(2008)
- Agriculture
Sector
Development
Strategy
(ASDS) 2010-
2020 (2010)
1. Food security and prosperity by 2020 a) Transformation of smallholder
agri. from subsistence to
innovative, commercially-
oriented and modern sector
i. Legal , regulatory and institutional reforms
The Constitution
(2010)
1. Devolution of government powers a) Creation of 47 counties and
separation of functions
National government
- Increased authority over
national policy issues
- Capacity building
- Finance and technical assistance
County govts
- Priority setting
- Financial management
- Agricultural production
- Extension services
provision
i. Separation of functions between the two levels
of government
Source of data: (MAFAP, 2013: 39-43)

39
2.20 Land-Use Changes in Kenya
Land-use in Kenya has changed swiftly over the last half a century. This has been characterized
by the rapid expansion of mixed crop-livestock systems into former grazing and other natural
areas, as well as the intensification of agriculture. The changes have occurred from a mix of
factors including land privatization and government policies, population growth and migration,
and changing national and international markets for crops and livestock products. In addition, the
natural disposition of national land resource has posed a big challenge in ensuring a vibrant
agricultural sector (Gachimbi et al 2007; Republic of Kenya, 2010 and 2012).
Increasing unemployment in the country partly due to rapid population growth and reduced job
opportunities coupled with increasing cost of living has forced many people to look for
supplementary sources of income. Majority of persons have resorted to various agricultural
practices, particularly agri-business as a survival mechanism. Production of various crop and
livestock varieties, including emergent ones is on the rise are in an effort to satisfy the expanding
market
According LUCID (2006), the trend of land-use change in Kenya could be categorized into two
aspects namely extensification and intensification.
2.20.1 Extensification of Land-Uses
In the past 50 years, there has been massive conversion of land in Kenya in form of expansion of
agriculture at the expense of grazing land. Prior to 1950, semi-arid and sub-humid areas were
predominantly pastoral with scattered settlement and cultivation. From the 1950s to the present
there has been significant transformation of grazing land to mixed crop-livestock agriculture. In
the recent past, the rate of agricultural land expansion has slowed in some areas while rapidly
expanding in others.
The variegated rate of agricultural land expansion has been influenced by economic, policy,
migration, population growth, availability of land for settlement and non-farm opportunities
LUCID (2006). At the same time, agricultural policies have tended to favor crop over livestock
production in terms of access to land, technical and financial support. More so, economic returns
from land under mixed crop- livestock systems are often higher than pastoral systems alone.
Adjudication and subdivision policies have facilitated the conversion of communal land to private
holdings resulting in conversion of production to crops as smaller holdings which cannot support
herds of animals. With expansion of farmland, communal land resources such as grazing areas,
fuel wood and medicinal herbs disappear. As land is converted, the patchwork of cultivation and
natural vegetation is replaced by private land. Meanwhile, former methods of promoting soil
40
productivity such as shifting cultivation and long term fallowing are abandoned. This sets in to
serious erosion and decline of soil fertility.
Extensification and continuous cropping has resulted to destruction of watersheds and other
natural resources through extraction of fuel wood, loss of communal pasture, woodlands and
grazing area as well as loss of soil productivity through conversion of bush to grazing fields.
Other issues include increased soil erosion, leaching and removal of vegetation through
continuous cropping.
2.20.2 Intensification of Land-Uses
Increased agricultural production or yield per unit area and time has long been viewed as a key
concept in various explanations of agricultural growth and change. Generally, long-term
population growth and economic development necessitate intensification and agricultural
transformation, although intensification and agricultural growth do not necessarily follow
population growth (Lambin et al, 2000)
According to LUCID (2006), rapid changeover towards sustainable intensive agriculture in
Kenya has occurred in the recent past. The transition is marked by demand for higher
productivity as farm sizes decline, family sizes increases and as the commodity market expands
or price for commodities rise. In addition, changes in soil and land management are evident.
These include soil conservation measures and modern soil fertility improvement measures. In
intensified production, high value crops receive higher inputs than lower value crops as well as
areas with strongest market links. The productivity enhancement techniques require substantial
labour and monitory investment by farmers, sometimes with extension services support by the
government, NGOs or State Corporations. In cases where this support has failed, farmers stop
using processed inputs for improving soil fertility or techniques for conserving soils and instead
revert to the use of organic manure and other cheaper methods of ensuring improved production.
Intensified systems are rapidly fluctuating as farmers respond to changes in prices of
commodities and markets, labor availability and government policies. This has led to boom and
bust cycles of exports of important cash crops such as tea, coffee, tobacco and horticultural
products. Farmers increasingly strive to meet the national urban market demand for various
higher end farm products such as fruits, livestock products, vegetables. The production of these
products is expanding to new zones, such as dairy farming to semi-arid areas and fruit farms to
former coffee zones. Irrigation of high value crops for urban or export market is rapidly
increasing.
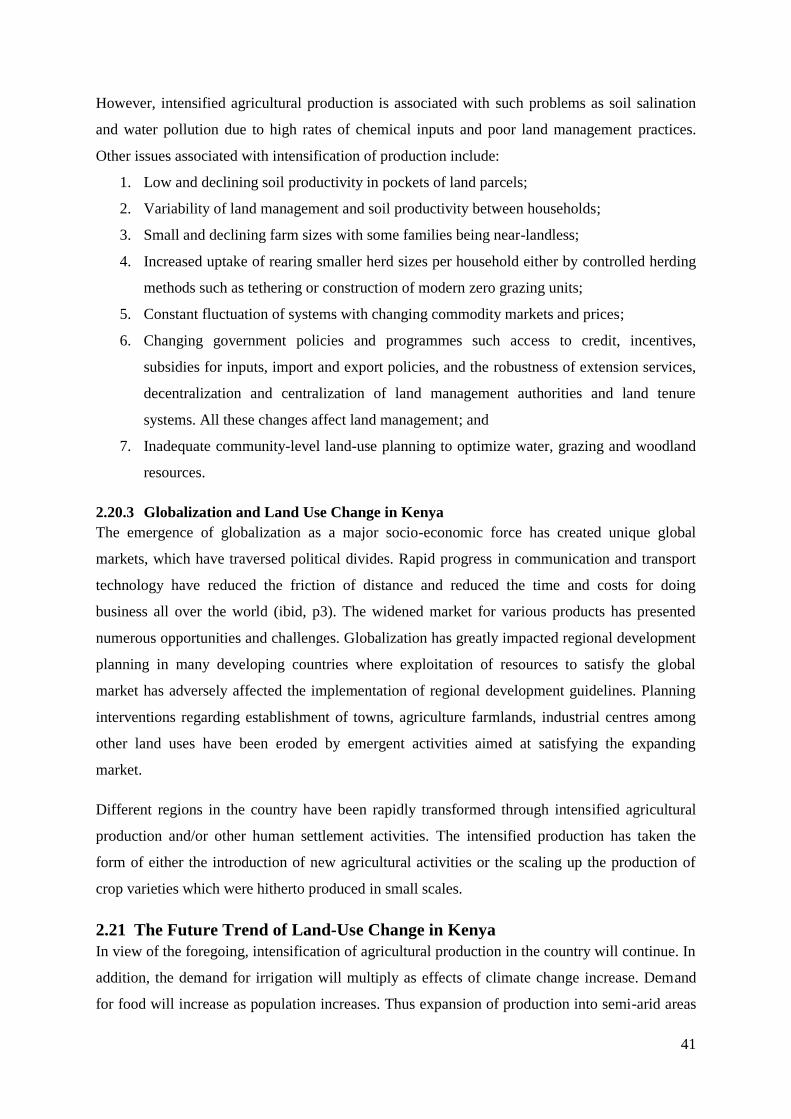
41
However, intensified agricultural production is associated with such problems as soil salination
and water pollution due to high rates of chemical inputs and poor land management practices.
Other issues associated with intensification of production include:
1. Low and declining soil productivity in pockets of land parcels;
2. Variability of land management and soil productivity between households;
3. Small and declining farm sizes with some families being near-landless;
4. Increased uptake of rearing smaller herd sizes per household either by controlled herding
methods such as tethering or construction of modern zero grazing units;
5. Constant fluctuation of systems with changing commodity markets and prices;
6. Changing government policies and programmes such access to credit, incentives,
subsidies for inputs, import and export policies, and the robustness of extension services,
decentralization and centralization of land management authorities and land tenure
systems. All these changes affect land management; and
7. Inadequate community-level land-use planning to optimize water, grazing and woodland
resources.
2.20.3 Globalization and Land Use Change in Kenya
The emergence of globalization as a major socio-economic force has created unique global
markets, which have traversed political divides. Rapid progress in communication and transport
technology have reduced the friction of distance and reduced the time and costs for doing
business all over the world (ibid, p3). The widened market for various products has presented
numerous opportunities and challenges. Globalization has greatly impacted regional development
planning in many developing countries where exploitation of resources to satisfy the global
market has adversely affected the implementation of regional development guidelines. Planning
interventions regarding establishment of towns, agriculture farmlands, industrial centres among
other land uses have been eroded by emergent activities aimed at satisfying the expanding
market.
Different regions in the country have been rapidly transformed through intensified agricultural
production and/or other human settlement activities. The intensified production has taken the
form of either the introduction of new agricultural activities or the scaling up the production of
crop varieties which were hitherto produced in small scales.
2.21 The Future Trend of Land-Use Change in Kenya
In view of the foregoing, intensification of agricultural production in the country will continue. In
addition, the demand for irrigation will multiply as effects of climate change increase. Demand
for food will increase as population increases. Thus expansion of production into semi-arid areas

42
will continue and will make additional people be prone to productivity declines. This shall also
present land management challenges on the already fragile land. This scenario calls for urgent
interventions to shield agricultural land, particularly in ASAL areas from excessive pressure of
accommodating more persons and supporting intensified production.
2.22 Influence of Macro and Micro-Economic Policies on Management of Land
From the foregoing, it is evident that macro-economic and micro-economic policies influence
how rural households manage and use land. There exist strong linkages between macro-economic
policies (such as monetary, fiscal, exchange rate, trade and employment as well as sectoral
policies (such as land, agriculture, forestry, population and the environment) as illustrated in
Figure 4.
The macro policies, which are defined at the planning level of the economy, influence the sectors
through tools and instruments such as markets, tariffs, subsidies, taxes and transfers. The macro-
economic policies are in turn partly influenced by political and socio-economic goals of
governments. Consequently, an institutional framework is established to operationalize the broad
policies both at the national and other lower administrative levels. The institutional framework
links both the macro and meso levels in defining strategies for operationalizing the macro-
economic policies. The conduct of business in all sectors is guided by some legislation (a set of
rules, regulations, Acts and Ordinances). Each sector interprets the broad goals in its operational
environment and this shapes the sectoral goals/ objectives, strategies and activities, all of which
constitute sectoral policies and action plan. The various sectors and households get their inputs
(land, capital and labour) from the markets (at the meso level). They in turn off-load their
production of goods and services at the market place.
The overall impact of macro-economic and sectoral policies has a bearing on decision making of
the people from households to traders, transporters and herders resident in a certain state or
region. The outcome of their decisions in turn affects the allocation and management of land, the
state of the natural resource base and the environment.

43
Figure 4: Policy Linkages in Land Management and Use Decisions by Households
Source: Benin S., (2003:126)

44
2.23 Theoretical Framework of Land-Use
Theoretical framework of the study was based on a systems approach to development as per the
model of development networks that exist between the rural areas and the universe. According to
this model, there are hierarchical and horizontal networks of development between rural areas
and the universe. The vertical networks represent the continuum of activities and socio-economic
linkages from the village, to the region, the nation and global level. The lowest tier in this
arrangement, the villages is linked in terms of trade and communication to the nearest small
towns and to a much lesser extent to the neighboring villages. Whatever happens at the village
level has ripple effects up the continuum and vice versa. The horizontal network on the other
hand develops within small regions and it comprises of the relationships (trade links, exchange of
commodities, information and innovation) that occur between several neighboring villages and
regional centres. Each village has assets that another village lacks and so villages complement
each other with their different potentials. The horizontal networks help to improve the living
conditions for rural residents.
Figure 5: Continuum of Human Settlements
Source: adapted from Einhard (2005:9) - A Short Introduction to Micro-Regional Planning

45
Figure 5 indicates that rural areas are important sub-components of a complex system that
stretches from the smallest village to the international mega polis. In this respect, land-use
activities in a particular rural neighborhood will have ripple effect on the economic growth of the
nation. At the same time, international, regional and national policies and marketing systems
affect operations in the rural areas in various ways.
2.24 Conceptual Framework
From the foregoing, it is evident that prevailing policies, to a great extent influence the choice of
land utilization by households. The configuration of agricultural-land use patterns in the country
can therefore be associated with the level of implementation of numerous land use laws and
policies that have been formulated over time to streamline national land use. The situation can be
streamlined by enforcing existing laws and policies, preparing land-use frameworks at various
levels and formulating new policies to manage emerging land use practices.

46
ACTORS
National Government through line ministries
such as Ministries in charge of Lands,
Agriculture, Environment, Trade and line
agencies such as NLC, NEMA, WRMA and
Regional Development Authorities
AGRICULTURAL LAND USE
PATTERNS
INDICATORS
Massive clearing of vegetation for
agri. activities
Urban development on agri. land
Increased use of marginal land
Intensified production
Importation of technologies from
dissimilar environments
DIRECT DRIVERS
Population growth
Technology advancement and changes
Infrastructure development
ACTORS
County Governments through line departments
such as departments in charge of Lands and
Physical Planning, Agriculture, Environment,
Trade
EFFECTS OF UNSUSTAINABLE
LAND USE
Loss of biodiversity
Environmental degradation
Undue pressure on fragile land
Land-use conflicts
Loss of livelihoods
POSSIBLE INTERVENTIONS
Formulation and enforcement of laws
on land use
Preparation and implementation of
landuse plans Formulation and enforcement of
policies on emergent uses of
agricultural land
Preparation and implementation of
agriculture development plans
Reclaiming degraded fragile lands
INDIRECT DRIVERS
Massive clearing of vegetation for
agri. activities
Land laws
Land markets
Land-use planning
Institutional structure
Figure 6: Conceptual Framework

47
2.25 Conclusion
Land- use change occurs in two major forms, conversion of land cover or modification of land
cover. Land cover conversion focuses on changes on land in its natural form due to human
activities while modification is based on changes that occur in management of agricultural land
due to changes of input levels and farming systems. Land use changes are triggered by several
factors including natural factors, human activities- particularly agricultural production and
urbanization, and government policies.
Both Macro- economic and micro- economic policies influence how rural households manage
their land. Households may change forms and scales of agricultural production, promote urban
growth or exploit natural resources in unprecedented scales as responses to the various pressures.
The reactive land use activities in turn have detrimental effects on the environment and on the
quality of life of the households. This necessitates conscious interventions by the government and
land users to remedy the impacts.

48
CHAPTER THREE: METHODOLOGY
3.0 Introduction
This chapter outlines the methodology employed in undertaking the research. Central to this
section is the research and sampling design, data needs and their sources, methods of data
collection, analysis and presentation. Both secondary and secondary data sources were used to fill
the various data needs derived from the study objectives. The researcher sought the clearance of
National Commission for Science, Technology and Innovation before embarking on primary data
collection.
3.1 Research Design
The study took survey study design where the researcher collected primary data on miraa
production in Mbita and Kirima sub-locations in Mbita and Kianjiru locations of Mbeti South
Ward as reported by individuals, producers, traders and key informants using various instruments
but mainly by administration of questionnaires. This was backed up by secondary data gotten
from review of literature.
3.2 Key Target Population
The study targeted households involved in miraa production, miraa traders in the two select sub-
locations and key informants drawn from various government offices such as the local
administration, the Sub-County Agriculture and Environment Offices in Kiritiri trading centre;
and the Regional Survey and Physical Planning Offices in Siakago town. In addition, an
interview was conducted in the former County Council of Mbeere office in Siakago town.
The interviews were guided by interview checklists and questionnaires. The household
questionnaires were structured to contain close-ended and open-ended survey questions while the
interview schedules for key informants were open-ended. This was to enable the researcher to
gather as much information as possible.
Before the actual data collection, two (2) research assistants were recruited to help in the process,
based on their experience in data collection. They were taken through a day training after which
they went to the field to for reconnaissance and to Pilot the instruments. This also aided the
formulation of the data collection plan.
3.3 Sampling Plan
Sampling frame or the persons to be interviewed, the sampling techniques to be used, the sample
size and type of data to be gathered were predetermined before embarking on actual data

49
collection. In addition, data collection instruments, data analysis methods and presentation
techniques were determined.
3.3.1 The Sample Frame
The study endeavored to collect data from all farmers engaged in miraa production in the entire
Mbeere South Sub-County. However, the study zeroed down to Mbita and Kirima sub locations
in Mbeti South Ward owing to their leading role in miraa production in the study area, and
resource constraints in terms of time and finances to conduct the study(See Figure 5). Further,
location factors such as the accessibility and the proximity to the main miraa collection and
transport routes were an important consideration for narrowing down to the two sub-locations.

50
Figure 7: Mbita and Kirima Sub-locations
Source of mapping data (shape files): Kenya National Bureau of Statistics
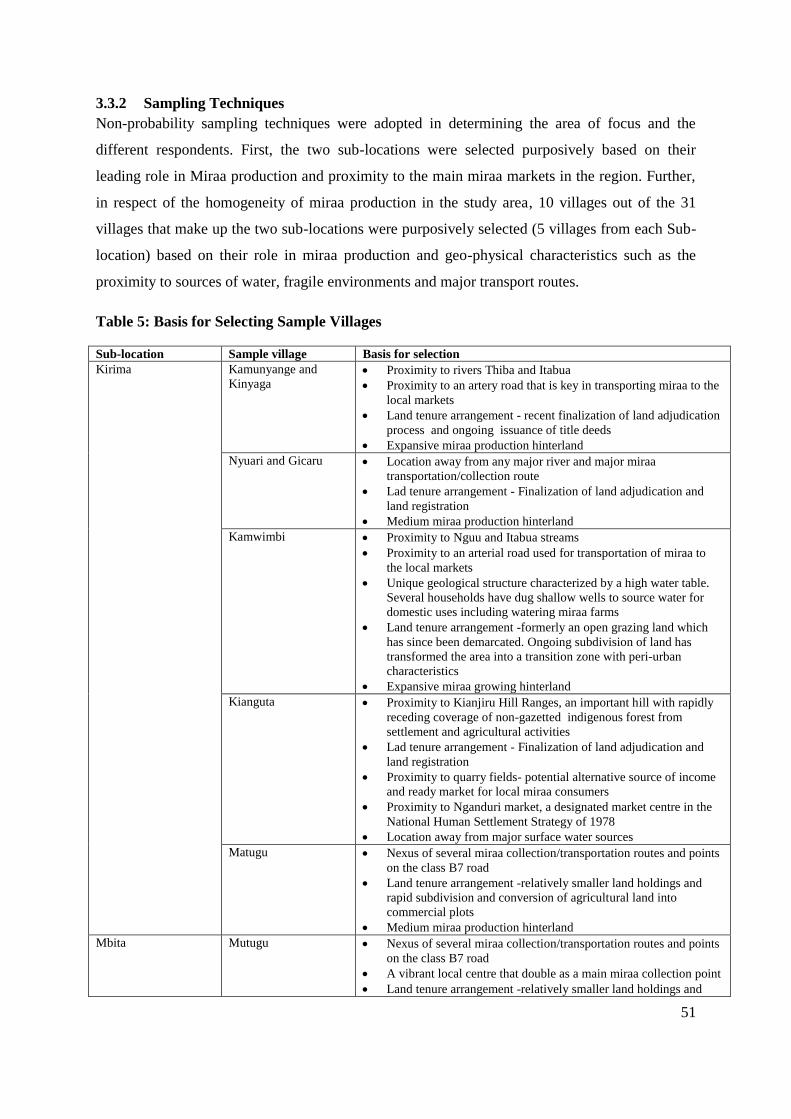
51
3.3.2 Sampling Techniques
Non-probability sampling techniques were adopted in determining the area of focus and the
different respondents. First, the two sub-locations were selected purposively based on their
leading role in Miraa production and proximity to the main miraa markets in the region. Further,
in respect of the homogeneity of miraa production in the study area, 10 villages out of the 31
villages that make up the two sub-locations were purposively selected (5 villages from each Sub-
location) based on their role in miraa production and geo-physical characteristics such as the
proximity to sources of water, fragile environments and major transport routes.
Table 5: Basis for Selecting Sample Villages
Sub-location Sample village Basis for selection
Kirima Kamunyange and
Kinyaga Proximity to rivers Thiba and Itabua
Proximity to an artery road that is key in transporting miraa to the
local markets
Land tenure arrangement - recent finalization of land adjudication
process and ongoing issuance of title deeds
Expansive miraa production hinterland
Nyuari and Gicaru Location away from any major river and major miraa
transportation/collection route
Lad tenure arrangement - Finalization of land adjudication and
land registration
Medium miraa production hinterland
Kamwimbi Proximity to Nguu and Itabua streams
Proximity to an arterial road used for transportation of miraa to
the local markets
Unique geological structure characterized by a high water table.
Several households have dug shallow wells to source water for
domestic uses including watering miraa farms
Land tenure arrangement -formerly an open grazing land which
has since been demarcated. Ongoing subdivision of land has
transformed the area into a transition zone with peri-urban
characteristics
Expansive miraa growing hinterland
Kianguta Proximity to Kianjiru Hill Ranges, an important hill with rapidly
receding coverage of non-gazetted indigenous forest from
settlement and agricultural activities
Lad tenure arrangement - Finalization of land adjudication and
land registration
Proximity to quarry fields- potential alternative source of income
and ready market for local miraa consumers
Proximity to Nganduri market, a designated market centre in the
National Human Settlement Strategy of 1978
Location away from major surface water sources
Matugu Nexus of several miraa collection/transportation routes and points
on the class B7 road
Land tenure arrangement -relatively smaller land holdings and
rapid subdivision and conversion of agricultural land into
commercial plots
Medium miraa production hinterland
Mbita Mutugu Nexus of several miraa collection/transportation routes and points
on the class B7 road
A vibrant local centre that double as a main miraa collection point
Land tenure arrangement -relatively smaller land holdings and

52
Sub-location Sample village Basis for selection
rapid subdivision and conversion of agricultural land into
commercial plots
Rich miraa production hinterland
Kamavindi Lad tenure arrangement - Finalization of land adjudication and
land registration
Rich miraa production hinterland
Relatively expansive farmlands
Proximity to reliable water source from Nguu stream
Kambiti Lad tenure arrangement - Finalization of land adjudication and
land registration
Proximity to Kiambita hill
Leading role in miraa production in the study area
Rich miraa production hinterland
Mbita Lad tenure arrangement - Finalization of land adjudication and
land registration
Leading role in miraa production
Proximity to Kiambita hill, a conservation area that has been
entirely converted into individual land holdings
Rich miraa production hinterland
Proximity to a water conservation interventions -earthpan and a
dam
Mukithi Lad tenure arrangement - Finalization of land adjudication and
land registration
Leading role in miraa production
Proximity to Kiambita hill
Rich miraa production hinterland
As the population of the study area is heterogeneous with regard to the uptake of miraa
production, probability methods of sampling could not be employed to sample the respondents.
Instead, the respondents were purposively selected based on their role in miraa production.
Selection of miraa traders was also done purposively whereby 10 traders were interviewed while
the criterion for the selection of Key Informants was based on the role they play in community
development, administration and resource management. A total of 8 key informants were
interviewed. These were the two Assistant Chiefs in charge of the sample sub-locations, the Sub-
County Trade and Markets Officer (in the former County Council Office), the Regional Land
Surveyor and Physical Planning Officer, the Sub-County Agriculture Officer, Sub-County
Environment Officer and Sub-County Water Engineer.
3.3.3 Sample Size
According to the 2009 national population census, the cumulative population of Mbita and
Kirima Sub-locations was 11542 persons comprising of 4684 and 6858 persons respectively.
Since the total population is greater than 10,000, an ideal sample size was determined using the
following formula by Mugenda O. and Mugenda A. (2003).

53
N= Z2 pq
d2
Where:
n = the desired sample size (if the Target Population is greater than 10,000)
Z= the standard normal deviation at the required confidence level (standard value of 1.96)
p = the proportion in the target population estimated to have characteristics being measured (0.5)
q = 1- p
d = the level of statistical significance (per cent margin error)
In the case of this study,
N= 1.962x0.5 (1-0.5)
0.072
N= 196
3.3.4 Sampling Procedure
Not all farmers out of the target population in the study area engage in miraa production. A
previous study on the impact of Khat Production on the income of Rural Households in Gachoka
Division of Mbeere South District, Kenya, by Njiru, Et al (2003) revealed that out of the 125
households sampled, 58.4% were miraa producers while 41.6 % were not.
Given this finding, resource constraints in terms of time and finances and the homogeneity of
miraa production in the study area, a sample size of 150 respondents was adopted, which
translated to the administration of 15 instruments per sample village. The sample size was
determined purposely based on the assumption it would be adequate to explain the dynamics of
miraa production in the study area and the fact that the study was geared towards answering
research questions specific to miraa production. In addition, the sample was considered optimum
in terms of efficiency, reliability and representativeness, in line with the argument by Kothari
(2004) that the sample size should neither be excessively large, nor too small, but rather
optimum. An optimum sample size is that which fulfills the requirements of efficiency,
representativeness, reliability and flexibility.
3.4 Types of Data and Sources
Undertaking this study necessitated collection of both secondary and primary data.
3.4.1 Secondary data
Secondary was gathered from reviewing existing literature on the changes in land-use and
universal and local policies and legislations governing land use. In this regard, published papers,
Journals, Acts of Parliament, Policies and Strategy Papers were reviewed.

54
General aspects of the study area such as location at the national, regional and local context,
population dynamics and physical characteristics of the area were determined. In addition, socio-
economic aspects such as social systems and cultural aspects, indigenous and modern economic
activities were captured.
A trend of land use practices in Mbeere region as a whole and specifically Mbeere South Sub-
County was done by reviewing various reports on general regional development and specifically
those on agricultural production. This helped in identifying the food and cash crops and the level
of production of each type of crop that has been grown in the area over time.
A review of literature on miraa production in form of documents (reports, scholarly work,
journals newspaper reports) and video captions as well as review of literature on implications in
other countries was also done.
Mapping data including administrative data was gotten from various authorities including the
Physical Planning Office, Survey of Kenya and Kenya National Bureau of Statistics.
The various aspects of secondary data gathered helped in developing.
3.4.2 Primary Data
Primary data needs revolved around household land use dynamics and miraa production data in
the sub-county as summarized in the table at the end of this section. Special focus was on the
types of crops grown at the household level, size of household land holdings, and the main driver
of uptake of miraa production at the household level. Monthly household income and expenditure
was also determined.
3.5 Methods of Data collection
Data for the study was sourced from secondary and primary sources.
3.5.1 Primary data collection
Both quantitative and qualitative data were captured during primary data collection so as to fill
the gaps identified during literature review and to ensure the diverse perspectives of the study
were captured so as to answer the research questions. The data was consequently analyzed and
interpreted.
The main primary data collection methods were interviews and instrument administration. The
interviews were undertaken at the household and key informants’ level. Selection of the key
informants based on their role in the community or region.
Photography was used to capture some of the observable scenarios.

55
3.5.2 Instruments of Data Collection
Several data collection instruments such as semi structured questionnaires, interview schedules
and observation checklist were utilized. Draft copies of the instruments were developed based on
the objectives of the study and subjected to a Pilot test. Question- sequence was taken into
consideration so as to ease the administration of the instruments and to ensure quality responses.
Triangulation principle was employed in several occasions to derive sensitive information.
3.5.3 Pilot Testing and Administration of Household Questionnaire
A few questionnaires were administered in order to evaluate feasibility, time, and cost of carrying
out the data collection as well to test the familiarity of the research assistants with the
instruments. Ambiguous, vague, repetitive and unnecessary questions were noted.
After the necessary adjustments, the revised questionnaires were administered based on the data
collection budget. A daily checklist for recording the number of instruments administered was
developed to ensure that data collection per each sample village was exhaustive.
3.5.4 Cleaning of Collected Data
After all the questionnaires were administered, the raw data was examined for errors and any
omissions and to correct the same accordingly. This entailed careful scrutiny of the
questionnaires and schedules to ensure consistency, accuracy, uniformity and exhaustiveness of
data gathered prior to coding and inputting.
This took place at two levels, in the field and during entry. In the field, technical shortcomings
were examined daily at the closure of business and clarifications made. Any emerging challenge
would be captured and dealt with accordingly. Contacts of the respondents were included in the
questionnaires or picked from key informants to aid in any future clarification.
During the inputting of data, methodological triangulation was adopted to capture information of
related questions in case of incomplete/doctored sections. Further, all redundant data such as
incomplete records, misleading data and incomplete sections was removed from collected data.
3.6 Organization of Data
For ease of undertaking input and analysis, data was coded and appropriate methods of
presentation determined.
3.6.1 Coding
Responses for each question were coded accordingly. This was aimed at making the
interpretation and classification of data easier and faster.

56
Quantitative data was coded and input into a personal computer. Qualitative data in form of
graphics, narratives or captions was stored in the personal computer using appropriate data
management software. Other qualitative data generated from interviews and discussions with key
informants was summarized before analysis.
3.7 Data Analysis
The analysis was carried out according to the study objectives. Spatial data was incorporated on
maps of the study area. A pre-analysis of data was undertaken. This involved a systematic
organization of raw data so as to ease the comprehensive analysis.
3.8 Data Presentation
Processed data (information) was presented both in written reports, maps and graphics.
Frequencies and percentages were calculated and presented in tabular and chart forms. Further,
descriptive reports were used to represent quantitative data of the respondents’ attitudes regarding
the production of miraa and utilization of land in the study area.
3.9 Ethical Requirements and Research Approval
Prior to undertaking data collection, the researcher sought clearance from the University and the
National Commission for Science, Technology and Innovation (NACOSTI).
Identification and/or clearance documents were availed during data collection. Adequate citation
of sources of secondary data, including mapping data was done. No information was gathered
without the consent of the respondent. Further, the researcher and the assistants upheld high level
of professionalism throughout the study period
3.10 Conclusion
The process of collecting quantitative and qualitative data from both secondary and primary
sources was objective. Data collection was based on the data needs derived from the study
objectives. The choice of sample villages and the two sub-locations of focus were purposely
selected based on their role in miraa production as well as the unique opportunities and
challenges they presented with regard to the research problem.
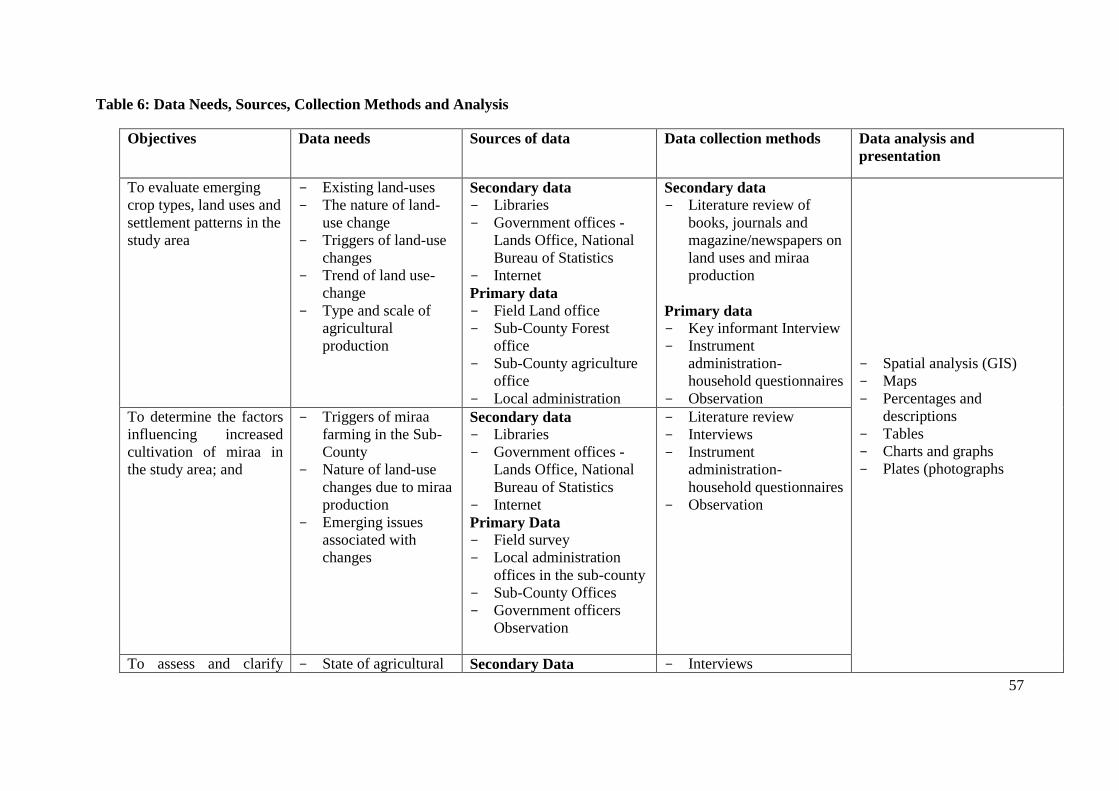
57
Table 6: Data Needs, Sources, Collection Methods and Analysis
Objectives Data needs Sources of data Data collection methods Data analysis and
presentation
To evaluate emerging
crop types, land uses and
settlement patterns in the
study area
- Existing land-uses
- The nature of land-
use change
- Triggers of land-use
changes
- Trend of land use-
change
- Type and scale of
agricultural
production
Secondary data
- Libraries
- Government offices -
Lands Office, National
Bureau of Statistics
- Internet
Primary data
- Field Land office
- Sub-County Forest
office
- Sub-County agriculture
office
- Local administration
Secondary data
- Literature review of
books, journals and
magazine/newspapers on
land uses and miraa
production
Primary data
- Key informant Interview
- Instrument
administration-
household questionnaires
- Observation
- Spatial analysis (GIS)
- Maps
- Percentages and
descriptions
- Tables
- Charts and graphs
- Plates (photographs
To determine the factors
influencing increased
cultivation of miraa in
the study area; and
- Triggers of miraa
farming in the Sub-
County
- Nature of land-use
changes due to miraa
production
- Emerging issues
associated with
changes
Secondary data
- Libraries
- Government offices -
Lands Office, National
Bureau of Statistics
- Internet
Primary Data
- Field survey
- Local administration
offices in the sub-county
- Sub-County Offices
- Government officers
Observation
- Literature review
- Interviews
- Instrument
administration-
household questionnaires
- Observation
To assess and clarify - State of agricultural Secondary Data - Interviews

58
Objectives Data needs Sources of data Data collection methods Data analysis and
presentation
emerging patterns of
land uses in the study
area.
production
- access to utilities(
water, energy)
- access to land
- settlement patterns
- condition of
infrastructure
- Land-use conflicts
- Literature review
Primary Data
- Sub-County Office
- Local administration
offices in the sub-county
including ward
administrators, chiefs
and sub-chiefs, police
and village elders
- Sub-County Land Office
- Sub-County
Environment Office
- Observation
- Households
- Observation
- Instrument
administration -
household questionnaires
59
CHAPTER FOUR: BACKGROUND OF MIRAA CULTIVATION
4.0 Introduction
Production of miraa (Catha edulis), which is known by various names including Africa salad,
Abyssinian tea, Bushman‟s tea, Kat, Gat, Miraa, Tohai and Chat has been practiced for eons
world over. The twigs and leaves of the tree are chewed for a stimulating effect, similar to that of
amphetamine. The twigs/leaves are famed for their ability to relieve fatigue, induce excitation and
confidence, and suppress hunger and sleep among the consumers.
This chapter gives an overview of global and local production of miraa with special focus on
miraa production in the study area. It draws parallels between miraa production and the
production of cotton and cereals, which are suited for the study area. It also draws lessons
from production of Jatropha (Jatropha curcas) as a high the value bio-fuel crop in Tanzania.
4.1 Global Production of Miraa
Miraa is native to the region spreading from Eastern to South Africa as well the Arabian
Peninsula (Sikiru et al., 1999). It has particularly been grown in the Horn of Africa in countries
like Djibouti, Eritrea, Ethiopia, Egypt, Somalia and Madagascar as well as in the Arabian
Peninsula. According to Fitzgerald (2009), miraa originated in Ethiopia before spreading to
Somalia, Kenya, Uganda, Tanzania, the Congo, Zimbabwe, Zambia, Afghanistan, Yemen and
Madagascar. Currently, the biggest global producers of miraa are Yemen and Ethiopia. Kenya
comes third in global production (O'Rourke, 2006)
Initially, miraa was produced at small scale and its consumption was confined within areas of
production as the twigs are highly valued only when fresh. Its potency deteriorates within 48
hours. This has however changed over years with the consumption spreading to other parts of
countries where it is produced and beyond as a result of advanced transport and storage
technology. Miraa is now transported by air to the United States, Europe, and Canada, in line
with the migration routes of immigrants from East Africa and southern Arabia (Bali, 1997 in
Aune, May 2003)
4.2 Local Production of Miraa
Locally, Miraa farming has been practiced for decades around Nyambene Hills in Meru County
and in other arid regions on the eastern side of the country (UNODCCP, 1999 and Carrier,2007).
Its consumption was initially restricted to select members of the society, mainly the elderly;
hence it was produced in small scale. However, this trend has changed with improved transport
system; roads, off-road and air transportation that have increased its global distribution. At
present, miraa is grown at a larger scale both for local and export markets. This makes it an

60
important cash crop providing employment to many people, farmers, middle men, business men
and transporters.
Currently, medium scale to large scale miraa production is practiced in Meru, Marsabit, Embu
Kajiado and Homa Bay Counties and is slowly expanding to other areas of the country (Figure
8). Analysis of the areas where miraa is grown in Kenya reveals similarity of climatic conditions.
The agro-ecological belt where miraa is grown stretches from Meru to the lower parts of the
defunct Eastern province. The Lower Midland (LM) belt, which comprises of agro-ecological
zones 3, 4 and 5, is ideal for production of cotton, millet and livestock (Jaetzold R., 2010).
However, the natural potential of these zones has been eroded over years, partly by climate
change and poor land management practices. The areas are currently characterized by recurrent
draughts and famines, reduced and erratic rainfall and declining rain fed production. These
factors have cumulatively compelled farmers to adopt new production methods and crop varieties
as a means of survival.
4.2.1 Onset of Miraa Production in Mbeere South Sub-County
Although small scale miraa farming has been practiced in Mbeere for decades, the scale of
production, the varieties grown and consumption patterns have changed over the years.
Initially, consumption was restricted to the elderly with majority of the consumers being men
and fewer women who were past the reproductive age. Currently, more potent varieties are
grown and the age bracket of the consumers has shifted from the aged to the youth and adults
within the reproductive bracket. The most popular varieties from Mbeere South Sub-County
include Muguka (a probable misconstruction of the Meru name, muluka,which means a big
thing- probably due to the size of leaves), Mukurukuru, Mutimutiri and Gitune. These
varieties are mainly grown for the local market as they are considered less potent compared
to varieties from Meru.
Increased diversification to miraa production in Mbeere South Sub-County can be traced
back to the mid-1990s, a period that coincides with the collapse of the cotton industry in the
country and the stabilization of the local market for miraa with influx of Somali nationalities
after the toppling of Major General Mohamed Said Barre, the president of Somalia by a
coalition of armed opposition groups. The rapid expansion of miraa production in the study
area has propelled the Sub-County to the second position in the country after Nyambene
Hills.

61
Figure 8: Miraa Producing Areas in the Country
Source of mapping data (shape files): Kenya National Bureau of Statistics

62
4.2.2 Agricultural Production in the Study Area Prior to Miraa Production
In terms of agriculture production, majority of residents of Mbeere South Sub-County
depended and still depend on subsistence farming, mainly livestock farming, fruit production
and food crop farming and reduced cash crop production.
4.2.2.1 Subsistence Production
Food crops include maize, millet, sorghum, beans, cowpeas; green grams, cassava and bananas
(Table 16). The Sub-County and the entire Mbeere region is also popular for free-range
production of livestock, mostly the indigenous breeds that are adapted to the marginal conditions
that prevails within that area. The main livestock types kept are cattle, goats, poultry and sheep.
Dairy cattle, exotic poultry, and dairy goats are reared in limited pockets (Gachimbi Et al,,
2007). Common varieties of fruits grown include citrus, avocadoes, grafted mangoes and paw
paws.
Agricultural production in the Sub-County/region has been on the decline in the last two
decades due to impacts of climate change that have resulted to erratic rainfall. Majority of
farmers have resorted to small scale irrigation of their farmlands, particularly for production
of high value crops. At the same time several local and regional research firms have
rigorously worked on development of drought and pest resistant crop varieties as well as
simple technologies aimed at enhancing production. Over 95% of the irrigable area is along
the five main rivers that traverse the region.
4.2.2.2 Cash Crop Production
Until recently, the two most popular commercial crops in the region were tobacco, which was
grown and is still grown in the northern region and cotton, which was grown in the entire
region but particularly in Mbeere South Sub-County. Sunflower has also been grown but on a
smaller scale than the former. The scenario has completely changed with the onset of miraa
production, which has gradually edged out the ancient cash crops.
Due to the few types of cash crops grown, several food crops such as cow peas, green grams,
and sorghum play a dual role of cash and food crops, upon the sale of surplus during good
cropping seasons (Ibid).
The rapid production of miraa compared to other crops that are suited for the study area could be
associated with its unregulated market, characterized by ready money upon sale of the twigs.
Until now, miraa market is free from government control and taxation. This contrasts the market

63
for cash crops formerly grown in the area that were marketed through Boards, which were
inefficient and subjected farmers to exorbitant credit facilities.
4.3 The Economic Value of Miraa
Universally, miraa is grown mainly for its versatility and higher returns compared to other crops
or livestock production. The plant is highly drought resistant compared to other crops making it
popular in arid and semi arid regions. The maturity period of the plant is 3-5 yrs, a relatively
faster rate compared to other tree plants . The quality of miraa depends on age, type of a miraa
tree and method of presentation. There are varieties that are highly esteemed than others. Leading
varieties from Nyambene in terms of quality include Giza, Colombo, Kangeta, Nyeusi (alsoblack
power, Ng’oileng or Ng’oa) and Gathaga. These varieties are marketed in form of twigs devoid
of leaves (they are stripped of leaves during grading). The difference between them depends on
the part of the tree where they were harvested, length and width. Lower quality varieties from the
region include Alele, Mbogua, Makata (a.k.a Macenge), Matonga, Liboi and Lombolio. These
varieties are marketted as a combination of twigs and leaves (Carrier,2007). The varieties of
miraa gorwn in Mbeere, namely Muguka, Mukurukuru, Mutimutiri and Gituneare mainly
marketed locally as they are considered less potent compared to those from Meru.
In terms of returns, it is recorded that in early 1970s, miraa was already giving farmers higher
returns than coffee, a factor that transformed it into the second revenue earner in Meru. The profit
margin was estimated at 30 per cent with miraa earning more that Ksh.. 2000 per acre per annum
while coffee earned about Ksh.. 1530 per acre per annum (Carrier,2007). Currently, it is
estimated that each miraa farmer has an average of 20 to 50 miraa trees in his farm and harvesting
is done in three-week cycles. With such number of trees, the farmer gets around Ksh. 50,000 per
harvest every 3 weeks (Samora, 2013).Over 9 tons of miraa are exported from Kenya every day.
This translates to approximately 60 tons in a week with an estimated value of 42 million shillings
Approximately 3640 tons are exported to UK alone per annum with an estimated value of
between Ksh. 1 billion and 2 billion (Kawira, 2013).
Apart from the direct revenue from miraa exports, airlines generate revenue from freight charges.
Miraa packaging and transport is rated among the leading earners of revenue in the packaging and
transport sector (Samora, 2013).
At the household level, miraa compensates for non-productive or non-profitable crop and
livestock production.

64
4.3.1 The Social-Cultural Value of Miraa
Although miraa remains a controversial crop, being classified either as a stimulant or a narcotic
drug in different circles, and its consumption often being associated with negative social and
health effects, its production has thrived in the midst of these controversies. The crop is
instrumental in transformation of lives of majority of residents of areas where it is grown. It is
both a direct source of livelihood and an important cultural crop. Like coffee and other beverages,
miraa plays an important role in the social life of people in regions where it is grown and
consumed (Gessesse, 2013).
Miraa plays a leading role in marriage celebrations, business and political meetings. The crop has
been incorporated in worship by some indigenous sects where it is even offered as first fruits and
tithe offerings. Culturally, miraa is an important component in marriage negotiations among
several Meru sub-tribes. A special variety of the crop is presented to elders during marriage
negotiations, as part of dowry by the family of the groom. In other instances it is set aside for
elders who might visit a home at any given time of the day. Recent media coverage on miraa
farming in Meru revealed several beliefs and cultural practices that surround miraa production,
some of which border overt witchcraft. These practices are meant to enhance production and/or
protect the crop or returns from the crop from thieves (Kawira, 2013).
Miraa production is labour intensive especially during pruning, fumigating with smoke or with
insectsides to eradicate pests, weeding and propping sagging branches. In cases of prolonged
drought, the trees require regular watering to sustain production. Further, harvesting, grading and
trasporting activities are also labour intensive. However, the level of labour involvement in miraa
production is much lower compared to other forms of production, making it an easy crop to grow.
Miraa production influences land tenure arrangements. For instance in Nyambene and Mbeere to
a large extent, land tenure initially favored access (land rights) rather than individual ownership.
Members of a particular clan were therefore allowed to cultivate in full range of zones from
lowest lying lands to the highest forested ones. However this has changed with population growth
which has necessitated demarcation of individual holdings. Efforts to adopt modern land tenure
systems aimed at consolidating and registering land was initially resisted in Nyambene until 1966
and eventually the adjudication process beginning in 1970s. There exist several arrangements of
land-use and renting crop for harvesting by middlemen upon maturity. These arrangements take
the form of short and long term contract which sometimes lead to conflicts due to disagreements
on payments. The price for hire often depends on the number and quality of trees or the expected
harvest over a period of time. This arrangement also enslaves farmers who find themselves

65
unable to win back the control of their land due to low prices offered making them vulnerable to
exploitation (ibid).
Miraa production and trade also influences the establishment and expansion of urban areas in
regions of its production. Miraa production in Nyambene Hills has influenced the development of
major urban areas in Meru County such as Kanjai, Muthara, Kangeta, Lare, Mikinduri and
Mutuati (all within the miraa growing zones). In addition, the production has enhanced
commercial activities in Meru and Isiolo towns and has transformed them into vibrant regional
commercial hubs.
4.3.2 Legal and Policy Framework for Miraa Production
To date, the national law on miraa is in limbo, neither supporting it nor disapproving its use.
Miraa production has continued in the absence of specific policy guidelines. Neither current nor
previous government policies on agriculture directly classified miraa as a scheduled crop.
Different regimes have viewed miraa differently. The repealed Agriculture Act, cap 318 only
recognized miraa as a special crop in one of its regulations.
On 17th June 2016, the government formed a taskforce to appraise the development of the miraa
industry in the country. The taskforce in consultation with farmers, traders and relevant
stakeholders was mandated to recommend strategies and interventions that will promote the
development of the miraa industry, including looking for markets and identification of initiatives
and interventions to be supported through allocation of funds by the government and
development partners. The taskforce was also to suggest institutional and administrative
structures for miraa value chain and additional production enterprises for miraa producers.
Following the recommendations of the taskforce, the government allocated one billion shillings
for promoting miraa production in the 2017 national budget estimates. This was in addition to
another 1.2 billion shillings that had been allocated earlier, and which the President ordered to be
released for improvement of the profitability of miraa farming in the country. Further, the
government is to establish a scientific study at the Kenya Medical Research Institute (KEMRI) in
collaboration with European Union in an effort to reverse the stance by several countries on miraa
as a narcotic drug (Mutambo, 2016); (Tom, 2017).
Until now, failure by the government to establish an authority to manage miraa production has
left farmers vulnerable to the boons and banes of the unregulated trade.The production, which is
usually in small scale, is dependent on the ability and aggressiveness of the individual farmer to
enhance household production. Farmers in Nyambene have been able to join efforts to establish a
marketing association, Nyambene Miraa Traders Association (NYAMITA) while those in Embu

66
County have formed Muguka Sacco. However, such initiatives are yet to be replicated in other
miraa growing areas in the country.
In Embu County, the county government has since developed a Bill to guide the enhanced
production of muguka variety of miraa grown in the county since the government declared miraa
a cash crop in the country through the Mediated Version of the Miscellaneous Amendment Bill
No. 2 of the Crops Act (Tom, 2017).
4.4 Value Chains of Miraa, Cereals and Cotton
Review of the value chains of miraa, cotton and cereals such as maize and sorghum, all of which
are suited for the study area reveals a weaker chain for miraa. Despite the three crops under
analysis employing similar inputs, the scale of engagement is different for maize and cotton
employing more people in plowing, provision of planting materials and supply of fertilizers
among other inputs. In addition, more persons are engaged in handling the main products and by-
products of cotton and cereal production than those engaged in miraa production. Finally, the
support industries and the final outlets of finished products for cotton and cereals are more
specialized compared to those of miraa production. Branding, marketing, and retail of products
for cereals and cotton is dominated by large organizations that specialize on products and price
(high-volume, low-cost discount chains). Majority of these organizations engender value by using
market insight, understanding (and shaping) consumer tastes, and efficiently fulfilling demand
through retail excellence.
To date miraa is mainly consumed in its raw form with little or no value addition. The quality of
miraa depends on age, type of a miraa tree and method of presentation. The most popular form of
value addition is packaging it in polythene or banana leaf wraps to avoid withering. Research for
processing miraa to produce juice, jam, marmalade and miraa “tea” bags is ongoing. Until the
findings of such research are finalized, the varieties of secondary industries that are supported by
miraa production are fewer compared to those associated with other cash crops and food crop
production. There however exist great potential for establishment of cottage industries in miraa
growing areas upon completion of research.
Existing support industries for miraa production do not necessarily process miraa twigs but
support the miraa market through provision of packaging materials, transport and hospitality
facilities for miraa traders. This deviates from the value chain of cotton and food crops whose
secondary industries consume by-products of the crop production and add value to them. More
so, the number of persons engaged in the affiliate industries of cotton and cereals is significantly
higher compared to that engaged in the miraa industry.

67
The figure indicates that the scale of miraa production is still reduced, a factor that favors it
among households with small landholdings. The main product (twigs) is directly sold to the local
and international market in raw form with the only elaborate support industries being the
packaging and transportation. At the local level, miraa trade attracts hospitality, retail and
wholesale activities.
Increase in no. of persons engaged
INPUTS
Fertilizers
Labour
Machinery/Farm
Equipment
Spare Parts
Agro-chemicals
SCALE
OFPRODUCTIO
N
MARKET
Direct Local
Sales
Export
SUPPORT
INDUSTRIES
Export
Wholesale and
Retail Shops
Hospitality
Packaging
Materials
Transport (Farm,
Local and
Export)
Small Scale
Producers
Figure 9: Value Chain of Miraa Production

68
Figure 10: Value Chain of Cotton Production
Source: USAID (2005:12) Value Chain Analysis: mapping maize, sunflower and cotton chains final report
NON TEXTILE USES
CottonSeed Users
Non textile Application
padding, stuffing, batting
Commodity
merchants
Cotton
seed
crushers
TEXTILE
MANUFACTURING
Textile
manufactu
ring
foreign
Yarn
Spinners
Foreign
Yarn
Spinners
Domestic
Textile
manufacturin
g domestic
COTTON PRODUCTS
Cotton
Growers
Gins privately,
owned, Coop.
owned, grower
owned
Warehouses
owned by
private
companies,
growers
groups and
textile mills
Cotton seeds
merchants
Traders
Lint
Lint
Cotton
seeds
INPUTS
Pesticides
/herbicides
Fertilizer products
Machinery and
equipment/ suppliers
Land owners
Seed producers
OTHER USES
To food processing
Special paper
producers
Animal feeds
producers
Soaps and
detergents
processing
Chemical
Manufacturers
To apparel
manufacturers
To household
furnishing
To other
industrial use
Increase in no. of persons engaged

69
Source: Source: USAID (2005:13) Value Chain Analysis: mapping maize, sunflower and cotton chains final report
INDUSTRY
PA
CK
AG
ING
MA
TE
RIA
LS
Export
Wholesale and
Retail
Confectionery
Hospitality
Animal Feeds
Energy
Building
Materials
PRODUCTS
Direct Sales
Export
Industrial
Milling
Animal Feeds
Building
Materials
Direct Local
Milling
Fuel
INPUTS
Researchand Extension
Fertilizers
Labour
Machinery/Farm
Equipment
Spare Parts
Agro-chemicals
SCALE OF
PRODUCTION
Large Scale
Producers
Small Scale
Producers
Cereal Silos
Imports
TR
AN
SP
OR
TE
RS
(FA
RM
, EX
PO
RT
S)
Increase in no. of persons engaged
Figure 11: Value Chain of Cereals’ Production

70
4.5 Implications of Bio-Fuel Crops Production in Northern Tanzania
Jatropha curcas can be described as a small deciduous tree or a large shrub native to Central
America that is grown for the production of bio-diesel, which is extracted by crushing the mature
walnut sized seed kernels (ibid). The pure plant oil (PPO) extracted from the seed kernels is used
in slightly modified diesel vehicles, water pump or generator engines. The oil can be refined
further to produce biodiesel for blending with ordinary diesel.
The tree, which is highly productive, is best suited for tropical climates. A mature Jatropha
tree/shrub grows to an average height of 3-4m. Its high productivity and drought resistance
abilities, requiring little irrigation makes it popular in marginal and less fertile lands. Thus, it
presents an opportunity for utilization of hitherto undeveloped or degraded land to produce bio-
fuel on. Furthermore, it is claimed to require little management, and is pest and disease resistant.
Further, the plant is less demanding in terms of capital inputs and labour (though this is not
supported by scientific proof), and is ideal for cultivation by smallholders in developing
countries.
Large scale production of Jatropha in Tanzania takes place in Northern Tanzania, in Manyara and
Arusha regions. Private companies produce the crop in their large farm as well as out-grower
schemes in the neighbouring villages. More so, several pro-jatropha NGOs are involved in rural
development projects in the region (ibid). The regions present different climatic and soil
characteristics as well as diverse production strategies among the different tribes that have
different cultural backgrounds. The climatic conditions range from medium rainfall potential
areas to low potential (semi-arid) conditions while the cultural practices range from sedentary
farming (mixed farming) on closely located farms on the higher attitudes to agro-pastoralism
(characterized by river-fed cultivation) on dispersed cultivated areas on the drier regions.
Although Jatropha was introduced in Tanzania many years ago, it was initially used for marking
burial sites. It later transformed into a boundary marker and a livestock barrier from cultivated
areas as it is inedible. Its resistance to drought is an important characteristic for its perpetuation.
Commercial Jatropha production in Tanzania like in other developing countries has mainly been
promoted for two reasons. First it stimulates cash income through the sale of seed for bio-fuel
production and other marketable products (such as soap) and secondly, it helps to raise the
standard of living through rural electrification and the manufacture of by-products such as soap,
lighting fuel and fuel-wood.

71
4.5.1 Positive Contribution
Jatropha offers treasured additional income to food crops, particularly in regions with harsh
environmental conditions that constrain agriculture and water availability. In addition, Jatropha is
utilized in different ways including lighting fuel and soap production, for fencing and as
windbreaks at the household level. It is also effective in combating soil erosion and
desertification on marginal lands.
The production of Jatropha has also led to the improvement of infrastructure, communication and
access to education in areas of production. Improved access to education is associated with
increased household incomes that translate to availability of school fees and other school
requirements.
Finally, the production has resulted to improved crop management practices such as adoption of
ox-plough, which is an effective labour saving device; application of manure; weeding; irrigation
(in drier parts); pruning and pest and disease control practices
4.5.2 Negative Contribution
Favoring of Jatropha over other forms of production leads to the displacement of local people
from their land as the cropland expands. Further, the production poses potential threat to
biodiversity through extension of agricultural production and mono-cropping resulting to “green
deserts”, and increased exploitation of soils and water resources. The degradation of environment
results to reduced food production leading to food security.
Jatropha production is not backed by specific laws and the existing legal framework is inadequate
to police sustainability across the supply chain. This makes its production risky especially among
smallholder farmers who are vulnerable to exploitation or displacement. Further, there is rapid
migration of labour to urban areas as more and more youths get educated, which in turn leads to
reduced production as farmlands are left to the elderly and children.
Jatropha, whose production is not restricted to the less productive lands, competes with other
crops for fertile land, leading to displacement of food crops. At the same time it competes with
livestock for grazing land resulting to reduced livestock production due to fodder shortage. There
could also be risks associated with intercropping the crop with other crops such as the spread of
pests and diseases or the possibility of toxic chemicals being transmitted to other crops.
Finally, no scientific evidence exists to prove that jatropha requires low labour inputs,, is tolerant
to pests and diseases compared to other crops, or that it does not pose a threat to food production

72
4.5.3 Lessons Learnt
Commercial cultivation benefits some members of the community while it exacerbates inequality.
This necessitates deliberate measures to reverse the trend and to promote sustainable production.
There is need to balance food production and cash crop production. It follows that unless non-
food crops are grown on land that is unsuitable for food production; they present the risk of
competition with food crops leading to scarcity of food and rendering commercial production
unsustainable.
Decisions that rural households make in utilization of resources including labour and land
determine if and how they adopt emergent production options and implications of emergent
products on local food security and socio-economic development.
Farm size is a key factor in determining the proportion of land that households dedicate to cash
crop production and the proportion dedicated to production of domestic crops. It follows that the
percentage of land dedicated to domestic crops is negatively correlated with farm size while the
percentage of land used for production of cash crops is positively correlated with farm size.
Households with larger farms can dedicate a larger proportion of land to cash cropping. Further,
the percentage of land devoted to cash cropping is significantly positively correlated with the
diversity of land use , which is measured by the number of crop types grown, while the portion of
farm devoted to domestic food production is closely linked to household production strategy.
Farmers with larger land holding are more likely to diversity their crops, and farm less
intensively.
The inability of smallholders to expand their farms in the face of the emergent commercial
production that is regarded valuable puts them at the risk of being ‘bought off’ their land by
foreign buyers or wealthy locals. At the same time, the households find it difficult in accessing
new agricultural land due to the customary systems of control, increasing demand for suitable
land and population pressure. While subsistence cultivation may offer the ultimate benefits to
rural households, it is not clear how the re-allocation of resources, such as capital, land, labour,
and water affects food production at the local level.
Within the existing land constraints, labour constitutes the principal input to farming and can
greatly affect production efficiency. Productivity and farm size are limited by the labour which
can be availed over peak demand times. The success of a particular commercial crop may be
constrained by the labour capacity of the household. Those with more land may have a lower
labour capacity per unit area hence may tend to neglect the commercial crop in favor of food
crops. Seasonal peaks in labour demand may be exacerbated for instance by weeding, pruning or

73
harvesting requirements while off peak labour productivity maybe experienced as rainfall and
soil productivity decreases.
The presence or lack of an enabling policy regime and the economic background in which
subsistence farmers operate may constrain or promote the feasibility of commercial crop
production. Commercial cultivation definitely benefits some members of a community while at
the same time it exacerbates inequality. This necessitates deliberate measures to reverse the trend
and to promote sustainable production.
There is need to therefore to balance food production and cash crop production. It follows that
unless non-food crops are grown on land that is not suited for food production; there is great risk
of unhealthy competition and negative impact on food availability.
4.6 Conclusion
The main impetus of miraa production is the lucrative returns. Local production of miraa,
which tends to dominate over other forms of production, remains highly unregulated. This
leaves its producers vulnerable to the market dynamics. Comparison of the value-chain of
miraa production and that of cotton and cereals that are suited for the study area revealed a
leaner chain. This coupled with uncertainties including lack of a clear policy framework and
regulated production makes the future of production unclear.

74
CHAPTER FIVE: THE STUDY AREA
5.0 Introduction
This chapter looks at the baseline information of the study area in terms of the location and
administrative contexts, physiographic data including environmental/ ecological resources,
population dynamics, socio-economic systems and culture. The section further looks at
indigenous and modern economies and agricultural production practices, the land tenure
system, land sizes and existing land use patterns.
5.1 Location Context
In the national context, Mbeere South Sub-County is found the larger Mbeere region of Embu
County. It is one of the two Sub-Counties that form the greater Mbeere Region. The region is
situated between latitudes 00° 37' 00" S and longitudes 37° 32' 00" E (Figure 12).It slopes
between 980 and 1220metres above the sea level.
Regionally, Mbeere South Sub-County borders Mbeere North Sub-County to the North, Kitui
County to the East, Machakos County to the South, and Kirinyaga County to the West and
Murang’a County to the South West as shown onFigure 13.
Mbeere South Sub-County is the larger of the two Sub-Counties measuring approximately
1,314.3 square meters which is equivalent to 62.8% of the total surface of the region. The
other sub-county- Mbeere North, measures approximately 777km2 (Republic of Kenya,
2009). Mbeere region falls within a region classified as ASAL.
Additionally, the two sample sub-locations are bordered by Mbeere North Sub-County to the
North, Kiambita, Kianyangwa and Kianjiru Hills to the East, Thiba River to the South, and
Itabua and Nguu streams to the West.
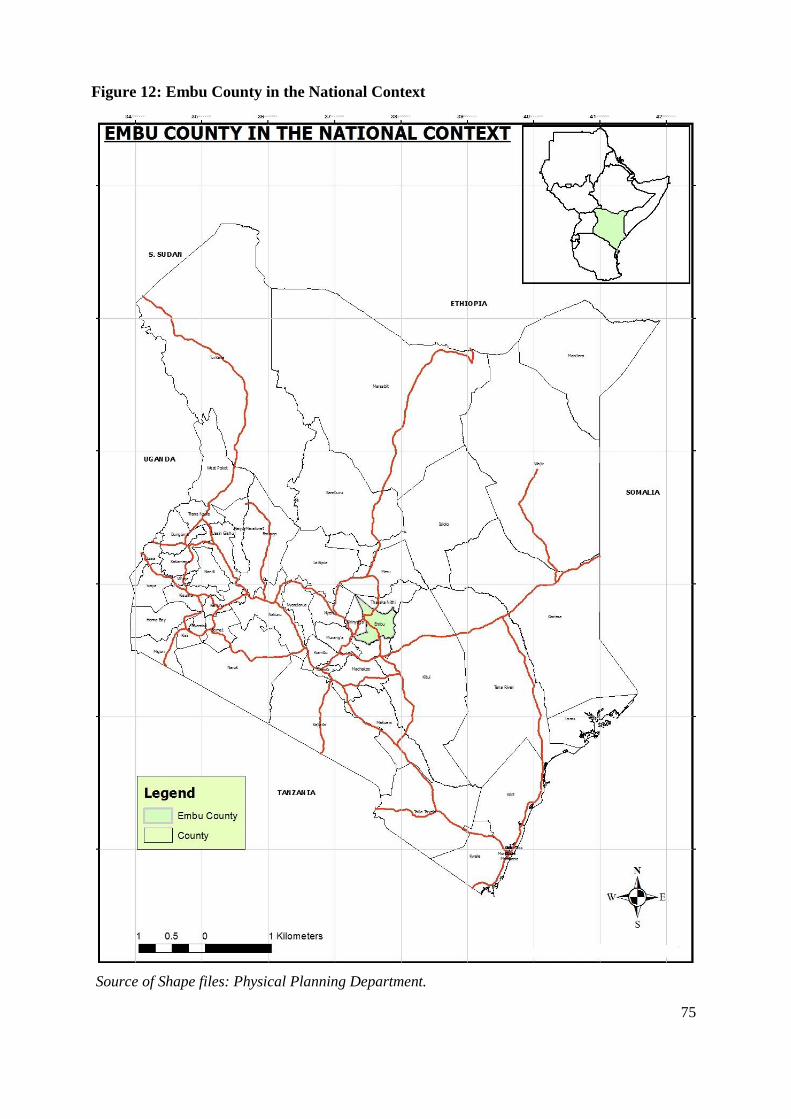
75
Source of Shape files: Physical Planning Department.
Figure 12: Embu County in the National Context
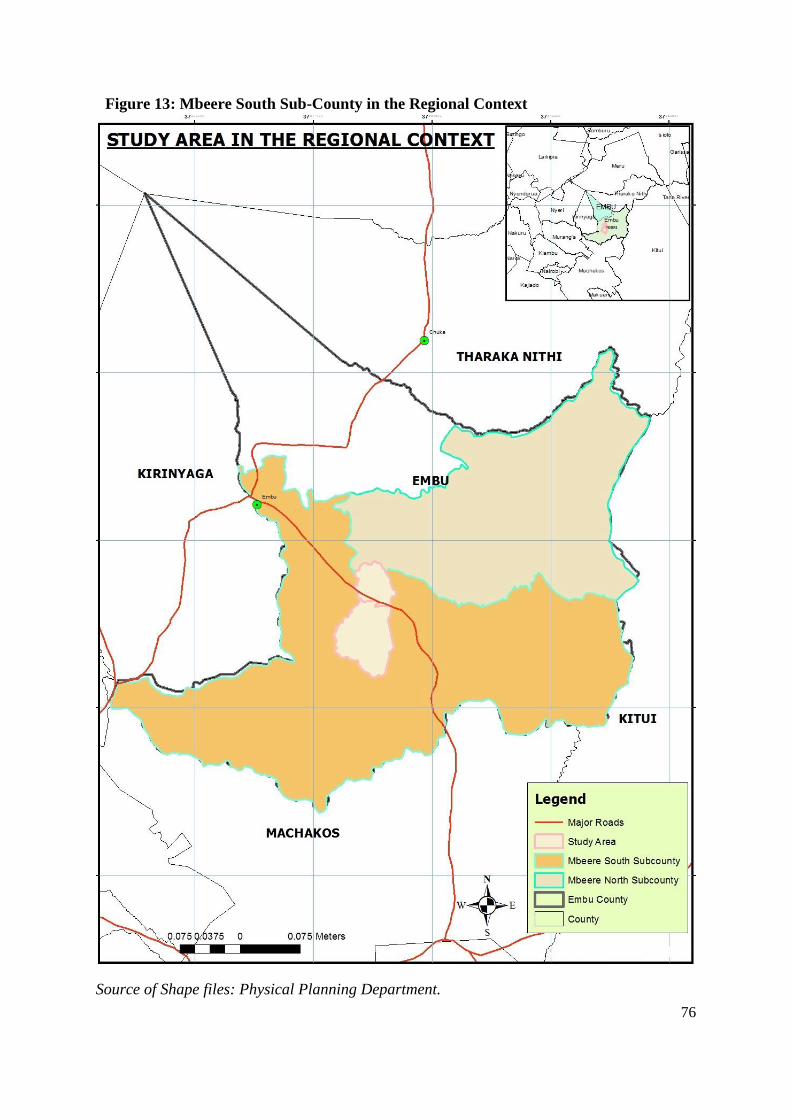
76
Figure 13: Mbeere South Sub-County in the Regional Context
Source of Shape files: Physical Planning Department.
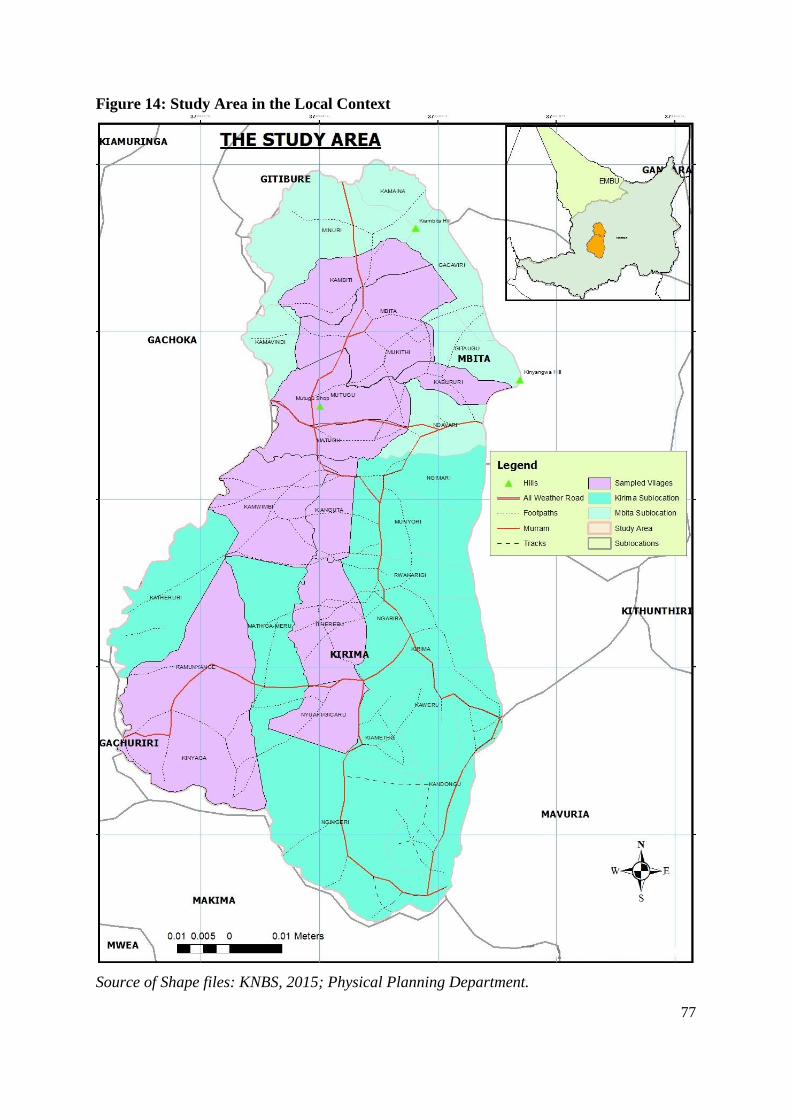
77
Figure 14: Study Area in the Local Context
Source of Shape files: KNBS, 2015; Physical Planning Department.

78
5.2 Physiographical Context
Mbeere South Sub-County like the rest of Mbeere region slopes from North West to South
East. However, the presence of the two hills alters the relief of Mbita and Kirima sub-
locations with the two sloping from East to West as shown in the drainage map. The altitude
of the Sub-County ranges between 980 and 1220 Meters above sea level. Kianjiru Hill rises
to an altitude of 1560 meters above the seal level (Njeru, 1978). This altitude is ideal for
commercial miraa production as optimal altitude for production of the crop ranges from
1500-2100 meters above sea level (Odenwald, 2007).
The Sub-County is served by three major permanent rivers that are Thiba, Tana, and
Rupingazi. There are also several streams in the Sub-County. The major streams within the
study areas are Itabua and Nguu streams. The rivers and streams are the key structuring
elements in addition to the hills and the Bitumen (class B7) road. They are also the main
source of water for domestic and agricultural production and form part of the local and
regional administrative boundaries. River Tana has been dammed for hydro-electric power
generation. The Sub-County hosts 5 of the Seven Folks dams. There are also several springs
particularly on the foot of the hills that dot the area.

79
Figure 15: Relief of the Study Area
Source of Shape files: Physical Planning Department.

80
Figure 16: Relief the Upland Parts of the Study Area
Source: Google Earth, Accessed on 16th June 2015

81
In terms of agro-climatic classification, Mbeere South Sub-County is one of the ASAL areas
in the country. ASAL regions are generally suitable for rangeland activities such as ranching,
agro-pastoral activities and wildlife conservation. According agro-ecological zoning, Mbeere
South falls between two agro ecological zones namely LM4 (Lower Midland Cotton Zone)
and LM5 (Lower Midland Livestock and Millet Zone). The zone is ideal for production of
livestock, cotton and subsistence farming of such drought resistant cereals as sorghum, finger
millet, green grams, cowpeas, fox tail millets and drought resistant maize varieties such as
Katumani composite (Jaetzold R., 2010). The area is also ideal for production of such
livestock as cattle, sheep, goats, donkeys and for beekeeping. The sub-county enjoys two
rainy seasons annually though the rains are both reduced and erratic. The annual rainfall
ranges between 600 and 800mm in the first season (March to September) and 300 and
500mm in the second season (October to February). Annual temperatures range between 200c
and 320c. July is the coldest month (200c) while September is the hottest (300c).

82
Figure 17: Agro-Ecological Classification of Embu County
Source: Adapted and Modified from Farm Management Handbook (2008:10)

83
The sub-county as the rest of the region has great potential for farming safe for the unreliable
rainfall. However, despite the region having great irrigation potential of approximately
1050km2, only 19.5km2 has been exploited as shown on Table 14 (Gachimbi et al, 2007).
Similarly, soils in the study area include strongly weathered upland soils, hill soils on the
hilly areas and dissected erosion plain soils on the river bends just like in 22other lower
eastern regions of the country. Specifically the soils include Ferralsols, Acrisols and Luvisols
derived from the dominating basement rocks and tertiary peneplains of eastern and
southeastern dry lands (ibid). The soil types are considered light to medium density and are
well drained but of medium to low fertility levels. The hill soils are stony and shallow. Most
of these soils, which are reddish in appearance with varying textures ranging from medium
grain to coarse grains (sandy soils) are ideal for growing dry cereals such as composite maize
varieties, bulrush millet and sorghum; legumes like Tepary beans, cowpeas, soya beans and
ground nuts. Further, the soils are ideal for such pasture and forage as medium savanna grass,
red oats grass and palatable shrubs. However, owing to their low fertility levels, the soils are
easily deprived of nutrients. They are also susceptible to erosion given their light density. The
nature of the soils, which range from shallow to deep but loose and rocky in some places
make them susceptible to agents of soil erosion . In addition the soils are of moderate fertility.
Thus they are easily overworked and degraded necessitating conservation measures and water
harvesting techniques to reverse degradation. The soils are however ideal for commercial
miraa production as the crop does well on soils with a low percentage of clay and medium to
high amount of total nitrogen, organic matter, phosphorus, calcium, potassium and
magnesium with a pH of 6.0- 8.0 (Odenwald, 2007).

84
Figure 18: Soil Types in Embu County
Source: Adapted and Modified from Farm Management Handbook ( 2008:21)

85
There is no designated forest in the Sub-County. There however exists a non-gazetted forest
reserve on Kianjiru hill which initially measured 10.04Km2 but is rapidly being depleted by
uncontrolled charcoal burning, logging and establishment of farmlands. Natural vegetation
comprises mainly of shrubs, thickets and woodlands on higher grounds like hills and along
rivers. Various species of wild animals are found in the Sub-County. These range from small
animals as rodents and reptiles to big ones like giraffes, antelopes, lions and elephants. The
Sub-County also hosts Mwea National Reserve, which measures approximately 42km2.
5.3 Administrative and Political Units
Mbeere South Sub-County was formed by merging the defunct Gachoka and Mwea
administrative Divisions. It is the larger of the two sub-counties, occupying an area of
approximately 1315.2 km2 or 62.9 % of the total area of the larger Mbeere region as shown
in Table 7 below. The Sub-County is synonymous with the former Gachoka Constituency of
the defunctcentral government structure. The Sub-County is subdivided into five
administrative Wards namely Mbeti South (where the study was conducted), Mavuria,
Kiambere, Makima and Mwea as shown on Figure 19.
Table 7: Administrative Units of Mbeere Region
Division Area (Km2) Percentage of the total
Evurore 410.0 19.6
Siakago 365.3 17.5
Gachoka 800.3 38.3
Mwea 514.9 24.6
Total 2,092.5 100.0
Source: Kenya (2000:12).

86
Figure 19: Political Units of Mbeere South Sub-county
Source of Shape files: Physical Planning Department
The study was carried out in two Sub-Locations of Mbeti South Ward namely Kirima and
Mbita Sub-Locations. Mbita Sub-Location is further subdivided into 13 villages while Kirima
Sub-Location has 18 villages (see Figure 14). The study concentrated on 10 villages, 5 from
each Sub-Location, which were selected purposely based on their role in miraa production.
5.4 Population and Demography
The entire Mbeere region is sparsely populated. According to the National Population and
Housing Census (Kenya, 2009), the population for the entire region was 252, 888 persons.
Among the administrative units, Mbeere South Sub-County is the third densely populated
after the Nthawa, Evurore and Muminji Wards, which collectively form Mbeere North Sub-
County. The sub-county has a density of 74persons/km2 as shown in Table 8.

87
Table 8: Population Characteristics of Mbeere Region
Division Male Female Total Households Density
(persons/km2)
Evurore 16,764 20,077 36,841 7,677 90
Siakago 16,656 17,674 34,330 7,852 93
Gachoka 28,772 30,330 59,102 12,905 74
Mwea 19,693 20,987 40,680 8,602 79
Total 81,885 89,068 170,953 37,036 82
Source: Kenya (2000: 16)
The population growth rate of the entire region is 2.3% per annum while the fertility rate is
5.9. The region has high poverty rate with approximately 63 percent of the entire population
living below the poverty line. Further, the population of the region is largely youthful with
15-30 years bracket constituting 60,312 persons and 6-13 years 53,388 persons in 2009, and
95,979 in 2012. The labor force of the larger region stands at 110,368 persons as shown in
Table 9. The youthful population puts a lot of strain on social facilities. In addition, it poses a
challenge of unemployment, low education levels, health and other social ills.
Table 9: Total Population and Demographic Factors of Mbeere Region
Population dynamic Statistic
Labour Force ( 15-64 Yrs) 110,368 persons
Life Expectancy M – 54 yrs, F- 59 yrs
Fertility Rate 5.9
Average Household Size 5.5
Total Households (No.) 37,036
Absolute Poverty 50.2 %
Unemployed Persons 70,000
Source: Kenya (2008:14)

88
5.4.1 Settlement Patterns
The distribution of population in the study area as in the larger region is highly affected by
environmental factors like proximity to permanent sources of water, soil types and altitude
and socio-economic factors such as land tenure arrangements proximity to transport routes,
community facilities and markets (Gachimbi et al, 2007). Dense population in the larger
region is found around major markets, along major transport corridors, permanent water
sources and in areas with productive soils and reliable rainfall (republic of Kenya, 2009).
Thus, linear population distribution is found along the class B7 Embu – Kibwezi/ Kitui road,
along Embu- Siakago, Siakago- Kiritiri and along Embu- Ishiara roads as well as in vicinity
of permanent rivers where land is irrigable and is easier to source water for domestic use.
Other areas of population concentration are in and around major shopping centres such as
Siakago, Ishiara, Kiritiri, Karaba and Gachoka. The Marginal Cotton Zone found on the
upper regions of the Sub-County and Nthawa Ward is also densely populated. Finally, areas
where land adjudication process has been finalized are more densely populated than those
where the process is yet to be finalized.
5.5 Social System and Culture
Traditionally, residents of Mbeere region, which is semi-arid in nature were pastoralists and
depended on herding livestock production (mainly cattle and goats) and bee keeping
(Mwaniki, 1973:8). Reduced shifting cultivation was only carried out in a few areas with
relatively good rainfall. The cultivated areas were planted with traditional drought resistant
varieties of cereals such as maize, sorghum, millet, beans, green grams, chick peas, cow peas
and pigeon peas and root crops under shifting cultivation. Shifting cultivation promoted the
replenishing of soil nutrients in the abandoned pieces of land as farmers moved on to other
virgin and more fertile parcels of land.
Socially, the Ambeere were organized in extended family set up in form of clans and
nyomba. Members of a particular clan or nyomba settled close to each other. Access to
resources, particularly land and livestock followed patrilineal lineage (ibid).
5.6 Indigenous and Modern Economies
Sources of livelihood for Ambeere have tended to revolve around pure pastoral and sedentary
pastoral activities. Intensification of land use over time coupled with population growth has
expanded the array of economic activities undertaken by households.
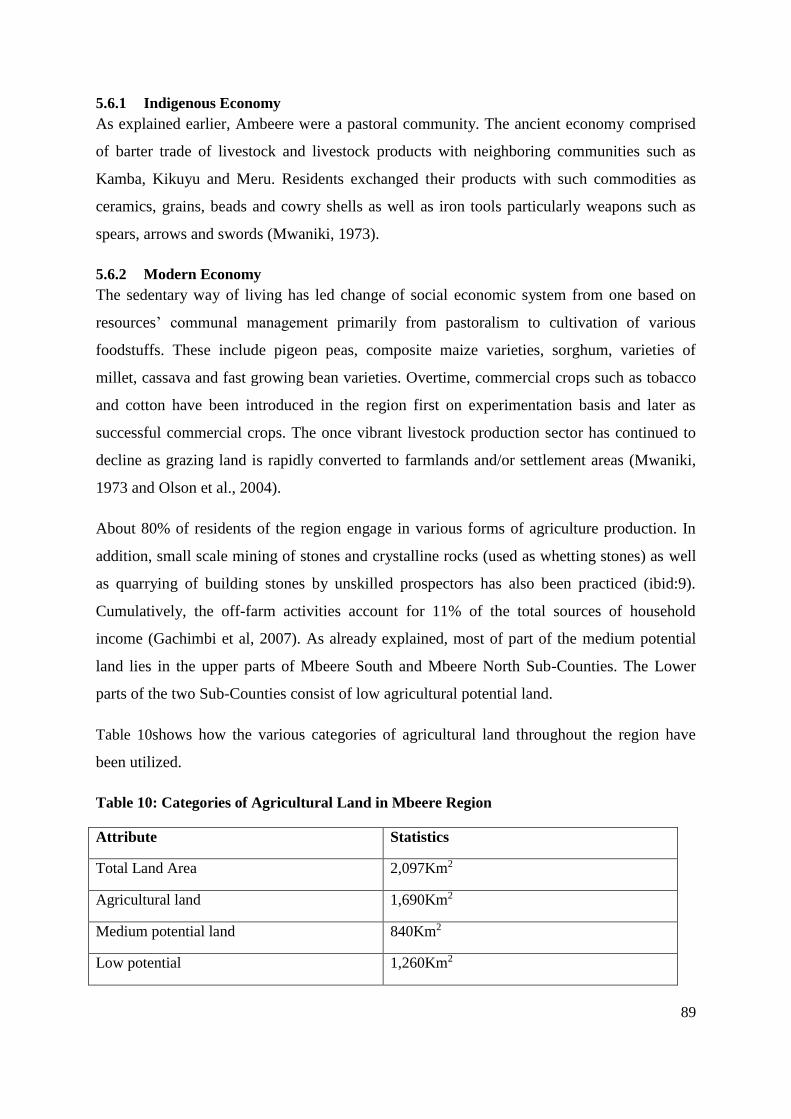
89
5.6.1 Indigenous Economy
As explained earlier, Ambeere were a pastoral community. The ancient economy comprised
of barter trade of livestock and livestock products with neighboring communities such as
Kamba, Kikuyu and Meru. Residents exchanged their products with such commodities as
ceramics, grains, beads and cowry shells as well as iron tools particularly weapons such as
spears, arrows and swords (Mwaniki, 1973).
5.6.2 Modern Economy
The sedentary way of living has led change of social economic system from one based on
resources’ communal management primarily from pastoralism to cultivation of various
foodstuffs. These include pigeon peas, composite maize varieties, sorghum, varieties of
millet, cassava and fast growing bean varieties. Overtime, commercial crops such as tobacco
and cotton have been introduced in the region first on experimentation basis and later as
successful commercial crops. The once vibrant livestock production sector has continued to
decline as grazing land is rapidly converted to farmlands and/or settlement areas (Mwaniki,
1973 and Olson et al., 2004).
About 80% of residents of the region engage in various forms of agriculture production. In
addition, small scale mining of stones and crystalline rocks (used as whetting stones) as well
as quarrying of building stones by unskilled prospectors has also been practiced (ibid:9).
Cumulatively, the off-farm activities account for 11% of the total sources of household
income (Gachimbi et al, 2007). As already explained, most of part of the medium potential
land lies in the upper parts of Mbeere South and Mbeere North Sub-Counties. The Lower
parts of the two Sub-Counties consist of low agricultural potential land.
Table 10shows how the various categories of agricultural land throughout the region have
been utilized.
Table 10: Categories of Agricultural Land in Mbeere Region
Attribute Statistics
Total Land Area 2,097Km2
Agricultural land 1,690Km2
Medium potential land 840Km2
Low potential 1,260Km2

90
Attribute Statistics
Potential irrigation area 1,050Km2
Irrigated area 19.5Km2
Total arable land 994.9Km2
Total area under crops 400Km2
Source: Kenya (2008:14)
5.7 Land Tenure
Traditionally, land in Mbeere was viewed as a plentiful resource for all. In 1950s and 1960s,
the entire Mbeere region was sparsely populated and was covered by bush or grasslands that
were used for raising large herds of goats and cattle The Ambeere were originally pastoralists
who kept large herds of animals and subsistence shifting cultivation was practiced as a
supplementary economic activity. Since land was communally owned, it was easy to move
around in search of pasture and the shifting cultivation gave land time to recover making it
less degraded (Olson et al., 2004).
Individuals or family groups would claim pieces of uncultivated land clear it and establish
farms. Pasturage was also freely available. Once land was claimed, it remained
unchallengeable within the founding patrilineal lineage, although an individual could pledge
his piece of lineage land in exchange for livestock or some other value. The pledge was
redeemable because an individual could regain his land on repayment of what he had
received in exchange. Lineage land was heritable by male descendants. A woman could not
inherit lineage land but was allocated gardens by her husband from his own lineage property.
This pattern was altered dramatically during the colonial period when land became a
commodity, convertible into cash and controlled increasingly by individuals rather than
groups. This new outlook continued in the independent government and gained legal sanction
through registration.
The advent of land adjudication in Mbeere region in 1970s and 1980s led to apportioning of
land to individuals except protected areas and steep hillsides. Even sacred groves were lost in
the process. Much of the former lineage land in Mbeere South has been adjudicated and the
owners issued with freehold titles apart from a few areas in Mbeti South and Mavuria Wards.
With land adjudication, clan elders lost their land allocation authority and much of their

91
powers. The constraints previously exercised by the lineage of an individual on the use or
disposition of land are now greatly diminished.
The adjudication of land has led to rapid fragmentation of land and conversion of bush land
into farmlands. For instance, between 1950 and 1982, landscape in lower Mbeere region was
converted from 60 % bush and woodland to only 15% bush and woodland by 1995. Further,
84 % of the land was converted into cropland (Ibid). Remaining pockets of public land in the
Sub-County include public institutional land, wildlife conservation areas and strategic
government installations like the Hydro Electric Power (HEP) generation dams. At the
moment, the allocation of the former Mwea Settlement Scheme in the neighbouring Mwea
Ward to resident communities is ongoing.
5.8 Existing Land use Patterns
Land-use change in Mbeere South Sub- County portrays a similar trend as that of the rest of
the country. The Land Use Change, Impacts and Dynamics (LUCID) study in the year 2004
revealed that intensification of agricultural production in the Sub-County has been on the rise
since the year 1961 as shown on Figure 20.
Figure 20: Land-use Change around Kiritiri Between 1961 and 2001
Source: LUCID Project Working Paper No. 20, (Olson et al., 2004: 16)

92
The figure above shows that farmland has steadily expanded over the period in review.
According to the paper, land use change in Mbeere region can be classified into five main
periods. In 1950s, which coincides with the taking of the first aerial photos and the onset of
the Mau Mau revolt against the British Colonial Government, the region was mainly covered
by grassland and woodland with a few patches of shifting cultivation. The economy then was
based on livestock herding, particularly goat rearing. The 1970s saw the expansion of
cultivation into pasture as promotion of cotton as cash crop by the government occurred.
Around the same time, use of ox plough was popularized encouraging tilling of larger tracts
of land. The 1980s coincided with initial intensification of production near settlements even
as land adjudication by the national government from clan land(communal) to family private
land holdings set in. this led to transition from ancient shifting cultivation to fixed farming
marked by rapid bush clearance, fewer animals and economy changes . The last period, 1990s
to date saw further intensification of production in the region. More and more farmers shifted
from herding animals to permanent cultivation of crops or short fallows of seasonal crops.
This period is also characterized by rapid loss of woodland and in their place planting of
exotic tree varieties, and some soil management methods such as application of organic and
inorganic manure, soil erosion control. The period is also associated with limited wealth from
crop production and high poverty rates. There is marked outmigration and income
diversification in off-farm activities in major urban areas by fathers and children.
The observable changes in land use in Mbeere South Sub-County like in other regions could
be attributed to several factors. Although demographic factors such as natural population
increase and influx of persons from the surrounding medium and high potential areas as well
as migration to look for land or alternative employment are seen as the main causes of this
change, government land policy through land adjudication and conservation, changing
enforcement of regulations, political stability, infrastructure investment as well as promotion
of cash crop economy are the main driving factors (Oslon, 2004).
Economic factors are also key to land use change. On one hand, changing relative labor and
economic returns to crops vs. livestock, to farm vs. non-farm activities affect land use
options. On the other hand, changing markets for local products such as maize, timber,
charcoal, miraa and horticultural products as well as availability of off-farm employment also
affect land use.

93
Social/cultural factors such as the power of customary systems (such as council of elders or
clan elders) to families, changing gender roles, wealth differences or literacy levels also
affect how households utilize their land.
Finally, location factors such as remoteness or marginality an area as well as environmental
factors affect land use. For instance, unreliability of rain in Mbeere region in the last 5
decades has significantly affected rain-fed production. The erratic rains have caused recurrent
droughts sometimes resulting to total crop failure (Republic of Kenya, 2009). At the same
time, there has been wanton clearance of indigenous forests and woodlots for wood fuel. At
least 41.5% of residents in Mbeere region are still dependent on building materials derived
directly from the forests and woodlots such as posts, wattle and grass thatch (Republic of
Kenya, 2009 and Olson et al., 2004). The situation is exacerbated by emergence of land-use
practices such as commercial crop production and horticultural farming in the region and in
neighboring counties which consume huge amounts of posts and pegs for propping climbing
vegetables and fruits. The declining rain-fed production in the Sub-County has compelled
residents to adopt other ways of survival.
The ongoing reduction of farm lands has forced people to engage in various off- farm
activities such as trade, quarrying and sand harvesting and cottage industries such as weaving
sisal ropes and baskets (Republic of Kenya, 2009). Cumulatively, the off-farm activities
account for 7% of labor while agriculture accounts for 92% of labour and the remaining 1%
comprises of labour force and disguised unemployment level and the that has migrated to
neighboring regions (ibid). In terms of maximizing returns from agricultural production,
farmers have resorted to production of high value crops such as fruit and small scale
horticultural production by simple irrigation. In the recent past, there has been adoption of
commercial production of miraa as one of the high value crops in the Sub-County (Njiru et al,
2013).

94
5.8.1 General Land-use Pattern
Presently, the land resource in Mbeere region has been put into various uses.
Table 11: Land-uses in Mbeere Region
Attribute Statistics
Total land area 2,097KM2
Total population 252,888 Persons
Population density 82 Persons/Km2
Game reserves(Mwea National
Reserve)
42Km2
Large scale farms 20.55Km2
Small scale farms 1,980Km2
Forest land(non-gazetted forests on
hills )
37.7KM2 - Kiang’ombe 21.04Km2, Kianjiru
10.04Km2 and Kiambere 6.34 Km2
Source: Kenya (2009: 17)
5.8.2 Transport Network
Mbeere region is satisfactorily served by arterial roads, majority of which are in poor
condition. Until in the last 3 years, the entire region had only one bitumen road, the class B7
road from Embu to Kibwezi through Kitui. The other roads are murram, gravel or loose
surface. Below is a table showing the condition of roads in the district in the year 2009.
Table 12: Condition of Roads in Mbeere Region
Area Length of road(kms)
Murram Bitumen Gravel Earth Total
Siakago 6 84.8 141.4 232.2 464.4
Gachoka Nil 72.0 49.6 192.8 314.4
Mwea 150 - 35 57 92
Evurori 210 - 32 57 92
Source: Kenya (2008:16)

95
The road network in Mbeere South sub-county is adequate although the condition of the
roads is poor. The network comprises of several classified and non-classified roads. The
classified roads include Classes B7, C, D and E. although class B7 road has bitumen surface,
its condition and signage are poor on several sections resulting to numerous fatal accidents.
Other challenges associated with the transportation sector include poor maintenance in terms
of grading, de-silting open drains and culverts and construction or repairing dilapidated
bridges. The poor condition of roads greatly affects the transportation of farm produce and
people and the access to social services.
Plate 1: Dilapidated Sections of an Access Road in Kamwimbi village
Mbeere region is not served by an airstrip though there is one at its border with Embu
Municipality.
5.8.3 Communication Services
Telecommunication and postal services in the region are underdeveloped and inadequate. By
the year 2009, the cell phone network coverage was at 50% while the number of households
with radio was 18,087. There was no single cyber café (Kenya, 2009). This scenario could be
attributed to reduced distribution of electricity in the region.
There are several communication installations in the sub-county. These include Cellular Base
Stations (boosters) and telecommunication masts.

96
5.8.4 Other Services
Provision of other services such as health and education is also not satisfactory. For instance,
the region has 2 hospitals, 2 health centres (one in the sub-county) and 28 dispensaries. The
Doctor-Patient ratio stands at 1: 57,000 while the average distance to a health facility is 15km
(Kenya, 2005).
Finally, the region is water deficient with only 40% of inhabitants having access to portable
water. Ground water resources have low yields and are saline owing to the basement rock
system. Lack of water adversely affects livestock and crop production.
5.8.4.1 Institutional Aspects
The Sub-County is developed with Headquarters of Sub-County Administration at Kiritiri.
These offices include Land Adjudication and Settlement Office, Agriculture and Livestock
Development Office, Local Administration Offices and Environmental Management Office.
National Government and Ward Administration offices are situated in Gachoka Market.
There are also several commercial banks and Micro-Finance outlets in Kiritiri. Every trading
centre is served by mobile phone banking services. In addition, there are several commercial
activities such as retail shops, hospitality facilities (restaurants and eateries) and green
grocery kiosks. The commercial activities are concentrated on strategic road junctions or
along major transport routes, which also double as miraa collection centres.
5.9 Land Sizes
Currently, Mbeere region like other semi-arid regions that were originally sparsely populated
(with less than 100 people per square kilometer) is experiencing great population change in
comparison to the high and medium agricultural potential areas. The natural rate of
population increase of 2.3 % closely compares closely with that of 3.5 to 4% in East Africa
and there could be a higher actual growth rate due to migration from the crowded fertile
highland areas, especially in Embu and Kirinyaga Counties. Farm sizes in the region like in
other ASAL regions are declining, measuring 16 to 2.5 Ha per household. Traditionally,
farmers grew cowpeas, pigeon peas beans, maize, sorghum and millet,. The migrants into the
region have brought introduced crops suited to the high and medium potential regions, while
cultivation technology remain mundane that they cannot optimize the production of these
crops in the semi-arid regions (Gachimbi et al, 2007). In addition, the subdivision of land into
smaller units has compromised livestock production, which was initially done in a herding set
up.
97
5.10 Conclusion
The expansive Mbeere South Sub-Country is strategically located in Embu County. The low
lying semi-arid sub-county falls between LM4 and LM5 agro-climatic zones. The area is
suitable for production of drought resistant crop varieties, mainly cereals, legumes and
livestock. However, optimal production is affected by unreliable rainfall, low fertile soils and
poor infrastructure development. Nevertheless, the area has great irrigation potential as it is
traversed by three major permanent rivers namely Tana, Rupingazi and Thiba, and two major
streams, Nguu and Itabua. The rivers/streams also offer great potential for Hydro Electric
Power Generation.
Uptake of sedentary lifestyle characterized by supplementary sources of livelihoods such
food and commercial crop production, small scale mining and quarrying is on the rise.
Although the Sub-County remains largely sparsely populated compared to the rest of the
region and county, it has continued to experience increased influx of population from
medium and high potential areas and rapid conversion of grazing lands into farmlands and
growth of trading centres. As a result, the once expansive chunks of land that were
communally managed have been adjudicated and registered promoting individual ownership.
At the same time, production in the fragmented parcels of land has intensified and new crop
varieties introduced, particularly commercial crops including miraa. All these factors have
significantly affected the structure of land use in study area.

98
CHAPTER SIX: FINDINGS
6.0 Introduction
This chapter critically analyses land-use changes that have occurred in Mbeere South Sub-County
as a result of miraa production. The section is organized in line with the specific objectives. It
starts with analyzing the emerging crop types, land uses and settlement patterns. This is followed
by appraisal of the probable triggers of miraa production in the study area and implications of the
emerging land use patterns.
6.1 Objective 1: Emerging Crop Types, Land Uses and Settlement Patterns
A trend analysis of such parameters as the forms of farming activities undertaken, average land
holdings per household and land transactions including subdivisions, transfers and sales revealed
significant land-use changes in Mbeere South in the last 10yrs. The changes have taken the form
of new varieties of crops, expansion of farmland, intensification of production, expansion of
existing commercial centres and/or mushrooming of new ones and significant change in
settlement patterns. Each of the above issues is discussed here below.
6.1.1 Emerging Crop Types
The study revealed that the study area has experienced drastic change in types of crops grown
due to multiplicity of factors. As already discussed, influx of population from medium and
high potential areas have rapid conversion of grazing lands into farmlands has led to
intensification of production. This coupled with declining rain-fed production and rapid
fragmentation and conversion of bush land into farmlands has favored production of high
value or commercial crops including miraa and horticultural crops such as vegetables and
fruits. Main fruits grown in the area include indigenous and grafted mangoes, citrus, bananas,
water melons and yellow passion fruits. Others include avocadoes and paw paws. Vegetable
varieties include pepper, capsicum, French beans, butternuts and eggplants. The production of
these crops is usually carried out under small scale to medium scale irrigation. Among the small
scale farmers, miraa production dominates over other high value crops.
6.1.2 Extensification of Land-Use
Mbeere South Sub-County falls in the lower midland zone, which is ideal for less intensive
(subsistence) food crop production and livestock keeping. However in the recent past, there has
been marked increase of farmland in the sub-county as was evidenced by a study by LUCID in
the year 2006 (Figure 20). Observations made during the current study revealed extension of
farming activities onto fragile ecosystems like hilltops, watersheds and river flood plains. More

99
so, there is rapid disappearance of bush land as more and more hectares of land are converted into
farmland.
6.1.2.1 Impact of Extensification of Production on Livestock Production
Extension of agricultural land has resulted to loss of grazing lands, woodland and bush land.
Conversion of pristine land into large areas of croplands has eliminated the option of free range
livestock rearing. Grazing is now in secluded patches within individual farms. The situation has
led to increased competition between livestock production and crop production. Further, it has
increased the density of livestock production within designated grazing lands leading to heavy
forage utilization. Consequently, farmers who double in livestock production have resorted to
keeping smaller herds that are managed through tethering, grazing near homes or construction of
modern zero grazing units.
Plate 2: A Cow Tethered by a Road Side within the Study Area
Source: Summary of CAPro Activities, Mbeere District (2011: 2)
The study realized a remarkable reduction in the number of livestock per household with majority
of farmers keeping an average of 2-4 animals of each preferred kind. Popular livestock include
local breeds of Cattle and Goats, Donkeys, Local breeds of Sheep, Poultry such as local Chicken

100
and Ducks. Other farmers have adopted improved breeds of dairy cows (a cross-breed of exotic
and local breeds), dairy goats and rabbits for higher returns so as to supplement household
income in the face of the reducing land sizes. The findings resonate with those of a study of
Miraa expansion in the Ethiopian Highlands by Taye Hailu and Jenes Aune (2003) that revealed
that increased miraa production leads to changes in livestock composition as oxen are no longer
required to plow the miraa- based system. Moreover, availability of crop residues for fodder is
reduced when miraa production expands. Thus miraa farmers give more emphasis on dairy cows
and goats which require reduced breeding space.
In view of land-use trends, livestock production is expected to grow in an effort to intensify
production within the decreases land sizes. It is expected that the dairy production and poultry
farming sectors will grow steadily as they require less space and the products from the sector
have a ready market.
6.1.2.2 Implications of Extensification of Production on Biodiversity
Imperatively, several watersheds have been destroyed by the extensification of farming. This has
resulted to increased drying up of water resources as well as increased soil erosion. Further, there
has been uncontrolled land subdivision on hilltops especially in Mbita Sub-location. As one key
informant put it “the slopes of hills in Mbita Sub-location have been allocated and subdivided to
individuals; several people have gone to the extent of establishing residences on the hilltops”.
Plates 2, 3 and 4 show a dry damat the foot of Kiambita hill, and extensively cultivated riverbed
of Itabua stream and ongoing cultivation on Kiambita hill respectively.

101
Plate 3: A Dry Dam at the Foot of Kiambita Hill
(Note the cultivated areas on the lower and upper part of the dam)
Plate 4: Cultivated River Banks of Itabua Stream
(Note the cleared and burnt vegetation on the foreground)

102
Expansion of settlements onto fragile lands, especially on hilly areas has exposed the soil to
elements of erosion resulting in rapid erosion which is evidenced by increasing siltation of
rivers downstream. Continuous cropping and abandoning of former systems of cultivation
such as shifting cultivation has deprived soils of the important soil nutrients through leaching
and removal of vegetation leading to declined production. Out of respondents interviewed,
65% reported a decline in production in the last 10 years (Figure 21).
Plate 5: Ongoing Cultivation on Kiambita hill

103
Figure 21: Level of Agriculture Production (2003-2013)
6.1.3 Intesification of Production
As demand for farmland rises with natural population increase and from the influx of population
from medium and high potential areas, and as the commodity market expands or price for
commodities rise, there has been increased pressure for increased productivity per unit area.
Thus, the production practices have transformed from the ancient shifting cultivation to more
sedentary and intensive ones. A trend analysis of farming activities between the year 2005 and
2011 along river Thiba, which traverses the study area revealed increased intensity of production
over the review period( Figures 22 and 23).

104
Figure 22: Land Cover along Thiba River in 2005
Figure 23: Changes in Land Cover in 2011
Source of data: Google Earth, 2014accessed on 07th May 2014

105
The images show a significant increase of vegetated area over the years. Most of the planted areas
are miraa and smallholder horticultural farms where production is undertaken under small scale
irrigation.
A previous study on agriculture practices in the greater Mbeere region by Gachimbi (2007)
revealed that several water resources in the region, particularly rivers and streams have been
targeted for various forms of small-scale irrigation.
Further, the area under small scale irrigation has increased steadily from the year 1996. Mbeere
South Sub-County, which comprises of the defunct Gachoka and Mwea Divisions, has had the
highest level of small scale irrigation uptake (Table 14).
Table 13: Exploitation of Water Resources in Mbeere Region
Division Water source Abstraction
Method
Potential crops
Siakago Ena River Pump fed Food crops
Horticultural crops
Evurore Ena River and Thuci
rivers
Gacavari, Kathegi and
Rwiria streams
Gravity
Pump fed
Food crops
Horticultural crops
Gachoka Rupingazi, Tana,
Thiba
Earth dams
Mwiru stream
Pump fed
Watering can
Food crops
Horticultural crops
Mwea Tana, Thiba and Thuci Pump fed
Surface
Food crops
Horticultural crops
Source: District Agricultural Office Annual Reports, Mbeere (1996-2001) in Gachimbi, et al (2007: 15)
Table 14: Area under Small Scale Irrigation Schemes in Mbeere Region 1996 - 2001
Division 1996 1997 1998 1999 2000 2001
Siakago Potential (ha) 126.0 63.0 83.0 83.0 144.0 144.0
Irrigated (ha) 6.0 12.3 17.3 17.3 22.5 27.0
%irrigated 5.0 20.0 21.0 21.0 16.0 19.0
Evurore Potential (ha) 1548.0 693.0 693.0 693.0 633.0 633.0
Irrigated (ha) 60.0 55.6 55.6 55.6 58.0 63.0
%irrigated 4.0 8.0 8.0 8.0 9.0 10.0

106
Division 1996 1997 1998 1999 2000 2001
Gachoka Potential (ha) 588.0 414.0 414.0 414.0 663.0 663.0
Irrigated (ha) 147.5 135.4 135.4 135.4 140.0 179.4
%irrigated 25.0 33.0 33.0 33.0 21.0 27.0
Mwea Potential (ha) 1604.0 1900.0 1900.0 1900.0 1250.0 1250.0
Irrigated (ha) 420.0 475.0 475.0 475.0 139.0 139.0
%irrigated 26.0 25.0 25.0 25.0 11.0 11.0
District Potential (ha) 3866.0 3070.0 3090.0 3090.0 2690.0 2690.0
Irrigated (ha) 633.5 678.3 683.3 683.3 359.5 408.4
%irrigated 16.0 22.0 22.0 22.0 13.0 15.0
Source: District Agricultural Office Annual Reports, Mbeere (1996-2001) in Gachimbi (2007: 15and16)
The table reveals that as much as the uptake of irrigation has increased, the full potential for
irrigation is yet to be exploited with only 15-22% being exploited. Out of the respondents
interviewed, 85% reported that they undertake some form of irrigation of their miraa plants while
the remaining 15% do not. Among those who irrigate their farms, the preferred source of water
for irrigation is by buying from water vendors or pumping directly from the river (Figure 24)
Figure 24: Source of Water for Irrigating Miraa Farms
The figure indicates excesive extraction of water from rivers by commercial water vendors for
irrigation and by farmers who pump water directly from rivers.

107
The study revealed increased subdivision of land, with an average household land size of 2-
3acres, which could be associated with increasing demand for farmland. Reducing land sizes and
the need to maximize returns from the small farms have led to innovations in soil and land
management. Such innovations as conserving soil by terracing and construction of benches,
harvesting storm water as well as enhancing soil fertility by applying organic and inorganic
fertilizers are on the rise. More and more farmers have adopted high value crop production.
Observations made during the study revealed an increased diversification into production of
perennial crops like miraa, fruit trees such as mangoes, citrus, bananas and yellow passion fruits
as well as agro-forestry. An analysis of use of household farmlands in the last 10 years revealed
mixed use of farmlands. In addition, a substantial number of farmers have undertaken either
livestock or food crop production around the same time (Figure 25).
Figure 25: Trend of Land-Use Practices in the Last 10 Years
The figure indicate that majority of farmers have undertaken mixed farming in form of food crop,
livestock and miraa production on their farmlands for the last 10 years. Plates 6 and 7 show some
of the innovations adopted to enhance production.

108
Plate 6: A Channelto Direct Storm Water from the Main Road into a Farm
Plate 7: A Water Pan in Mathigameru Village
Generally, high value crops normally receive higher inputs than lower value crops in intensified
production. The study revealed that 97% of respondents control pests by spraying crops with

109
pesticides. Only 3% use organic control methods. Further, productivity enhancement techniques
need substantial labour as well as monitory investment by farmers in engaging casual laborers,
transporters and traders. As scale of production intensifies, more and more farmers engage casual
labourers in their farms. Details of labour engagement are presented later during the analysis of
miraa production.
6.1.3.1 Implications of Intensified Production on the Biodiversity
As already discussed, the soils within the study area are less fertile in nature. Thus subjecting
them to intensive production strains them beyond their replenishing capacity. Increased soil
infertility has resulted to poor yields resulting to the abandonment of some farming practices or
use of organic and inorganic fertilizers to enhance production.
Intensified production has led to increased demand for water for enhancing production. Majority
of farmers have resorted to various forms of irrigation on their miraa farms so as to sustain
production during dry spells. The irrigation technologies are however hardly regulated resulting
to illegal damming of rivers, haphazard digging of shallow wells and unregulated extraction
water from rivers using water bousers. Unregulated damming of rivers curtails flow of water
downstream, impacting negatively on the quality and quantity of water downstream. It is
important to note that rivers that traverse the Sub-County are tributaries of River Tana, which is
the main supply of water for the Seven Folks hydroelectric dams. Thus reduction of water levels
in rivers does not only affect persons downstream but also the generation of electricity, whose
impact is felt nationally.
The high demand for farmland has resulted to increased subdivision of household
landholdings to uneconomic sizes. The study revealed that a household in Mbeere South Sub-
County owns an average of 2-3 acres. Further, there has been increased subdivision and
conversion of individual land holdings for commercial development. Data gotten from the
Sub County Survey Office revealed increased subdivision of farmland in the study area for
the last 10years as shown on Figure 26.

110
Figure 26: Land Sub-Divisions Trend in the Study Area 2003-2013
Source of data: Sub-County Survey Office, Siakago, 2014
It is evident from the figure that Mbita sub-location has registered more subdivisions than Kirima
sub-location for the period in review, a factor that maybe associated to vibrancy of miraa
production and completion of land adjudication in the sub-location. Likewise, the marked
increase in subdivisions in Kirima sub-location from the year 2008 could be associated with
completion of land adjudication process in the lower parts of the sub-location around the same
time.
Despite the increased land transactions, only 50% landholders have title deeds, 40% do not have
any form of ownership documents, while 10% have temporary documents such as lease and/or
sale agreements. These points to insecurity of tenure which is evidenced by land disputes and
land-use conflicts.
6.1.4 Expansion and Mushrooming of Trading Centres
The study revealed a remarkable expansion of existing trading centres within the study area
in the last 10yrs as indicated by the number of allocations for plots by the defunct County
Council of Mbeere.
Figure 27shows that applications for development permission received in the office from the
study area between the year 2011 and 2014 are relatively higher compared to those from
Kithunthiri, a neighboring sub-locations.

111
Figure 27: The Trend of Development of Plots 2011- 2014
Source of data: Sub-County Survey Office, Siakago, 2014
At the same time, there has been increased allocation of plots in trading centres within the two
sub-locations.
Table 15: County Council plots in Mbita and Kirima Sub-locations (2003-2014)
Village No. of stalls No. of plots TOLs
Mutugu 30 5 0
Muraru 22 1 0
Mbita 2 4 0
Ngumi 41 2 149
Mutus 5 3 0
Kamunyange 13 7 0
Minuri 9 0 0 Source: Sub-County Office, Siakago, 2014
The number of traders, range of businesses and housing typologies in these centres have changed
significantly over the years. Other centres have mushroomed on important road junctions and/or
along major transport corridors. Plate 8 to Plate 11below show development trend of local
trading centres in the last 10 years

112
Plate 8:Mutugu Shopping Centre 2003- 2005
The plate above shows simple housing typology with whitewashed and plastered mud and wattle
walls. The outook changes drastically to the permanent structures.
Plate 9: Kamboya Shopping Centre 2005-2010
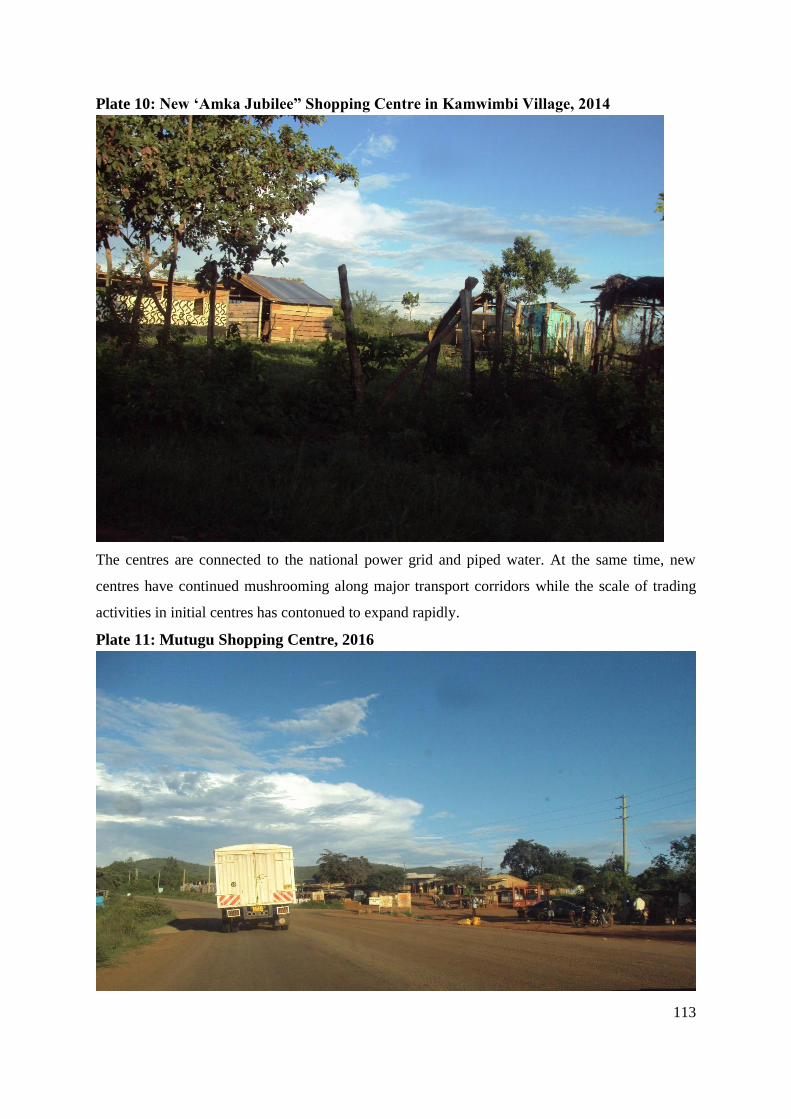
113
Plate 10: New ‘Amka Jubilee” Shopping Centre in Kamwimbi Village, 2014
The centres are connected to the national power grid and piped water. At the same time, new
centres have continued mushrooming along major transport corridors while the scale of trading
activities in initial centres has contonued to expand rapidly.
Plate 11: Mutugu Shopping Centre, 2016

114
6.1.4.1 Issues and Opportunities of Mushrooming of Trading Centres
Expansion and establishment of trading centres has resulted to rapid conversion of farmland to
commercial and public purpose uses, rising land values due to increased demand for commercial
land, increased demand for goods and services hence increased employment opportunities and
increased demand for building materials. Other issues include; establishment of schools, health
centres and worship centres to serve the increasing population, uncontrolled development within
and around the centres , and ribbon development along major transport routes
6.1.5 Changesin Human Settlement Patterns
The emerging trends of land-use in Mbeere South reveal a significant change in settlement
patterns, which has tended to take two distinct forms. First, there are dispersed settlements in
individual farmlands and second, clusters of settlements along rivers and around trading centres.
These patterns of settlement have deviated from the traditional extended family set up that was
characterized by nucleated settlement patterns. As already noted, key trading centres are found
along principal transport routes such as the class B7 road. Settlements proximal to roads and
trading centres portray better housing typologies than outlying ones. Several houses fronting
roads are made of permanent building materials such as masonry blocks and bricks with modern
colored roofs. Some of them are connected to electricity or have solar panels installed on the
roofs for tapping solar energy. The typologies change drastically as one gets farther and farther
from the main roads with majority of the houses in the interior being simple farm houses made
from semi-permanent and temporary building materials.
Adoption of small scale irrigation has led to ribbon settlement patterns along rivers, especially
along permanent rivers such as River Thiba. Similarly, better housing typologies are rapidly
replacing traditional temporary and semi-permanent ones along the rivers.
6.1.5.1 Emerging Issues and Opportunities of Changing Settlement Patterns
Changes in settlement patterns have led to increased demand for public purpose land for
developing supporting infrastructure and facilities including administrative offices, worship
centres and schools around emerging trading centres and villages. Ribbon development along
major transport routes and rivers and fragmentation of land for establishment of independent
homesteads are also on increase. Other issues include; increased value of land along major routes
and rivers, and disputes and land-use conflicts, increased tapping of renewable energy for various
domestic uses and uptake of intensive production methods.

115
6.2 Objective 2: Factors Influencing Increased Cultivation of Miraa in the
Study Area
The study realized that majority of farmers in Mbeere South Sub-County have embraced miraa
production in the last 10 yrs in place of livestock and other cash and food crops . The shift in the
mode of production could be attributed to several factors including geo-physical, socio-economic
and policy factors.
6.2.1 Geo- Physical factors
Geo-physical factors are related to the natural disposition of land. They include climatic factors,
soil types and strategic location of the study area.
6.2.1.1 Climatic Factors
Mbeere South Sub-County falls between two agro ecological zones, LM4 (Lower Midland Cotton
Zone) and LM5 (Lower Midland Livestock and Millet Zone). The zone receives reduced and
unreliable amount of rainfall, mainly between April and June and October and December. The
annual rainfall ranges between 640mm and 1,100 mm with the larger part of the Sub-County
receiving 550mm (Republic of Kenya, 2009). The erratic rainfall reduces the potential for rain
fed production through loss of pasture and water.
Further,the Sub-County is characterized by relatively high temperatures with annual range of
temperature of between 200c and 320c. These factors make the Sub-County a water scarce region
with only 40% inhabitants having access to portable water according to the Mbeere District
Development Plan of 2008-2012.
Conversely, the seemingly harsh climatic factors favour the production of miraa, which is more
drought resistant than other food and cash crops. The yield of miraa is optimal in dry conditions.
In extreme dry conditions, the amount of water required to irrigate miraa farms is much lesser
than that required for other crop varieties. The study revealed that the scale of miraa production is
dependent on availability of water for irrigation. Thus, areas with access to adequate water supply
register larger acreages of miraa farms than the drier ones.
6.2.1.2 Location Factors
Mbeere South Sub-County is located strategically in the proximity of important local and regional
miraa markets. The miraa growing area is about 20km South East of Embu town, one of the key
regional markets; and less than 200km from Nairobi City, the ultimate regional market for miraa
from the study area. Other important markets include several urban centres in central region of
country, which are easily accessible from the Sub-County.

116
The strategic location enables farmers to transport the highly perishable twigs to consumers
within a span of one to two hours. A review of the spatial flow and regional influence of miraa
from the study area revealed that there are three levels of influence.
Figure 28:Movement of Miraa from Mbeere South Sub-County
Source of mapping data (shape files): Physical Planning Dept.
Level one consists of areas in proximity of the production area such as the larger Embu and
Kirinyaga Counties. Level two comprises of areas further away from the production area but
within a radius of one hour drive from the study area. These include Muranga, Tharaka Nithi,
Nyeri and Kitui Counties. Level three comprises of far flung areas, more than one hour drive
from the study area such as Nairobi, Nakuru, Machakos and Kitui Counties. Mombasa, which is a
key regional market, out lays these regular rings of influence.
The all-weather Class B7 road from Embu to Kibwezi through Mwingi that traverses the study
area eases transport of the perishable twigs to various destinations. Further, the operation of
express bus services from Embu to Mombasa enables some traders and/or farmers to efficiently
market their produce to as far as the Kenyan Coast. Twigs destined for Mombasa are picked late
in the evening and transported by bus or Toyota Proboxes at night.
Direction of
Flow of
Miraa for
Sale LEVEL
3

117
6.2.2 Socio-Economic Factors
Several socio-economic factors such as lucrative prices, ready local and international
markets, technological advancement in transport and modern crop production technologies
such as irrigation have collectively promoted miraa production in study area.
Rapid expansion of miraa production in the study area in the last two decades coincides with
the collapse of the cotton industry. Further, reduced options of formal employment
opportunities in the study area has pushed many people, particularly the youth to uptake of
high value crop production including miraa production so as to enhance the level of
household income. The study revealed that majority of miraa farmers and traders engage in
the production and trade respectively solely due to the lucrative returns (Figure 30).
The study revealed that the household income level is reduced and skewed. The average
monthly income ranges from less than Ksh.. 5,000/- and Ksh. 30,000/- with majority of
respondents earning up to Ksh.. 10,000/ -. This may be associated with reduced land sizes
and low uptake of extension services.
Figure 29: Average Household Income
6.2.2.1 Poor Performance of Alternative Agricultural Products
Poor crop yields and death of livestock due to recurrent draughtsleads to susceptibility of
residents to malnutrition and loss of income. Thus, as a survival tactic, majority of farmers

118
resort to high value crop production including miraa to supplement household income.
Majority of the respondents affirmed that they engage in miraa production due to failure of
other food and cash crops and/or due to the poor performance of the livestock sector. Out of
respondents who keep livestock, 65% registered a decline in production over a period of 10
years from 2003 mainly due to deaths caused by diseases and recurrent droughts. Only 20%
reported increased production within the same period. Other farmers have not engaged in
livestock production at all due to the same factors. Environmental degradation evidenced by
high levels of clearing of indigenous trees for charcoal burning or for farmland exacerbates
the situation.
Figure 30: Driving Factors of Miraa Production among Producers

119
Figure 31: Driving Factors of Miraa Production among Traders
One trader opined, “Miraa trade is very profitable as one can save up to Ksh.. 1,000/- per day
which translates to about Ksh.. 30,000/- per month or at least Ksh.. 500/- per day or Ksh..
15,000/- per month for smaller traders...if you buy one Pil paper bag locally at Ksh.. 2,500/-, you
can sell it in Nairobi at between Ksh. 3,500/- and 3,800/- on a good day; and in case you hike a
lift on the Toyota Proboxes, which ferry miraa to Nairobi, the average fare is Ksh.. 1,200/- , but
if you to send other traders, you pay them a commission of Ksh.. 500/-).”
The perennial nature of the crop makes it an important and a regular source of income compared
to other agricultural products in the Sub-County that are seasonal. Considerable fluctuations in
returns from miraa are only recorded during rains when the market is flooded with the product.
Even then, the lower prices are not comparable to those of other agricultural products.
At the farm level, income per hectare from miraa surpasses that of other agricultural products in
the study area. In addition, miraa enjoys higher profit margins than that of cereals and livestock
production. It was found that on average a miraa farmer gets higher daily returns from miraa sales
(between Ksh. 1,000 and 1,400 per Pil), a far much higher amount compared to the market price
of main crops grown in the greater Mbeere District.
Returns from miraa trade are used to buy food stuff from local and regional markets and
undertaking various forms of household investments.

120
Table 16: Market Prices for Major Commodities in June 2005
Crop Unit of Measure Price at Siakago
market (Ksh.)
Price at Ishiara
market (Ksh.)
Cowpeas 2 kg tin 65 60
Green grams 2 kg tin 80 80
Green grams N26 2 kg tin 85 80
Dolichos lablab (Njahi) 2 kg tin - -
Pigeon peas 2 kg tin - -
Mwitemania beans 2 kg tin 75 75
Rosecoco beans 2 kg tin 90 80
Maize 2 kg tin 45 40
Sorghum 2 kg tin 60 50
Bulrush millet 2 kg tin 70 50
Finger millet 2 kg tin 80 -
Prosso millet 2 kg tin 75 -
Irish potatoes 100 kg bag 3000 3000
Irish potatoes 2 kg tin 60 60
Sweet potatoes 3 roots 20 20
Cassava 1 root 20 20
Source: Gacimbi et al (2007:17)
The price shown above has not changed significantly over the years as was confirmed by prices
for select commodities captured during the study.

121
Table 17: Price of Select Commodities in 2014
Item Sub-item Cost per Kilogram or Piece(Ksh.)
Crops Maize 45
Beans 80
Green grams 100
Cowpeas 50
Tomatoes 50
Livestock Indigenous Cattle (Ox) 14,250
Indigenous Goat 3500
Indigenous Sheep 2250
Indigenous Chicken 600
Non-refined Honey (kg) 250
6.2.3 Demographic Factors
Rapid population growth in the study area from natural increase and the influx of persons from
high and medium agricultural potential areas has brought about change of lifestyles of residents
of the region. Literature review revealed that the population of the study area is generally
youthful. For instance, in the year 2012, the population below 15 years accounted for 38% of the
total population (Republic of Kenya, 2009). The high number of the productive group presents a
challenge of unemployment, low education levels, considerably high cases of HIV/AIDS among
other issues while presenting a lot of pressure on existing learning, health and social facilities.
6.2.3.1 Distribution of Miraa Farmers and Traders byAge and Gender
The study sought the socio-demographic data of the respondents in form of age, gender, marital
status, education background, occupation, average household income per month and residence.
The respondents were categorized into two groups; households practicing miraa production and
those engaged in miraa trade.
The study revealed that 50% of both the traders and farmers fell in the age bracket of 21 and 40
years. A similar scenario is depicted by the gender of the traders which is also proportionate
between males and females. However, more male farmers (73.5%) engage in miraa production
than females as shown in the tables below.

122
Table 18: Gender of Miraa Traders
Value Label Value Frequency Percent
Male 1 5 50
Female 2 5 50
Total
10 100
Table 19: Gender of Miraa Traders
Miraa Traders Miraa Farmers
Frequency Percentage Frequency Percentage
Male 5 50 75 73.5
Female 5 50 27 26.5
Total 10 100 102 100.0
The study further revealed that none of the miraa traders and only 5% of the farmers are aged 60
years and above. The proportion of the age bracket from 51 to 60 years is also low at 30% and 60
% among the traders and farmers respectively.
Figure 32: Age of Miraa traders

123
Figure 33: Age of Miraa Farmers
The above scenario confirms the findings of a previous study on the impact of miraa production
on household income in the sub-county by Njiru et al (2013), which found a strong correlation
between the age of a farmer and the likelihood to engage in miraa production. The explanation to
the above findings is that young persons are ready to take greater risks than the elderly persons,
hence their likelihood to engage in miraa production and/or trade. Further, male farmers are more
likely to engage in miraa production than their female counterparts, a factor which could be
attributed to patrilineal land ownership, decision making and household headship in the study
area.
6.2.3.2 Marital Status of Miraa Farmers and Traders
The study established that 67% of miraa farmers are married, 24% are single and the remaining
9% are either widows, widowers or separated. This implies that married persons are more likely
to engage in miraa production so as to supplement household income.
6.2.3.3 Education level of Miraa Farmers and Traders
The study found out that majority of miraa farmers and traders have basic level of education. This
implies that persons with basic level of education are more likely to engage or are full dependent
on miraa production than persons with tertiary level of education. This could further imply that
majority of miraa farmers and traders engage in its production as a means of survival, for lack of
better opportunities.

124
Figure 34: Education Level of Miraa Producers
Figure 35: Education Levels of Miraa Traders
6.2.3.4 Occupation of Miraa Farmers and Traders
The study revealed that 89% of respondents depend entirely on farming as the main source of
household income. In addition, approximately 27% of miraa farmers engage in casual labour and
trading activities as alternative sources of income respectively. However, 40 % miraa traders
engage in other forms of trade to supplement their income. Another 40% of the traders depend
solely on miraa trade for income while 20% engage in other farming activities.

125
Figure 36: Main Occupation of Miraa Farmers
Figure 37: Alternate Occupation of Miraa Farmers
Reliance on miraa production as the only source of livelihood among the farmers and traders
necessitates apt measures to ensure proper integration and sustainable production of the crop and
that they are shielded from the shocks associated with the production.

126
Figure 38: Main Occupation of Traders
Figure 39: Alternate Occupation of Miraa Traders
6.2.3.5 Residence of Respondents
The study revealed that miraa trade in Mbeere South Sub-County is highly localized and
dominated by local residents as 90% of miraa traders reside within the study area. This is unlike

127
the trade in Meru where majority of traders come from other regions. This could be associated
with the small to medium scale of production and the final market for miraa from the study area.
6.2.4 Policy Factors
There are several policy issues which might have favored miraa production not only in the study
area but in other areas as well. These include the prevailing land policy favoring land
adjudication and policy lacuna for miraa production coupled with international regulations on
miraa trade. Other factors include insufficient innovation and extension services for mainstream
agriculture production. To date miraa production has neither been condemned nor promoted in
the country or in other countries of production. Key government legislations on agriculture world
over are silent on the same. Whereas this unassertiveness of local and international laws
concerning miraa production results in unregulated production and trade, it also provides a golden
opportunity for more and more persons to engage in the production pending its condemnation or
ratification.
In terms of regulation of land use, land-use planning has tended to concentrate on the planning of
urban areas with little focus on rural areas. To date the country has no national, regional or local
agriculture development plans aimed at enhancing the production levels in spite of the national
economy being agro-based. Regulations for enhancement of production and ensuring optimal use
of land are largely sectoral and implemented in piecemeal frameworks.
Lack of government support on miraa production makes the cultivation very susceptible to
market dynamics, unlike that of other crops that are institutionally supported. In an effort to
shield themselves from these uncertainties, farmers have established microfinance initiatives in
form of Credit and Savings Cooperatives (SACCO) such as the Muguka SACCO to facilitate
savings and access to credit by miraa farmers. However the study found out that majority of
farmers and traders are yet to enlist themselves.
The study revealed that for majority of respondents, miraa is a lifeline which needs to be
promoted. Out of the farmers interviewed, 94% plan to expand miraa production in the future so
as to increase their household income. Even the 5% who reported to have no plans of expanding
production sited lack of land for expansion as the main hindrance. This envisaged expansion is
going to take place in the absence of clear policy guidelines for rural land-use.
Among suggestions given for promoting miraa production in the region, priority one would be to
ensure adequate supply of water for irrigation and regulating the scale of production.

128
Figure 40: Measures for Enhancing Miraa Production
Coincidentally, the preferred measures for enhancing miraa production are similar to those that
ought to be promoted to revitalize food crop and livestock production in the region. Figure 41is a
summary of the causal-effect factors of miraa production.

129
Figure 41: Causal - Effect of Miraa Production
Source: Author, 2014
Miraa
production/Trade
Spatial impacts
Negative
Land-use conflicts
Reduced food crop and Livestock
Production
Mushrooming of trading centers
Encroachment on fragile land
Rapid subdivision of land
Pressure on physical infrastructure
Positive
Intensive utilization of land
Innovative production methods
Vibrant trading centers
Demand for improved physical
infrastructure
Increased tree cover
Socio-economic impacts
Positive
Increased land transactions
Increased HH income and
assets
Increased revenue
direct and indirect employment creation
Improved housing typologies
Negative
Addiction to miraa and
substance
Changing social values and
lifestyles
Food insecurity
Vulnerability from
dominance of miraa and
erratic prices
Triggers
Policy factors
- Lack of clear policy guidelines
- Conflicting national and
international outlook of miraa
trade - Inadequate implementation of
land-use and agricultural
policies
Socio-economic factors
Stable and lucrative prices
Ready local and international market
Demographic factors -. high population growth vs. high unemployment rates and poverty
low prices of alternative crops
innovations and infrastructure development
Environmental and Physical factors
Favorable climate
Suitable soil types
Proximity to local and regional markets
Versatility of the crop

130
6.3 Objective 3: Emerging Land Use Patterns in the Study Area
Emerging patterns of land-use in the study area as a result of miraa production are hereunder
reviewed in line with a model of the spatial flow of miraa, as discussed by Gessesse (2013).
According to him, the spatial flow of miraa takes a hierarchical pattern comprising of five (5)
nodes namely the farms, road junctions, village markets or collection hubs, central markets and
transport centres. At each node, some level of grading and packaging is done. Likewise, the
volume of miraa traded and the number of persons involved rises up the hierarchy.
Figure 42: Spatial Flow of miraa trade
Source: Adapted from Gessesse (2013:10)
At each node, retail for local consumers located close to the trading centres and whole sale
trading for onward transport to consumers elsewhere are undertaken. The means of transport
between nodes changes with increase of distance from farms. For instance, from farms to the road
junctions, the most popular means of transport are humans, bicycles and motorcycles. At the
junctions, miraa is collected and packaged for onward transmission to the next node. The most
popular means of transport at this point include motorcycles and cars. The other three nodes are
characterized by motorized transport comprising mainly of pickups and vans. At each node, small

131
traders sell complementary goods and services such as food, soft drinks, tea/coffee, cigarettes and
plastic bags. Residual materials such as leaves and soft branches are used as animal feeds
(Gessesse, 2013).
The study revealed a number of activities at each level of production and/or trade which have and
influences on land use as discussed here below.
6.3.1 Individual Farms
At the farm level, miraa shares space with food and tree crops as well as livestock production.
The study revealed diverse integration techniques with majority of farmers (90%) favoring the
establishment of pure stand miraa farms while 8% of farmers practice line intercropping and 2%
undertake patch-cropping.
Figure 43: Miraa Integration Options at the Farm Level
Among farmers who integrate miraa with other crops, 75% integrate it with maize only, 18% with
maize and legumes, and 7% with legumes alone. Maize is the most popular crop for integration as
it easier to manage alongside miraa as several stalks can be grown around a single miraa stem
from where they benefit from water used to irrigate miraa. Maize is also less susceptible to pests
and diseases and is more versatile as it can be consumed while green or dry and/or its stalks and
cobs can be used as cooking fuel or as livestock feed. In addition, the labor requirements for
maize production in such a setup is 50% lower than in cereal mono cropping as the agronomic
132
operations are undertaken for purposes of growing miraa, and the maize yield is an additional
benefit.
At the farm level, miraa farmers engage several laborers for such activities as clearing the
farmlands, digging holes for planting, watering miraa plants in dry spells, pruning, spraying
and/or fumigating and eventually in harvesting the twigs. Intensive labour is also engaged during
grading and packaging twigs for onward transmission to the regional markets. The average wage
for harvesting the twigs is Ksh. 150 per one ‘Pil’ paper bag.
Similarly, farmers use various innovative measures to overcome constraints associated with miraa
production. These include soil conservation by digging terraces, benches and planting grass
bands; planting trees along perimeter fences or terraces to act as windbreaks and ensuring
security of miraa farms by fencing or hiring watchmen. Other innovations include irrigation of
miraa farms to boost production by pumping water directly from rivers or by constructing dams
on seasonal rivers to conserve water for watering miraa farms during dry spells; moisture
wrapping of twigs during transportation to conserve moisture and ensuring speedy transportation
to the collection points and the local markets to reduce losses. About 50% of farmers reported
that they market their miraa to middlemen at the farm level. This has resulted to the establishment
of motorable routes to individual farms for collection of miraa. Alternatively several farmers have
invested in their own means of transport such as motorcycles, bicycles and motor vehicles to
ferry miraa to either road junctions or to local markets. Miraa production has resulted in
establishment of an elaborate transport system at farm levels in the Sub-County. With regard to
communication, Cellular phones are important communication gadgets in miraa growing areas
and are used for tracking the availability of miraa for sale and for follow up on the sale of miraa
or reserving transport means by middlemen and farmers respectively.
6.3.1.1 Main Land-use Issues
Miraa growing areas are characterized by extensive miraa farms of either mixed line cropping or
pure stands and large number of casual laborers tending miraa at various stages of growth such as
spraying, watering, pruning, watching against thieves and harvesting.
Major land-use issues include inadequate water for watering miraa farms, difficult terrain, pests
and diseases, inadequate land holdings, soil erosion, theft of crops, abandonment of food crop and
livestock production in favor of miraa and poor state of infrastructure. These issues result to
various land-changes including unregulated subdivision of land, obstruction of water courses for

133
irrigation water, wanton clearing of natural vegetation, extension of farming activities to fragile
lands like hilltops and establishment of transport routes to individual farms.
Possible corrective measures include promotion and regulation of irrigation, increased to
harvesting storm water by household for agricultural production by constructing pans and dams,
adoption of soil conservation measures such as construction of terraces, benches and grass bands,
agro-forestry, afforestation and re-afforestation. Other interventions include integration of miraa
and food crop/livestock production and improving physical infrastructure, particularly the road
connectivity and condition.
6.3.2 Road Junctions
Intensive labor requirement for various activities at the farm level attracts other land-uses
including establishment of eateries and retail outlets at road junctions where lower order
household items such as salt, tea leaves, sugar, cooking oil, kerosene, dry cells for spotlights and
simple luxury items such as cigarettes, sweets and groundnuts are sold. The study revealed
several such outlets, most of which are constructed using a mix of building materials including
makeshift materials, masonry blocks and bricks. Although most of such establishments are not
licensed by the local authority, they play an important role in provision of goods and services to
farmers and laborers who are busy in the farms throughout the day. They are also strategic
resting areas for farmers and laborers in the afternoons and evenings after rigorous work in the
farms and main collection points for miraa from individual farms. Most of these centres are
located within walking distance from the farms.
Emergence of commercial activities on road junctions impacts land values around the junctions
and the scale of production at the farm level. Land in the vicinity of roads is highly valued than
that farther away. The study revealed drastic reduction of scale of miraa production as one moves
farther away from the roads, with an exception of parcels adjoining rivers and water resources.
This affirms findings of the study by Njiru et al (2013) which found that the intensity of miraa
production reduces with distance from transport corridors.

134
Plate 12: A Resting Place at a Road Junction in Kamunyange Village
6.3.2.1 Main Land-use Issues
These nodes are faced with challenges of proliferation of informal commercial activities, and
rapid and unregulated subdivision of land. Evident land-use changes include conversion of land
to commercial use, increased subdivision of farmlands and clustering of settlement.
Possible interventions include regulating subdivision of land and the type and magnitude of
commercial activities
6.3.3 Village Markets cum Miraa Collection Points
The third tier nodes are the village markets cum miraa collection hubs found at strategic points
within villages. The centres either emerge as a result of miraa trade or the already existing centres
expand rapidly as miraa production in the hinterland intensifies. As already explained the most
common means of transport from farms and junctions to these centres are walking, bicycles and
motorcycles. Thus, the centres are distributed at a reasonable walking distances from the farms, at
an average distance of 3-5km and are accessed on motorable roads. In addition to the centres

135
being miraa collection points, they are also key commercial hubs where middle and lower level
goods are sold. They have better housing typologies than those found at road junctions. In most
cases physical development of these centres is regulated by local authorities and majority of
establishments are licensed. Notable developments include bars, retail shops, and sheds for
informal (jua kali) artisans such as motorcycle and bicycle repairers, tailors and for indoor games
such as pool table, darts and poker. Other commercial establishments include green grocers,
posho mills, lodgings, butcheries, barber shops and sheds for resting while chewing miraa. Some
of these centres have one or two mobile banking and money transfer outlets. Some of such
centres within the study area have since been supplied with electricity and piped water. In more
remote villages, the centres are important for charging cellular phones for farmers and villagers
who are yet to install solar or electricity in their homes.
Plate 13: Kamunyange Village Centre in Kirima Sub-Location
The centres are very important in miraa trade as they are resting places for farmers and pickers
after business, shopping areas for household items and packaging materials for miraa, as well as

136
for complementary goods and services such as food, soft drinks, tea/coffee, cigarettes, ground
nuts and airtime cards for cellular phones. Scores of farmers and or traders and pickers hang
around the centres every day from mid-morning after the sale of miraa until late in the night
either settling payments or strategizing on activities for the following day.
6.3.3.1 Main Land-use Issues
These centres, which tend to be established at prominent road junctions, are characterized
increased retail commercial activities and miraa collection and its associated activities. Others
serve as local administrative areas. Their hinterlands are characterized by intensified miraa and
mixed development. Majority of these centres develop without proper physical development
layouts.
The main land-use issues include poor housing typologies, undesignated packing spaces for
vehicles and motorcycles, poor solid and waste disposal, undesignated miraa collection points
and rapid conversion of agricultural land to commercial use.
Land-use interventions may include making them more compact by deliberate clustering of land-
uses by preparation of layout plans, development of physical infrastructure like piped water and
electricity, regulating commercial activities and establishing land banks as well as controlling
physical development activities around centres in anticipation of future expansion.
6.3.4 Central Markets
The central markets are located farther away from villages necessitating use of a higher order
means of transport to access them. In terms of miraa trade, the most popular means of transport
include motorcycles, cars and vans (Matatus).The centres like their local market counterparts sell
lower order and complementary goods and services. However unlike the former, the scale of
trade is higher with several wholesale outlets, ware houses, mobile banking and money transfer
outlets and lodges being found.
Historically, there were four such markets within the greater Mbeere South Sub-County namely
Kivaa, Machanga, Kiritiri and Gachoka while intermediary centres included Mutugu and
Nganduri (Republic of Kenya, 1978). Save for Nganduri, the other centres are located along the
B7 Embu- Mwingi road. The study revealed emergence of other centres around the same time
miraa production intensified. These include Munathiri and Muraru which are the most popular
miraa collection centres in the Sub-County. At the same time, there has been a marked expansion
and change of housing typologies from mud walled shops and makeshift sheds (vibandas) for
green grocers to permanent retail and wholesale outlets as well as diversification of commercial

137
activities in the ancient centres. Additionally, land values in the vicinity of the centres have sky
rocketed as already explained. Mutugu, one of such centres, which also doubles as a popular road
junction centre and collection centre, has reported the highest expansion rate. Analysis of Google
Earth images of the centre showed significant changes in physical development in a span of 2
years, between 2009 and 2011. The changes are edged in red and green in the second figure.
Plate 14: Physical Development of Mutugu Centre in 2009
Source of image: Google earth, accessed on 07th May 2014

138
Plate 15: Changes in Physical Development of Mutugu Centre in 2011
Source of image: Google earth, accessed on 07th May 2014
6.3.4.1 Main Land-Use Issues
These nodes are characterized by increased human and vehicular traffic during miraa trading
hours, encroachment on road reserves by activities associated with miraa trade, poor waste
disposal, especially polythene bags used for packaging miraa, and high incidences of road
accidents. Other issues include uncontrolled physical development of the centers and
increased land transactions, particularly subdivisions in adjoining areas.
The situation above can be reversed by preparing physical development plans to guide
development, restricting trading activities on road reserves, designating specific areas for
miraa markets and waste disposal, regulating subdivision of land and erecting bumps on
major roads to limit the speed of vehicles.
6.3.5 Transport Centres
Three of the central markets within the study area double as the main transport centres for onward
transportation of miraa to final destinations such as Nairobi and Mombasa. These are Munathiri,
Mutugu and Muraru. Two of these centres, Munathiri and Muraru are located beyond the two
sample sub-locations but within the Sub-County. Miraa collected from local markets and farms is
Miraa farm

139
repackaged here in polythene bags before being loaded in Toyota Probox cars commonly known
as Proboxes for onward transportation to various destinations, but mainly to Nairobi. The centres
experience a flurry of activities during miraa trading hours between 4am and 10am. A close
analysis of space use in these centres and miraa associated activities revealed the following
scenario:-
In terms of employment, miraa trade in these centres has resulted to either spatially permanent or
semi-permanent employment. A review of Muraru centre in the neighboring Gachoka Sub-
location revealed that apart from farmers who flood the markets every morning, the remaining
actors are regular. Their space in the market has some level of permanence and space use is
subject to fees and charges based on the physical location. Miraa traders and hawkers occupy the
same space every day during trading hours. Green grocers and retail traders occupy their kiosks
more permanently either by owning them or renting them on formal contractual agreements. This
affirms findings by Gessesse about space utilization in Butajira miraa market in Ethiopia.

140
Figure 44: Spatial Flow of Miraa in the Study Area
Source of Mapping Data: Kenya National Bureau of Statistics, 2015

141
Figure 45: Space Utilization in Muraru Market
Figure 45 above shows that hawking activities are undertaken along the road reserves which
results to conflict of land-use between the road users and the traders. More permanent space use
in form of retail shops takes a back stage.

142
Plate 16: Flurry of Activities in Muraru Market During Miraa Market Session
The study just like that by Gessesse in Ethiopia (2013) revealed the engagement of various people
in miraa trade in six major activities namely supply, brokering, retail and wholesale trade, sorting
and packaging, delivery and transport, and residual activities. Each of the activities has multiple
sub-activities that engage several people. Some of these include paper bag vendors, sorters and
wrappers, bundle binders, porters from farms and motorcycle operators. Others include drivers,
bulk buyers, mechanics, fuel distributors, garbage collectors and vendors of various goods such
as water, groundnuts and sweets, tea and porridge.
6.3.5.1 Summary of Land-use Issues
These nodes are faced with similar land-use challenges as the Central Markets, which can be
addressed through deliberate physical planning of the centres.
6.4 Implications of the Changing Land-Use Patterns on Development
The spatial flow of miraa presents numerous land-use opportunities and challenges of
development in Mbeere South Sub-County. These range from the provision of requisite
infrastructure and services around the areas of convergence to creation of adequate linkages
within the hinterlands.

143
Positive implications of miraa production include increased utilization of land and natural
resources, increased uptake of technology and innovation in production and revitalization of
trading centres. Conversely, land-use conflicts, skewed physical development, abandoning of
traditional forms of production and land degradation are on the rise as miraa production
intensifies.
6.4.1 Rapid Conversion and Subdivision of Land
Generally, rapid conversion of farmland and bush land to miraa production has compounded the
territorialization, demarcation and subdivision of land to cadastral and physical extents.
The traditional land tenure arrangement that favored access to land (land rights) has gradually
been replaced by one that promotes individual ownership. In addition, there exist several
arrangements of land-use and renting crop for harvesting by middlemen upon maturity. At the
same time, the economic benefit of miraa production has attracted more people to the region,
which has resulted to increased population density, increased subdivision of land and change of
settlement patterns. Changes in settlement patterns have occurred in two distinct forms where
individual miraa farms are dispersed in the region, while collection areas and auxiliary land uses
are concentrated in market settlements. .
6.4.2 Increased Utilization of Land and Natural Resources
Intensification and extensification of agricultural production has resulted to utilization of hitherto
idle land. The reducing land sizes have led to innovations in land management so as to sustain
high production. At the same time, subdivision of land and/or conversion of land to commercial
uses has led to increased land values around these centres. The study revealed that whereas an
acre of land in areas proximal to Mutugucentre cost approximately 50,000 shillings back in the
year 2003, the same has risen to at least 300,000 shillings. A similar trend is evident in other
areas in vicinity of trading centres and transport corridors.
Vibrancy of trading centres has led to improvement of infrastructure and service provision.Such
centres as Mutugu and Muraru along the B7 road have already been supplied with electricity and
piped water. As a result there has been increased trading activities in these centres. Commercial
activities such developement of petrol stations, mini supermarkets, entertainment joints and
accommodation facilities are also on the rise. Centres located farther in the interior such as
Nganduri and Kamunyange have also benefited from connection of trunk infrastructure. This has
led to significant increase in physical development and horizontal expansion of the centres.

144
Plate 17: Mixed Physical Development of Mutugu Trading Centre
Note the ovehead power cables
6.4.3 Increased Uptake of Technology and Innovation
The study revealed increased uptake of innovation in agricultural production with expansion of
miraa farming. Small holder farmers have embraced intensive production under small scale
irrigation either by pumping water directly from rivers, harvesting storm water by diverting water
from storm water drains into their farms or constructing water pans and dams. Other farmers have
invested in large plastic or masonry stone storage tanks made in which they store water either
from roof catchment or filling using water bowsers. One 10,000 liter water bowser costs
approximately Ksh.3, 000.
Other innovations include various methods of conserving soil and improving soil fertility
including terracing and construction of benches, harvesting storm water as well as enhancing the
soil fertility by applying organic and inorganic fertilizers respectively. Several farmers conserve
moisture in the soil by mulching their miraa crop.

145
Plate 18: A Well-Tended Miraa Farm
Farmers who integrate miraa farming with livestock production have favored the production of
high productive livestock breeds under zero grazing units. The most popular livestock include
improved breeds of cows and dairy goats. Keeping livestock in closets helps in maximizing the
utilization of space as compared to the traditional herding. Zero grazing production has in turn
necessitated constant supply of fodder, which has resulted to enhanced production and
conservation of fodder crops such as stalks from various cereals such as maize, millet, sorghum
and legumes. Other farmers plant Napier grass and other types of fodder grass on terrace mounds.
The grasses not only help in stabilizing the soil but also serve as important fodder during drought.
6.4.4 Revitalization of Trading Centres
As already discussed in the spatial flow of miraa production, the various activities associated with
miraa trade have resulted in a flurry of activities in trading centres within the study area. The
study revealed that retail trading is dominant among the complementary commercial activities
associated with miraa trade. Other activities include selling polythene bags and other packaging
materials, operating bars and restaurants, selling groundnuts and water vending.

146
Figure 46: Complementary Activities of Miraa Trade
The complementary activities have led to changes in both the horizontal growth of the centres and
the scale of commercial activities. The once dormant centres such as Mutugu and Muraru have
grown beyond bounds. The increase of activities has had ripple effects in neighouring centres
such as Gachoka and Kiritiri, which had also stagnated in terms of physical development. Other
centres have sprung up at vantage points such as road junctions. The key challenge associated
with this growth however is that it is taking place in the absence of action plans for the centres.
Land values around the centres have skyrocketed and housing typologies changed drastically
from those made of semi-permanent materials to permanent structures.
6.4.5 Increased Land-Use Conflicts
While optimal exploitation of natural and socio-economic resources is a prerequisite for
development of any given region, unregulated use of resources maybe detremental to economic
growth. Unregulated farming activities may result to land degradation evidenced by soil erosion,
pollution, siltation and reduction of water levels in rivers and loss of biodiversity among other
issues. Similarly, unregulated subdivision of land reduces the holdings to uneconomic sizes.
These factors affect food production and hence food security.
Uncontrolled physical development result to incompatible land-uses and poor service provision
hence, impacting negatively on public health, aesthetics and investement potential.
Physical development in the existing and emerging centres has continued to occur without proper
land use plans or without the proponents seeking the approval of development application. This

147
has resulted to uncoordinated development, poor solid and liquid waste disposal and inadequate
provision of infrastructure.
The study revealed increased land-use conflicts including, destruction of crops by livestock,
uncontrolled damming of rivers and streams and multiple allocation of land. Other conflicts stem
from illegal clearing of natural vegetation on hilltops, water catchments and wetlands, use of
existing infrastructure such as automobile accidents, social problems such as alcoholism, suicide
and child development issues.
Figure 47: Nature of land-use conflicts associated with miraa production
Conflicts associated with livestock rearing could be attributed to shocks associated with rapid
transition from a herding livestock production system and reducing farm sizes as more and more
land is converted to miraa production and the permanence of miraa production compared to food
crop production that is seasonal.
One of the administrators interviewed reported the complexity of handling disputes associated
with miraa production as the same have not gazetted under any written law. This makes it quite
difficult when recording the nature of crime with the security authorities or the evaluation of
damages by relevant authorities for compensation.
6.4.6 Skewed Physical Development
Dependence on natural land production potential, inadequate provision of infrastructure and
emerging land-uses has resulted to skewed development. As already explained, the settlement

148
pattern in Mbeere South Sub-County is largely ribbon along major transport routes, proximity to
markets, and rivers or water sources for irrigation. Other settlements have clustered around
trading centres while the rest of areas are dotted with scattered settlements. Lack of guidelines on
establishment of functional and sustainable settlements has compromised the agricultural
production and provision of adequate infrastructure and services. At the same time, there is
encroachment on environmentally fragile areas such as watersheds, hills and riparian reserves.
6.4.7 Abandoning of Traditional Forms of Production
The study revealed that 90 % of miraa farmers do not integrate it with other forms of production.
Such farmers dwell on the assumption that they can always buy food stuffs from markets, which
make them susceptible to changes of commodity prices. The study further revealed that 67% of
the respondents replaced crop production with miraa production while another 27% established
miraa farms on virgin land. Another 5% of the respondents shifted their homestead to pave way
for miraa farms.
Figure 48: Former Use of the Land Currently Under Miraa
A personal analysis of homes in the sample villages revealed that majority of the households do
not have traditional grain storage facilities (granaries) and in cases where they exist, they are
either dilapidated or are used for storing other items other than food produce. This implies that
households no longer have surplus farm produce to store for future use. Further, the abandonment
of production of traditional food crops affect the nutritional value of diets consumed by majority
of residents as not everyone can afford to buy all foodstuffs from the market. It is imperative
therefore that if this trend continues, it will impact negatively on food security in the region both
in the medium and long term.

149
Diminishing grazing land as farmlands increase means that majority of households have no
supplementary sources of household dietary needs. In addition, reducing herd sizes implies that
farmers can no longer work their farms using ox ploughs. This means farmers can no longer
undertake timely ploughing at the onset of rains, a factor that affects the level of rain fed
production.
6.4.8 Land Degradation
Intensified production of miraa and other high value crops as land sizes reduce subjects the soils
to excessive pressure leading to rapid erosion of nutrients. In addition, establishment of miraa
farms on fragile lands such as hill tops and riparian reserves or pushing the production of other
crops to these areas to pave way for miraa farms on former farm lands has resulted to rapid soil
erosion evidenced by increasing siltation of rivers and dams and rapid drying up of water
resources. Clearing of woodlands for farmlands strips the land of tree and natural vegetation
cover that act as wind breaks and carbon sinks.
Increased volume of vehicular traffic exerts excessive pressure on existing roads, majority of
which are earth or gravel. This results to destruction of the surface, bridges and culverts which
were not initially designed to withstand heavy volumes of traffic. The poor state of several roads
within the study area has rendered them impassable during rains.
6.5 Conclusion
Land utilization in the study area has changed drastically in the last two decades. Production of
traditional crops and indigenous livestock varieties is on the decline while production of high
value crops and fewer but better breeds of livestock is on the rise. Increased miraa production in
the areahas been undertaken around the same time due to several factors but mainly due to
lucrative returns and policy lacunas. Analysis of the spatial flow of miraa production revealed a
continuum of points of impact namely the farms, road junctions, village markets or collection
hubs, central markets and transport centres. At each node, the volume of miraa traded and the
number of persons involved rises. There are also significant impacts on land use such as
conversion of grazing land and fragile lands into farmlands, rapid subdivision of land,
mushrooming of unplanned trading centres and increased land use conflicts. Conversely, the
production has led to innovations such as water and soil conservation, revitalization of dormant
trading centres and increased land values. The negative impacts associated with miraa production
should be regulated. Similarly, the great potential for livestock rearing, rain-fed and irrigable
production should be exploited.
150
CHAPTER SEVEN: SYNTHESIS OF FINDINGS, CONCLUSIONS AND
RECOMMENDATIONS
7.0 Introduction
This chapter presents the synthesis of research findings and recommendations of the study as per
the objectives of the study. It outlines measures that need to be undertaken so as to ensure optimal
utilization of land in the study area. It further suggests measures for integrating miraa farming
with other forms of agricultural production.
7.1 Land-use Development Options
Analysis of the potentiality of land in the study area revealed diverse potentials and opportunities
of agricultural production and the built environment as outlined here below.
7.1.1 Food Crop Production
The study area has inherent potential for dry-area food production. It is suitable for production of
a wide variety of drought resistant crops including such cereals as dry composite maize, millet,
sorghum, finger millet, pearl millet and finger millet. The region is also suitable for production of
such legumes as fast growing bean varieties, green grams, cowpeas, groundnuts and pigeon peas;
and root crops such as cassavas and sweet potatoes.
Optimal crop production is however constrained by overreliance on rain fed production, reduced
uptake of technology and innovation, and rapid land fragmentation. Other issues include
inadequate extension services, lack of incentives, fragile soils with medium natural fertility,
cultural norms and perceptions such as despising production of root crops, loathing farming by
the youth, abandoning of food crop production for non-food crops, poor storage facilities,
inadequate value addition and poor marketing systems resulting to low returns.
External determents of optimal food production include climate change leading to recurrent
droughts and emergence of invasive plant species, ineffective institutional framework, and
invasion of unregulated high value crop production.
These land use issues can be addressed through proper farm managements programmes. For
instance, the expansive farm lands are in proximity of water resources like rivers and streams that
can be utilized for irrigation. Additionally, the largely youthful population provides an
opportunity of adequate labour for various forms of production. Other opportunities include,
continuous research on high yielding varieties, better production methods and uptake of water
conservation projects.

151
7.1.2 Livestock Production
The study area is suitable for production of a variety of livestock. These according to the
Farm Management Handbook include indigenous and improved breeds of cattle, Shoats,
chicken, ducks, geese, turkeys, pigeons, rabbits and fish. The area is equally suitable for
Apiculture.
Optimal livestock production is curtailed by increased subdivision of land to uneconomic sizes
and conversion of grazing lands into farmlands, poor husbandry, pests and diseases, poor
infrastructure development, inadequate value addition and poor marketing systems. Other issues
include technological constraints, inadequate institutional arrangements, competition from other
regions and lower returns compared to those of high value crop varieties.
Opportunities for commercial livestock production include favorable climate, expansive and less
developed land, availability of water and natural foliage as well as adequate labour. Other
opportunities include the strategic location of the area in proximity of local and regional markets,
technology and innovation and presence of development agencies and agro-oriented NGOs,
CBOs and FBOs.
7.1.3 Cash Crop Production
The study area is suitable for production of various horticultural products, mainly fruits and
vegetables. Also it is suitable for production of such cash crops as cotton, sisal, tobacco and green
grams in addition to miraa production.
Constraints to optimal commercial crop production include inadequate research, reduced value
addition, recurrent drought, unregulated market of products and inadequate physical
infrastructure provision International markets preconditions. Other issues include lack of policies
to guide production of certain crop varieties such as miraa, conflicting land uses and institutional
challenges.
Opportunities for commercial crop production include expansive land, availability of water for
irrigation, favorable climate and expansive and ready market for products. Other opportunities
include adequate labour, technology and innovation, research on high yielding varieties and better
production methods.

152
7.1.4 Urban Development
Although urban development in the study area is reduced compared to other areas in the
country, the existing centres present great potential for growth as there is adequate land for
expansion and there is satisfactory provision of physical infrastructure.
However, the existing and emerging centres are faced with such challenges as land tenure and
land ownership issues, lack of land use plans leading to uncontrolled settlement patterns and
informal housing typologies, excessive land subdivision, inadequate provision of paved roads and
inadequate electricity connection. Other issues include poor solid and liquid waste disposal, non-
segregation of traffic, inadequate recreational facilities, encroachment on road reserves by trading
activities and rapid emigration of population from high and medium potential area
Opportunities for transforming the urban development include establishment of agro-industries,
land-use planning, revitalized regulatory framework, devolved governance and funds such as
CDF, county funds and stabilization funds.
7.1.5 Environment Conservation
The entire of Mbeere region is ecologically sensitive. The area is richly endowed with natural
resources including wildlife, hills and ridges, surface and underground water resources and steep
slopes.
Threats to conservation include wanton clearing of natural vegetation for farm land and to harvest
sticks for propping horticultural crops, charcoal burning, recurrent bush fires, inadequate physical
infrastructure development, pollution of water resources, particularly from agro-chemicals and
fertilizer, siltation of water courses, uncontrolled extraction of water resources leading to reduced
volumes, and encroachment of settlements and farmlands on riparian reserves and hills. Other
issues include non-gazettement of forest reserves and other conservation areas, lack of
community awareness on the need to conserve these areas, inadequate branding of conservation
opportunities, climate change, challenges of trans-boundary resource management, non-
harmonized conservation policies and political interference in conservation ventures.
Opportunities of environmental conservation include existing conservation policies, existing
institutional and regulatory framework, devolved funds, water conservation, power generation,
tourism and aquaculture.

153
7.2 Land –use Changes
The study revealed significant land-use changes in the last 10 years. These include expansion of
farmlands into former grazing fields, woodlands and conservation areas. Other changes include
significant expansion of commercial centres and emergence of new ones. Commercial centers
have mushroomed on road intersections, particularly where miraa trade is prominent and along
rivers where it is possible to grow crops under irrigation. Although the most widespread land use
is still agricultural, there is increased subdivision of land for farmland in proximity of emerging
commercial centres and major rivers for commercial use and intensive agricultural production
respectively.
Settlement patterns are rapidly shifting from the traditional clustered villages to ribbon
settlements along transport corridors and rivers and scattered houses in the numerous farmlands.
Although land-use changes could be attributed to factors such as agro-ecological, socio-economic
and demographic factors, the main cause could be as a result ofthe land policy of land
adjudication that favors individual land ownership coupled with increasing demand for farmland
for production of high value crops.
7.2.1 Changes in Agricultural Production
According to the Farm Management Handbook (2008), Mbeere South Sub-County has a great
potential for cultivation of various cereals such as dry composite maize varieties, different types
of millet; legumes such as cowpeas, pigeon peas, green grams, dolichos and fast growing
varieties of beans. The area is also suitable for production of draught resistant root crops such as
cassavas, sweet potatoes and groundnuts. However, the production of these crops has been on the
decline in the recent past in favour of miraa production as they fetch lower returns than the latter,
which is considered a high value commercial crop. For instance a farmer who grows maize can
only get an average of Ksh. 150 per two kilogram tin compared to at least Ksh. 1,000 per unit of
miraa. The food crops also require constant care compared miraa which is considered an ‘easy’
crop to produce.
7.3 Main Factors of Miraa Production in the Study Area
Analysis of data collected revealed that the main trigger of miraa production in Mbeere-South
Sub-County, as in other areas of its production is the lucrative returns compared to other forms of
agricultural production. Lack of an alternative high value commercial crop in the study area
coupled with poor farming practices for mainstream crops and livestock; policy, legislation and
institutional gaps have driven residents into miraa production, mainly as a means of survival.
Other factors include geo-physical characteristics like unreliable rainfall for rain-fed production,

154
inadequate soil fertility and proximity to important markets; demographic dynamics such as a
youthful population that lacks opportunities and inadequate land use planning of rural areas to
promote agriculture development.
7.3.1 Implications of Miraa Production on Land-uses
The study revealed that the promotion of miraa as a leading commercial plant in Mbeere South
Sub-County has created a parallel economy that is taking up much of the land in parts of the Sub-
County where it is grown. The production presents short term and long term risks to food
security, conservation of natural resources and household incomes.
7.4 Emerging Land-Use Patterns
The study revealed there is rapid conversion of pristine lands especially hilltops and riparian
areas and water courses into farmlands, particularly miraa farms. At the same time there are
changes of settlement patterns, demonstrated by increased emergence of ribbon markets and rapid
expansion of existing centers. The development of these centres is largely spontaneous,
occurring without proper planning and development control measures. This affects the aesthetic
value of these centres. Additionally, the ribbon structure of development increases the cost of
service provision.
Rapid conversion of bush land and grazing land into farmlands has led to loss of biodiversity and
aesthetic value. At the same time, there are increased land-use conflicts associated with demand
for farmland, uncoordinated physical developments, unregulated utilization of water resources
and expansion of farming activities and settlements on wetlands, hilltops and other fragile lands.

155
Table 20: Summary of Land-Use Changes, Indicators Issues and Possible Interventions
Category of land-use
change
Indicators Issues Possible interventions
Extensification of land-use - Expansion of farmland to fragile
ecosystems like wetlands and hills
riparian reserves
- Clearing of natural vegetation
- Settlements on fragile lands
- Loss of grazing land resulting
to reduction in number of
livestock kept per household
- Loss of bush land
- Declining production due to
increased Soil erosion and
infertility
- Land-use conflicts such as
those from destruction of crops
by livestock
- Drying up of water sources
- Safeguarding fragile ecosystems from
human activities
- Promoting extension services on
modern production methods
- Promoting afforestation, re-afforestation
and agro forestry programmes
- Establishing land management boards to
resolve land disputes and conflicts
- Promoting soil conservation
programmes
- Promoting regulated irrigation
- Promoting water harvesting and storage
Intensification of land-use - Reducing size of household land
holdings –average of 2 to 3 acres
- Increased subdivision of land
- Adoption of technologies aimed at
enhancing production such as
irrigation, harvesting storm water,
soil conservation, application of
fertilizer
- Adoption of high value crop
production
- Overworking the soils
- Overexploitation of water
resources
- Small and declining farm sizes
and landlessness
- Land-use conflicts and disputes
- Establishing minimum land holdings
- Enforcing development control
- Promoting extension services on
modern production methods
- Promoting afforestation, reforestation
and agro forestry programmes
- Establishing land management boards to
resolve land disputes and conflicts
- Promoting soil conservation
programmes
- Promoting regulated irrigation
- Promoting water harvesting and storage
- Regulating production of commercial
crops
Development of trading - Horizontal expansion of existing - Conversion of agricultural land - Enforcing development control

156
Category of land-use
change
Indicators Issues Possible interventions
centres centres through allocation of plots
by local authorities or subdivisions
by individuals
- Mushrooming of new centres
- Increased land transactions around
existing and emerging centres
- Increased scale and mix of
activities in centres
to commercial, industrial and
public purpose uses
- Sky rocketing land values
- Increased demand for goods
and services
- Uncontrolled development
- Ribbon development along
important transport routes
- Establishing a policy for urban
development
- Preparing physical development plans
for existing trading centres while
determining the function and hierarchy
of the various centres
Changes in human
settlement pattern
- Clustering of settlements around
trading centres and water courses
- Ribbon settlements along transport
routes
- Scattered settlements in farmlands
- Changes in shelter fabric with
adoption of better building
materials
- Uptake of various sources of
energy for lighting and cooking
- Increased demand for goods
and social services such as
educational, administrative,
health and religious services
- Fragmentation of land
- Land disputes and land-use
conflicts
- Establishment of functional and
sustainable human settlements
- Establish land management and control
boards to resolve land disputes and/or
conflicts

157
7.5 Conclusion
From synthesis of data gathered, it is evident that the study area has great potential for various
land-use activities. These include production of food crops, livestock and commercial crops,
environmental conservation and urban development. However, emergent land-use activities
including miraa production have had significant implications on land-use patterns of the area. The
emergence of miraa production has led to enhanced household income and the establishment of
complementary commercial activities in various commercial nodes. At the same time, the
production has led to increased utilization of land and natural resources. Conversely, the
production has led to loss of grazing and bush land, declined production of food crops and
livestock and increased land related conflicts.
There is need to establish a coordinated land-use framework through comprehensive physical
development interventions and projects so as to deal with existing and future development
challenges.
7.6 Recommendations
From the foregoing, the study recommends the following policy measures aimed at ensuring
adoption of sustainable land-use patterns in Mbeere South Sub-County and other rural areas in
the country.
7.6.1 Regulating Land Uses and Settlement Patterns
The study revealed that the emergent land uses and settlement patterns in the study area are not
sustainable. This calls for deliberate measures to regulate land use by preparation of land use
plans at various scales. The aspirations of the National Spatial Plan, which was completed in late
2016 should be cascaded down to the inter-county (regional), county, sub-county and local
(urban) levels. Of essence is the preparation of County Spatial Plans as per provisions of the
County Government Act, 2012 for guiding land use at the county level and to form basis for
preparation of lower level land use-plans.
Land-use plans will provide the essential link with natural resource management and guide future
land-use practices. Planning will also ensure that urban land-uses do not encroach on agricultural
land, compromising agricultural production. It will also facilitate coordinated infrastructure
development and establishment of livable and human settlements among other factors.
7.6.2 Establishing a Framework for Agriculture Development
In addition to the preparation of general land-use plans, the national government and the county
governments should make deliberate efforts to prepare sectoral plans specific to agriculture

158
development. These plans will be aimed at ensuring that agriculture develops concurrently with
other sectors of the national economy and services as an integral part of national planning and
development. Agricultural development plans should be undertaken at various scales, from the
national level to the individual farms. At the farm level, planning should be concerned with
identification of resources available to the individual farmer for enhancing production. It should
promote the distribution of means of production among the farming units in such a way that the
total farm production will be in accordance with the total overall production of the country. The
plan should prescribe measures of activities which will give the farmer optimum returns. It might
be necessary to establish economically sized holdings and to develop farm layout guidelines so as
to assist farmers to optimally utilize their holdings
It follows that the agriculture development planning can only be perfect if it is supported at the
national and local levels, so that production on the national level is connected with and
completely adapted to the production in individual farms. There should be a suitable criterion for
linking national planning with the production processes in individual farms. This linkage should
incorporate the production process, the planning process, industry and services.
In preparing the agriculture plans, planners in the two levels of government need to be alive to the
mutual relationship between agriculture and development. First, the other sectors provide much
of the demand for agricultural products. Second, crucial agricultural inputs are produced in other
sectors. Thirdly, agriculture supplies much of the population for urban growth and much of the
manpower for industrial expansion. Lastly, agriculture and industry compete for capital
resources. There is need to consciously modify the social and institutional structures which affect
agriculture in the country so as to induce farmers to undertake actions independently in the
national interest.
Agricultural sector remains the most viable sector for absorption of the huge labour force in the
near future, hence the need to increase the productivity of labour in agriculture in the face of
rapid population growth and the slow pace of industrialization. The government initiates a
paradigm shift in agricultural policy aimed at making agriculture a lucrative venture, particularly
among the youth. The current situation where the lowest income is that of agricultural laborers
should be reversed.
The agricultural policy should be geared towards capacity building of farmers and laborers so as
to increase their productivity and enhance the efficiency of operations as well as the yields.
Similarly, there should be progressive diversification of the economic activities so as to reverse

159
the trend where the agricultural sector is the near-total economic activity hence the heavy burden
of financial economic development on agriculture. Efforts should be made to change the attitude
of producers towards accessing credit as well as towards the sale and supply and processing
through co-operatives.
The County Governments should promote the modernization of agricultural production so as to
enhance the production. The natural agriculture potential for each region in the country should be
analyzed and enhanced by use of modern production technologies. Optimization of the irrigation
potential should be promoted so as to reduce overreliance on rain fed production. Further,
residents should be encouraged to harvest and conserve storm and rain water at the household
level.
The County Governments should enhance value addition for various agricultural products
produced in their respective counties before they are marketed to ensure higher returns. This
could be achieved through the establishment of processing, packaging industries as well as
branding the various products.
Further, County Governments in ASAL regions should prioritize the development of areas
suitable for rangeland development to enhance the production of livestock and livestock products.
There should also be efforts to improve the infrastructure such as roads, electricity, means of
communication and irrigation infrastructure both for the purpose of land improvement and for
human requirements.
7.6.2.1 Regulating Land Tenure Systems
There is need to give specific attention to problems of land tenure and settlement patterns. Studies
have revealed that defective agrarian structures are almost synonymous with the state of
underdevelopment.
Interventions in land tenure systems should provide smallholders with more equitable and secure
access to land as well as the development of flexible land markets. There is need therefore to
design a scheme suitable for triggering change so as to establish a release mechanism for
economic and social progress. There should be a careful analysis of the fundamental issues of
agricultural development like existing conditions and attitudes before land reforms can be
undertaken. Likewise, adjustment of the agricultural structure should be done so as to align it to
the changing technological needs and the needs of man on the land.
160
7.6.3 Regulating Commercial Crop Production in the Country
The National Government should develop policy guidelines aimed at regulating commercial crop
production in the country aimed at controlling unhealthy competition for space with other land-
uses. Farm dynamics between cash cropping, capital investment and food crop output should be
considered in the commercialization of agriculture among smallholder farmers. The government
policy should identify and facilitate strategic pathways to create positive interactions between
food and cash crops and between the public and private sector. Potential synergies between
commercial production and food crop production should be pursued. More so the various
pathways by which crop commercialization can affect food security and incomes should be
understood so as to develop more informed policies in support of smallholder welfare.
In terms of miraa production, the government should regulate the production by establishing clear
policy guidelines. The production should not be condemned at the face value. Continuous
research on possible triggers of the production will help to demystify the demonized plant.
7.6.3.1 Diversification of Production
It is important to develop a clear framework for integrating miraa production with other forms of
production so as to enhance food security and soil fertility. Establishing minimum landholdings,
promoting diversification of production and establishing research institutions are some of the
measures that could be pursued.
In terms of establishing minimum holdings and diversifying production, it is evident that where
the household landholding is below half an acre (0.5 acre), the farmer may not be able to produce
sufficient food without improved productivity, agricultural technology and credit. Conversely,
farmers with larger landholdings are able to maintain their food crops at the same time allocate
sufficient land to miraa production. Therefore, farmers should be sensitized on the need to sustain
and diversify in food production even as they embrace miraa production. Extension officers and
their land counterparts should advise farmers and would-be land buyers on the most viable
layouts and sizes of holdings so as to ensure enhanced production and optimal utilization of land.
Farmers should be encouraged to integrate miraa farming with other forms of agricultural
production other than undertaking mono cropping of miraa so as to promote self-food sufficiency
at the household level. Sustainable forms of integration such as inter cropping or strip cropping
should be encouraged. More so soil conservation measures such as constructing terraces and
benches should be incorporated. In addition, efforts to conserve water through construction of
sand dams and pans should be promoted to supplement the low seasonal rainfall.

161
The government should also regulate the local miraa market so as to improve both the price of the
product and levies associated with the trade. This shall reduce the exploitation of farmers by
middlemen and at the same time eradicate the thriving curtails that control the trade. Value
addition to miraa should also be promoted through such measures as the construction of standard
collection/packaging sheds, provision of standard packaging materials, cold storage facilities and
possibly pursuing ways of processing miraa from its raw form. The government should provide a
standard design of vehicles used for transporting miraa so as to reduce the menace caused by
Proboxes and pickup vans currently used to transport miraa to Nairobi and other regional
markets. Further, the government should establish international markets for miraa to shield
farmers from shocks associated with repeated threats of banning the product by various States
7.6.3.2 Designating Miraa Collection and Selling Points
Centres that double as miraa collection points should be planned with designated miraa collection
and packaging points which should be situated off the major transport routes. As miraa is highly
perishable, the collection / packaging facilities maybe fitted with cold storage rooms for storing
miraa before its onward transmission to local and regional markets.
There should be carefully thought operational logistics involving diverse actors playing different
roles; efficient trade and social capital so as to transport miraa twigs to final destinations more
efficiently. There should also be adequate parking and loading yards in the envisaged miraa
markets to reduce the pile up of pickup on the road reserves. More so there should be adequate
walk ways and separation of vehicular and human traffic within and around the markets.
The design of the miraa markets should provide adequate space for these complementary
activities associated with miraa trade. The nature of activities and the market sessions in the
miraa markets should be regulated just like in markets for other products. Appropriate fees and
charges for operation should be stipulated and the traders sensitized on the need to pay the same
so as to aid in service delivery such as waste disposal, water supply and security by the county.
7.6.3.3 Establishing Savings and Investment Plans
Farmers and traders should be sensitized on how to invest returns form miraa production on
worthwhile ventures. Existing Non-Governmental Organizations and Faith Based Organizations
should be at the fore front in sensitizing community members on alternative investment channels
and/or how to manage returns from miraa production for long term development and prosperity.
The organizations may assist farmers to form Savings and Credit Cooperatives and to establish
community level vocational training centres to equip community members with relevant technical
skills aimed at discouraging the engagement of minors in miraa production and trade.

162
7.6.3.4 Research on Miraa Production and Uses
To date miraa has continued to be produced and consumed in its raw form. Research on better
farming practices, value addition and research on alternative uses of miraa should be heightened.
Research on improved planting materials, pest and disease control and general husbandly should
be promoted so as to improve the production and possibly change the attitude of people towards
the crop. Options for adding value, which are already being undertaken at small scale such as
drying and grinding twigs and packaging the powder or extracting juice, should be encouraged.
Value addition, in addition to increasing the returns will reduce the need for speedy transportation
of the twigs to the final markets; hence reduce road carnage associated with miraa transportation.
Further, more labour force will be employed in the various processes of value addition.
7.6.4 Institutional Planning for Rural Development
It is necessary to streamline the institutional framework so as to spur rural development. This is
important for provision of the necessary motivation that is required by rural residents so as to
participate actively in national development. It is important to consider such factors as land
tenure, administration, agriculture credit, marketing facilities, co-operation, education and
extension during the organization of rural to participate in national development.
The defeatism of the farmer being the result of economic and social stagnation reinforces poverty,
ignorance and serfdom while adding to economic hopelessness and the humiliation of human
dignity. The farmer should be motivated so as to make additional efforts for increased production
and the rise of his level of living as well as that of rural residents.
Institutional planning should deal with the following aspects so as to provide the most favorable
conditions for the human factor in agricultural production.
7.6.4.1 Administration
Laws and statutes governing agricultural production should provide the farmers with what they
require – credit and extension services so as to strengthen their bargaining power against superior
economic forces which had suppressed them before.
Land policy should be executed in a spirit favorable to the farmers otherwise progress won’t be
possible. Farmers should be encouraged to participate in developing activities by strengthening
their co-operative organizations and associations, by securing equal access to resources and by
providing adequate education and extension services. The price and tax regime should be planned
and implemented as a means to this end.

163
At the national level, frameworks for general land uses and farm management should be
established. This should be complemented by a clear definition of maximum and minimum land
holding acreages as envisaged in the Constitution so as safeguard agricultural land from
unsustainable uses.
At the County level, provisions of national policies on land administration and management
should be unbundled to inform the land administration at the county level. Proper regulation of
the rapid subdivision of land stemming from a complexity of factors should be enforced. At the
same time, fragile lands such as steep slopes, hill tops and riparian reserves should be
safeguarded from unsustainable uses.
Reduction of import duties on fertilizer, pesticides, machinery, fuel and livestock feeds will offer
incentives for increased production.
7.6.4.2 Agriculture Credit
Lack of financial resources is one of the most serious hindrances to the advancement small scale
farmers in the country. There is need to increase the supply of funds for peasant cultivation. This
will be achieved by increasing the supply of credit through rural saving and through providing
additional funds to agriculture. To this end, the organization of appropriate credit structures and
procedures is important. Savings could be increased by increasing rural incomes through
enhanced production. More so, incentives to encourage farmers to save must be provided.
7.6.4.3 Cooperatives
The marketing problem for agricultural products and other challenges that face the agriculture
sector are more than often associated with lack of efficient credit and marketing co-operatives. In
terms of marketing, this makes the middleman a necessity and the exploitation of farmers
inevitable. Farmers are in no position to take advantage of the competition among the middlemen
and re-selling prices of agricultural products as they are in urgent need of cash, and compete
amongst themselves for highest cash advance possible on their produce.
Co-operation results to better results than isolated action. Creative possibilities contained in the
farmers’ co-operation should be pursued while relating them to the specific stages of economic
and social development so as to produce positive results. Co-operation facilitates division of
labour, the initiation of large-scale operations, eases provision of extension services, improves the
marketing systems and increases the saving capacity of the farmers.

164
The government should assist in the organization, financing and operation of marketing facilities
and services, co-operative and marketing boards so as to promote agricultural development and to
stimulate farmers’ incentives
7.6.4.4 Extension and Education
Agriculture development is not possible without inculcating into the younger generation a
positive attitude to rural life and making them understand the benefits of innovation. The ability
to attain a viable future among the smallholders is dependent on the improvement of
infrastructure and education, the distribution of key technologies and inputs and promotion of
producer marketing organizations that can link small farmers to new market chains. Educational
systems should facilitate rural progress, and economic and social advancement for the farmers.
The uptake of extension advice by farmers is highly dependent on the persuasiveness and
reasonableness of the education effort. Thus, a regional approach could be adopted in the
planning of Farmers Training Centres, reviving the existing centres and developing tailor made
courses.
Synergies with the non-farm sector should be fostered so as to help farmers to access to
productive non-farm employment and so draw from existing synergies from agriculture as their
economies grow.
7.7 Areas for Further Research
While this study has provided information on spatial implications of miraa production, it is not
exhaustive in these and other aspects associated with the production. As such the study
recommends further research on miraa production and division and distribution of labour, and on
uptake of technology. Studies have revealed that commercial production affects the division and
distribution of labour in various ways among various forms of production. This in turn affects
household incomes and savings.

165
REFERENCES
1. Africa, N. f. (2003). Farmers Shift to Commercial Farming.Retrieved May 29, 2014, from
www.newsfromafrica.org: http://www.newsafrica.org
2. European Union (2013). Semi- Subsistence Farming: Values and directionofdevelopment .
Retrieved May 29, 2014, from www.europarl.europa.eu: http://www.europarl.europa.eu
3. Benin S., P. J. (2003). Policies for sustainable land management in the East African
highlands: Summary of papers and proceedings of a conference held at the United Nations
Economic Commission for Africa (UNECA), Addis Ababa, Ethiopia, 24–26 April 2002. ILRI
(International Livestock Research Institute) Nairobi.
4. Carrier, N. (2007). Kenyan Khat. IDC Publishers,Netherlands
5. Conzen, M.R.G., Alnwick, Northumberland (1969).A study in town-plan analysis. Institute of
British Geographers, London. Retrieved on 24th June 2013
6. Ellise. (2010). The Encyclopedia of Earth. www. eoearth.org retrieved on 02nd September
2013.
7. Embu (2014). Embu County Integrated Plan 2013 – 2018. Embu County Government
8. FAO/UNEP. (1997, 1991). IPPC Special Report on Land-use, Land-use Change and
Forestry. www.wikipedia.org. Retrieved on 02nd September 2013.
9. Gachimbi, L.N., Kamoni, P.T., Wanjogu, S.N, Macharia P.N and Gicheru, P.T (2007). Using
Farmer Field School Approaches To Overcome Land Degradation in Agro - Pastoral Areas
Project: Land-use Practices In Mbeere District: Biophysical and Socio Economic
Challenges, Coping Strategies and Opportunities: A Baseline Survey Report. KARI, Kenya
10. Gessesse, D. (2013). Favouring a demonized Pant : Khat and Ethiopian Smallholder
Entreprises. Retrieved on 13th June, 2013, from www.diva-portal.org: http://nai.diva-
portal.org
11. Gilliland, Jason and Pierre Gauthier (2006). The Study of Urban Form in Canada. Urban
Morphology 10(1) 51-66. Retrieved on 24th June 2013
12. Goodman, Jordan.(1993) "Tobacco in History: The Cultures of Dependence." Routledge:.
P.129, accessed on 14-06-2013
13. Hannah, L., D. Lohse, C. Hutchinson, J.L. Carr, and A. Lankerani, (1994). A preliminary
inventory of human disturbance of world ecosystems. Ambio.
14. Hobbs, N.T., Schimel, D.S., Owensby, C.E., Ojima, D.S., (1991). Fire and grazing in the tall
grass prairie: contingent effects on nitrogen budgets.Ecology 72:1374–1382
15. Jaetzold R., S. H. (2010). Farm management Handbook of Kenya Vol.II Annex: Atlas of
Agro-Ecological Zones, Soils and Fertilizing by Group of districts in Eastern Province, Sub-

166
part A Embu County. Nairobi. Ministry of Agriculture, Kenya, in Cooperation with the
German Agency for Technical Cooperation (GTZ).
16. Katar, S. (2009). India Natural Resource Economics and Management Foundation. New
Delhi : SAGE Publications Pvt. Ltd .
17. Kate Higgins and Susan P. (2010). Trade, growth and poverty: making Aid for Trade work
for inclusive growth and poverty reduction, Working Paper 313, Results of ODI research
presented in preliminary form for discussion and critical comment.Overseas Development
Institute, UK. www.odi.org.uk. Retrieved on 14th June 2013
18. Kawira, Y. (2013,). Meru leaders, traders seek a reverse to ban on miraa in UK. Daily
Nation 05th July 2013, p. 32.
19. Kieni, L. (1996). Socio- Economic implications of miraa Cultivation in Igembe Division of
Nyambene District, Kenya. University of Nairobi, Kenya: Thesis.
20. Klein, A. (2008). Illicit Trade and Globalization: Khat and the Informal Globalization of a
psychoactive commodity. Cesifo Venice Sunna Institute 14-15 july 2008, Venice International
University. www.cesifogroup.de. Retrieved on 31t may 2013
21. Kothari R.G. (2002). Research Methodology- Methods and Techniques. New Delhi. Wiley
Eastern Ltd
22. Kummer, D.M., (1992). Upland agriculture, the land frontier and forest decline in the
Philippines. Agroforestry Systems 18, 31–46.
23. Lambin E.F., Rounsevell M.D.A and H.J. Geist (2000). Are agricultural land-use models
able to predict changes in land-use intensity? ELSEVIER. www.elsevier.com. retrieved on
04th September 2013.
24. LUCID (2006). Sustainable Intensification of Mixed Crop-Livestock Systems: Lucid Working
Policy Brief No. 1. www.lucideastafrica.org. Retrieved on 24th July 2013
25. MAFAP. (2013). Review of Food and Agricultural Policies in Kenya 2005-2011. Country
Report . Rome,Italy: FAO.
26. Kenya (2012). Concept Paper on Minimum Land Size for Agricultural Land Use (Zero
Draft). Ministry of Agriculture, Nairobi
27. Mugo, F. (2013). The Role of Agriculture in Regional Development. Nairobi: Unpublished
paper.
28. Mugenda, O. and A. Mugenda(2003). Research Methods. Quantitative and Qualititative
Approaches. Acts, Nairobi
29. Mutambo, A. (2016, April 22). President Uhuru Kenyatta announces Sh1bn fund for
miraa farmers. Retrieved April 22, 2017, from www.nation.co.ke:
http://www.nation.co.ke/news/Uhuru-announces-sh 1bn- fund - for miraa farmers/

167
30. Mwangi, P. N. (1998). Introduction . In P. N. Ayele Tirfie, Regional Development Policy in
Africa: Problems and Prospects Toward the 21st century (pp. 1-5). United Nations Centre for
Regional Development, Nairobi.
31. Mwaniki, H. (1973). The Living History of Embu and Mbeere. Nairobi: Kenya Literature
Bureau.
32. Newsfrom Africa. (2003). Farmers Shift to Commercial Farming . Retrieved May 29, 2014,
from www.newsfromafrica.org: http://www.newsafrica.org
33. Njiru N., Augustus M., Owuor G and J. Langat (2013). Effects of Khat production on Rural
Household’s income in Gachoka Division, Mbeere District, Kenya. Journal of Economics and
Sustainable development Vol.4, No.2, 2013.www.liste.org, retrieved on 31st May 2013
34. Omondi. A. K (2008). Impact of contracted sugarcane farming on household food security in
Uriri Division-Kenya. Retrieved on 10th November 2013 from http://repository.uonbi.ac.ke
35. O'Rourke, S. (2006, December 13Th). Concerns over African methamphetamine-like drug in
Hamilton. Retrieved on 03rd June 2013 from The New Zealand Herald:
http://www.wikipedia.com
36. Pearce B.J.(1992). The Effectiveness of the British Land Use Planning System. Town
Planning Review 63(1):13-28
37. Postel, S.L., G.C. Daily, and P.R. Ehrlich, (1996) Human appropriation of renewable fresh
water. Science, 271,785-788, 1996.
38. Kenya Land Alliance (2016). Land Use in Kenya: The Case for a National Land Use Policy.
Land Alliance Printing House Road, Nairobi
39. Kenya, Republic of (1978). Human Settlements in Kenya. A Strategy for Urban and Rural
Development, Ministry of Lands and Settlement. Physical Planning Department, Nairobi.
40. Kenya, Republic of (2005). Mbeere District Strategic Plan 2005- 2010. National
Coordinating Agency for Population and Development, Nairobi.
41. Kenya, Republic of (2007). The Kenya Vision 2030. Government Printer, Nairobi.
42. Kenya, Republic of (2009)1. The Sessional Paper No. 3 on the National Land Policy.
Government Printer, Nairobi
43. Kenya, Republic of (2009)2. Mbeere District Development Plan 2008. Government Printer,
Nairobi
44. Kenya, Republic of (2010). Agricultural Sector development Strategy 2010 -2020.
Government Printer, Nairobi.
45. Kenya, Republic of (2012). Sessional Paper No. 8 of 2010 on National Policy for Sustainable
Development of Northern Kenya and Other Arid Lands. Government Printer, Nairobi.

168
46. Richards, J.F., 1990. Land transformation. The Earth as Transformed by Human Action.
Cambridge University Press, New York.
47. Salat, Serge, (2011). Cities and Forms: on sustainable urbanism. Hermann Ed. Retrieved on
24th June 2013
48. Samora, M. (2013, July 22). Region tries to come to terms with UK's miraaban. The Standard
Xtra , pp. 2- 4.
49. Schimel, D.S.; Little, T.G.F.;Parton, W.J (1991). Terrestrial Biogeochemical Cycles: Global
Interactions with the Atmosphere and Hydrology. Tellus
50. Sioufi, M. E. (2010, June). Climate Change and Sustainable Cities: Major Challenges Facing
Cities and Urban Settlements in the Coming Decades. Retrieved April 08, 2015, from United
Nations Human Settlements Programme UN HABITAT:
https://www.fig.net/pub/monthly_articles/june_2010/june_2010_el-sioufi.html
51. Society for International Development (2010). Urbanization in Eastern Africa. Greater Horn
Outlook Journal. Rockefeller Foundation, Horizon Scanning and Trend Monitoring report.
Greater Horn of East Africa, June 2010
52. The Abolition Project, http://abolition.e2bn.org/slavery_42.html, accessed on 14-06-2013
53. Tom, M. (2017, April 05). Relief for Besieged Miraa Farmers. Retrieved April 22,
2017,fromwww.thebigissue.co.ke:http://www.thebigissue.co.ke/index.php/2017/04/05/relief-
besieged-miraa-farmers/
54. Turner II, B.L., (1989). The human causes of global environmental change. In DeFries, R.S.,
Malone, T. (Eds.), Global Change and Our Common Future: Papers From a Forum. National
Academy Press, Washington, DC.
55. UNODCCP. (1999). The drug nexus in Africa. Retrieved December 11th, 2013, from
www.unodc.org: http://www.unodc.org
56. Vitousek, P.M., H.A. Mooney, J. Lubchenco, and J.M. Melillo, (1997). Human domination of
Earth's ecosystems. Science, 277,494-499, 1997.
57. Weitz R. (1963). Rural Planning in Developing Countries. Routledge and Kegan Paul,
London

169
APPENDICES
Appendix I: Household Questionnaire
Declaration: This information gathered is confidential and will be used purely for academic
purposes
Sub-location ……………………… Village…………………… Questionnaire No. ……
Date of Interview ………………… Name of Interviewer ……………………………….
Tick accordingly in all questions apart from those that require actual information. Where more
than one option is applicable, tick all the appropriate options
SECTION 1: RESPONDENTS GENERAL INFORMATION
1. Name of Respondent (Optional) ………………………………………………………….
2. Relationship with HH……………………………………………………………………….
3. Age ……………
4. Sex Male Female
5. Marital Status
Married Single Divorced/Separated Widowed/Widower
6. Other demographic characteristics of Household head
a) Highest education level and occupation
Highest
Level of education
Main occupation Location of
occupation
Other occupation Location of other
occupation
Primary
Secondary
College
University
7. Other Household characteristics
Size
of
HH
Sex Range of
Ages of
HH
(youngest
to oldest)
No. of
underage
Children
No. of
Children
in Pri
school
No of
children
in
secondary
school
No. of
children in
college
No of HH
members in
employment
M F
8. Household Head monthly income
Income Code:
1=less than 5000, 2 =6000-10000, 3=11000-15000, 4=16000-20000,
5=21000-25000, 6=26000-30000, 7=31000-35000, 8=36000-40000,
9=41000-45000, 10=46000-50000, 11=over 50000
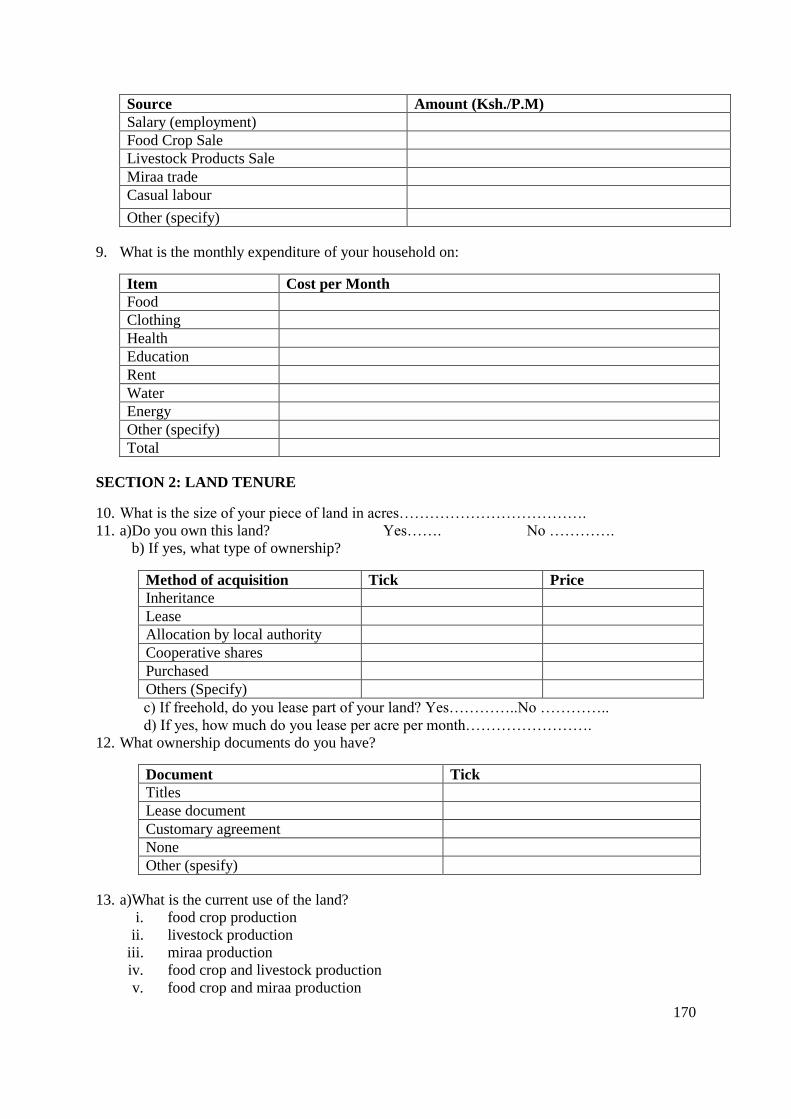
170
Source Amount (Ksh./P.M)
Salary (employment)
Food Crop Sale
Livestock Products Sale
Miraa trade
Casual labour
Other (specify)
9. What is the monthly expenditure of your household on:
Item Cost per Month
Food
Clothing
Health
Education
Rent
Water
Energy
Other (specify)
Total
SECTION 2: LAND TENURE
10. What is the size of your piece of land in acres……………………………….
11. a)Do you own this land? Yes……. No ………….
b) If yes, what type of ownership?
Method of acquisition Tick Price
Inheritance
Lease
Allocation by local authority
Cooperative shares
Purchased
Others (Specify)
c) If freehold, do you lease part of your land? Yes…………..No …………..
d) If yes, how much do you lease per acre per month…………………….
12. What ownership documents do you have?
Document Tick
Titles
Lease document
Customary agreement
None
Other (spesify)
13. a)What is the current use of the land?
i. food crop production
ii. livestock production
iii. miraa production
iv. food crop and livestock production
v. food crop and miraa production

171
vi. other (specify)
b) How did you use the land in the last 10 yrs?
i. food crop production
ii. livestock production
iii. miraa production
iv. food crop and livestock production (mixed farming)
v. food crop and miraa production
vi. other (specify)
14. Do you own other parcels of land besides this one? Yes ………….. No………..
If yes, state the location, size and use
Year of acquisition Admin. Location of land Acreage Use
15. a) Have you subdivided any of your land(s) at any given time?
Yes……………..No……………….. …..
b) If yes, when was the last subdivision (year)…………………………
c) If yes, what promoted the subdivision …………………….
SECTION 3: AGRICULTURAL PRODUCTION
a) Food Crop production
16. a)What crops do you grow on your farm in order of priority?
1. 2…………………3
4……………………….5………………..6………………………..
b) When did you first grow each of the crops indicated above and what is the highest
return enjoyed to date from each
Crop Current Acreage
under the crop
Yr. First
planted
Highest income to date
from the crop
1
2
3
4
5
6
c) What is the acreage for each of the above crops in the past 10 years?
Type of
crop
Acreage over the years
2004 2005 2006 2007 2008 2009 2010 2011 2012 2013
1
2
3
4

172
17. What explanation can you give for variations in the acreage allocated to each of the crops
above?
Crop type Reason for variation in acreage
Crop 1
Crop 2
Crop 3
Crop 4
crop 5
crop 6
18. Of the crops stated above, which one do you consider to have made the most important
contribution to development in the Sub-County?…………………………..and
why?...............................................
………………………………………………………………………………………………
…………..
………………………………………………………………………………………………
………….
19. a) Are the food crops you grow sufficient to feed the family throughout the year?
Yes……….no………..
b) If yes, do you get surplus? Yes…………..No………………………………..
c) If no in (a) above, how do you fill the
deficit?...................................................................
d) Is this the scenario from the past or it is a recent occurrence?
Past………..Recent…………
e) If it is a recent occurrence, what factors can you attribute to the scenario?
i. unreliable rainfall
ii. increase of acreage under miraa cultivation
iii. soil infertility
iv. personal preference for other crops
v. subdivision of land
vi. other reasons
20. Incase food produced is inadequate, how do you intend to cater for the deficit in future?
i. Increasing acreage under food crops
ii. Buying from the market
iii. Growing them in a separate farm
iv. No plans to increase production
v. Other plans (specify)
21. a) Are there crops you used to grow but abandoned at some point? Yes……………
No……………….
b) If yes which ones?
i. Cotton
ii. Maize
iii. Other cereals (millet, sorghum, finger millet)
iv. Legumes (beans, cowpeas, green grams pigeon peas)
v. Traditional vegetables

173
vi. Others ( specify)
c) if yes, why did you stop growing them
i. Unreliable climate
ii. Poor market
iii. Attack by pests and diseases
iv. Reducing land size
v. Soil infertility
vi. Other reasons (specify)
b) Livestock production
23 a) Do you keep any livestock? Yes…… No………….
b) if yes how many of each of the following
Livestock type Number kept
Goats (ordinary)
Dairy goats
Cows
Oxen
Donkeys
Sheep
Bees (in terms of beehives)
Other (specify)
c) If yes, how many of the above have you kept in the last 10 years
Type of
livestock
2004 2005 2006 2007 2008 2009 2010 2011 2012 2013
Goats
(ordinary)
Dairy goats
cows
oxen
donkeys
sheep
Bees
(beehives)
Other
(specify)

174
d) What explanation can you give for increased/reduced number of each of the above?
i. Reasons for reduction
………………………………………………………………………………..
ii. Reasons for
increase……………………………………………………………
If no in (a) above, give
reasons………………………………………………………………………
……………………………………………………………………………………………
……………………………………………………………………………………………
………………………..
Miraa production
24 a) In which year did you start growing miraa………………………….
b) What is the former use of the piece of land currently grown with miraa?
i. crop production
ii. grazing land
iii. homestead
iv. none (virgin land)
v. other use (specify)
e) If any crop was grown on the piece of land, what was the scale of production?
i. subsistence
ii. commercial
f) Why did you abandon the production of the crop stated above?
i. better returns from miraa
ii. collapse of market of crop produced formerly
iii. flooding of the market with the product hence low prices
iv. other reasons (specify)
25 a) Please explain the reasons why you started growing
miraa……………………………………………………..…………………………………
………………………………………………………………………………………………
………………………………………………………………………………………………
……..
26 a) Which varieties do you grow?
i. Variety 1…………
ii. Variety 2………..
iii. Variety 3……….
b) How much of each variety (in kilogrammes) do you produce daily?
iv. Quantity of Variety 1…………
v. Quantity of Variety 2………..
vi. Quantity of Variety 3……….
c) What is the value of miraa produced (Ksh. /Kg)?
d) How the stated value compare to other crops produced or animals does kept?
Item maize beans green
grams
Cow goat sheep chicken honey tomatoes Other
Cost/Kg
or piece

175
27 How has returns from miraa production benefited you?
i. Construction of decent housing
ii. Payment of school fees
iii. Purchase of land
iv. Investment in income generating activities
v. Purchase of motorcycle/vehicle
vi. Paying for health services
vii. Other benefits (specify)
28 a )Do you irrigate your miraa farm yes……No……..
c) if yes, where do you get your water for irrigating your farm
i. river
ii. pond
iii. earth/sand dam
iv. shallow well
v. borehole
vi. rainwater stored in tanks
vii. piped water
viii. other sources (specify)
d) if yes, how far is the source of water from the farm in km
i. 0-1 km
ii. 1-2km
iii. 2-4km
iv. 4-8km
v. 8-10km
vi. 10 + km
d) If yes how many 20ltr jerricans do you use per
day?............................................................................
c) How much do you spend per 20 ltr jerrican of water?.................................
d) How do you get water for irrigation to the farm?
i. Fetching using own cart
ii. Piped
iii. Earth/sand dam
iv. Buy from vendors
v. other
29 How do you integrate miraa on your farm?
i. mono cropping
ii. mixed farming
iii. line intercropping
iv. patch cropping
30 If you mix miraa with other crops, which crops do you grow alongside miraa??
i. maize
ii. legumes (beans, cowpeas, green grams)
iii. fruit crops(mangoes, pawpaws, bananas)
iv. other (specify)
31 How do you control pests on your miraa farm?
i. spraying with pesticides
ii. organic control
iii. use of preying insects
iv. no control method

176
v. other (specify)
32 How do you ensure security of your miraa crop?
i. employ a watchman
ii. fencing around the firm
iii. using “medicine” or spirit fencing
iv. using scarecrows
v. other methods (specify)
33 Do you have any plans to increase miraa production in future?
Yes………No……………….
If yes why,
………………………………………………………………………………………………
…………..
If no
why……………………………………………………………………………………………
……
34 Do you engage any labourers in tending or harvesting miraa Yes….No…
35 If yes, how many labourers?……………
36 If yes, how much do you pay each labourer per day?………….
37 a)Where do you sell your miraa?
i. To middlemen at farm level
ii. At the local markets
iii. In intermediate markets
iv. In Nairobi
v. In Coast
vi. Others (specify)
b) How far is this centre from your farm in kilometers?
i. 0-1 km
ii. 1-2km
iii. 2-4km
iv. 4-8km
v. 8-10km
vi. 10 + km
c)Why do you sell your miraa in the stated area?
i. Convenience
ii. Better returns
iii. Other reason (specify)
38 How do you market your miraa (channels)
i. Producer – consumer
ii. Producer-cooperative-consumer
iii. Producer-middlemen-consumer
iv. Others
39 How do you transport your miraa to the market?
i. On foot
ii. On cycle (bicycle/motorcycle)
iii. Own vehicle
iv. Public means
v. Collected by broker
vi. Porters
vii. Others

177
40 How do you ensure the crop once harvested remains fresh?
i. Wrapping in banana leaves
ii. Putting it in polythene papers
iii. Sprinkling it with water from time to time
iv. Ensuring it is transported fast to the market
v. Other preservation method (specify)
41 How do you ensure the product once harvested reaches the market on time?
i. contacts buyers on phone
ii. hires transport means to rush it to the market
iii. uses own transport means to rush it to market
iv. other method (specify)
42 a) Do you use mobile technology in marketing the crop? Yes….. No…..
b) If yes how
i. calling
ii. texting
iii. social network
43 Do you get any support from the government in the production of miraa? Yes…..
No…..
If yes, what kind of
support………………………………………………………………………………….
44 what kind of problems do you face in miraa production
a. Growing……………………………………………………………………………………
………………………………………………………………………………………
b. Marketing…………………………………………………………………………………
………………………………………………………………………………………
c. Transportation
………………………………………………………………………………………………
……………………………………………………………………………………
45 How can the above problems be
solved?.....................................................................................................
…………………………………………………………………………………………………
……………………………………………………………………………………………
46 a) Are there any land-use conflicts associated with miraa production? Yes…..
No……………..
If yes, what kind of conflict? (Tick accordingly)
i. Land ownership or use disputes
ii. Destruction of crops by livestock
iii. Congestion on roads
iv. Fight over trading spaces
v. Access to water for irrigation
vi. Informal obstruction of water resources to harness water for irrigation
vii. Clearing of natural forests, grazing land and woodlots for miraa farms
viii. Contamination of water sources with pesticides used in miraa farming
ix. Cultivation of riverbeds affecting flow of water downstream
x. Other (specify)
b) Has any member of your household ever been involved in a road accident associated
with miraa trade? Yes………….. No………….
c) If yes, which category?
i. cycle
ii. car (Probox)
iii. matatu

178
iv. other (specify)
47 According to you is miraa associated with the increased number of accidents in the Sub-
County? Yes..........No…………
if no, what could be the
cause…………………………………………………………………………..……………
……………………………………………………………………………………
48 a) Are you a member of any cooperative society? Yes……
No…………………..
b) If yes, what benefits have you gained from being a member towards miraa
production?...........................
…………………………………………………………………………………………………
……………………………………………………………………………………………
49 What other sources of livelihood are you engaged in other than miraa production?
i. Other forms of farming
ii. Formal employment
iii. Running a retail shop
iv. Transport proprietor
v. Member of a microfinance
vi. Rental houses
vii. No other investment
viii. Other investment ( specify)
50 In the recent past, there has been increased miraa production in Mbeere South Sub-
County. What can you attribute this increased production with?
i. Failure of other cash crops
ii. Climate variability
iii. Better returns
iv. Ready market
v. Other factors (specify)
51 According to you, what are some of the costs and benefits of miraa farming in Gachoka
a) Costs
………………………………………………………………………………………………
……………………………………………………………………………………
b) Benefits
………………………………………………………………………………………………
……………………………………………………………………………………
52 According to you, how has miraa farming impacted on :
a. Education
b. Health
c. Commercial areas
d. Environment
e. Crop farming
53 What are the possible solutions to issues highlighted above?
54 What derivative activities have arisen in the Sub-County as a result of miraa farming?
i. Groundnut selling
ii. Soft drinks trade (soda, coffee, tea)
iii. Bars and restaurants
iv. Selling of paper bags and other packaging materials
v. Vibrant transport sector (matatus, proboxes, motorbikes)
vi. General retail activities
vii. Water vending

179
viii. Others (specify)
55 What is your opinion on the ongoing debate on ban of miraa
trade………………………………………………………………………….
56 What can the government do to help miraa farmers?
Appendix II: Questionnaire for Traders
Declaration: This information gathered is confidential and will be used purely for academic
purposes
Questionnaire No. ……
Date of Interview ………………… Name of Interviewer ……………………………….
Tick accordingly in all questions apart from those requiring actual information. Where more than
one option is applicable, tick all the appropriate options
General details
1. Name of Respondent (Optional) ………………………………………………………….
2. Age ……………
3. Sex Male Female
4. Residence of the Trader Within the Sub-County Within the county Outside the county
5. Marital Status Married Single Divorced/Separated Widowed/Widower
6. Highest education level
Primary Secondary College University
7. Trader’s Occupation details
Main occupation Location of occupation Other occupation Location of other occupation
Miraa Trade
8. Which year did you first engage in Miraa trade?
9. What made you to venture into miraa trade?
i. Lack of alternative employment
ii. Lucrative business (better returns)
iii. Search for alternative source of income
iv. Other reasons (specify)
10. What is the scale of your trade?

180
i. Wholesale
ii. retail
11. Are you a member of any miraa SACCO? Yes……No……
b) if yes, which one…………………
c) if no, why?
i. No SACCO has been formed so far
ii. Don’t believe in SACCOs
iii. Other reasons (specify)
12. Where do you get your miraa stock?
i. Direct from farmers
ii. From middlemen
iii. From own farm
iv. From lower level markets
v. Other Sources (specify)
13. What varieties do you sell in order of priority?
Variety 1………………
Variety 2……………….
Variery 3……………….
Variet 4………………..
14. What is the average volume of your stock per day in terms of bundles (paper bags)?
i. 1-3
ii. 4-6
iii. 6-10
iv. 10+
15. What is the average buying price per each bundle? 1=less than 500, 2 =500-900 3=1000- 1400 4=1500-1900
5=2000- 2400 6=2500-2900 7=3000-3400 8=3500-3900
9=over 4000
16. Which is the most popular market channel for miraa in the Sub-County?
v. Producer – consumer
vi. Producer-cooperative-consumer
vii. Producer-middlemen-consumer
viii. Others
17. Where do you sell your products
i. within the Sub-County
ii. within the county
iii. in Nairobi
iv. in Mombasa
v. Other markets (specify)
18. Which among the above markets is the most famous for miraa from Mbeere South Sub-
County?....................................
19. What transport means do you use to transport miraa to final destination?
i. On foot
ii. On cycle (bicycle/motorcycle)
iii. Own vehicle
iv. Public means
v. Collected by broker
vi. Porters
vii. Others
20. a) Are there operation fees for miraa traders? Yes….. No…..
b) If yes, how much per day?..............

181
21. Who are majority among miraa traders?
i. Women
ii. Men
iii. youth
22. What challenges do miraa traders face in order of priority? ( number accordingly)
i. Transport
ii. Prices fluctuations
iii. Control of markets by curtails
iv. government interference
v. seasonal fluctuation of miraa
vi. land issues
vii. Others (specify)
Miraa and development in Mbeere South
23. For how long in your opinion has miraa been grown in Gachoka?
i. For the last 10 yrs
ii. For the last 20 yrs
iii. For the last five years
iv. Don’t know the onset of miraa growing
24. What is the trigger of miraa farming in Gachoka?
i. Ready market
ii. Better returns compared to other farm products
iii. collapse of market for other cash crops
iv. recurrent droughts and famine due to climate change affecting food production
v. other factors (specify)
25. How has the miraa trade performed over years?
i. It has improved
ii. It has declined
iii. It has remained constant
26. What key activities support miraa trade in Gachoka?
i. Commercial activities such as retail shops
ii. Accommodation and hospitality (lodges, bars and restaurants)
iii. Banking services
iv. Mobile money transfer services
v. Other activities(specify)
27. What are some of the major changes that have occurred in the trading areas in the last 10 yrs?
i. Expansion of built up area (increase of traders)
ii. Increase in variety of activities undertaken in the centres
iii. Replacement of semi-permanent premises with permanent ones
iv. Improvement of infrastructure (electricity, water)
v. Change in land values
vi. No change
vii. Other changes (specify)
28. What are some of the positive and negative effects of the crop?
Positive effects Negative effects
1. 1.
2. 2.

182
3. 3.
4. 4.
29. In your opinion what is the greatest benefit to the people of Mbeere Southfrom miraa
production?
i. Improved household income
ii. Improved housing
iii. Improved investment
iv. Better utilization of available land
v. Other benefit (specify)
30. How has miraa farming impacted on the following land-uses in the Sub-County? (write 1 for
positive impact, 2 for negative impact against each choice)
i. food crop production
ii. land management
iii. land transactions
iv. resource use
31. infrastructure
a)Is there government support in miraa production/ trade? Yes…. No…
b) if yes in above, what kind of help……….
32. What is the future of miraa farming in Gachoka?
33. What measures do you think can be put in place to ensure vibrant miraa trade?
Appendix III: Checklist for Key Informants
1. For how long has miraa crop been grown in the division?
2. What is the trigger of miraa farming in Gachoka?
3. How has the miraa trade changed over years?
4. What varieties are grown in the division, which is superior?
5. Which is the most famous market for miraa from Gachoka division?
6. What transport means are used in transporting miraa to final destination, how many of
each means operate in a day?
7. How is miraa market is organized- (who does what, who owns what, are there operation
fees)?
8. What challenges are there in miraa trade- transport, prices, curtails, government
interference, land issues?
9. What key activities support miraa trade in Gachoka?
10. What are some of the major changes that have occurred in the trading areas in the last 10
yrs?
11. What are some of the positive and negative effects of the crop, what is the biggest benefit
from miraa production to the people of Gachoka?
12. Has miraa farming impacted on land use in the division in any way- food crop production,
conversion of land, land transactions, land conflicts, resource use?
13. Who are majority among miraa traders, women, men,youth?
14. Is there government support in miraa production/ trade?
15. What is the future of miraa farming in Gachoka?

183
16. What measures do you think can be put in place to ensure vibrant miraa trade?
Appendix IV: Research Permit