influence of copper or cadmium on soil potassium availability properties
TRANSCRIPT
Influence of Copper or Cadmium on Soil Potassium Availability PropertiesJae E. Yang and Earl O. Skogley*
ABSTRACTThe objective of this research was to determine the nature and
extent of increased soil levels of Cu or Cd on K availability prop-erties. Bozeman silt)' clay (Typic Argiborolls) samples were equili-brated at soil water potentials of — 33 or —100 KPa, at temperaturesof 5 or 20 °C for 3 or 14 d after additions of three levels of K andthree levels of Cu or Cd. Soil solution was extracted by an immis-cible liquid displacement technique. The activity of Ca, Mg, and Kin soil solutions were increased by Cu or Cd additions (aCa > «Mg> «K). The ratio of K to Ca + Mg (K intensity) was decreased byCu or Cd additions when no K was applied, but increased at highlevels of K addition. Soil temperature and water potential interactedwith Cu or Cd additions to alter cation activities. Soil K buffer ca-pacity was decreased by Cu or Cd additions. Increasing addition ofK increased the proportion of K in both exchange and solutionphases, at the expense of both Ca and Mg. Increasing additions ofCu or Cd decreased the fractional saturation of K and Mg, but in-creased that of Ca in the solution phase, with the reverse influencebeing exhibited on the exchange phase. Results indicate that Cu hada stronger influence than Cd (at equal rates of addition) on soilproperties which regulate K availability.
SOIL CHEMICAL PROPERTIES which influence thephytoavailability of K include (i) K activity in soil
solution, (ii) K diffusion rate, (iii) buffering capacity,and (iv) exchange equilibria. Activity of K in the soilsolution is reported to represent readily available Kfor plant uptake (Adams, 1974; Barber, 1984; Beckett,1972; Khasawneh, 1971; Sparks, 1984). Characteri-zation of forces causing changes in soil solutionswould thus allow improved predictions of plant re-sponse to the soil chemical environment (Mortvedtand Khasawneh, 1986). Additions of salts to soilscause changes in cation distributions between solutionand solid phases, which can influence nutrient avail-ability to plants (Baligar et al, 1978; Baligar, 1984).
Over the last several decades, sewage sludge andother wastes containing high concentrations of heavymetals have been applied to agricultural soils. Copperand Cd are two heavy metals of interest because ofpotential toxicity to crops and environmental contam-ination (Macnicol and Beckett, 1985; Mitchell et al.,1978; Robertson et al., 1982). Robertson et al. (1982)reported that sludge application moved Ca, Mg, andto some extent K, to lower depths of the soil profile.Such an effect could reduce availability of these nu-trients to crops, but little else has been reported onthe influence of metals on soil nutrient availability.Dep. of Plant and Soil Science, Montana State Univ., Bozeman,MT 59717. Contribution no. J-2198 from Montana Agric. Exp. Stn.Received 20 June 1988. *Corresponding author.
^Published in Soil Sci. Soc. Am. J. 53:1019-1023 (1989).
Although numerous studies have been conducted tocharacterize K availability, a major problem relates toprocedures used to extract the soil solution so that itclosely represents conditions to which plant roots areexposed. The immiscible liquid displacement (ILD)technique provides a representative soil solution atsoil moisture contents under which crops grow (Mu-barak and Olsen, 1976).
The purpose of this study was to investigate theinfluence of additions of Cu or Cd on nutrient cationactivities and distributions in the soil-solution system.Particular interest was on K, but data were also col-lected for Ca and Mg to illustrate related effects onthese nutrients. Interactions of added Cu or Cd withrate of K addition, soil water potential, and temper-ature were studied to determine their influence on soilfactors related to phytoavailability of K. The ILDmethod of soil solution extraction was used so thatthe data would represent soil water conditions underwhich plants grow.
MATERIALS AND METHODSSurface horizon (Ap) of Bozeman silty clay loam (Typic
Argiborolls) was collected, dried, and passed through a 2mm sieve (Table 1). Three levels of applied K (0, 100, and400 mg K kg-1 as KC1) and three levels of Cu or Cd (0, 100,and 400 mg Cu or Cd kg"' as chloride), were included in acomplete factorial comparison, replicated three times. Soilwater potentials of —33 or —100 kPa were established, fol-lowed by incubation at 5 or 20 °C for 3 or 14 d.
Soil solutions were extracted by immiscible liquid dis-placement (Mubarak and Olsen, 1976), modified to incor-porate the use of freon (l,l,2-trichloro-l,2,2-trifluoro-ethane, d = 1.56 g mL-')- Fifty to 70 g of treated soil sampleswere placed in 250-mL centrifuge tubes (polysulfone) andexcessive amounts of immiscible liquid were added. Tubeswere tightly capped and samples were centrifuged for 30 minat 7000 to 10 000 rpm (5 000-10 000 X g) in a refrigeratedsuperspeed centrifuge. Displaced soil solutions were ana-lyzed for K, Ca, Mg, Cu, and Cd by atomic absorption spec-trophotometry. After decenting the freon, soils were airdried and analyzed for K, Ca, and Mg extracted by IMNH4OAc at pH 7.0 and for Cu and Cd extracted by DTPA(Lindsay and Norvell, 1978).
Activity coefficients used to calculate ion activities fromthe concentrations of free ions were determined from theDebye-Huckel equation (Kielland, 1937), using an estimateof ionic strength from electrical conductivity (Griffin andJurinak, 1973). Fractional saturations of cations in soil so-lution (FSL) and on the exchange phase (PS*) were calcu-lated, assuming K, Ca, and Mg were the major cations in-volved, as follows
FSL K = (KL)/(KL + CaL + MgL)FSX K = [KX]/[KX + Cax + Mgx]
where L represents soil solution phase and () the ion activity

1020 SOIL SCI. SOC. AM. J., VOL. 53, JULY-AUGUST, 1989
Table 1. Properties of Bozeman silty clay loam (Typic Argiborolls) used in this study.PH EC
(1:2) OM
dSm-' %6.5 0.14 2.1
NH4OAc-extracted
K Ca
1.24 16.21
Mg
1.65
Soil moisture
-33 -lOOkPa'1
250 190
Texture Mineral suitef
SiCL IL, SM, QU, KA
t IL = Illite, SM = Smectite, QU = Quartz, and KA = Kaolinite
in soil solution (expressed as mmol Lr1), and X representssoil exchange phase and [ ] the exchangeable cations (ex-pressed as mmolc kg-')-
RESULTS AND DISCUSSIONCu and Cd in the Soil and Soil Solution
Copper concentrations in the soil solution were 2.2and 12.7 Mmol Lr1, where 100 and 400 mg Cu kg-1
were applied to bulk soils, respectively (Table 2).Above 99% of the added Cu was removed from so-lution. Subsequent extraction by DTPA recovered 79to 84% of the Cu, suggesting that most of this Cu wasadsorbed. Any Cu not recovered by DTPA extractionwas probably mostly organically bound to soil organicmatter (Hodgson et al., 1966).
Soil solution concentrations of Cd were greater thanthose of Cu, being 33.4 and 405.0 Mmol Lr1 at 100 and400 mg Cd kg'1 treatments, respectively. Ninety and93% of applied Cd were recovered by DTPA extrac-tion. These results indicate greater capacity of this soilto tie up Cu than Cd.
Bioavailability and toxicity of metals is often re-lated to the ion activity of the free metal in aquaticsystems (Alien et al., 1980). Potential phytotoxicity ofCu or Cd in the soil system is reduced because of thelimited activity of these elements in the soil solution.Table 2. Concentrations of Cu and Cd in the soil solution extracted
by immiscible liquid displacement and those of Cu and Cd ex-tracted by DTPA as affected by Cu or Cd additions.t
Cuor Cdadded
mg kg"'0
100400
Cu
Solution Extractable
ftmol L~' mg kg"'Not 1.852.2 84.18
12.7 311.98
CdSolution Extractable
fjmol L"' mg kg"'ND ND33.4 86.63
405.0 329.24
f Data are averaged (N — 72) over three levels of K, two temperatures, twosoil water potentials, and two incubation times, replicated three times.
$ ND — not detectable.
Even so, the large fraction of added Cu or Cd whichis adsorbed by the soil may induce significant changesin factors which regulate availability of other nutrients(e.g., K).
K, Ca, and Mg Activity in Soil SolutionBecause Cu and Cd are strongly adsorbed by the
soil, their addition to the soil solution as salts, or ascomponents of organic wastes, would result in mostof these metals eventually occupying exchange sites.Nutrient ions for which the soil exchange complex hasless affinity could increase in soil solution.
Activities of K, Mg, and Ca were all increased withincreased Cu or Cd at each level of applied K (Table3). The order of influence of Cu or Cd on cation ac-tivities was aCa > aMg > aK. Increases of aCa andaMg were higher in Cu treated soil than in Cd treatedsoil. These effects of Cu or Cd additions on K, Ca,and Mg activities are due to the high, selective affinityof the soil for these metals (Table 2).
The activity ratio (AR) decreased 11 or 7% at no Kadded as Cu or Cd additions were increased from 0to 400 mg kg-1, respectively. This is due to larger in-creases of aCa and aMg than those of aK at no-Kaddition, even though aK increased with increasingCu or Cd additions. With 100 and 400 mg K kg-'added, AR increased as Cu and Cd additions in-creased.
Regression equations for aK, at each level of ap-plied K, as influenced by Cu or Cd additions are pre-sented in Table 4. There were significant linear rela-tions between aK and K additions, and both Cu andCd additions had a highly significant influence on thisrelationship. The regression models for response sur-faces for these relationships are also included in Table4.
Soil temperature and water potential interactedwith Cu or Cd additions to influence cation activities(Table 5). Activity of K and AR were higher at 20 °C
Table 3. Effects of K, Cu, or Cd addition on the activities of K, Ca, and Mg and activity ratio of solution K over solution Ca plus Mg.fCu Cd
K added added
———— mg kg-' ————
0 0100400
100 0100400
400 0100400
aK
0.950.961.291.171.491.913.213.764.27
aCa
— (mol) -
6.238.60
14.437.67
10.5816.6513.4713.8620.74
aMg103 ————
4.134.647.584.665.668.407.107.70
10.49
AR
- (mol)"2
9.338.708.34
10.5411.6912.0722.3825.6124.16
aK
0.940.901.071.171.381.623.213.503.69
aCa
— (mol) -
6.336.58
10.047.678.24
11.3213.4812.6015.26
aMg10' ———
4.134.695.494.614.666.277.117.048.28
AR
- (mol)"2
9.248.888.59
10.5412.7712.2222.3724.9824.04
t Data are averaged (N = 24) over two soil water potentials, two temperatures, and two incubation times, replicated three ti

YANG & SKOGLEY: INFLUENCE OF CU OR CD ON SOIL K AVAILABILITY PROPERTIES 1021
than at 5 °C at each Cu or Cd treatment, suggestingthat soil K availability would be higher at higher tem-peratures. Results of Ching and Barber (1979) showedthis to be true for K uptake by corn. Cation activitiesincreased at both temperatures as Cu and Cd in-creased from 0 to 400 mg kg"1 with Cu having greaterinfluence than Cd. The order of increased influenceon the three nutrients was aCa > aMg > aK. In-creases of cation activities due to heavy metal treat-ments were higher at 5 °C than at 20 °C. The AR val-ues at 5 °C were almost unchanged, while at 20 °Cthey increased 11 or 9% as Cu or Cd additions in-creased from 0 to 400 mg kg"1, respectively.
Activities of K, Ca, and Mg and AR values werehigher at —100 than at -33 kPa soil water potentialat each Cu or Cd treatment (Table 5). Increases of aKand AR were higher in response to Cu than to Cdaddition and higher at -33 kPa than at -100 kPawater potential. These results suggest that K may bemore available under the drier soil water conditions;however, the decrease in cross-sectional area for dif-fusion and increased tortuosity of the diffusion pathat lower water content would decrease K movementto plant roots (Barber, 1984). These latter effectsTable 4. Regression equations for aK (Y) as influenced by added K
(A} at each level of Cu or Cd, and regression models for responsesurfaces of aK on Cu and Cd amended soils.
Treatment Equationf R2
Regression equations:(mg kg'1)CuO
100400
CdO100400
Y = 0.79 + 0.01 XY = 0.85 + 0.01 XY = 1.24 + 0.01 X
0.92**0.90**0.95**
Y = 0.79 + 0.006 X 0.92*Y = 0.82 + 0.007 X 0.96*Y = 1.02 + 0.006 X 0.92*
Regression model for response surface of aK:aK = 0.6857 + 0.0069 (K add)** + 0.0017 (Cu add)* R2 - 0.98**aK = 0.7369 + 0.0064 (K add)** + 0.0083 (Cd add)* R2 = 0.99***,** Significant at or less than the 0.05 and 0.01 probability levels, respectively.t Data are averaged (N = 24) over two soil water potentials, two temperatures,
and two incubation times, replicated three times.
would probably negate any potential benefit fromhigher nutrient concentrations (Schaff and Skogley,1982). In addition, the proportion of total crop K de-mand which could be satisfied by mass flow would bedecreased as the soil becomes drier, necessitatinghigher rates of K fertilization to assure adequate K forplant uptake under these conditions (Yang and Sko-gley, 1987).
Extractable K, Ca, and MgMost available cations are either dissolved in soil
solution or adsorbed by the exchange system. Becausemost of any given cation is adsorbed, this provides amechanism for buffering the availability of these nu-trients as they are absorbed from the soil solution bygrowing plants. Effects of additions of K, Cu, or Cdon exchangeable K are indicated by the data in Table6.
With the exception of the high rate of addition ofCu, each heavy metal addition resulted in decreasedextractable Ca and slight increases in extractable KTable 6. Extractable K, Ca, and Mg as influenced by K, Cu, or Cd
additions and differences compared to level of DTPA extractableCu or Cd.f
K
0100400
0000
0000
mg kg'1
Cu
000
100400
00
100400
00
C molc kg-'
Cd00000
100400
00
100400
LSD (0.05)
K1.241.421.991.241.321.361.27AK
0.000.080.120.030.02
Ca13.5713.7213.2913.2513.7513.0612.74ACa
-0.320.18
-0.51-0.83
0.18
Mg
5.245.195.095.405.385.415.29AMg
0.160.140.170.050.06
2
20.0520.3320.3719.8920.4519.8319.30AZ
-0.160.40
-0.22-0.75
Cu Cd0.130.49
0.150.58
t Data are averaged (N — 24) over two temperatures, two soil water potentials,and two incubation times, replicated three times.
Table 5. Effects of Cu or Cd additions on cation activities as influenced by soil temperature and water potential.fCu Cd
Treatment Cu or Cd aCa aMg AR aK aCa aMg AR
Soil temperature5 °C
20 °C
mg kg"1
0100400
0100400
1.661.952.371.902.162.61
— mol —(X 10-3)
8.9411.3420.47
9.3010.6914.07
5.296.159.175.315.848.48
(mol)"
13.9214.7413.7715.7216.8017.38
1.651.821.891.902.032.35
— mol —(X 10-')
8.949.22
12.309.319.06
12.11
5.295.126.685.315.116.68
(mol)"
13.8315.2013.7215.7117.0517.14
Soil water potential-lOOkPa
-33 kPa
0100400
0100400
1.942.262.691.611.852.29
10.1312.3019.178.119.73
15.38
5.756.589.814.845.417.84
15.3916.4515.8014.1515.0415.03
1.932.052.241.611.802.01
10.1410.2213.708.118.07
10.71
5.755.737.474.844.505.89
15.3116.2315.4014.1516.0515.60
f Data are averaged (N = 36) over three levels of K, two incubation times, and either two soil water potentials (for temperature) or two temperatures (for soilwater potential), replicated three times.
1022 SOIL SCI. SOC. AM. J., VOL. 53, JULY-AUGUST, 1989
and Mg. Where this occurred, the loss of Ca was nearlybalanced by the gains in K, Mg, and either Cu or Cd.This stoichiometry suggests that the primary effects
FSXK
FSX
K
5 10
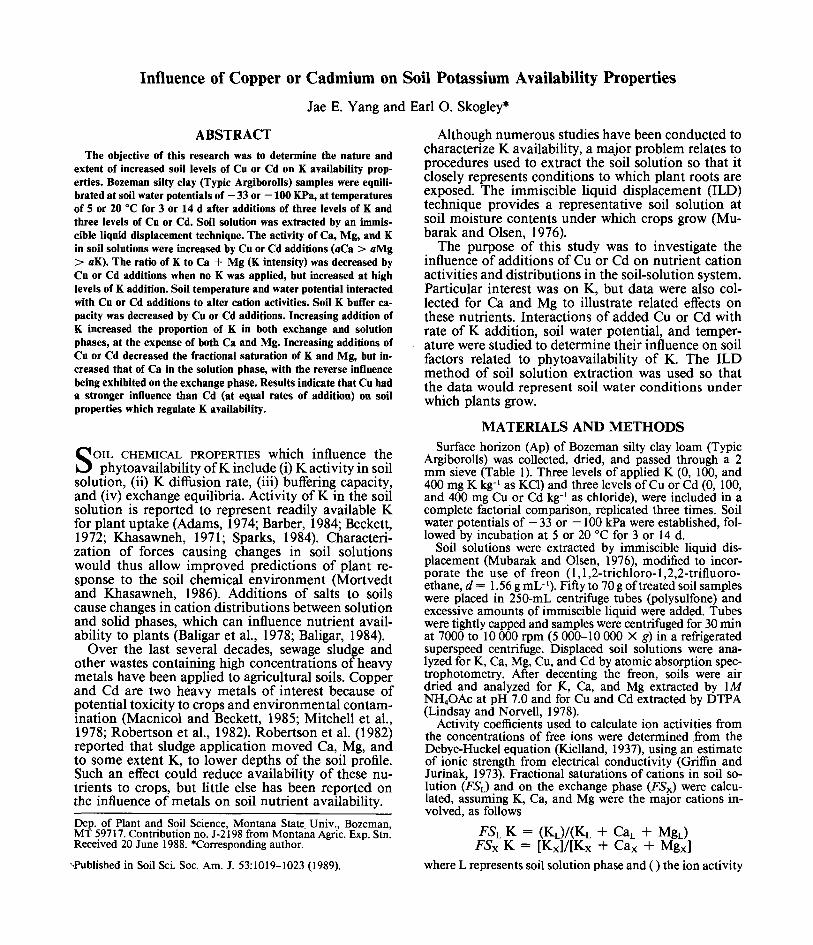
FSL K, %Fig. 1. Effects of (a) Cu and (b) Cd additions on the fractional K
adsorption isotherms.
20
involved are exchange reactions and not due tochanges in the variable charge component of this soil.
The interactions among effects of added K, Cu andCd on K, Ca and Mg can be illustrated by fractionalsaturation figures by combining soil solution data andextractable cation data. These are presented in Fig. 1for Cu- and Cd-amended soils.
The fractional K adsorption isotherms (Fig. 1) showthe distribution of K between solution and exchangephases. The diagonal indicates where equal fractionsof K would be distributed between both phases. Allisotherms lay above the diagonal, with different slopesinduced by Cu or Cd (Table 7). Thus, greater amountsof soil K were distributed on the exchange phase thanin solution. The upward shift of isotherms at low lev-els of solution K due to Cu or Cd additions, indicatesincreased relative affinity of exchange sites for K. Thereduced slope of the isotherms when metals wereadded results in decreased relative affinity of K whenthe FSL K is between only 5 and 10%. Thus, soilshigher in adsorbed K would be influenced to a greaterdegree by heavy metal contamination than those lowin adsorbed K. These results may indicate a differencein the ability of heavy metals, such as Cu and Cd, tointerfere with K selectivity by planar surface charges(generally low in K selectivity) as compared to edgesurface charges (higher in K selectivity) of soil clays(Mengel and Kirkby, 1980).
Soil temperature and water potential interacted sig-nificantly with heavy metal additions to influence
Table 7. Regression equations for FSX K (Y) and FSL K (X) asaffected by Cu or Cd additions.
Treatment
mg kg"'Cu 0
100400
Cd 0100400
Equations
r= 2.5 + .si xY= 7.9+ .13 XY = 10.0 + .10 XY= 2.4 + .83 XY = 6.7 + .24 XY = 7.7 + .35 X
R2
0.75*0.70*0.43*0.76*0.77*0.79*
' Significant at or less than 0.01 probability level.
Table 8. Effects of soil temperature and soil water potential on percent cation fractional saturations in the soil solution phase (FSL) and onthe exchange phase (FSX) as influenced by Cu or Cd additions, t
Cu Cd
CuorTreatment Cd add
mg kg"'Soil temperature
5 °C
20 °C
Soil water potential-lOOkPa
-33 kPa
0100400
0100400
0100400
0100400
K
FSL
Ca Mg . K
FSX
Ca Mg K
FSL
Ca
6.085.613.926.796.495.64
6.315.854.546.566.265.02
59.9062.9068.6360.1562.2660.85
60.7963.3465.0959.2561.8364.39
34.0231.4927.4533.0631.2533.51
32.8830.8030.3534.1931.9130.59
7.248.208.528.047.788.03
7.628.038.257.667.958.29
67.7964.6865.2765.8465.7865.75
66.8865.2265.4766.7565.2565.55
24.9727.1226.2126.1226.4426.22
25.5026.7526.2825.5926.8026.16
6.066.445.116.787.326.23
6.296.395.206.567.386.14
59.9161.7263.4260.1660.8962.33
60.8261.7363.4559.2560.8962.30
Mg K
FSX
Ca Mg
34.0331.8431.4733.0631.7931.44
32.8931.8831.3534.1931.7331.56
7.248.308.308.048.358.33
7.618.278.307.668.398.33
67.7364.5564.3765.8464.8465.10
66.8264.7264.7266.7564.6764.74
25.0327.1527.3326.1226.8126.57
25.5827.0126.9825.5926.9426.93
t Data are averaged (N = 36) over three levels of K, two incubation times, and either two soil water potentials (for temperature) or two temperatures (for waterpotential), replicated three times.

SHARPLEY: RELATIONSHIP BETWEEN SOIL POTASSIUM FORMS AND MINERALOGY 1023
fractional saturation of cations (Table 8). Values forFSL K were higher at 20 °C and -33 KPa water po-tential, but FSL Ca was higher at 5 °C and -100 kPawater potential. Increments of decreased FSL due toCu or Cd additions of 400 mg kg"1 were higher at 5 °Cthan at 20 °C and higher at -100 KPa than at -33kPa. Greater decrement in FSL K values were causedby Cu than by Cd additions at each soil temperatureand water potential at all levels of added Cu or Cd.
Although the primary effect of heavy metal contam-ination of soils will be more important than secondaryeffects, results of this study demonstrate that heavymetal contamination of soils could also be expectedto have influences on plant nutrient availability. Fac-tors which will be influenced include solution activi-ties (concentrations) of nutrient ions, distribution be-tween solution and exchange phases, and soil bufferpotential. Effects on K, a monovalent ion, are as greatas on divalent Ca or Mg in response to divalent heavymetal (Cu or Cd) additions, but Cu is also shown tocause greater changes than Cd at equal rates of addi-tion. Research on tolerable levels of soil contamina-tion from heavy metals, relative to toxicity effects ongrowing plants, may need to include these additionalaspects to allow for better management of contami-nated soils.