influence antilipolytic effect isolated humanfat cells...
TRANSCRIPT

Influence of Obesity on the AntilipolyticEffect of Insulin in Isolated Human FatCells Obtained Before and AfterGlucose IngestionPeter Amer, Jan Bolinder, Peter Engfeldt, Johan Hellmer,and Jan OstmanKarolinska Institute, Department of Medicine and the ResearchCenter at Huddinge Hospital, Huddinge, Sweden
Abstract. The antilipolytic effect of insulin wasstudied in 9 obese and 10 age- and sex-matched subjectsof normal weight. Isolated fat cells were taken before and1 h after an 100 g oral glucose load. Insulin inhibitionof basal and isoprenaline-induced rates of lipolysis weredetermined by using a sensitive bioluminescent glycerolassay. Whencompared with the controls, the obese groupshowed a lower glucose tolerance, a higher insulin secre-tion, and a lower specific insulin receptor binding peradipocyte surface area, which would suggest an insulin-resistant state. Before oral glucose, however, the sensitivityof the antilipolytic effect of insulin was enhanced 10-foldin obesity (P < 0.01), but the maximum antilipolyticeffect was not altered. Glucose ingestion induced a 10-25-fold increase in insulin sensitivity (P < 0.01) and a10% but not significant increase in specific adipocyte in-sulin receptor binding in the nonobese group. In the obesegroup, however, neither the insulin binding nor the an-tilipolytic effect of the hormone was increased by oralglucose. After oral glucose, insulin sensitivity was similarin the two groups. The concentration of the hormonewhich produced a half maximum effect was about 1 gU/ml. Similar results were obtained with insulin inhibitionof basal and isoprenaline-stimulated glycerol release. Itis concluded that, after an overnight fast, the sensitivityof the antipolytic effect of insulin is markedly enhancedin adipocytes of "insulin-glucose resistant" obese subjects,presumably because of alterations at postreceptor levels
Address all correspondence to Dr. Arner, Department of Medicine,Huddinge Hospital, S-141 86 Huddinge, Sweden.
Receivedfor publication 8 June 1983 and in revisedform 4 November1983.
of insulin action. In obesity, the antilipolytic effect ofinsulin seems normal after glucose ingestion. Further-more, in adipocytes of subjects of normal weight, oralglucose rapidly stimulates the sensitivity of the antili-polytic effect of insulin, apparently because of changesat postreceptor sites. This short-term regulation of insulinaction following the ingestion of glucose does not seemto be present in obesity.
Introduction
It is well known that the hypoglycemic effect of insulin is at-tenuated in obesity. This is evidenced by an apparent decreasein the sensitivity and responsiveness (maximum action) of insulin(1, 2). Sensitivity usually reflects insulin binding, whereas re-sponsiveness mirrors insulin action at postreceptor levels (3).A decrease in insulin receptor binding (4), as well as in thesensitivity and responsiveness of insulin stimulation of glucosetransport (5, 6), has been demonstrated in obesity by usinghuman adipocytes. Thus, insulin resistance in obesity may bedue to a combination of receptor and postreceptor defects ininsulin action on glucose transport. However, insulin has severalother primary actions. One of the more important is the in-hibition of lipolysis in fat cells. Whether this insulin effect isaltered in obese subjects is a matter of uncertainty. This maypartly be due to the methodological difficulties of estimatinglipolysis, which occurs at a slow rate in human fat cells (7). Wehave recently developed an ultrasensitive bioluminescent tech-nique for the determination of glycerol release from humanadipocytes (8). This allows a detailed analysis to be made ofthe dose-response relationship of insulin inhibition of lipolysisin microsamples of these cells (9). Furthermore, insulin resistancerepresents a chronic change in insulin action which developsslowly. However, acute adaptation of the antilipolytic effect ofinsulin has recently been demonstrated in man. Thus, humanfat cells obtained I h after glucose ingestion show a markedincrease in insulin sensitivity (10).
In the present study, the antilipolytic effect of insulin andinsulin receptor binding were studied in isolated fat cells obtainedfrom 9 obese subjects and 10 age- and sex-matched subjects of
673 Insulin Action in Obesity
J. Clin. Invest.© The American Society for Clinical Investigation, Inc.0021-9738/84/03/0673/08 $ 1.00Volume 73, March 1984, 673-680
normal weight. Subcutaneous fat was obtained before and 1 hafter the oral ingestion of 100 g of glucose. A marked increasein the sensitivity of the antilipolytic of insulin was observed inobesity before glucose ingestion. In contrast to the nonobesesubjects, however, no further increase in insulin sensitivity couldbe demonstrated in the obese subjects after glucose ingestion.
Methods
Subjects. The study groups consisted of 10 healthy subjects of normalweight and 9 weight-stable obese subjects who were otherwise healthy.They are described in Table I. The onset of obesity occurred in childhood.None of the obese subjects had recently been on a slimming programinvolving caloric restriction or physical exercise. All subjects were on adiet consisting of -45% carbohydrates, 35% fat, and 20%protein, whichhad been calculated from a 24-h recall. None had a recent history ofthe intake of any drug known to affect glucose tolerance, insulin release,or adipose tissue metabolism. The subjects were examined in the out-patient's department at 8 a.m. after an overnight fast. The study wasauthorized by the hospital's Ethical Committee. Informed consent wasobtained from all subjects.
Protocol. A biopsy of subcutaneous adipose tissue (-0.5 g) wastaken from the gluteal region under local anesthesia. Pilocarpin wasinjected in a way that did not affect adipose tissue metabolism (11).After the biopsy, 100 g of glucose was ingested and samples of venousblood were drawn for the determination of plasma glucose (12) andplasma immunoreactive insulin (13) at 0, 15, 30, 45, 60, 90, and 120min. At 60 min, another fat biopsy was taken. Isolated fat cells wereprepared by Rodbell's method (14).
Lipolysis determination. Isolated fat cells were incubated at a finalconcentration of '20,000 cells/ml (2%, vol/vol) in Krebs-Henseleitbicarbonate buffer containing glucose (2 mg/ml), albumin (40 mg/ml),isopropyl noradrenaline (0 or 6 X 10⁻⁶ mol/liter), and insulin (0, 0.1,0.25, 1, 2.5, 10, 25, 100, 250, and 1000 (;U/ml). It was not alwayspossible to use all of the insulin concentrations. The albumin:free fattyacid molar ratio was 3:1. It was necessary to use a high glucose con-centration in the medium in order to obtain a constant antilipolyticeffect of insulin in the isoprenaline experiments, since fat cells sometimeswere resistant to insulin at glucose concentrations below 2 mg/ml (9).Each incubation was run in duplicate at 370C with 02:CO2 (95:5) asthe gas phase. The total incubation volume was 0.2 ml. After incubation,aliquots of the medium were removed for the determination of glycerol,by using a bioluminescent technique that has been described in detail(8). The detection limit for glycerol was 0.5 Mmol/liter. The coefficientof variance for glycerol release in one subject was 6%.
Determination of insulin binding. Isolated fat cells were incubatedin duplicate or triplicate at a final cell concentration of 4% (vol/vol) for60 min at 240C in Krebs-Henseleit bicarbonate buffer (pH 7.4) containingalbumin (40 mg/ml), glucose (2 mg/ml), mono-'2514Tyr A,4-insulin(0.05 pmol/ml), and unlabeled insulin (0-50 pmol/ml). The total in-cubation volume was 0.2 ml. The binding reaction was terminated byadding 2.5 ml of ice-cold saline and rapidly centrifuging the cells through0.7 ml of silicon oil (15). The supernatant cells were then removed fordetermination of radioactivity. Nonspecific binding was measured inthe presence of 20 nmol/ml of unlabeled insulin. All data were correctedfor nonspecific binding. Specific tracer binding increased in a linearfashion when fat cells were incubated in concentrations ranging from1-33% (vol/vol). With the use of this method, (a) insulin degradationis negligible, (b) nonspecific binding is low, about 4%, and (c) a steady
state of insulin binding is always reached after 40 min and maintainedfor at least 120 min (16). The coefficient of variance for insulin bindingto isolated fat cells was 7% in one subject.
Fat cell determination. Fat cell size was measured (17), and meanfat cell volume and mean fat cell weight were calculated by using pre-viously described methods (18).
Chemicals. Crystalline glucagon-free porcine insulin was kindlysupplied by Vitrum AB, Sweden. Mono-'2514Tyr A14-insulin was ob-tained from Novo Research Institute, Copenhagen, Denmark and bovineserum albumin (fraction V) from the Armour Pharmaceutical Co., En-gland.
Expression of the results. Glycerol release and insulin binding wereexpressed per number of cells. Insulin binding was also expressed percell surface area. The number of cells incubated was determined bydivision of the lipid weight of the incubated sample by the mean fatcell weight. Insulin responsiveness was defined as glycerol release in theabsence of insulin minus glycerol release at the maximum effectiveinsulin concentration. Insulin sensitivity was determined in three ways.First, the ascending part of the mean dose-response curves for the an-tilipolytic effect of insulin was linearized by using a plot of log insulinconcentration versus the log (y/100 -y), where y denotes the inhibitionof lipolysis at a particular insulin concentration, which was expressedas a percentage of the maximum inhibitory effect. The apparent half-maximum effect (ED,0)' was obtained from the point where the lineintersects the abscissa at zero. This plot has been described in detailelsewhere (19). Differences in left-right position between linearized meandose-response curves were tested statistically (see below). Significantdifferences in the slope and the intercept between lines were consideredto represent differences in insulin sensitivity. Secondly, the individualED50-values were calculated from each single dose-response curve.Thirdly, the lowest concentration of insulin used that gave a significantinhibition of glycerol release in the obese and nonobese groups, re-spectively, was determined. The insulin-binding experiments were ex-pressed by competition curves and by Scatchard's method (20).
Statistical methods. The reported values represent themean±standard error of the mean. The student's paired and unpairedt test, linear regression analysis by the method of least squares, and theF distribution test (21) were used for statistical evaluation of the results.
Results
Blood glucose, plasma insulin, and fat cell size. Table I showsthat two of the obese subjects (Nos. 4 and 8) had an elevatedfasting blood glucose at the time of the investigation. They werestudied on two other occasions and the values were then normal.The obese subjects had moderate fasting hyperinsulinemia (TableI). Their bodyweight was 75% higher and their fat cells were35% larger than those of the nonobese subjects (Table I). Theresults of a 100 g oral glucose load are shown in Fig. 1. In bothgroups, the blood glucose and plasma insulin were significantlyelevated at 60 min when the second biopsy was taken. In com-parison with the nonobese subjects, the obese ones displayedsignificantly higher glucose and insulin values over a 2-h period,which indicated an insulin-resistant state. Oral glucose did notaffect fat cell size (data not shown).
1. Abbreviation used in this paper: ED50, half-maximum effect.
674 P. Arner, J. Bolinder, P. Engfeldt, J. Hellme'r, and J. tstman
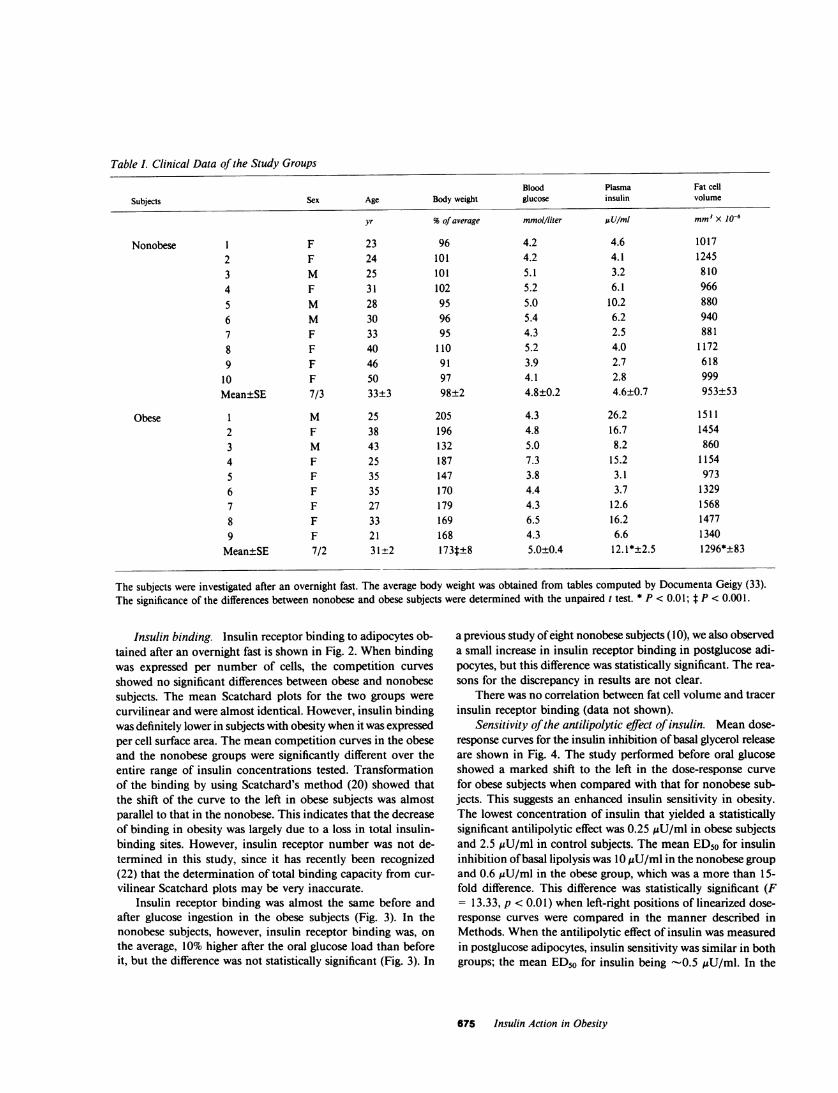
Table I. Clinical Data of the Study Groups
Blood Plasma Fat cell
Subjects Sex Age Body weight glucose insulin volume
yr %of average mmol/liter UsU/mI mm3x 1o-6
Nonobese 1 F 23 96 4.2 4.6 10172 F 24 101 4.2 4.1 12453 M 25 101 5.1 3.2 8104 F 31 102 5.2 6.1 966
5 M 28 95 5.0 10.2 8806 M 30 96 5.4 6.2 9407 F 33 95 4.3 2.5 8818 F 40 110 5.2 4.0 11729 F 46 91 3.9 2.7 618
10 F 50 97 4.1 2.8 999Mean±SE 7/3 33±3 98±2 4.8±0.2 4.6±0.7 953±53
Obese 1 M 25 205 4.3 26.2 15112 F 38 196 4.8 16.7 14543 M 43 132 5.0 8.2 8604 F 25 187 7.3 15.2 11545 F 35 147 3.8 3.1 9736 F 35 170 4.4 3.7 13297 F 27 179 4.3 12.6 15688 F 33 169 6.5 16.2 14779 F 21 168 4.3 6.6 1340
Mean±SE 7/2 31±2 173t±8 5.0±0.4 12.1*+2.5 1296*+83
The subjects were investigated after an overnight fast. The average body weight was obtained from tables computed by Documenta Geigy (33).The significance of the differences between nonobese and obese subjects were determined with the unpaired t test. * P < 0.01; t P < 0.00 1.
Insulin binding. Insulin receptor binding to adipocytes ob-tained after an overnight fast is shown in Fig. 2. Whenbindingwas expressed per number of cells, the competition curvesshowed no significant differences between obese and nonobesesubjects. The mean Scatchard plots for the two groups werecurvilinear and were almost identical. However, insulin bindingwas definitely lower in subjects with obesity when it was expressedper cell surface area. The mean competition curves in the obeseand the nonobese groups were significantly different over theentire range of insulin concentrations tested. Transformationof the binding by using Scatchard's method (20) showed thatthe shift of the curve to the left in obese subjects was almostparallel to that in the nonobese. This indicates that the decreaseof binding in obesity was largely due to a loss in total insulin-binding sites. However, insulin receptor number was not de-termined in this study, since it has recently been recognized(22) that the determination of total binding capacity from cur-vilinear Scatchard plots may be very inaccurate.
Insulin receptor binding was almost the same before andafter glucose ingestion in the obese subjects (Fig. 3). In thenonobese subjects, however, insulin receptor binding was, onthe average, 10% higher after the oral glucose load than beforeit, but the difference was not statistically significant (Fig. 3). In
a previous study of eight nonobese subjects (10), we also observeda small increase in insulin receptor binding in postglucose adi-pocytes, but this difference was statistically significant. The rea-sons for the discrepancy in results are not clear.
There was no correlation between fat cell volume and tracerinsulin receptor binding (data not shown).
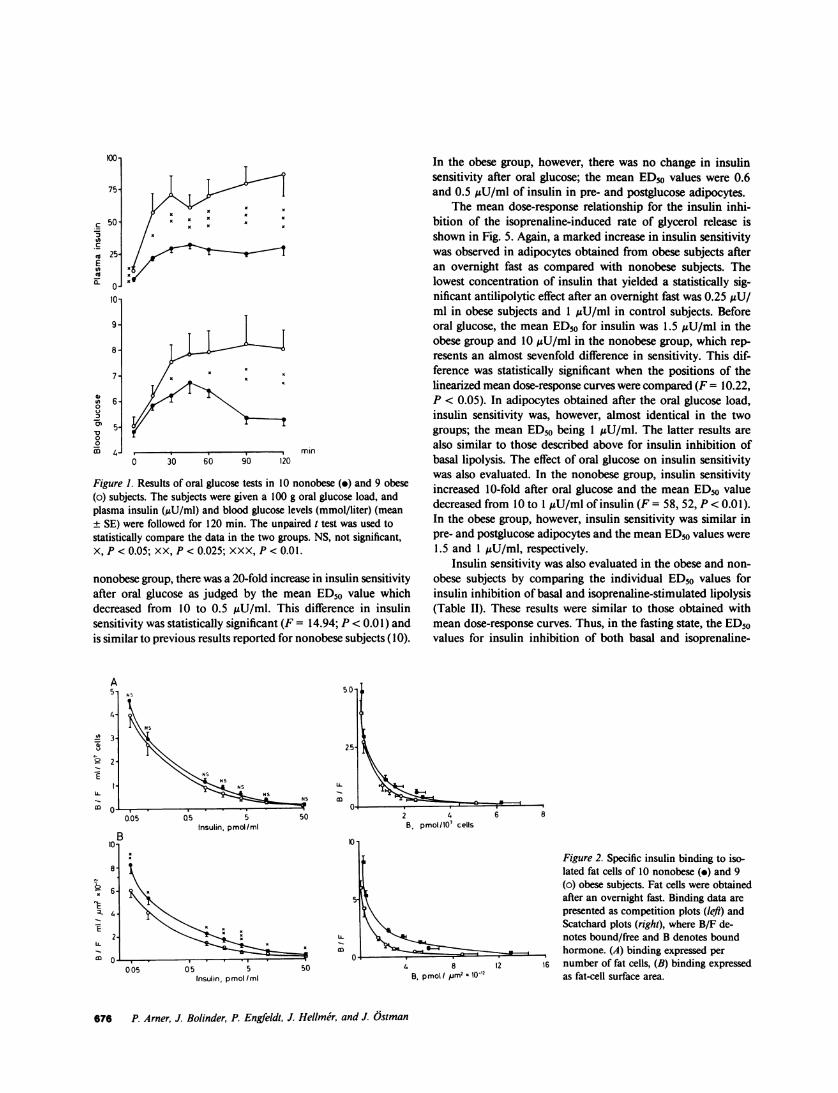
Sensitivity of the antilipolytic effect of insulin. Mean dose-response curves for the insulin inhibition of basal glycerol releaseare shown in Fig. 4. The study performed before oral glucoseshowed a marked shift to the left in the dose-response curvefor obese subjects when compared with that for nonobese sub-jects. This suggests an enhanced insulin sensitivity in obesity.The lowest concentration of insulin that yielded a statisticallysignificant antilipolytic effect was 0.25 AU/ml in obese subjectsand 2.5 AcU/ml in control subjects. The mean ED50 for insulininhibition of basal lipolysis was 10 !U/ml in the nonobese groupand 0.6 AU/ml in the obese group, which was a more than 15-fold difference. This difference was statistically significant (F= 13.33, p < 0.01) when left-right positions of linearized dose-response curves were compared in the manner described inMethods. Whenthe antilipolytic effect of insulin was measuredin postglucose adipocytes, insulin sensitivity was similar in bothgroups; the mean ED50 for insulin being -0.5 AU/ml. In the
675 Insulin Action in Obesity
looi
75
50
tv 25-E
10-
7-
6-
0 30 60 90 120min
Figure 1. Results of oral glucose tests in 10 nonobese (.) and 9 obese(o) subjects. The subjects were given a 100 g oral glucose load, andplasma insulin (pU/ml) and blood glucose levels (mmol/liter) (mean± SE) were followed for 120 min. The unpaired t test was used tostatistically compare the data in the two groups. NS, not significant,X, P < 0.05; XX, P < 0.025; XXX, P < 0.01.
nonobese group, there was a 20-fold increase in insulin sensitivityafter oral glucose as judged by the mean ED50 value whichdecreased from 10 to 0.5 ,U/ml. This difference in insulinsensitivity was statistically significant (F = 14.94; P < 0.01) andis similar to previous results reported for nonobese subjects (10).
A5 , ,0,
4-
U ~~~~~~~~~~~~~~~25-
LL
03n5
Insulin, pmol/ml50 2
B. pm~
005 05 5 50 4Insulin, pmol /ml B, pr
In the obese group, however, there was no change in insulinsensitivity after oral glucose; the mean ED" values were 0.6and 0.5 uU/ml of insulin in pre- and postglucose adipocytes.
The mean dose-response relationship for the insulin inhi-bition of the isoprenaline-induced rate of glycerol release isshown in Fig. 5. Again, a marked increase in insulin sensitivitywas observed in adipocytes obtained from obese subjects afteran overnight fast as compared with nonobese subjects. Thelowest concentration of insulin that yielded a statistically sig-nificant antilipolytic effect after an overnight fast was 0.25 ,uU/ml in obese subjects and 1 AU/ml in control subjects. Beforeoral glucose, the mean ED50 for insulin was 1.5 AU/ml in theobese group and 10 AU/ml in the nonobese group, which rep-resents an almost sevenfold difference in sensitivity. This dif-ference was statistically significant when the positions of thelinearized mean dose-response curves were compared (F = 10.22,P < 0.05). In adipocytes obtained after the oral glucose load,insulin sensitivity was, however, almost identical in the twogroups; the mean ED50 being 1 MU/ml. The latter results arealso similar to those described above for insulin inhibition ofbasal lipolysis. The effect of oral glucose on insulin sensitivitywas also evaluated. In the nonobese group, insulin sensitivityincreased 10-fold after oral glucose and the mean ED50 valuedecreased from 10 to 1 gU/ml of insulin (F = 58, 52, P < 0.01).In the obese group, however, insulin sensitivity was similar inpre- and postglucose adipocytes and the mean ED50 values were1.5 and 1 AU/ml, respectively.
Insulin sensitivity was also evaluated in the obese and non-obese subjects by comparing the individual ED50 values forinsulin inhibition of basal and isoprenaline-stimulated lipolysis(Table II). These results were similar to those obtained withmean dose-response curves. Thus, in the fasting state, the ED50values for insulin inhibition of both basal and isoprenaline-
4 6 8nol/10' cells
Figure 2. Specific insulin binding to iso-lated fat cells of 10 nonobese (-) and 9(o) obese subjects. Fat cells were obtainedafter an overnight fast. Binding data arepresented as competition plots (left) andScatchard plots (right), where B/F de-notes bound/free and B denotes boundhormone. (A) binding expressed per
8 12 16 number of fat cells, (B) binding expressednol mm2 10-2 as fat-cell surface area.
676 P. Arner, J. Bolinder, P. Engfeldt, J. Hellmer, and J. Ostman
C75inC
U,in0
-3cn
000
xx m
x
x x xx
x
x x x
x
5-

4
3
2
IA
0.05 05 5Insulin, pmol/ml
0.05 05 5Insulin, pmol/ml
50
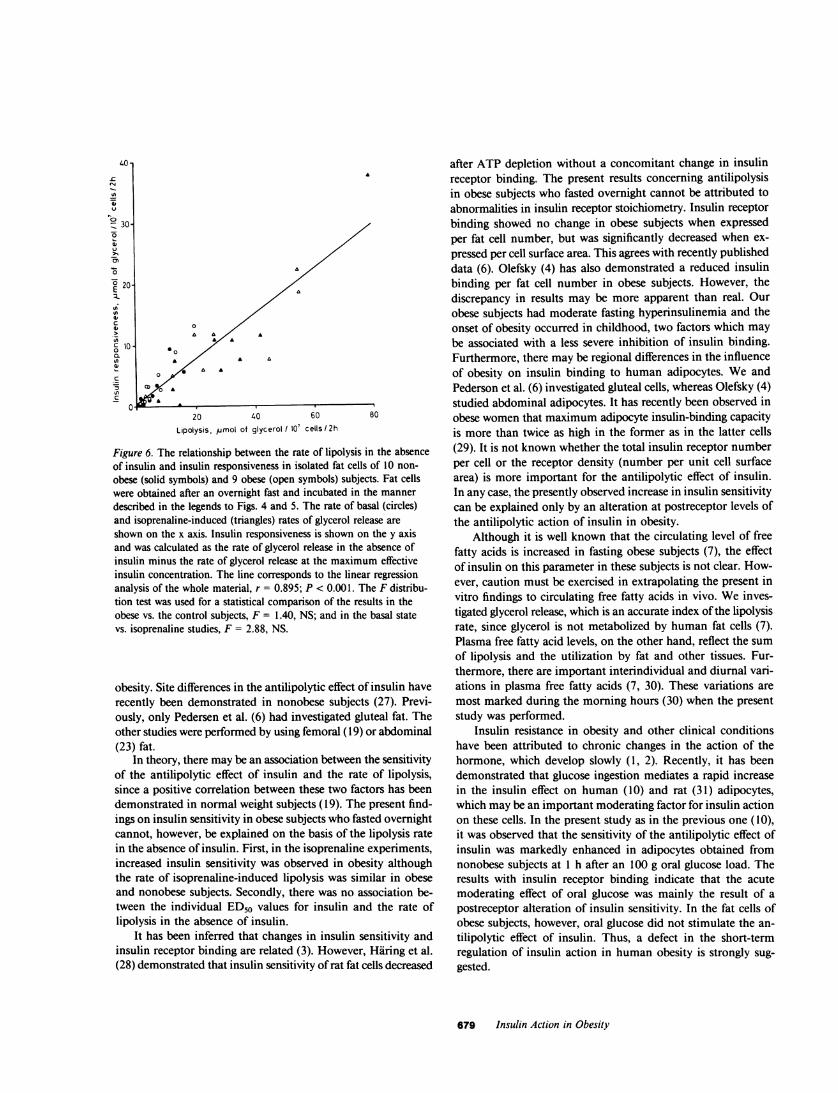
tween studies in the basal state and in the presence of isoprenaline(F = 2.9), or between results in obese and nonobese subjects(F = 1.4). Positive correlations between the rate of glycerolrelease and insulin responsiveness were also observed for basallipolysis in obese (r = 0.987) and control subjects (r = 0.843)as well as for isoprenaline-induced lipolysis in obese (r = 0.815)and nonobese subjects (r = 0.942). These results indicate thatinsulin responsiveness was similar in obese and nonobese subjectswhen the insulin action occurred at identical rates of lipolysis.
Basal and isoprenaline-induced rates of lipolysis. After anovernight fast, the basal rate of glycerol release was 50% higherin obese than in nonobese subjects, i.e., 6.2±1.5 and 4.2±1.0gmol/ I0O cells per 2 h, respectively. This is in accordance withprevious findings (7). The rates of isoprenaline-induced glycerolrelease were, however, similar in the two groups after an over-night fast, 29.7±6.9 and 28.9±6.7 ,tmol/107 cells per 2 h, re-spectively.
Neither in the obese nor in the nonobese group did oralglucose affect the basal or the isoprenaline-induced rates of li-polysis (data not shown).50
Figure 3. Effect of oral glucose on specific insulin binding to isolatedfat cells of (A) 9 obese and (B) 10 nonobese subjects. Fat cells wereobtained before (solid lines) and 60 min after (broken lines) a 100 goral glucose load. Binding data are presented as competition plots.See legends to Figs. I and 2 for further details.
induced lipolysis were significantly higher in the nonobese thanin the obese group. In the nonobese group, significantly higherED50 values for insulin inhibition of both basal and isoprenaline-stimulated lipolysis were recorded in preglucose fat cells as com-pared with postglucose adipocytes. These differences were notobserved in the obese group. After oral glucose, the ED50 valuesfor insulin were similar in obese and in nonobese subjects, inboth the basal state and the presence of isoprenaline. The in-dividual ED50 values for insulin were not correlated with therate of glycerol release in the absence of insulin (data not shown).
Responsiveness of the antilipolytic effect of insulin. It appearsfrom the mean dose-response curves in Figs. 4 and 5 that insulinresponsiveness after an overnight fast was also enhanced in theobese group. When individual values were analyzed, maximuminsulin-induced inhibition of the basal rate of glycerol releasewas 4.4±1.3 gmol/10' cells per 2 h in the obese group and2.1±0.4 lmol/10' cells per 2 h in the nonobese group. Thisdifference, however, was of only borderline statistical significance(0.01 > P > 0.05). The individual values for maximum insulininhibition of isoprenaline-induced lipolysis were almost identicalin the obese and the nonobese groups, being 10.4±2.4 and9.6±3.4 tmol/107 cells per 2 h, respectively. Insulin respon-
siveness depended on the lipolysis rate, as shown for preglucoseadipocytes in Fig. 6. In the entire material (obese and nonobese,basal and isoprenaline experiments), there was a strong asso-
ciation between the rate of glycerol release in the absence ofinsulin and the maximum insulin-induced inhibition of glycerolrelease (r = 0.89; P < 0.01). No differences were observed be-
Discussion
The present results on antilipolysis in "insulin-resistant" obesesubjects differ substantially from those previously reported forglucose metabolism. Both the sensitivity and the responsivenessof insulin stimulation of glucose transport have been shown to
A
F =13.33p<0.01
0.8
4
-c 2-
in
76 1-/aI
°- 00.1
- D
VS
C4 F=Z NSt 3-
t2-
1-i
< 0.
Figure 4. Insulin inhibition3 of basal glycerol release in
isolated fat cells of 10 non-
obese (solid symbols) and 9obese (open symbols) sub-
jects. Fat cells were incu-bated with various concentra-
tions of insulin. The antili-polytic effect of insulin was
100 looo calculated as the rate of glyc-insulin, pjU/ml erol release in the absence of
insulin minus the rate in the10 presence of insulin. The
mean dose-response curves
are shown. For statisticalcomparison, the ascending
4/ _/ part of these curves was lin-earized using log-logit trans-formation, as described inMethods. The position of the
loo ' lines in the plot was deter-Insulin, WiU/ml mined by using linear regres-
sion analysis. The statisticaldifference in the position between lines was determined by the F-dis-tribution test (21). The F value and the level of significance are givenin the graph. The concentration of insulin giving the ED50 is ob-
tained where the regression line crosses the abscissa at zero. This isindicated in the dose-response curve by an arrow. (A) Fat cells ob-
tained before oral glucose, (B) fat cells obtained 60 min after oral
glucose. See legend to Fig. I for further details.
677 Insulin Action in Obesity
0
L-
co
-4::.
4
-c, 6-
vI., 4-0
- 4-E 2-
C7L._co B_ 10F
_. N
I*-. /1 Figure 5. Insulin inhibition° J-1//[ 1 of isoprenaline-induced li-.a ,r I 1 polysis in isolated fat cells< of 10 nonobese and 9 obese
subjects. Fat cells were in-21 cubated in the presence of
isoprenaline and various in-0 1*,0, , . sulin concentrations. Other
01l 1 16 1~100100 details are the same as inhnsulin p/U/ml Fig. 4.
be reduced in adipocytes obtained from obese subjects after anovernight fast (5, 6). Weobserved a marked increase in sensi-tivity, and a normal or increased responsiveness of the antili-polytic effect of insulin in this situation. Thus, insulin resistancein obese human fat cells does not seem to be an overall phe-nomenon. It may even solely involve glucose metabolism sinceprimary actions other than glucose transport and antilipolysishave not yet been investigated. Insulin sensitivity in this studywas evaluated in three ways. Individual ED"o values were in-vestigated. Mean dose-response curves for the obese and non-obese groups were analyzed. Finally, the lowest concentrationof insulin that yielded a significant antilipolytic effect was de-termined. Increased sensitivity after an overnight fast was ob-
served in obese subjects by using all three methods. Furthermore,the results were similar in studies of insulin inhibition of basaland isoprenaline-induced lipolysis.
Our findings differ also from previous reports on the anti-lipolytic effect of insulin on adipose tissue obtained from obesesubjects after an overnight fast. Jacobsson et al. (23) foundnormal insulin inhibition of catecholamine-induced glycerol re-lease in adipose tissue segments. In our study, insulin inhibitionof basal lipolysis in segments of adipose tissue was normal (19).Pedersen et al. (6) found a decreased insulin inhibition of cat-echolamine-induced lipolysis in isolated adipocytes. There maybe several reasons for the discrepancy in the results of inves-tigations of antilipolysis in obesity. Previously, less sensitiveenzyme methods were used to determine the glycerol productionwhich occurs at low rates in human fat cells (7). High fat cellconcentrations have been used to obtain measurable glycerolvalues. Fat cells or fat segments were previously incubated atconcentrations corresponding to 150,000-500,000 cells/ml. Atthese fat cell concentrations, endogenous metabolites, such asfree fatty acids and adenosine, may accumulate and inhibitlipolysis in human fat cells (24, 25) or alter the sensitivity ofthe antilipolytic effect of insulin (26). The influence of endog-enous metabolites is negligible at the adipocyte concentration(20,000 cells/ml) used in this study. Furthermore, insulin in-hibition of basal and catecholamine-induced lipolysis in humanfat cells has recently been found to be modified by the glucoseconcentration in the medium (9). The maximuminsulin-inducedinhibition of lipolysis occurred when the concentration of glucosewas 2 mg/ml (9). The glucose concentration used previouslywas lower than in the present study, i.e., 0.2 (23) and 1 mg/ml(6), respectively. Thus, variations in incubation conditions mayat least partly explain the differences in results obtained withantilipolysis in obesity. However, other factors, such as the typeof obesity, may also play a role. Weinvestigated subjects withchildhood obesity, who were only moderately hyperinsulinemic.Insulin action may be different in those adult-onset obese sub-jects, who tend to be more hyperinsulinemic. Finally, the locationof the adipose tissue may be of importance for antilipolysis in
Table I. Concentrations of Insulin-producing ED50 of the Lipolysis Rate
ED,0 (pU/ml, Mean±SE)
Basal state Isoprenaline
Before After Before AfterStudy group glucose glucose P, before vs. after glucose glucose P. before vs. after
Nonobese 11.9±4.9 2.5± 1.2 <0.025 7.5±3.0 0.6±0.2 <0.02Obese 0.8±0.2 1.4±0.5 NS 0.8±1.0 0.8±1.8 NSP, nonobese vs. obese <0.02 NS <0.05 NS
Isolated fat cells obtained from 10 nonobese and 9 obese subjects were incubated in the basal state or with isoprenaline (6 umol/liter). The dose-response relationships for insulin inhibition of basal or isoprenaline-induced glycerol release were evaluated in each subject and the individualED50-values were determined. Statistical analysis was done by using the paired t test (within groups) and the unpaired t test (between groups).NS, not significant.
678 P. Arner, J. Bolinder, P. Engfeldt, J. Hellmer, and J. Ostman
Insulin, pU/ml
40-
CN=A
6-6E°4
n
4,cC
c0
-50
20 40 60
Lipolysis, umol of glycerol / 107 cells / 2h
80
Figure 6. The relationship between the rate of lipolysis in the absenceof insulin and insulin responsiveness in isolated fat cells of 10 non-obese (solid symbols) and 9 obese (open symbols) subjects. Fat cellswere obtained after an overnight fast and incubated in the mannerdescribed in the legends to Figs. 4 and 5. The rate of basal (circles)and isoprenaline-induced (triangles) rates of glycerol release areshown on the x axis. Insulin responsiveness is shown on the y axisand was calculated as the rate of glycerol release in the absence ofinsulin minus the rate of glycerol release at the maximum effectiveinsulin concentration. The line corresponds to the linear regressionanalysis of the whole material, r = 0.895; P < 0.001. The F distribu-tion test was used for a statistical comparison of the results in theobese vs. the control subjects, F = 1.40, NS; and in the basal statevs. isoprenaline studies, F = 2.88, NS.
obesity. Site differences in the antilipolytic effect of insulin haverecently been demonstrated in nonobese subjects (27). Previ-ously, only Pedersen et al. (6) had investigated gluteal fat. Theother studies were performed by using femoral (19) or abdominal(23) fat.
In theory, there may be an association between the sensitivityof the antilipolytic effect of insulin and the rate of lipolysis,since a positive correlation between these two factors has beendemonstrated in normal weight subjects (19). The present find-ings on insulin sensitivity in obese subjects who fasted overnightcannot, however, be explained on the basis of the lipolysis ratein the absence of insulin. First, in the isoprenaline experiments,increased insulin sensitivity was observed in obesity althoughthe rate of isoprenaline-induced lipolysis was similar in obeseand nonobese subjects. Secondly, there was no association be-tween the individual ED50 values for insulin and the rate oflipolysis in the absence of insulin.
It has been inferred that changes in insulin sensitivity andinsulin receptor binding are related (3). However, Haring et al.(28) demonstrated that insulin sensitivity of rat fat cells decreased
after ATP depletion without a concomitant change in insulinreceptor binding. The present results concerning antilipolysisin obese subjects who fasted overnight cannot be attributed toabnormalities in insulin receptor stoichiometry. Insulin receptorbinding showed no change in obese subjects when expressedper fat cell number, but was significantly decreased when ex-
pressed per cell surface area. This agrees with recently publisheddata (6). Olefsky (4) has also demonstrated a reduced insulinbinding per fat cell number in obese subjects. However, thediscrepancy in results may be more apparent than real. Ourobese subjects had moderate fasting hyperinsulinemia and theonset of obesity occurred in childhood, two factors which maybe associated with a less severe inhibition of insulin binding.Furthermore, there may be regional differences in the influenceof obesity on insulin binding to human adipocytes. We andPederson et al. (6) investigated gluteal cells, whereas Olefsky (4)studied abdominal adipocytes. It has recently been observed inobese women that maximum adipocyte insulin-binding capacityis more than twice as high in the former as in the latter cells(29). It is not known whether the total insulin receptor numberper cell or the receptor density (number per unit cell surfacearea) is more important for the antilipolytic effect of insulin.In any case, the presently observed increase in insulin sensitivitycan be explained only by an alteration at postreceptor levels ofthe antilipolytic action of insulin in obesity.
Although it is well known that the circulating level of freefatty acids is increased in fasting obese subjects (7), the effectof insulin on this parameter in these subjects is not clear. How-ever, caution must be exercised in extrapolating the present invitro findings to circulating free fatty acids in vivo. Weinves-tigated glycerol release, which is an accurate index of the lipolysisrate, since glycerol is not metabolized by human fat cells (7).Plasma free fatty acid levels, on the other hand, reflect the sumof lipolysis and the utilization by fat and other tissues. Fur-thermore, there are important interindividual and diurnal vari-ations in plasma free fatty acids (7, 30). These variations aremost marked during the morning hours (30) when the presentstudy was performed.
Insulin resistance in obesity and other clinical conditionshave been attributed to chronic changes in the action of thehormone, which develop slowly (1, 2). Recently, it has beendemonstrated that glucose ingestion mediates a rapid increasein the insulin effect on human (10) and rat (31) adipocytes,which may be an important moderating factor for insulin actionon these cells. In the present study as in the previous one (10),it was observed that the sensitivity of the antilipolytic effect ofinsulin was markedly enhanced in adipocytes obtained fromnonobese subjects at 1 h after an 100 g oral glucose load. Theresults with insulin receptor binding indicate that the acutemoderating effect of oral glucose was mainly the result of apostreceptor alteration of insulin sensitivity. In the fat cells ofobese subjects, however, oral glucose did not stimulate the an-tilipolytic effect of insulin. Thus, a defect in the short-termregulation of insulin action in human obesity is strongly sug-gested.
679 Insulin Action in Obesity
The further increase in body weight in obesity, in spite ofresistance to insulin action on glucose metabolism, is a perplexingfinding. However, only a minute part of ingested glucose ismetabolized by human adipose tissue (32). In obesity, both thefasting and the postprandial insulin levels are increased. This,coupled with the increased sensitivity of antilipolysis in fastingand normal sensitivity after glucose ingestion, suggest that li-polysis is more suppressed in obese than in nonobese subjectsunder all physiological circumstances. This may explain whyincrease adipose mass and fat cell size continue to increase inobese subjects in spite of "insulin-glucose" resistance.
Acknowledgments
This study was supported by grants from the Swedish Medical ResearchCouncil, the Karolinska Institute, the Swedish Medical Association, theNordic Insulin Foundation, the Swedish Diabetes Association, and theOsterman and Folksam Research Foundations.
References
1. Olefsky, J. M. 1981. Insulin resistance and insulin action. An invitro and in vivo perspective. Diabetes. 30:i48-162.
2. Olefsky, J. M., and 0. G. Kolterman. 1981. Mechanisms of insulinresistance in obesity and non-insulin-dependent (type II) diabetes. Am.J. Med. 70:151-168.
3. Kahn, C. R. 1978. Insulin resistance, insulin insensitivity andinsulin unresponsiveness: a necessary distinction. Metab. Clin. Exp.27:1893-1902.
4. Olefsky, J. M. 1976. Insulin binding to adipocytes and circulatingmonocytes from obese patients. J. Clin. Invest. 57:1165-1172.
5. Ciaraldi, T. P., 0. G. Kolterman, and J. M. Olefsky. 1981. Mech-anism of the postreceptor defect in insulin action in human obesity.Decrease in glucose transport system activity. J. Clin. Invest. 68:875-880.
6. Pedersen, O., E. Hjbllund, and N. S. Sorensen. 1982. Insulinreceptor binding and insulin action in human fat cells: effects of obesityand fasting. Metab. Clin. Exp. 31:884-895.
7. Bjbrntorp, P., and J. Ostman. 1971. Human adipose tissue. Dy-namics and regulation. Adv. Metab. Disord. 5:277-327.
8. Bjbrkhem, I., P. Arner, A. Thore, and J. Ostman. 1981. Sensitivekinetic bioluminescent assay of glycerol release from human fat cells.J. Lipid. Res. 22:1142-1147.
9. Amer, P., J. Bolinder, and J. 6stman. 1983. Glucose stimulationof the antilipolytic effect of insulin in humans. Science (Wash. DC).220:1057-1059.
10. Amer, P., J. Bolinder, and J. Ostman. 1983. Marked increasein insulin sensitivity of human fat cells one hour after glucose ingestion.J. Clin. Invest. 71:709-714.
11. Amer, P., 0. Arner, and J. Ostman. 1973. The effect of localanaesthetic agents on lipolysis by human adipose tissue. Life Sci. 13:16 1-169.
12. Coburn, H. J., and J. J. Carrol. 1973. Improved manual andautomated calorimetric determination of serum glucose with use ofhexokinase and glucose-6-phosphate-dehydrogenase. Clin. Chem.19: 127-130.
13. Wide, L., R. Axen, and J. Porath. 1967. Radioimmunosorbentassay for proteins. Chemical couplings of antibodies to insoluble dextran.Immunochemistry. 4:381-386.
14. Rodbell, M. 1964. Metabolism of isolated fat cells. I. Effects ofhormones on glucose metabolism and lipolysis. J. Biol. Chem. 239:375-380.
15. Glieman, J., and 0. Sonne. 1978. Binding and receptor-mediateddegradation of insulin in adipocytes. J. Biol. Chern. 253:7857-7863.
16. Bolinder, J., J. Ostman, and P. Amer. 1982. Post-receptor defectscausing insulin resistance in normoinsulinemic non-insulin-dependentdiabetes mellitus. Diabetes. 31:911-916.
17. Sjdstrbm, L., P. Bjdrntorp, and J. Vrana. 1971. Microscopic fat-cell size measurements of frozen-cut adipose tissue in comparison withautomatic determinations of osmium-fixed fat cells. J. Lipid. Res. 12:52 1-530.
18. Hirsch, J., and E. Gallian. 1968. Methods for the determinationsof adipose cell size and cell number in man and animals. J. Lipid. Res.9:110-119.
19. Amer, P., J. Bolinder, P. Engfeldt, and J. Ostman. 1981. Theantilipolytic effect of insulin in human adipose tissue in obesity, diabetesmellitus, hyperinsulinemia and starvation. Metab. Clin. Exp. 30:753-760.
20. Scatchard, G. 1949. The attraction of proteins for small moleculesand ions. Ann. NY Acad. Sci. 51:660-672.
21. Neter, J., and W. Wasserman. 1974. Comparison of two regressionlines. In Applied Linear Statistical Models. R. D. Irwin, editor. Universityof Illinois Press, Champaign, IL. 160.
22. Klotz, J. M. 1982. Numbers of receptor sites from Scatchardgraphs: facts and fantasies. Science (Wash. DC). 217:1247-1249.
23. Jacobsson, B., G. Holm, P. Bjbrntorp, and U. Smith. 1976.Influence of cell size on the effects of insulin and noradrenaline onhuman adipose tissue. Diabetologia. 12:69-72.
24. Ohisalo, J. J. 1981. Effects of adenosine on lipolysis in humansubcutaneous fat cells. J. Clin. Endocrinol. Metab. 52:359-363.
25. Bums, T. W., P. E. Langley, B. E. Terry, and G. A. Robinson.1978. The role of free fatty acids in the regulation of lipolysis by humanadipose tissue cells. Metab. Clin. Exp. 12:1755-1762.
26. Schwabe, U., P. S. Schbnhbfer, and R. Ebert. 1974. Facilitationby adenosine of the action of insulin on the accumulation of adenosine3':5'-monophosphate, lipolysis and glucose oxidation in isolated fat cells.Eur. J. Biochem. 46:537-545.
27. Bolinder, J., L. Kager, 3. Ostman, and P. Amer. 1983. Differencesat the receptor and postreceptor levels between human omental andsubcutaneous adipose tissue in the action of insulin on lipolysis. Diabetes.32:117-123.
28. Hiring, H. U., F. Rinninger, and W. Kemmler. 1981. Decreasedinsulin sensitivity due to a post-receptor defect as a consequence ofATP-deficiency in fat cells. FEBS (Fed. Eur. Biochem. Soc.) Lett.132:235-238.
29. Bolinder, J., P. Engfeldt, J. Ostman, and P. Amer. 1983. Sitedifferences in insulin receptor binding and insulin action in subcutaneousfat of obese females. J. Clin. Endocrinol. Metab. 57:455-461.
30. Schlierf, G., and E. Dorow. 1973. Diurnal patterns of triglycerides,free fatty acids, blood sugar, and insulin during carbohydrate inductionin man and their modification by nocturnal suppression of lipolysis. I.Clin. Invest. 52:1732-1740.
31. Livingston, J. N., and R. T. Moxley, III. 1982. Glucose ingestionmediates a rapid increase in the insulin responsiveness of rat adipocytes.Endocrinology. 111:1749-1751.
32. Bjdrntorp, P., and L. Sjdstrbm. 1978. Carbohydrate storage inman: speculations and some quantitative considerations. Metab. Clin.Exp. 27:1853-1865.
33. Documenta Geigy. 1970. Scientific Tables. Geigy Pharmaceu-ticals, Basel, Switzerland. Seventh ed.
680 P. Arner, J. BoUnder, P. Engfeldt, J. Hellmer, and J. istman