inflation targetingbydebtorcentral banks in emerging ... · guatemala 1.9 brazil 3.5 iceland 9.3...
TRANSCRIPT

Inflation Targeting by Debtor Central Banks in
Emerging Market Economies
Franziska Schobert

Agenda
• Debtor central banks: Global overview & case studies
• Is there an extra inflation bias for inflation targeting debtor central banks? Some answers from an extended Barro-Gordon model.
• Floating exchange rates and monetary policy • Floating exchange rates and monetary policy autonomy under surplus liquidity - a model and some simulated results for South and East Asian central banks
• Central bank losses and exiting from fixed exchange rate regimes – the case of the Deutsche Bundesbank

Stylized Central Bank Balance Sheet
Assets Liabilities
Net Foreign Assets (NFA) Currency in Circulation (CIC)
Domestic Assets: Required Reserves (RR)
Open Market Operations(OMO)
Excess Reserves (X)
4
(OMO)
Net Private Sector Claims (Net PS claims)
OMO
Net Government Lending(NGL)
Capital accounts

Defining a Liquidity Surplus
• Net monetary policy operations on the liability side
• Alternatively: Sum of autonomous factors on the assetside exceed sum of autonomous factors on the liabilityside („financing gap“)
• Definition depends crucially on distinguishing monetary
5
• Definition depends crucially on distinguishing monetarypolicy operations from autonomous factors.

Structural Liquidity Deficit
Net financial assets
Banknotes
CBA LNet financial assets
Banknotes
CBA L
Increasing over time, stylized evolution in case of the Eurosystem, 1999 - 2010
6
Monetary policy operations
Required reserves
Excess reserves
Monetary policy operations
Required reserves
Excess reserves

Eurosystem (bn EUR)
400
600
800
1000
1200 -1300
-800
-300
7
-800
-600
-400
-200
0
200
31.0
1.19
99
31.0
5.19
99
30.0
9.19
99
31.0
1.20
00
31.0
5.20
00
30.0
9.20
00
31.0
1.20
01
31.0
5.20
01
30.0
9.20
01
31.0
1.20
02
31.0
5.20
02
30.0
9.20
02
31.0
1.20
03
31.0
5.20
03
30.0
9.20
03
31.0
1.20
04
31.0
5.20
04
30.0
9.20
04
31.0
1.20
05
31.0
5.20
05
30.0
9.20
05
31.0
1.20
06
31.0
5.20
06
30.0
9.20
06
31.0
1.20
07
31.0
5.20
07
30.0
9.20
07
31.0
1.20
08
31.0
5.20
08
30.0
9.20
08
31.0
1.20
09
-300
200
700
Net foreign assets (left scale) Lending to euro area financial sector (left scale) Currency (right scale)

Structural Liquidity Surplus
CBA L
Net financial
Banknotes
CBA L
Increasing over time, stylized evolution due to the accumulation of foreign reserves or due to the accumulation of domestic net financial assets
Net financial
Banknotes
8
Required reserves
Excess reserves
Net financial assets
Required reserves
Excess reserves
Monetary policy operations
Net financial assets Monetary policy
operations

Bank of Korea (bn Won)
100000
200000
300000
-320000
-220000
-120000
9
-200000
-100000
0
31.0
1.19
99
31.0
1.20
00
31.0
1.20
01
31.0
1.20
02
31.0
1.20
03
31.0
1.20
04
31.0
1.20
05
31.0
1.20
06
31.0
1.20
07
31.0
1.20
08
31.0
1.20
09
-20000
80000
180000
Net foreign assets (left scale) Securities (right scale) Currency (right scale)

Sources of the Surplus
Source Driving autonomous factor
1. Accumulation of foreign reserves
Net foreign assets
2. Monetary financing Claims to the government or priority sectors
10
sectors
3. Financial sectorstabilisation
Lending to banks or other financialintermediaries, often substituted byclaims to government

Global Empirical Evidence:
11Löffler/ Schnabl/ Schobert (2011) The Illusion of Monetary Policy Autonomy by Freely Floating Debtor Central Banks in South and East Asia, mimeo

Case Study: Malaysia & Bangladesh
Exchange Rate Regime
• Malaysia evolved from„pegged“ to „managed float“.
• Bangladesh evolved from„pegged & devaluations“ to
12Löffler/ Schnabl/ Schobert (2011) The Illusion of Monetary Policy Autonomy by Freely Floating Debtor Central Banks in South and East Asia, mimeo
„pegged & devaluations“ to„float“ to „pegged again“.

Case Study:Malaysia & Bangladesh
13Löffler/ Schnabl/ Schobert (2011) The Illusion of Monetary Policy Autonomy by Freely Floating Debtor Central Banks in South and East Asia, mimeo

Liquidity Surplus: Implications
Implementing monetary policy can imply substantial sterilisation costs.
The central bank runs the risk of losses, which can have implicationsfor its reputation and even independence*. Cost considerations mayinfluence the interest rate setting behaviour.
Domestic financial sector development can be slowed (central bank is
14
Domestic financial sector development can be slowed (central bank isdebtor to the domestic financial sector, however, it is creditor to thefinancial markets of reserve currency countries).
If the source of the surplus are net foreign assets, an increasingliquidity surplus also implies an increasing currency mismatch andexchange rate risks.
*Stella P. (2005), Central bank financial strength, transparency and policy credibility, IMF Staff Papers 52 (2005), pp. 355–365.

Different Ways to Sterilize
1) Market-based monetary policy instruments, e.g. effectively implemented open market operations and standing facilities or reserve requirements remunerated at market rates.
2) Less or non-market-based monetary policy instruments, e.g. reserve requirements with no or low remuneration or the coercive sale of
15
requirements with no or low remuneration or the coercive sale of central bank securities below market rates.

Croatian National Bank (bn Kuna)
26000
46000
66000
-74000
-54000
-34000
-14000
16
-74000
-54000
-34000
-14000
6000
31.0
1.19
99
31.0
1.20
00
31.0
1.20
01
31.0
1.20
02
31.0
1.20
03
31.0
1.20
04
31.0
1.20
05
31.0
1.20
06
31.0
1.20
07
31.0
1.20
08
31.0
1.20
09
-14000
6000
26000
46000
66000
Net foreign assets (left scale) Reserves of banks (right scale) Currency (right scale)

Co-ordination with Fiscal Authorities
Willingness to cooperate? If yes, then consider e.g.
Shifting government deposits from commercial banks to the central bank
Asking the fiscal authorities to issue securities for monetary policy purposes, extra funds are deposited at the central bank
Harmonizing features of securities issued by the fiscal authorities and the
17
Harmonizing features of securities issued by the fiscal authorities and the central bank in order to enhance market liquidity
* Gray, S. (2005) Central bank management of surplus liquidity, Handbooks in Central Banking, Lecture Series No. 6, Centre for Central Banking Studies, Bank of England

Sovereign Wealth Fund
In case foreign exchange revenues accrue to the public sector: sterilization costs & surplus liquidity can be avoided, if foreign exchange revenues are saved by the public sector.
In case foreign exchange revenues accrue to the private sector: the central bank and the sovereign wealth fund must decide how to share the sterilization costs.
18
sterilization costs.

Bank of Russia (bn Rouble)
5000
10000
15000
-16000
-11000
-6000
19
-10000
-5000
0
31.0
1.19
9931
.07.
1999
31.0
1.20
0031
.07.
2000
31.0
1.20
0131
.07.
2001
31.0
1.20
0231
.07.
2002
31.0
1.20
0331
.07.
2003
31.0
1.20
0431
.07.
2004
31.0
1.20
0531
.07.
2005
31.0
1.20
0631
.07.
2006
31.0
1.20
0731
.07.
2007
31.0
1.20
0831
.07.
2008
31.0
1.20
09
-1000
4000
9000
Net foreign assets (left scale) Government deposits (right scale) Currency (right scale)

Escaping the Surplus
Source: Accumulation of Foreign Reserves
• Re-consider the reasons for accumulating foreign reserves and its alternatives (e.g. real exchange rate appreciation)
• Allow „absorption“, i.e. increase in imports or private sector foreign exchange outflows (do exchange controls or lack of financial infrastructure prevent „absorption“?)
20
infrastructure prevent „absorption“?)
• Substitute foreign borrowing of the government by domestic borrowing.

Escaping the Surplus cont’d
Source: Accumulation of Domestic Assets due to monetary financing and/ or financial sector stabilisation
• Stop accumulating domestic assets by strengthening the institutional framework of the central bank
• Securitize domestic assets and make them marketable
21
• Securitize domestic assets and make them marketable
• Restore central bank capital & reserves by lower or zero profit remittance to the government

Escaping the Surplus cont’d
…eventually depends on currency in circulation
22

Why Should a Central Bank Care about Financial Strength?
Central banks aim at maintaining price and financial stability; they are no profit-maximising enterprises.
Central banks, however, have to be aware of risk management and their financial strength, because financial risks can translate into reputational risks.
Reporting central bank losses can have an impact on the
23
Reporting central bank losses can have an impact on the reputation. In particular, if central bank losses exceed capital, discussions on how to recapitalize the central bank risk a conflict with the government, which can finally fire back on central bank independence.

Twin Goals and Double Whammy
� Twin goals: A central bank that pursues two objectives, i.e. internal price stability and an exchange rate target, risks to be caught in the „impossible trinity“.
� Double whammy: Sterilization costs can be supplemented
24
� Double whammy: Sterilization costs can be supplemented by valuation losses, if the exchange rate appreciates against the reserve currencies.
Schobert, F. (2008): Why do central banks make losses? Central Banking, February, pp. 79-83

Central Bank Losses in % of GDP(number in brackets are loss-making years)
6%
8%
10%
12%
14%
25Analysis based on 107 central banks since 1983 (depending on availability) Sample excludes two outliers and losses below 1% of GDP
0%
2%
4%
6%
Chile (1
1)
Czech
Rep
(8)
Brazil (
11)
Slovakia
(7)
Botswan
a (2)
Israe
l (7)
Thailan
d (5)
Armen
ien (5
)
Mala
wi (6)
Moldova (
3)
Uganda (
6)
Norway
(7)
Swazila
nd (3)
Mongolia
(3)
France
(1)
Icelan
d (5)
Jordan
(2)
Philippines
(1)
Mau
ritius (
1)
Korea (1
0)
Russia (
2)
Kazak
hstan (1
)
Switzerl
and (1
)

Reasons for Central Bank Losses (weighted by GDP)
49%
6% 4% 2%
26Analysis based on 107 central banks since 1983 (depending on availability) Sample excludes two outliers and losses below 1% of GDP
39%
Sterilization costsWrite-downs on foreign currency positionsCredit lossesOthersNot identified

Agenda
• Debtor central banks: Global overview & case studies
• Is there an extra inflation bias for inflation targeting debtor central banks? Some answers from an extended Barro-Gordon model.
• Floating exchange rates and monetary policy • Floating exchange rates and monetary policy autonomy under surplus liquidity - a model and some simulated results for South and East Asian central banks
• Central bank losses and exiting from fixed exchange rate regimes – the case of the Deutsche Bundesbank
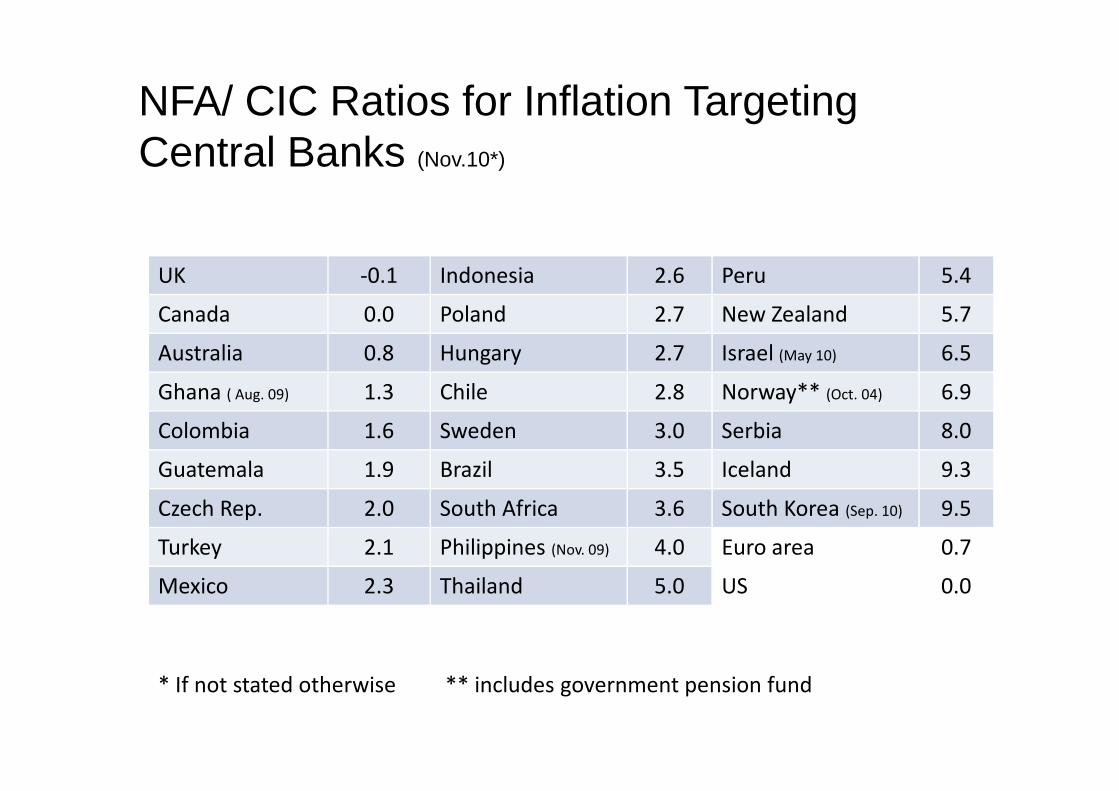
NFA/ CIC Ratios for Inflation TargetingCentral Banks (Nov.10*)
UK -0.1 Indonesia 2.6 Peru 5.4
Canada 0.0 Poland 2.7 New Zealand 5.7
Australia 0.8 Hungary 2.7 Israel (May 10) 6.5
Ghana ( Aug. 09) 1.3 Chile 2.8 Norway** (Oct. 04) 6.9Ghana ( Aug. 09) 1.3 Chile 2.8 Norway** (Oct. 04) 6.9
Colombia 1.6 Sweden 3.0 Serbia 8.0
Guatemala 1.9 Brazil 3.5 Iceland 9.3
Czech Rep. 2.0 South Africa 3.6 South Korea (Sep. 10) 9.5
Turkey 2.1 Philippines (Nov. 09) 4.0 Euro area 0.7
Mexico 2.3 Thailand 5.0 US 0.0
* If not stated otherwise ** includes government pension fund

Simulated Losses for Inflation Targeting Central Banks
Since the introduction ofinflation targeting until 2007
Assumption: Financing gapfully sterlized at domesticmoney market rates
29Löffler/ Schnabl/ Schobert (2010) Inflation Targeting by Debtor Central Banks in
Emerging Market Economies, CESifo Working Paper No. 3138
money market rates

Extended „Barro-Gordon“ Model with
Sterilization Costs
Central bank loss functionCentral bank loss function
Output
Inflation
CIC
Assets Liabilities
NFA
Sterilization Debt (S)DA
Excess Reserves (X)
Model Central Bank
Löffler/ Schnabl/ Schobert (2011) The Illusion of Monetary Policy Autonomy by Freely Floating Debtor
Central Banks in South and East Asia, mimeo

Extended „Barro-Gordon“ Model with
Sterilization Costs cont´d
By substituting (2) and (4) into (1), the central bank seeks to minimize the
following expected loss function:
Optimizing with respect to i and assuming that the public is rational,
but that they do not take into account that their choice of expected inflation has an
impact on the central banks‘s decision, the equilibrium rate of inflation is:
Extra inflation bias of a debtor central bank relative to a creditor central bank

Adding Valuation Changes to the Model
Central bank loss function:
Change of the spot exchange rate in price notation:
Extra inflation bias of a debtor central bank relative to a creditor central bank
Equilibrium inflation:

Agenda
• Debtor central banks: Global overview & case studies
• Is there an extra inflation bias for inflation targeting debtor central banks? Some answers from an extended Barro-Gordon model.
• Floating exchange rates and monetary policy • Floating exchange rates and monetary policy autonomy under surplus liquidity - a model and some simulated results for South and East Asian central banks
• Central bank losses and exiting from fixed exchange rate regimes – the case of the Deutsche Bundesbank

Fixed Exchange Rates & Debtor Central Banks
• Debtor central banks confronted with strong capital inflows andpressures on the exchange rates can use non-market basedsterilization, i.e. reserve requirements
• Reserve requirements, however, distort the financial sector, a „loss“ to the central bank‘s objectives.
• Restricting capital inflows will be less effective, if required reserves• Restricting capital inflows will be less effective, if required reservesalso lead to higher deposit rates, or if higher lending rates also increase borrowing costs in the capital market and capital inflowsare shifted to the securities markets.

Modelling Monetary Policy Autonomy forDebtor Central Banks in Fixed Regimes
Capital mobility
Central bank loss function:
Monetarypolicyautonomy
Fixed exchangerates
Inflation:
Interest rate:
Löffler/ Schnabl/ Schobert (2011) The Illusion of Monetary Policy Autonomy by Freely Floating Debtor
Central Banks in South and East Asia, mimeo

Modelling Monetary Policy Autonomy forDebtor Central Banks in Fixed Regimes cont´d
By substituting (9) and (8) into (7), the central bank seeks to minimize thefollowing expected loss function:
Optimizing with respect to rr, optimal inflation is:

Modelling Monetary Policy Autonomy forDebtor Central Banks in Floating Regimes
• Market-based sterilization triggers costs that depend on the interestrate differential to abroad and the size of the financing gap.
• Though the relationship between the exchange rate and the interestrate differential empirically remains unclear („UIP versus protractedprofitability of carry trades“), the exchange rate may ratherappreciate temporarily with positive interest rate differentials toappreciate temporarily with positive interest rate differentials toabroad.
CIC
Assets Liabilities
NFA
Sterilization Debt (S)
Required Reserves (RR)
Model Central Bank
Financing
gap
(FG)
Löffler/ Schnabl/ Schobert (2011) The Illusion of Monetary Policy Autonomy by Freely Floating Debtor
Central Banks in South and East Asia, mimeo

Modelling Monetary Policy Autonomy forDebtor Central Banks in Floating Regimes cont´d
Central bank loss function:
Exchange rate changes (in price notation):
By substituting (14) and (8) into (12), the central bank seeks to minimizethe following expected loss function:

Policy Dependence of Debtor Central Banks in Floating Regimes
Löffler/ Schnabl/ Schobert (2011) The Illusion of Monetary Policy Autonomy by Freely Floating Debtor
Central Banks in South and East Asia, mimeo

Simulating Results
Solve
)(
)1(
)(
)(
NFAFG
NFAi
NFAFG
NFACapi f
κκ
κε
+++
++=
for the foreign interest rate, in order to determine a critical value, at which the central bank bank starts to suffer losses.at which the central bank bank starts to suffer losses.
Compare the critical value with the actual development of theforeign interest rate. If the actual value is below the critical value, monetary policy autonomy is impaired.

Indonesia
Löffler/ Schnabl/ Schobert (2011) The Illusion of Monetary Policy Autonomy by Freely Floating Debtor
Central Banks in South and East Asia, mimeo

South Korea
Löffler/ Schnabl/ Schobert (2011) The Illusion of Monetary Policy Autonomy by Freely Floating Debtor
Central Banks in South and East Asia, mimeo

China
Löffler/ Schnabl/ Schobert (2011) The Illusion of Monetary Policy Autonomy by Freely Floating Debtor
Central Banks in South and East Asia, mimeo

Singapore (Special Case)
Löffler/ Schnabl/ Schobert (2011) The Illusion of Monetary Policy Autonomy by Freely Floating Debtor
Central Banks in South and East Asia, mimeo

Hong Kong (Currency Board)
Löffler/ Schnabl/ Schobert (2011) The Illusion of Monetary Policy Autonomy by Freely Floating Debtor
Central Banks in South and East Asia, mimeo

Agenda
• Debtor central banks: Global overview & case studies
• Is there an extra inflation bias for inflation targeting debtor central banks? Some answers from an extended Barro-Gordon model.
• Floating exchange rates and monetary policy • Floating exchange rates and monetary policy autonomy under surplus liquidity - a model and some simulated results for South and East Asian central banks
• Central bank losses and exiting from fixed exchange rate regimes – the case of the Deutsche Bundesbank

Profit/ Loss of the Deutsche Bundesbank, 1957 - 2008
10.000
15.000
20.000
25.000
30.000
in m
io D
EM
2
2,5
3
3,5
4
4,5
DE
M/U
SD
47
-10.000
-5.000
0
5.000
1956
1958
1960
1962
1964
1966
1968
1970
1972
1974
1976
1978
1980
1982
1984
1986
1988
1990
1992
1994
1996
1998
2000
2002
2004
2006
2008
in m
io D
EM
0
0,5
1
1,5
2 DE
M/U
SD
Total profit/ loss DEM/USD exchange rate (rhs)

Net Foreign Assets/ Currency in Germany, 1949 - 1998
1
1.5
2
2.5
150.000
200.000
250.000
300.000
mio
DE
M
Banknotes (rhs)
Net foreign assets/ Banknotes
48
-0.5
0
0.5
1
1948
M12
1950
M4
1951
M8
1952
M12
1954
M4
1955
M8
1956
M12
1958
M4
1959
M8
1960
M12
1962
M4
1963
M8
1964
M12
1966
M4
1967
M8
1968
M12
1970
M4
1971
M8
1972
M12
1974
M4
1975
M8
1976
M12
1978
M4
1979
M8
1980
M12
1982
M4
1983
M8
1984
M12
1986
M4
1987
M8
1988
M12
1990
M4
1991
M8
1992
M12
1994
M4
1995
M8
1996
M12
1998
M4
-50.000
0.000
50.000
100.000
mio
DE
M
Net foreign assets (rhs)
Pontzen/ Schobert (2011) Central bank losses and the case of the Deutsche Bundesbank
after the breakdown of the Bretton Woods System, forthcoming

Sources of the Losses at the
Deutsche Bundesbank
Accumulated losses from 1971 until 1979 reached almost 4 percent of the GDP.
The main reason was write-downs on foreign currency positions due to the appreciation of the D-Mark against its reserve currency, the US dollar.
These write-downs far exceeded interest expenses on sterilization
49
These write-downs far exceeded interest expenses on sterilization operations. They accumulated to about 46 billion D-Mark during the seven loss-making years, whereas interest expenses on ‘mobilization’ and ‘liquidity’ paper, special forms of sterilization instruments, only accumulated to about 3 billion D-Mark.
Pontzen/ Schobert (2010) Central bank losses and the case of the Deutsche
Bundesbank after the breakdown of the Bretton Woods System, mimeo

Dealing with the Losses of theDeutsche Bundesbank
The Directorate decided to record a loss carry forward on the balance sheet.
An alternative, but rejected proposal was:
• Covering losses with an unremunerated claim to the government which could be amortized by future central bank profits.
50
which could be amortized by future central bank profits.
Pontzen/ Schobert (2010) Central bank losses and the case of the Deutsche
Bundesbank after the breakdown of the Bretton Woods System, mimeo