the south iceland earthquakes 2000 a challenge for
TRANSCRIPT

Greinargerð03017
The South Iceland earthquakes 2000a challenge for earthquake prediction research
VÍ-JA02ReykjavíkMars 2003
Ragnar StefánssonGunnar B. GuðmundssonPáll Halldórsson

CONTENTS
1 INTRODUCTION 5
2 THE SOUTH ICELAND SEISMIC ZONE 5
3 THE JUNE 17 EARTHQUAKE 7
4 THE SECOND LARGE EARTHQUAKE OCCURRING THREE DAYSLATER 7
5 COSEISMIC EVIDENCE FOR THE TWO EARTHQUAKES FROM GPSAND INSAR 9
6 STRESS TRANSFER TO LARGE DISTANCES ALONG SEISMIC ZONES 10
7 THE EFFECTS OF THE EARTHQUAKES 12
8 HAZARD ASSESSMENT AND LONG–TERM PREDICTIONS 12
9 PREDICTION OF EPICENTER AND SHORT–TERM PRECURSORS OFTHE JUNE 17 EARTHQUAKE 12
10 SHORT–TERM WARNING FOR THE JUNE 21 EARTHQUAKE 14
11 PERSPECTIVES FOR FUTURE LARGE EARTHQUAKES IN THE SISZ 15
12 THE SIGNIFICANCE OF THE TWO EVENTS FOR EARTHQUAKE RE-SEARCH 17
13 REFERENCES 18


1 INTRODUCTION
In June 2000 two earthquakes with magnitude 6.6 (Ms) occurred in the central partof the South Iceland seismic zone (SISZ). They were immediately followed by seis-mic activity along zones of approximately 100 km length. This activity occurred after88 years of relative quiescence in the 70 km long EW transform zone in SW-Iceland(Figure 1). Earthquakes in this region have, according to historical information, at someoccations caused collapse of the majority of houses in areas encompassing 1000 km� andpose a significant threat to inhabitants of this area, a relatively densely populated farm-ing region. Despite intensive surface fissuring caused by the earthquakes and measuredaccelerations reaching 0.8 g, the earthquakes in 2000 caused no serious injuries and nostructural collapse. The relatively minor destruction led to some optimism regarding thesafety of living in the area. Many of the ideas about the nature of strain release in thearea have been confirmed. As far as the epicenter of the first earthquake is concerned,hazard assessments or long-term predictions were confirmed, and in hindsight precursorshave been observed. Useful short-term warning, including the right epicenter and sizeof the second earthquake, was issued beforehand. Preliminary observations which weremade of the earthquakes as well as of associated preseismic and postseismic processes,will be described in this paper. Among significant observational systems recording theevents is the SIL-system. SIL stands for South Iceland Lowland, i.e. the test area forthe SIL-project described in Stefánsson et al. 1993. The SIL-system is especially aimedat retrieving real-time information carried by microearthquakes (Böðvarsson et al 1999).Other significant observational systems include strong motion instruments, continuousGPS measurements, borehole strainmeters and hydrological observations in boreholes.Earlier survey-mode GPS measurements were repeated after the earthquakes, and de-tailed analysis of extensive surface fissures was carried out. InSAR images were col-lected to observe coseismic evidence and to compare with preseismic and postseismicdeformation. We estimate that no more than one fourth of the available moment in thezone was released in the two earthquakes that occurred in 2000 and even larger earth-quakes may occur in the zone during the next few decades.
2 THE SOUTH ICELAND SEISMIC ZONE
According to the NUVEL 1A plate model (DeMets et al. 1994) the direction of thedivergent motion across the plate boundary of the Eurasian relative to the N–Americanplate in Iceland is N103�E at a velocity of 1.85 cm/year. If all of this motion is takenup by the SISZ, which is oriented almost due EW, the relative left-lateral motion acrossSISZ would be approximately 1.8 cm/year and a NS opening component across the zonecould be around 0.4 cm/year. Historically most of the earthquakes in this EW left-lateralshear zone have had right-lateral motion on NS striking faults as observed on the surface.Faults due to known historical earthquakes are found side by side at less than 5 km dis-tance from each other (Einarsson 1991; Einarsson et al. 1981; Stefánsson et al. 1993).There are indications that the seismic cycle, i.e. the time period of strain build-up andof break-up (strain release) of the whole SISZ is 140 years. This suggestion was basedon historical seismicity and tectonic considerations (Stefánsson and Halldórsson 1988).Volcanic pulsations in the most active volcanic zone (EVZ) of Central Iceland, inferred
5
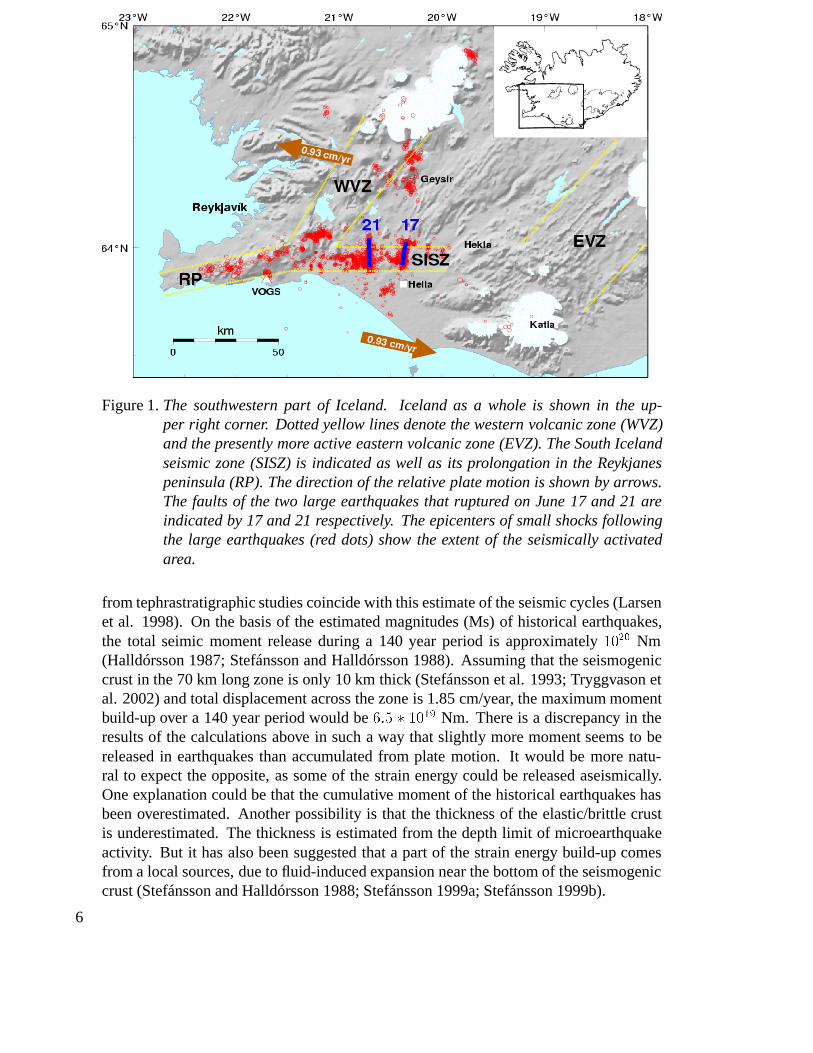
Figure 1.The southwestern part of Iceland. Iceland as a whole is shown in the up-per right corner. Dotted yellow lines denote the western volcanic zone (WVZ)and the presently more active eastern volcanic zone (EVZ). The South Icelandseismic zone (SISZ) is indicated as well as its prolongation in the Reykjanespeninsula (RP). The direction of the relative plate motion is shown by arrows.The faults of the two large earthquakes that ruptured on June 17 and 21 areindicated by 17 and 21 respectively. The epicenters of small shocks followingthe large earthquakes (red dots) show the extent of the seismically activatedarea.
from tephrastratigraphic studies coincide with this estimate of the seismic cycles (Larsenet al. 1998). On the basis of the estimated magnitudes (Ms) of historical earthquakes,the total seimic moment release during a 140 year period is approximately��
�� Nm(Halldórsson 1987; Stefánsson and Halldórsson 1988). Assuming that the seismogeniccrust in the 70 km long zone is only 10 km thick (Stefánsson et al. 1993; Tryggvason etal. 2002) and total displacement across the zone is 1.85 cm/year, the maximum momentbuild-up over a 140 year period would be��� � ��
�� Nm. There is a discrepancy in theresults of the calculations above in such a way that slightly more moment seems to bereleased in earthquakes than accumulated from plate motion. It would be more natu-ral to expect the opposite, as some of the strain energy could be released aseismically.One explanation could be that the cumulative moment of the historical earthquakes hasbeen overestimated. Another possibility is that the thickness of the elastic/brittle crustis underestimated. The thickness is estimated from the depth limit of microearthquakeactivity. But it has also been suggested that a part of the strain energy build-up comesfrom a local sources, due to fluid-induced expansion near the bottom of the seismogeniccrust (Stefánsson and Halldórsson 1988; Stefánsson 1999a; Stefánsson 1999b).
6
3 THE JUNE 17 EARTHQUAKE
According to the Icelandic Meteorological Office (IMO) the origin time of the June17 earthquake was 15:40:40.94 GMT, the hypocenter at 63.97�N, 20.37�W, and a hypocen-tral depth of 6.3 km. The aftershocks indicate an 11-12 km long rupture extending fromthe surface to 10 km depth. Assuming that the upper 1 km of the rupture does notcontain considerable energy to be released in the earthquake the fault width is taken tobe 9 km (Figure 2). The aftershocks indicate that the fault strikes N7�E and dips 86�
towards the east. Surface fissures showing right-lateral motion on an underlying faultcoincide with and are found along the entire fault (Einarsson et al. 2000). Our modelfor the earthquake mechanism agrees very well with the USGS Rapid Moment TensorSolution which has a nodal plane striking N4�E and dip of 84� to the east. The momentcalculated by USGS is��� � ��
�� Nm, assuming a best-fitting double-couple solution.The preliminary magnitudes estimated by the National Earthquake Information Center(NEIC) in USA were mb=5.7 and Ms=6.6. Preliminary modeling of local measurementsby volumetric strainmeters, assuming rigidity 36N�m�, indicate variable slip as shownin Figure 2, and a moment of��� � ��
�� Nm (Alan Linde and Kristján Ágústsson 2000,personal communication; Stefánsson et al. 2000). Assuming uniform slip along the faultthe rupture dimension suggested by aftershocks, and the moment estimated by USGS,an average right-lateral displacement of 1.5 m is inferred. Two minutes after the mainshock an earthquake of local magnitude 5 (mb) occurred 6 km to the southwest of themain shock epicenter, not along a continuation of the main shock fault, but to the west ofit. Studying the spatial distribution of the aftershocks (i.e. aftershocks within a couple ofkilometers from the fault) the following observations are noticable (Figure 2). The ob-servations suggest that the earthquake initiated in the center of the rupture which appearsto have extended down to 10 km. This is slightly deeper, but comparable to the depth ofthe brittle/ductile boundary inferred from earlier microearthquake studies: around 8 kmin this part of the SISZ (Stefánsson et al. 1993; Tryggvason et al. 2002). A few early af-tershocks occurred at 12 km depth, well into what usually is considered the ductile zone.This suggests that ductility depends on strain rate which of course is expected to be highimmediately after and near a large earthquake. The concentration of aftershocks at thesouthern and northern end of the rupture, reflect high stresses where the fault movementstopped. A similar effect is observed at the bottom of the fault, where ductile motion isexpected following the earthquake. A concentration of aftershocks close to the hypocen-ter of the main shock is also noticeable. Further conclusions about these peculiaritiesrequire a more thorough investigation of a large amount of aftershocks of magnitudesdown to zero, including joint hypocenter location by cross correlation of similar signalsand, based on it, reevaluation of the microearthquake mechanisms.
4 THE SECOND LARGE EARTHQUAKE OCCURRING THREEDAYS LATER
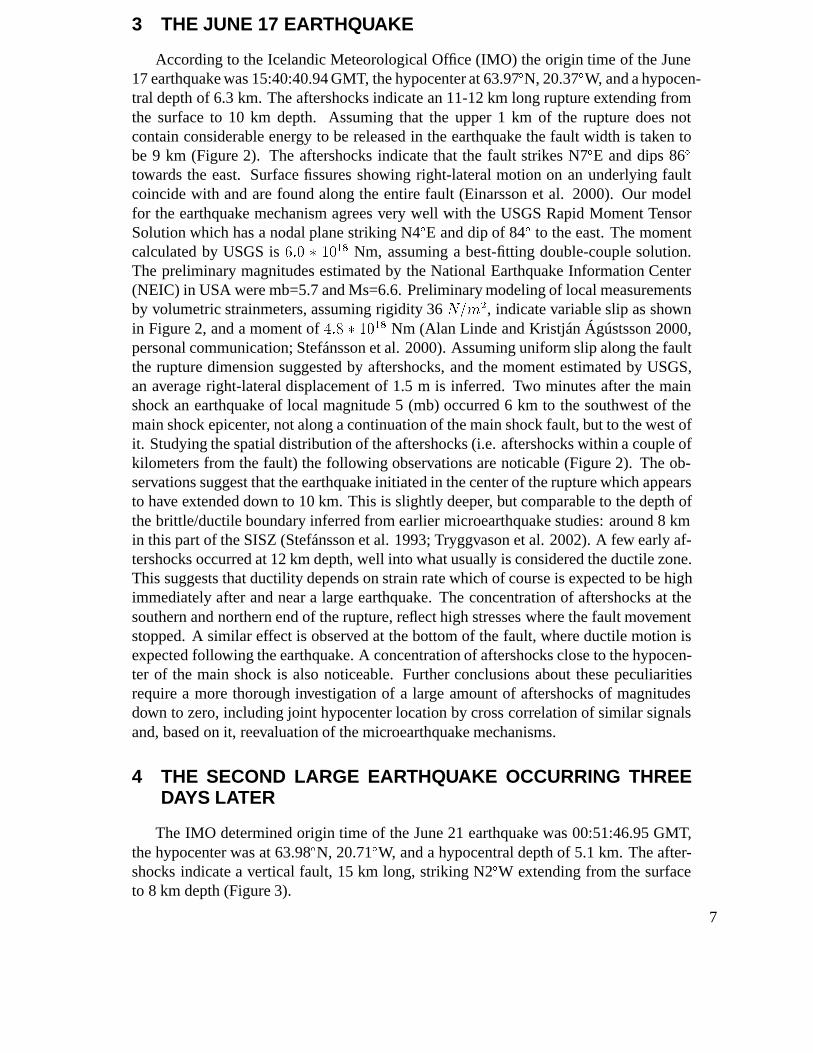
The IMO determined origin time of the June 21 earthquake was 00:51:46.95 GMT,the hypocenter was at 63.98�N, 20.71�W, and a hypocentral depth of 5.1 km. The after-shocks indicate a vertical fault, 15 km long, striking N2�W extending from the surfaceto 8 km depth (Figure 3).
7

Figure 2.Aftershocks of the June 17 earthquake within 3 km of the fault plane are shownalong with a tentative slip model. The frame at the top shows aftershocks dur-ing the first 32 hours. The second frame shows the aftershocks until December10, 2000, and a rupture model to fit observations from local volumetric strain-meters, with variable right-lateral slip on a 12 km long fault (Stefánsson et al.2000; Alan Linde and Kristján Ágústsson personal communication).
Surface fissures indicating general right-lateral motion (Einarsson et al. 2000) co-incide with and are found all along the main fault as it is reflected in the aftershocks.Related ENE-WSW fault with left-lateral motion was also observed near the southernend of the main fault. The USGS Rapid Moment Tensor Solution gives a moment of��� � ��
�� Nm, assuming a best fitting double-couple solution. Preliminary magnitudesby NEIC were mb=6.1 and Ms=6.6. The strainmeter observations were not good enoughto provide an independent estimate of the moment. Assuming uniform right-lateral slip
8
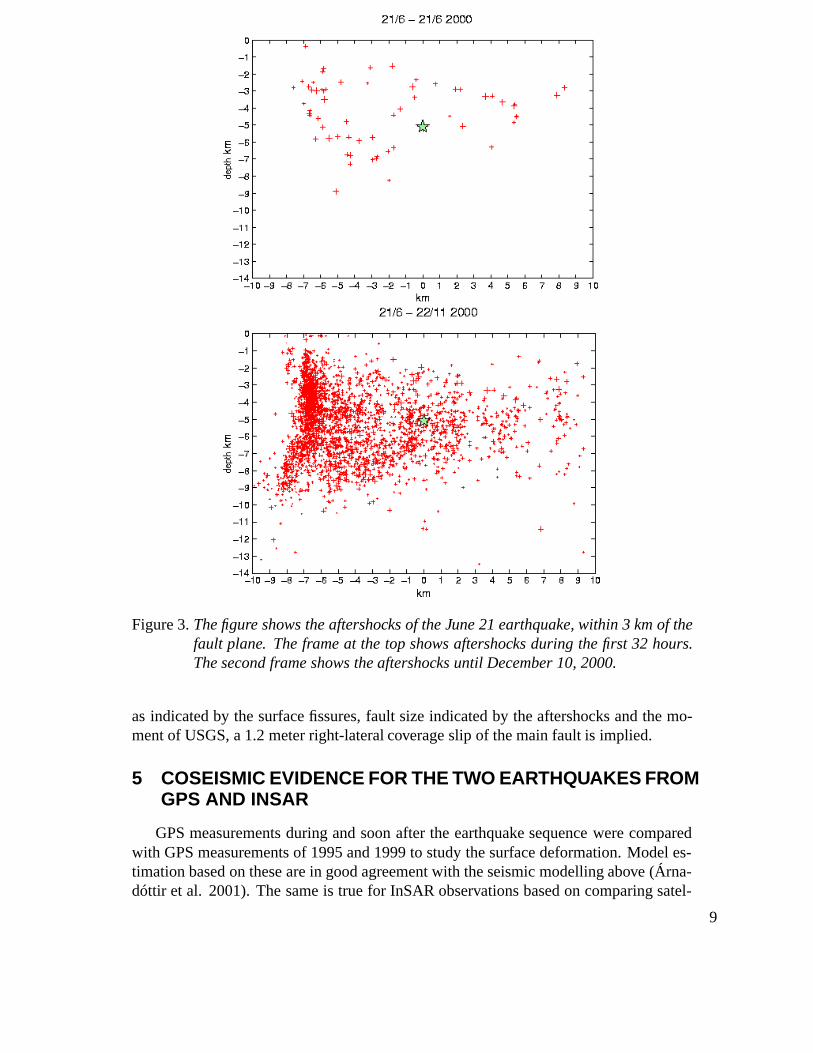
Figure 3.The figure shows the aftershocks of the June 21 earthquake, within 3 km of thefault plane. The frame at the top shows aftershocks during the first 32 hours.The second frame shows the aftershocks until December 10, 2000.
as indicated by the surface fissures, fault size indicated by the aftershocks and the mo-ment of USGS, a 1.2 meter right-lateral coverage slip of the main fault is implied.
5 COSEISMIC EVIDENCE FOR THE TWO EARTHQUAKES FROMGPS AND INSAR
GPS measurements during and soon after the earthquake sequence were comparedwith GPS measurements of 1995 and 1999 to study the surface deformation. Model es-timation based on these are in good agreement with the seismic modelling above (Árna-dóttir et al. 2001). The same is true for InSAR observations based on comparing satel-
9
lite images a few years before the earthquakes (Pedersen et al. 2001). Coulomb stresschanges in the SISZ due to the two earthquakes (Árnadóttir et al. 2003) have been esti-mated based on distributed slip model derived from joint inversion of InSAR and GPSdata (Pedersen et al. 2003). Among results of this study is that static stress changecaused by the June 17 earthquake is enough to promote failure on the June 21 fault.
6 STRESS TRANSFER TO LARGE DISTANCES ALONG SEIS-MIC ZONES
Within less than a minute to a few hours seismic activity began in several areas up to90 km to the west and to the north of the June 17 main shock. (Figure 1). 3 earthquakesof magnitude 4.5-5 occurred on the Reykjanes peninsula, one at 60 km distance, 27seconds after the mainshock and two at 80-85 km distance, 30 seconds and 5 minutesrespectively after the main shock (Kristín S.Vogfjörð 2002, personal communication).
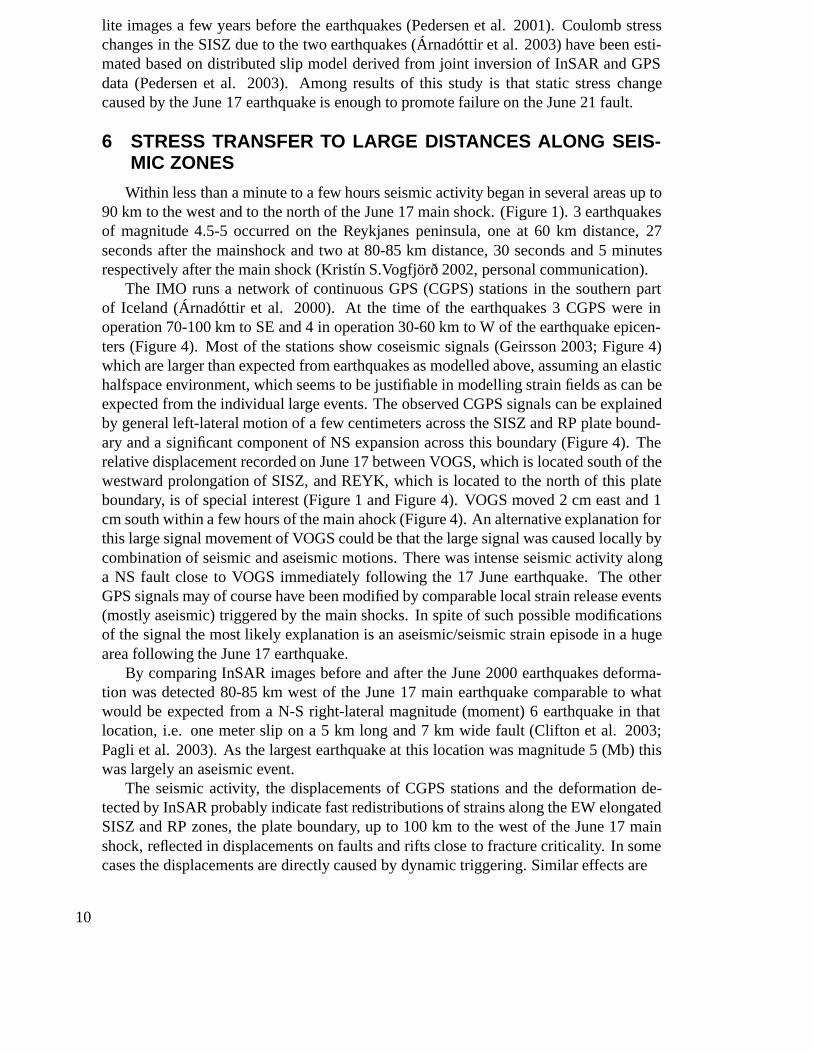
The IMO runs a network of continuous GPS (CGPS) stations in the southern partof Iceland (Árnadóttir et al. 2000). At the time of the earthquakes 3 CGPS were inoperation 70-100 km to SE and 4 in operation 30-60 km to W of the earthquake epicen-ters (Figure 4). Most of the stations show coseismic signals (Geirsson 2003; Figure 4)which are larger than expected from earthquakes as modelled above, assuming an elastichalfspace environment, which seems to be justifiable in modelling strain fields as can beexpected from the individual large events. The observed CGPS signals can be explainedby general left-lateral motion of a few centimeters across the SISZ and RP plate bound-ary and a significant component of NS expansion across this boundary (Figure 4). Therelative displacement recorded on June 17 between VOGS, which is located south of thewestward prolongation of SISZ, and REYK, which is located to the north of this plateboundary, is of special interest (Figure 1 and Figure 4). VOGS moved 2 cm east and 1cm south within a few hours of the main ahock (Figure 4). An alternative explanation forthis large signal movement of VOGS could be that the large signal was caused locally bycombination of seismic and aseismic motions. There was intense seismic activity alonga NS fault close to VOGS immediately following the 17 June earthquake. The otherGPS signals may of course have been modified by comparable local strain release events(mostly aseismic) triggered by the main shocks. In spite of such possible modificationsof the signal the most likely explanation is an aseismic/seismic strain episode in a hugearea following the June 17 earthquake.
By comparing InSAR images before and after the June 2000 earthquakes deforma-tion was detected 80-85 km west of the June 17 main earthquake comparable to whatwould be expected from a N-S right-lateral magnitude (moment) 6 earthquake in thatlocation, i.e. one meter slip on a 5 kmlong and 7 km wide fault (Clifton et al. 2003;Pagli et al. 2003). As the largest earthquake at this location was magnitude 5 (Mb) thiswas largely an aseismic event.
The seismic activity, the displacements of CGPS stations and the deformation de-tected by InSAR probably indicate fast redistributions of strains along the EW elongatedSISZ and RP zones, the plate boundary, up to 100 km to the west of the June 17 mainshock, reflected in displacements on faults and rifts close to fracture criticality. In somecases the displacements are directly caused by dynamic triggering. Similar effects are
10

−23° −22° −21° −20° −19° −18°
63.5°
64°
ISGPS REYK (fixed)
17 jun, 20 mm
21 jun, 20 mm
−23° −22° −21° −20° −19° −18°
63.5°
64°
0 50
km
−30−25−20−15−10
−505
1015202530
NO
RT
H (
mm
)
130 140 150 160 170 180 190 200 210Day number since January1, 2000
VOGS − REYK
−30−25−20−15−10
−505
1015202530
EA
ST
(m
m)
130 140 150 160 170 180 190 200 210
Figure 4.Above: Observed horizontal coseismic displacements related to the June 17(black arrows) and the June 21 (blue arrows) earthquakes, assuming thatREYK is fixed. Large black star notes the location of the June 17 main eventand smaller black stars denote subsequent earthquakes in the magnitude range4.5-5. The large blue star denotes the epicenter of the June 21 earthquake. Redlines indicate the faults of the two large earthquakes. Below: Time series ofeast and north components of displacement of VOGS relative to REYK cover-ing the time of occurrence of the two large earthquakes, denoted by verticallines. (Geirsson 2003).
11

observed seismically to the north of the June 17 earthquake (Figure 1) where postseismicstresses also triggered earthquakes at sites close to fracture criticality.
7 THE EFFECTS OF THE EARTHQUAKES
The earthquakes were felt within 200 km distance from their epicenters. They causedintensive surface fissures along the faults with opening of around one meter at variousplaces. Several accelerometers were operated in the near field. The highest measuredmaximum acceleration was 84% g in the June 21 earthquake (Þórarinsson et al. 2002).In spite of these strong surface effects no serious injuries were caused to people. The areawhere the effects of the earthquakes were most severe is a sparsely populated farmingarea. The villages closest to the epicenters are village Sólheimar (100 inhabitants), 5 kmto the north of the June 21 fault, where the maximum acceleration was 71% g in the June21 earthquake, and the the village Hella (600 inhabitants), 10 km to the south of the June17 earthquake where the maximum acceleration was 47% g. No houses collapsed in thearea but several houses were, however, so badly damaged that they had to be demolished.Several incidents of broken pipelines were reported (Þórarinsson et al. 2002).
Following both mainshocks hydrothermal activity increased substantially over a largearea around the two faults (Björnsson et al. 2001). Geysir, the great geyser, which lendsits name to all the geysers in the world, is located 30 km to the north of the faults. Itwas reactivated after the earthquakes after having been more or less dormant for morethan half a century. Water level changes in boreholes, observed immediately after theearthquakes, agree very well with the observed mechanisms of the earthquakes, withraised water level in the areas of compression and lowered levels in regions of extension.The shape of the signals reflects an impulse occurring immediately at the origin times ofthe two large earthquakes, with a relaxation tail of a few months. The magnitude of thesignals was typically 0.1 to 1 bar, but may have exceeded 10 bars in a few cases close tothe main earthquake faults. Signals were observed up to a distance of 75 km from theepicenters (Björnsson et al. 2001)
8 HAZARD ASSESSMENT AND LONG–TERM PREDICTIONS
A time-dependent hazard assessment or long–term prediction was made 15 years agofor the area, suggesting that there was more than 80% probability that large earthquakeswould occur in the SISZ during the next 25 years. It was predicted that the earthquakeswould probably start at the eastern part of the seismic zone, with an event of magni-tude 6.3 to 7.5, but during the next days or months a sequence of earthquakes wouldfollow further west in the seismic zone (Einarsson 1985). Later revisions of magnitudesand hazard assessments assume that the largest possible earthquake in this zone couldnot exceed magnitude 7.2 (Ms) (Halldórsson 1987; Stefánsson and Halldórsson 1988).Based on these later estimates, the time-dependent hazard assessment just before theearthquakes was: 98% probability of a magnitude 6 earthquake during the next 25 yearsand lower probability for a larger one.
12

9 PREDICTION OF EPICENTER AND SHORT–TERM PRECUR-SORS OF THE JUNE 17 EARTHQUAKE
For various reasons it was expected that the next SISZ earthquake would occur in theepicentral area of the June 17 earthquake. This was stated most clearly in 1988 as fol-lows: "... there are strong indications that the next large earthquake of size approaching7 in this zone will take place near longitude 20.3�–20.4�W" (Stefánsson and Halldórs-son 1988), i.e. on the EW oriented SISZ at around 64�. This was based on a lack ofstrain release in historical earthquakes since the year 1700 in a narrow area (Halldórs-son 1987; Stefánsson and Halldórsson 1988). A similar but less pronounced a gap wasalso indicated for a narrow area around 20.7�W. Some years later it was pointed outthat these gaps coincided with a long–term concentration of microearthquake activityin the seismic zone (Stefánsson et al. 1993). It was never stated definitely if the mi-croearthquake activity was expressing aseismic strain release or if it was reflecting highstresses in preparation of a large earthquake, although the latter was assumed to be morelikely. The question has apparently now been answered by nature. As there is a tendencyin the seismic history for earthquake sequences to start east of the center of the zoneand to trigger earthquakes farther west, it was also expected that any subsequent largeearthquake would most probably occur to the west. On the basis of historical intensititesand known earthquake faults, it was also expected that the fault planes of the earthquakeswould have NS strike.
While the June 17 earthquake occurred in the area identified as the probable locationof the next large earthquake in the SISZ, no short-term precursory signals were rec-ognized before it occurred. In hindsight, however, several changes can be recognized,changes that were possibly premonitory. These include:
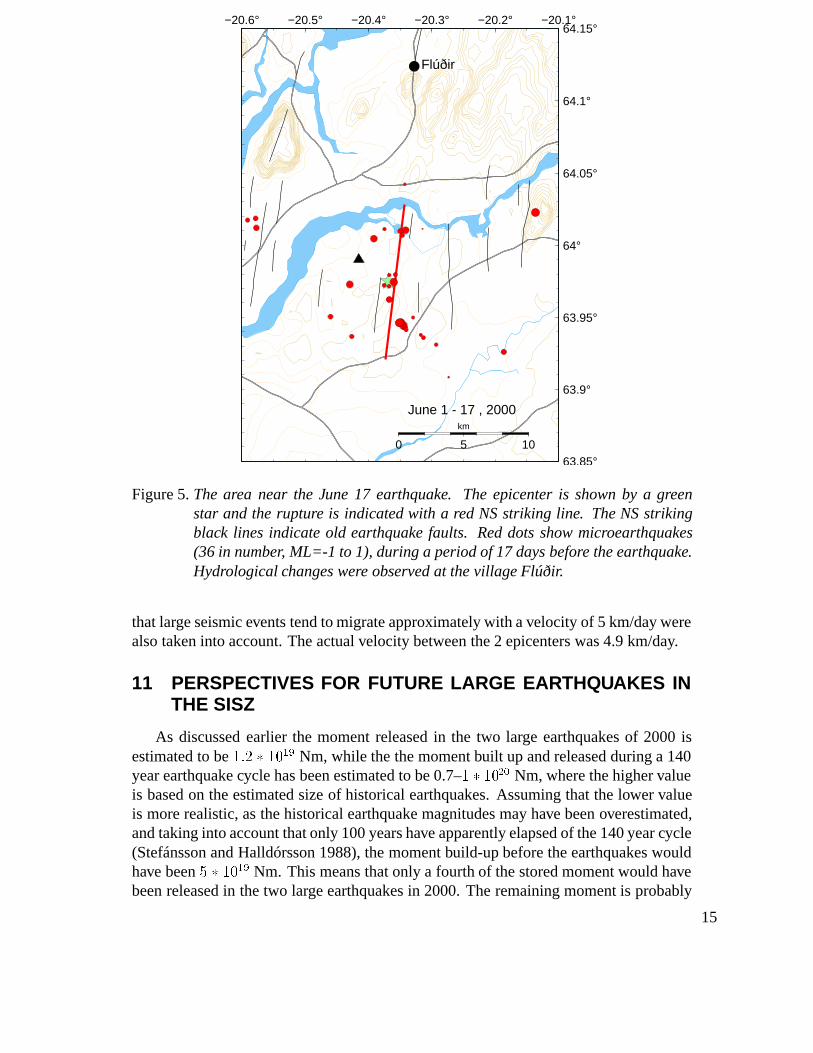
1) Several microearthquakes (ML=0-1) clustered at depth along the fault of the im-pending earthquake, weeks and days before its occurrence (Figure 5). This was a sig-nificant change compared to the less clustered microearthquake activity that had beenobserved during the previous 10 years.
2) In a geothermal borehole at Flúðir 10 km to the north of the NS striking fault plane(Figure 5), short-term water level drop, of not less than 5 m, was alarmed 24 hours beforethe earthquake. Unfortuneately this signal is not seen in the preserved recorded traceaveraging water level on 15 minutes intervals. During a 5 years of continuous operationthis was the first such an alarm (Björnsson et al. 2001). Most probably the alarm was ashort-lived low pressure pulse related to the preparatory phase of the earthquake.
Both these changes were possibly related to relocation of strains towards the impend-ing rupture, possibly related to dislocation in the deeper and ductile part of the seismiczone. Also mechanism of slow rupture initiation, as described by Dietrich 1986, andRoy and Marone 1996, may apply in this case.
Several other observed changes, listed below, prior to the earthquake may possiblyalso be related to a crustal process leading to it:
1) The volcano Hekla (Figure 1), 30–35 km east of the epicenter, has been anoma-lously active since 1970, last erupting at the end of February 2000. An eruption withsimilar mechanism occurred in 1991. In that case a flurry of small earthquakes followedin the SISZ during days and weeks (Stefánsson et al. 1993). There are also earlierexamples of this effect which probably is caused by transfer of strain energy along a
13

seismically active zone where local spots are close to fracture criticality, even if the areais not ready for a large earthquake. Thus it was considered noticeable that small earth-quakes did not occur in the zone following the February 2000 eruption. After the largeearthquakes occurred in the zone it is tempting to suggest that this lack of earthquakesis comparable to periods of quiescence sometimes reported before large earthquakes. Itremains to be studied what is the mechanism of stress transfer in the region and how thismay explain the flurry of small earthquakes frequently observed as well as the lack of itthis time. Better understanding of this may lead to the application of such a quiescenceas a precursor.
2) A slight but persisting increase in seismicity was observed in the SISZ area early in1995-1996 (Guðmundsson et al. 2001). On a long-term scale the seismic rate in the SISZwas slightly increasing since that time. This may have been linked to dyke intrusions inVatnajökull area, 150 km towards northeast in the eastern volcanic zone, preceding thelarge Vatnajökull eruption in October 1996. Such a mechanism was proposed (StuartCrampin 2000, personal communication; Volti and Crampin 2003) to explain increasedstress in the area indicated by shear-wave splitting. There were also marked and possiblyrelated changes in seismic rates at different parts of the zone, especially during the last1-2 years before the earthquake. Automatic fault plane solutions of microearthquakesshowed anomalous variations during 3 months before the earthquakes, 20 km to the westof these, and inside the SISZ (Stefánsson et al. 2000).
3) Radon anomalies, i.e. anomalously low values and positive spikes were observedin radon from geothermal water wells in the area during 1-5 months before the earth-quakes (Einarsson et al. 2003).
4) Anomalous strain signals were observed in May and June at borehole strainmeterstations, 3 and 20 km respectively from the epicenter of the June 17 earthquake.
5) There was some increase in shear-wave splitting time in microearthquakes of localorigin, a few weeks before the earthquake (Stuart Crampin 2000, personal communica-tion; Volti and Crampin 2003).
These observations of possible premonitory changes have been reported by scientistsat the Icelandic Meteorological Office, the National Energy Authority, the Science Insti-tute, University of Iceland and the University of Edinburgh. They are now the subjectof further studies and modelling to try to understand how they might be related to theearthquakes.
10 SHORT–TERM WARNING FOR THE JUNE 21 EARTHQUAKE
It was considered possible that another earthquake of similar size would follow theJune 17 mainshock. This was realized 80 hours later. But before that, i.e. 26 hoursbefore the magnitude 6.6 earthquake of June 21, as special warning was issued by IMOto the state and the local civil defence services. In the warning it was stated that the mostlikely hazard area (Figure 6) of a probable impending earthquake would be as indicatedin the figure, i.e. within 1 km of the NS fault line on which the earthquake occurred.
The warning was based on evaluation by IMO seismologists of time and space dis-tribution of microearthquake activity. It was also based on the understanding of thetectonics of the area and the knowledge of the historical seismicity described briefly ear-lier in this paper. Indications based on seismic history as well as on recent observations
14
−20.6° −20.5° −20.4° −20.3° −20.2° −20.1°
63.85°
63.9°
63.95°
64°
64.05°
64.1°
64.15°
0 5 10
km
Flúðir
June 1 - 17 , 2000
Figure 5.The area near the June 17 earthquake. The epicenter is shown by a greenstar and the rupture is indicated with a red NS striking line. The NS strikingblack lines indicate old earthquake faults. Red dots show microearthquakes(36 in number, ML=-1 to 1), during a period of 17 days before the earthquake.Hydrological changes were observed at the village Flúðir.
that large seismic events tend to migrate approximately with a velocity of 5 km/day werealso taken into account. The actual velocity between the 2 epicenters was 4.9 km/day.
11 PERSPECTIVES FOR FUTURE LARGE EARTHQUAKES INTHE SISZ
As discussed earlier the moment released in the two large earthquakes of 2000 isestimated to be��� � ��
�� Nm, while the the moment built up and released during a 140year earthquake cycle has been estimated to be 0.7–� � ��
�� Nm, where the higher valueis based on the estimated size of historical earthquakes. Assuming that the lower valueis more realistic, as the historical earthquake magnitudes may have been overestimated,and taking into account that only 100 years have apparently elapsed of the 140 year cycle(Stefánsson and Halldórsson 1988), the moment build-up before the earthquakes wouldhave been� � ���� Nm. This means that only a fourth of the stored moment would havebeen released in the two large earthquakes in 2000. The remaining moment is probably
15
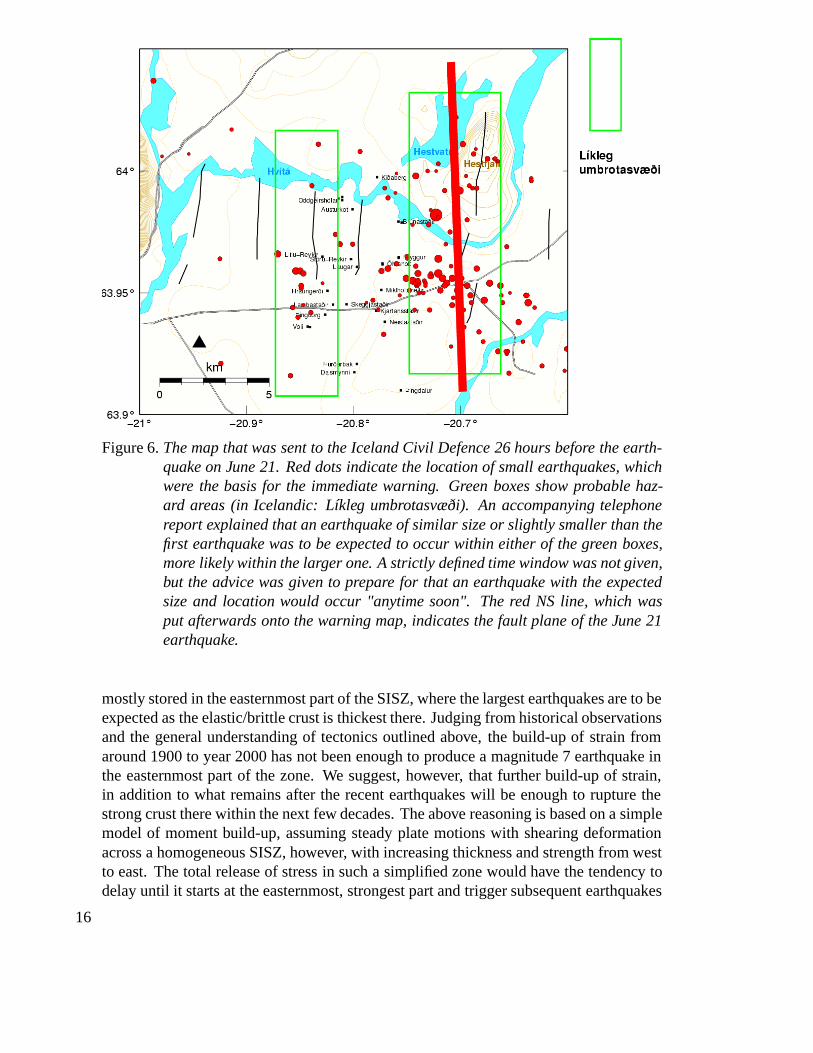
Figure 6.The map that was sent to the Iceland Civil Defence 26 hours before the earth-quake on June 21. Red dots indicate the location of small earthquakes, whichwere the basis for the immediate warning. Green boxes show probable haz-ard areas (in Icelandic: Líkleg umbrotasvæði). An accompanying telephonereport explained that an earthquake of similar size or slightly smaller than thefirst earthquake was to be expected to occur within either of the green boxes,more likely within the larger one. A strictly defined time window was not given,but the advice was given to prepare for that an earthquake with the expectedsize and location would occur "anytime soon". The red NS line, which wasput afterwards onto the warning map, indicates the fault plane of the June 21earthquake.
mostly stored in the easternmost part of the SISZ, where the largest earthquakes are to beexpected as the elastic/brittle crust is thickest there. Judging from historical observationsand the general understanding of tectonics outlined above, the build-up of strain fromaround 1900 to year 2000 has not been enough to produce a magnitude 7 earthquake inthe easternmost part of the zone. We suggest, however, that further build-up of strain,in addition to what remains after the recent earthquakes will be enough to rupture thestrong crust there within the next few decades. The above reasoning is based on a simplemodel of moment build-up, assuming steady plate motions with shearing deformationacross a homogeneous SISZ, however, with increasing thickness and strength from westto east. The total release of stress in such a simplified zone would have the tendency todelay until it starts at the easternmost, strongest part and trigger subsequent earthquakes
16
further west during a relatively short time frame.Although there is some historical support for this hypothesis, both history and the
recent events show deviations from such a simple model. The deviations may resultfrom stress heteorogeneities within the zone causing fracture criticality to be reachedlocally, before stresses reach the fracture criticality of the zone as a whole.
It has also been proposed that strain build-up for earthquakes in this area is not onlydue to general plate motion, but also has a local build-up of stress, possibly caused byintrusion of fluids near the bottom of the seismogenic crust (Stefánsson and Halldórsson1988) Considering this, it is suggested that it is still possible in the present cycle that anearthquake of a comparable size to the recent earthquakes may also occur farther west,either before a possible magnitude 7 earthquake in the easternmost part, or triggered bystress transfer by such an earthquake.
12 THE SIGNIFICANCE OF THE TWO EVENTS FOR EARTH-QUAKE RESEARCH
Development of high level monitoring facilities as well as progress in understandingregional crustal processes were of significance in coping with the year 2000 earthquakes,both in providing useful hazard assessments and warnings as well as in collecting data forfuture research. A significant milestone was the SIL-project (1988-1995), building thehigh-level seismic SIL-system. It was a concerted effort of the Nordic countries towardearthquake prediction research in the SISZ (Stefánsson et al. 1993). The PRENLAB andPRENLAB-2 projects of the European Union 1996-2000 (Stefánsson et al. 1999) werealso significant in this development. PRENLAB stands for Earthquake-Prediction Re-search in a Natural Laboratory. The SIL-project as well as the PRENLAB projects werebased on a physical approach to earthquake prediction research, in collection of data andin their multidisciplinary approach to earthquake prediction research. At the same timeemphasis has been on automatic or fast evaluation of observations with the goal of ul-timately providing short-term warnings. Increased earth activity, seismic and volcanic,has also spurred the recent efforts to build up a continuously recording GPS networkin addition to the GPS campaigns carried out repeatedly during the last decade. InSARtechnology has been applied with good results to monitor volcanic areas as well as seis-mic and interseismic deformations in the fault zones. Volumetric strain measurementshave been ongoing since 1980 in and near the SISZ especially to monitor short-termstrain changes, with especially good results related to volcanic eruptions (Linde et al.1994) Measurements of water level (pressure) in boreholes in hydrothermal fields withdeep roots have been initiated during the last few years as a part of monitoring strainchanges in the crust. Continuous monitoring of water level in some boreholes in theSISZ was in preparation before the earthquakes and has gradually come in operationafter the earthquakes. A network of strong motion instruments was installed in Icelandduring the last decade, especially in the SISZ. The multidisciplinary earthquake data thathave been collected for the two recent earthquakes in the SISZ - the seismic and intensitydata, deformation data and hydrological data are of enormous significance for ongoingresearch aiming at understanding and for modelling earthquake release processes in theSISZ. The study and modelling based on historical seismicity as well as on mapping ofearthquake faults will be revised in the light of the new data. The data collected and
17

the ongoing research have a focus on mitigating seismic risk in general, and on morecomplete and more secure warnings for earthquakes, both in this zone and worldwide.
18

13 REFERENCES
Árnadóttir, Þ., H. Geirsson, B.H. Bergsson and C. Völksen 2000. The Icelandic continu-ous GPS network – ISGPS March 18, 1999 – February 20, 2000.Rit Veðurstofu Ís-landsVÍ-R00002-JA02. Research report, Icelandic Meteorological Office, Reyk-javík, 36 pp.
Árnadóttir, Þ., S. Hreinsdóttir, G.B. Guðmundsson, P. Einarsson, M. Heinert and C. Völksen 2001.Crustal deformation measured by GPS in the South Iceland seismic zone due totwo large earthquakes in June 2000.Geophys. Res. Lett.28, 4031–4033.
Árnadóttir, Þ., S. Jónsson, R. Pedersen and G.B. Guðmundsson 2003. Coulomb stresschanges in the South Iceland seismic zone due to two large earthquakes in June2000. Geophys. Res. Lett.30(5), 1205, doi:10.1029/2002GL016495.
Björnsson, G., Ó.G. Flóvenz, K. Sæmundsson and E.M. Einarsson 2001 Pressure changesin Icelandic geothermal reservoirs associated with two large earthquakes in June2000. Proceedings of the 26th Workshop on Geothermal Reservoir Engineering,Stanford University, Stanford, California, January 29-31, 2001.
Böðvarsson, R., S.Th. Rögnvaldsson, R. Slunga and E. Kjartansson 1999. The SIL dataacquisition system – at present and beyond year 2000.Phys. Earth Plan. Int.113,89–101.
Clifton, A.E., C. Pagli, J.F. Jónsdóttir, K. Eyþórsdóttir and K.S. Vogfjörð 2003. Surfaceeffects of triggered fault slip on Reykjanes peninsula, SW Iceland.Tectonophysics,in press.
DeMets, C., R.G. Gordon, D. Argus and S. Stein 1994. Effect of recent revisions to thegeomagnetic reversal time scale on estimates of current plate motions.Geophys.Res. Lett.21, 2191–2194.
Dieterich, J.H. 1986, A model for the nucleation of earthquake slip. In: S. Das, J.Boatwright and C. Scholz (editors), Earthquake source mechanics.GeophysicalMonograph Series37, 37-49.
Einarsson, P., S. Björnsson, G. Foulger, R. Stefánsson and Þ. Skaftadóttir 1981. Seis-micity pattern in the South Iceland seismic zone. In: D. Simpson and P. Richards(editors), Earthquake prediction – an international review.Maurice Ewing Series4, 141–151.
Einarsson, P. 1985. Jarðskjálftaspár.Náttúrufræðingurinn55(1), 9–28.
Einarsson, P. 1991. Earthquakes and present–day tectonism in Iceland.Tectonophysics189, 261–279.
Einarsson, P., A. Clifton, F. Sigmundsson and R. Sigbjörnsson 2000 The South Icelandearthquakes of June 2000: Tectonic environment and effects. In: Abstracts fromthe AGU Fall Meeting, San Fransisco California, December 15-19, 2000.
Einarsson, P., P. Theódórsson and G.I. Guðjónsson 2003. Radon anomalies prior to theearthquakes sequence in June 2000 in the South Iceland seismic zone.Geophys.Res. Lett., submitted.
Geirsson, H. 2003. Continuous GPS measurements in Iceland 1999–2003.VeðurstofaÍslands – Greinargerð03014. Report, Icelandic Meteorological Office, 94 pp.
19

Guðmundsson, G.B., B.S. Þorbjarnardóttir, P. Halldórsson and R. Stefánsson 2001. Yfir-lit um jarðskjálfta á Íslandi 1991-2000.Veðurstofa Íslands - Greinargerð01002,88 pp.
Halldórsson, P. 1987. Seismicity and seismic hazard in Iceland. In: D. Mayer-Rosa,J.M. van Gils and H. Stiller (editors), Activity reports 1984–1986 and proceed-ings of the XX ESC General Assembly in Kiel.Publication Series of the SwissSeismological Service101. European Seismological Commission, 104–115.
Larsen, G., M. Guðmundsson and H. Björnsson 1998. Eight centuries of periodic vol-canism at the center of the Iceland hotspot revealed by glacier tephrostratigraphy.Geology26(10), 943–946.
Linde, A., K. Ágústsson, I.S. Sacks and R. Stefánsson 1994. Mechanism of the 1991eruption of Hekla from continuous borehole strain monitoring.Nature365, 737–740.
Pagli, C., R. Pedersen and K. Feigl 2003. Triggered seismicity on June 17, 2000 onReykjanes peninsula, SW Iceland, captured by radar interferometry.Geophys.Res. Lett.30, doi:10.1029/2002GL015310, in press.
Pedersen, R., S. Jónsson, Þ. Árnadóttir, F. Sigmundsson and K. Feigl 2003. Fault slipdistribution of two Ms=6.6 earthquakes in South Iceland from joint inversion ofInSAR and GPS.Earth Planet. Sci. Lett, in press.
Roy, M., and C. Marone 1996. Earthquake nucleation on model faults with rate- andstate-dependent friction: Effects of inertia.J. Geophys. Res.101, 13,919–13,932.
Stefánsson, R., 1999a. A tentative model for the stress build-up and stress release in andaround the SISZ. Paper presented at the third PRENLAB–2 workshop, Strasbourg,France, March 31, 1999. URL: http://hraun.vedur.is/ja/prenlab/symp-mar-1999.Last modified: March 17, 1999.
Stefánsson, R., 1999b. Nucleation of earthquakes in the SISZ. Paper presented at thethird PRENLAB–2 workshop, Strasbourg, France, March 31, 1999.URL: http://hraun.vedur.is/ja/prenlab/symp-mar-1999. Last modified: March 17,1999.
Stefánsson, R. and P. Halldórsson 1988. Strain build-up and strain release in the SouthIceland seismic zone.Tectonophysics152, 267–276.
Stefánsson, R., R. Böðvarsson, R. Slunga, P. Einarsson, S.S. Jakobsdóttir, H. Bungum,S. Gregersen, J. Havskov, J. Hjelme and H. Korhonen 1993. Earthquake predictionresearch in the South Iceland seismic zone and the SIL project.Bull. Seism. Soc.Am.83, 696–716.
Stefánsson, R., F. Bergerat, M. Bonafede, R. Böðvarsson, S. Crampin, P. Einarsson,K.L. Feigl, Á. Guðmundsson, F. Roth and F. Sigmundsson 1999. Earthquake–prediction research in a natural laboratory – PRENLAB. In: M. Yeroyanni (edi-tor), Seismic risk in the European UnionII. Proceedings of the review meeting,Brussels, Belgium, November 27–28, 1997, European Commission, 1–39.
Stefánsson, R., Þ. Árnadóttir, G. Björnsson, G.B. Guðmundsson and P. Halldórsson2000. The two large earthquakes in the South Iceland seismic zone in June 2000.A basis for earthquake prediction research. In: Abstracts from the AGU Fall
20

Meeting, San Fransisco, California, December 15–19, 2000.
Tryggvason, A., S.Th. Rögnvaldsson and Ó.G. Flóvenz 2002. Three-dimensional imag-ing of the P– and S–wave velocity structure and earthquake locations beneathSouthwest Iceland.Geophys. J. Int.151, 848-866.
Volti, T. and S. Crampin 2003. A four year study of shear–wave splitting in Iceland:2–temporal changes before earthquakes and volcanic eruptions.J. Geol. Soc.,special issue, in preparation.
Þórarinsson, Ó., B. Bessason, J. Snæbjörnsson, S. Ólafsson, G.I. Baldvinsson and R.Sigbjörnsson 2002. The South Iceland earthquakes in 2000: Strong motion mea-surements. In: Papers presented at the 12th European Conference on EarthquakeEngineering. Elsevier Science Ltd.
21