inflation targeting in brazil: constructing credibility …...inflation targeting in brazil:...
TRANSCRIPT

Inflation Targeting in Brazil: Constructing Credibility under
Exchange Rate Volatility*
André Minella**
Paulo Springer de Freitas**
Ilan Goldfajn***
Marcelo Kfoury Muinhos**
May 2003
Abstract
This paper assesses the challenges faced by the inflation-targeting regime inBrazil. The confidence crisis in the future performance of the Brazilianeconomy and the increase in risk aversion in international markets wereresponsible for a sudden stop of capital inflows in 2002 that caused asignificant depreciation of the exchange rate. The inflation-targetingframework has played a critical role in macroeconomic stabilization. Westress two important challenges: construction of credibility and exchangerate volatility. The estimations indicate the following results: i) the inflationtargets have worked as an important coordinator of expectations; ii) theCentral Bank has reacted strongly to inflation expectations; iii) there hasbeen a reduction in the degree of inflation persistence; and iv) the exchangerate pass-through for "administered or monitored" prices is two times higherthan for "market" prices.
Keywords: inflation targeting, Brazil, monetary policyJEL Classification: E31, E52, E58
* We thank the participants in the Autumn 2002 Central Bank Economists' Meeting at the Bank forInternational Settlements (BIS), in the seminar "Regional and International Implications of the FinancialInstability in Latin America" held in April at University California Santa Cruz, especially SebastianEdwards and Reuven Glick, and in a seminar at the Central Bank of Brazil for their comments, andRichard Clarida for comments in a workshop. We also are indebted to Fabio Araujo, Thaís P. Ferreira andMyrian B. S. Petrassi for their contributions. We are also grateful to Luis A. Pelicioni, Marcileide A. daSilva, and Raquel K.P. de S. Tsukada for assistance with data. The views expressed are those of theauthors and not necessarily those of the Central Bank of Brazil.** Research Department, Central Bank of Brazil. E-mails: [email protected],[email protected], and [email protected]*** Deputy Governor for Economic Policy, Central Bank of Brazil, and Pontifical Catholic University ofRio de Janeiro (PUC-RJ). E-mail: [email protected]
2
1. Introduction
This paper assesses the inflation-targeting regime in Brazil adopted in June
1999, examining the main challenges it has faced over its first three and half years. In
particular, we stress two important challenges that are also common in other emerging
market economies: construction of credibility, and high exchange rate volatility.
The inflation-targeting mechanism has played a key role in macroeconomic
stabilization in Brazil. In spite of large inflationary shocks, the inflation rate has been
maintained at a low level. Exchange rate depreciations in 2001 and 2002 were stress
tests for the regime. In particular, in 2002 monetary policy faced a confidence crisis in
the future performance of the Brazilian economy and an increase in risk aversion in
international markets. Rollover rates of domestic public debt securities diminished
considerably, and the Brazilian economy experienced a “sudden stop” in capital inflows
to the country, generating a significant nominal depreciation of the exchange rate.
Inflation targeting in emerging market economies has been a more challenging
task than in developed economies. The conduct of monetary policy has to build
credibility and reduce inflation rate levels, and simultaneously deal with a greater
vulnerability to shocks. In fact, one basic task of the Central Bank of Brazil has been to
build credibility as a monetary authority committed to price stability in the context of
large inflationary shocks. This requires actions consistent with the inflation-targeting
framework combined with high levels of transparency and communication with the
public.1 Furthermore, it is expected that private agents' inflation expectations do not
depart way from the targets without converging to them in a certain time horizon. We
present some evidence on: i) the behavior of the central bank; ii) the behavior of private
1 For the importance of transparency and communication, and an assessment of inflation targeting inemerging market economies, see Fraga, Goldfajn, and Minella (2003).
3
agents' expectations; iii) change in inflation dynamics; and iv) exchange rate volatility
and pass-trough.
Specifically, we estimate the central bank's reaction function, and find that
monetary policy has been reacting strongly to inflationary pressures. In particular, the
Central Bank reacts to inflation expectations, giving evidence that the monetary policy
is conducted on a forward-looking basis.
We show that private sector inflation expectations did not depart significantly
from the country's inflation targets until September 2002, even when faced with
inflationary shocks. We present evidence that the inflation targets have worked as an
important coordinator of expectations. The end of 2002 and beginning of 2003 in turn
represents a period dominated by uncertainties concerning the future conduct of
economic policy. We also find some evidence of a change in inflation dynamics,
namely a reduction in the degree of inflation persistence, which however seems to have
shown some signs of resurgence at the end-2002. We also stress the significant
inflationary pressures stemming from exchange rate volatility. We estimate the pass-
through from exchange rate changes to the inflation rate using a VAR estimation,
showing the higher pass-through for "administered or monitored" prices.
The following section presents an overview of the first three and half years of
inflation targeting. Section 3 assesses the different challenges for the inflation-targeting
regime. Section 4 deals with exchange rate volatility. A final section concludes the
paper.
2. Overview of the first three and half years of inflation targeting
Macroeconomic policy in Brazil over the past three and half years has consisted
of three basic elements: a floating exchange rate regime, sound fiscal policy, and

4
inflation targeting. The current inflation-targeting regime was adopted in mid-1999,
after the currency was floated in January of the same year. In the first two years, annual
inflation rates met their targets, having absorbed the initial impact of the exchange rate
depreciation in 1999. The successful transition was supported by a considerable fiscal
improvement, a shift in the primary (non-interest) fiscal balance of the consolidated
public sector from roughly zero in 1998 to a surplus of 3.23% of GDP in 1999, 3.51%
in 2000, 3.68% in 2001, and 3.9% in 2002.
Figure 1 shows actual inflation and the targets for 1999-2002. The inflation rate
is measured by a consumer price index, the IPCA. Brazil's inflation targeting regime
includes tolerance intervals around the central inflation targets. From 1999 to 2002, the
tolerance intervals were 2 percentage points above and below the central target (for
2003 and 2004 the intervals were enlarged to 2.5 percentage points). The inflation rate
was 8.9% and 6.0% for targets of 8% and 6% in 1999 and 2000, respectively.
Figure 1Inflation Targets (upper limit, central target, and lower limit) and Inflation Rate (% p.a.)
12.53
7.67
5.97
8.94
0
2
4
6
8
10
12
14
1999 2000 2001 2002
However, in 2001 and 2002, several external and domestic shocks hit the
Brazilian economy with significant impacts on inflation. The inflation rate reached
5
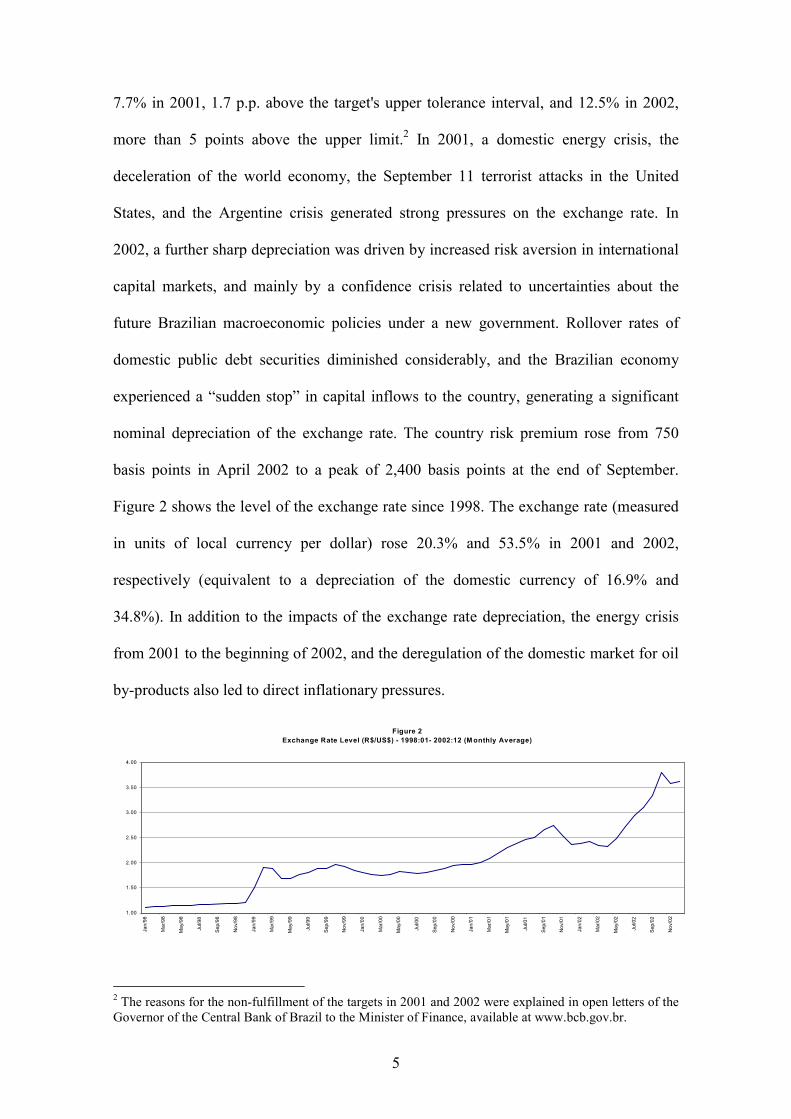
7.7% in 2001, 1.7 p.p. above the target's upper tolerance interval, and 12.5% in 2002,
more than 5 points above the upper limit.2 In 2001, a domestic energy crisis, the
deceleration of the world economy, the September 11 terrorist attacks in the United
States, and the Argentine crisis generated strong pressures on the exchange rate. In
2002, a further sharp depreciation was driven by increased risk aversion in international
capital markets, and mainly by a confidence crisis related to uncertainties about the
future Brazilian macroeconomic policies under a new government. Rollover rates of
domestic public debt securities diminished considerably, and the Brazilian economy
experienced a “sudden stop” in capital inflows to the country, generating a significant
nominal depreciation of the exchange rate. The country risk premium rose from 750
basis points in April 2002 to a peak of 2,400 basis points at the end of September.
Figure 2 shows the level of the exchange rate since 1998. The exchange rate (measured
in units of local currency per dollar) rose 20.3% and 53.5% in 2001 and 2002,
respectively (equivalent to a depreciation of the domestic currency of 16.9% and
34.8%). In addition to the impacts of the exchange rate depreciation, the energy crisis
from 2001 to the beginning of 2002, and the deregulation of the domestic market for oil
by-products also led to direct inflationary pressures.
Figure 2Exchange Rate Level (R$/US$) - 1998:01- 2002:12 (M onthly Average)
1.00
1.50
2.00
2.50
3.00
3.50
4.00
Jan/
98
Mar
/98
May
/98
Jul/9
8
Sep/
98
Nov
/98
Jan/
99
Mar
/99
May
/99
Jul/9
9
Sep/
99
Nov
/99
Jan/
00
Mar
/00
May
/00
Jul/0
0
Sep/
00
Nov
/00
Jan/
01
Mar
/01
May
/01
Jul/0
1
Sep/
01
Nov
/01
Jan/
02
Mar
/02
May
/02
Jul/0
2
Sep/
02
Nov
/02
2 The reasons for the non-fulfillment of the targets in 2001 and 2002 were explained in open letters of theGovernor of the Central Bank of Brazil to the Minister of Finance, available at www.bcb.gov.br.

6
Monetary policy has been faced with an important change in relative prices that
has pushed up the overall inflation rate. The administered by contract or monitored
prices – administered prices, for short – have increased by substantially more than the
other prices – market prices, for short. Considering the period since the start of inflation
targeting in Brazil, the ratio of administered prices to market prices has increased 31.4%
(1999:7 - 2003:2). The administered prices are defined as those that are relatively
insensitive to domestic demand and supply conditions or that are in someway regulated
by a public agency.3
The dynamics of administered prices differ from those of market prices in three
ways: i) dependence on international prices in the case of oil by-products; ii) greater
pass-through from the exchange rate;4 and iii) stronger backward-looking behavior.5
Using the structural model of the Central Bank6 and information concerning the
mechanisms for the adjustment of administered prices, it is possible to estimate the
contribution for the inflation rate stemming from exchange rate pass-through, inflation
inertia from the previous year, and inflation of administered prices and market prices
that is not explained by the exchange rate pass-through and the mentioned inertia. Table
1 shows the estimated values for 2001 and 2002. In 2001, 38% of the inflation rate can
3 The group includes, among others, oil by-products, fixed telephone fees, residential electricity, andpublic transportation. The aggregate weight of administered prices in the IPCA was 28.0% in December2002.4 There are three basic links: i) the price of oil by-products for consumption depends on international oilprices denominated in domestic currency; ii) part of the resetting of electricity rates is linked to changesin the exchange rate; and iii) the contracts for price adjustments for electricity and telephone rates linkthese adjustments, at least partially, to the General Price Index (IGP), which is more affected by theexchange rate than the consumer price indexes.5 Electricity and telephone rates are generally adjusted annually, and the contractual clauses usuallystipulate that adjustments should be based on a weighted average of the past change of the IGP priceindex and the exchange rate.6 For an overview of the structural model, see Bogdanski et. al. (2000). Using the aggregate supply curve,which relates current market price inflation to the expected and past headline inflation, output gap, andexchange rate change, we estimate the contributions of the exchange rate pass-through and of inertia fromthe previous year to the market prices. For the administered prices, the estimation depends on the criteriaused for the price adjustment of specific items.
7
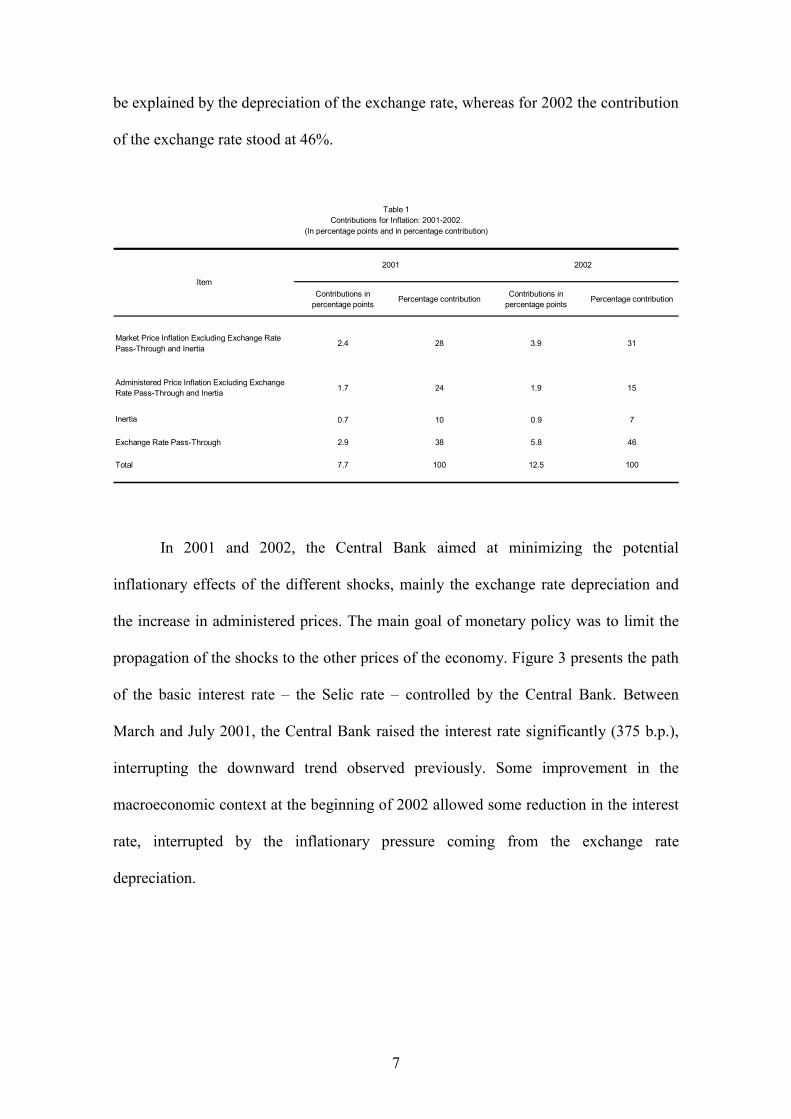
be explained by the depreciation of the exchange rate, whereas for 2002 the contribution
of the exchange rate stood at 46%.
Contributions in percentage points Percentage contribution Contributions in
percentage points Percentage contribution
Market Price Inflation Excluding Exchange Rate Pass-Through and Inertia 2.4 28 3.9 31
Administered Price Inflation Excluding Exchange Rate Pass-Through and Inertia 1.7 24 1.9 15
Inertia 0.7 10 0.9 7
Exchange Rate Pass-Through 2.9 38 5.8 46
Total 7.7 100 12.5 100
2001 2002
Table 1Contributions for Inflation: 2001-2002.
(In percentage points and in percentage contribution)
Item
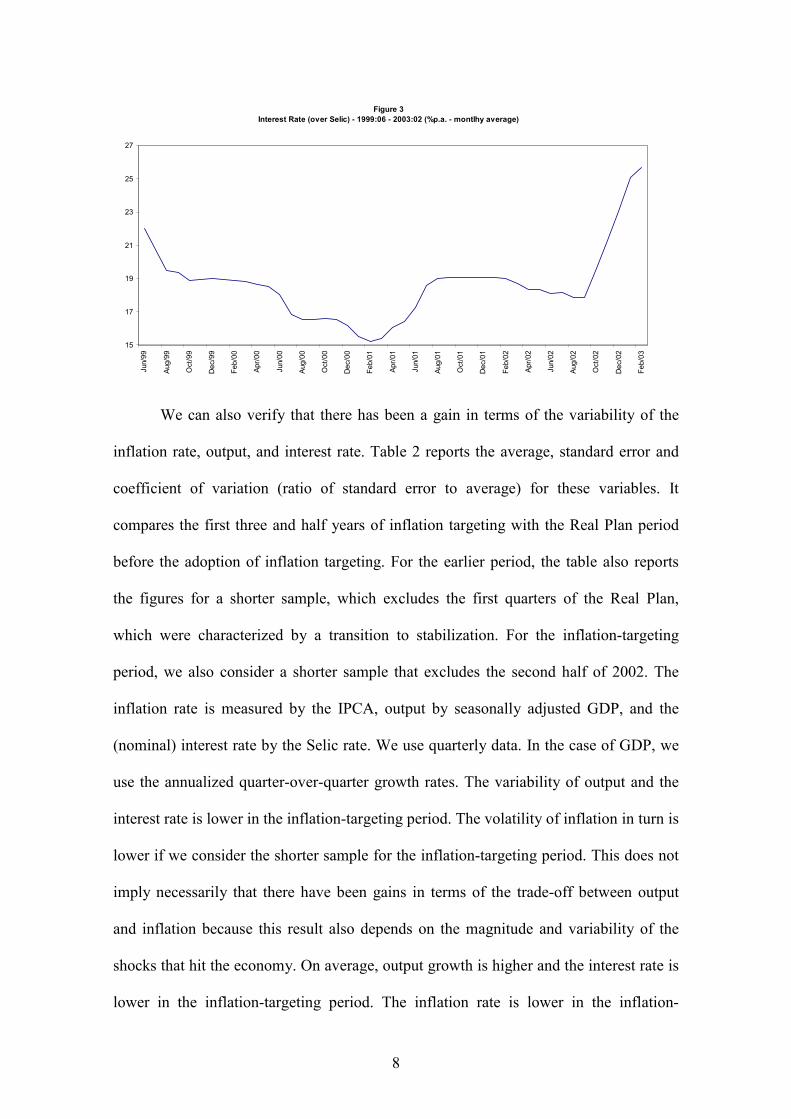
In 2001 and 2002, the Central Bank aimed at minimizing the potential
inflationary effects of the different shocks, mainly the exchange rate depreciation and
the increase in administered prices. The main goal of monetary policy was to limit the
propagation of the shocks to the other prices of the economy. Figure 3 presents the path
of the basic interest rate – the Selic rate – controlled by the Central Bank. Between
March and July 2001, the Central Bank raised the interest rate significantly (375 b.p.),
interrupting the downward trend observed previously. Some improvement in the
macroeconomic context at the beginning of 2002 allowed some reduction in the interest
rate, interrupted by the inflationary pressure coming from the exchange rate
depreciation.
8
Figure 3Interest Rate (over Selic) - 1999:06 - 2003:02 (%p.a. - montlhy average)
15
17
19
21
23
25
27Ju
n/99
Aug/
99
Oct
/99
Dec
/99
Feb/
00
Apr/0
0
Jun/
00
Aug/
00
Oct
/00
Dec
/00
Feb/
01
Apr/0
1
Jun/
01
Aug/
01
Oct
/01
Dec
/01
Feb/
02
Apr/0
2
Jun/
02
Aug/
02
Oct
/02
Dec
/02
Feb/
03
We can also verify that there has been a gain in terms of the variability of the
inflation rate, output, and interest rate. Table 2 reports the average, standard error and
coefficient of variation (ratio of standard error to average) for these variables. It
compares the first three and half years of inflation targeting with the Real Plan period
before the adoption of inflation targeting. For the earlier period, the table also reports
the figures for a shorter sample, which excludes the first quarters of the Real Plan,
which were characterized by a transition to stabilization. For the inflation-targeting
period, we also consider a shorter sample that excludes the second half of 2002. The
inflation rate is measured by the IPCA, output by seasonally adjusted GDP, and the
(nominal) interest rate by the Selic rate. We use quarterly data. In the case of GDP, we
use the annualized quarter-over-quarter growth rates. The variability of output and the
interest rate is lower in the inflation-targeting period. The volatility of inflation in turn is
lower if we consider the shorter sample for the inflation-targeting period. This does not
imply necessarily that there have been gains in terms of the trade-off between output
and inflation because this result also depends on the magnitude and variability of the
shocks that hit the economy. On average, output growth is higher and the interest rate is
lower in the inflation-targeting period. The inflation rate is lower in the inflation-

9
targeting period if we compare it to the whole period before inflation targeting. In the
case of the 1996:01-1999:02 period, the lower average inflation rate is to a large extent
a consequence of the pegged exchange rate regime, which turned out to be
unsustainable in the medium run. When the inflation targeting sample ends in 2002:04,
the standard deviation of inflation is higher, reflecting the increase in the inflation rate
in the last months of that year.
Average (per year)
Standard Deviation
Coefficient of
Variation
Average (per year)
Standard Deviation
Coefficient of
Variation
Average (per year)
Standard Deviation
Coefficient of
Variation
Real Plan Before Inflation Targeting 1994:4 - 1999:2 10.3 9.2 0.89 2.0 6.3 3.16 35.4 14.1 0.401996:1 - 1999:2 5.8 4.8 0.84 2.0 5.2 2.55 28.2 6.0 0.21
Inflation Targeting 1999:3 - 2002:2 7.1 3.0 0.42 2.4 3.5 1.46 18.0 1.4 0.081999:3 - 2002:4 8.9 6.0 0.68 2.5 3.3 1.28 18.2 1.55 0.09
Table 2Average, Standard Deviation and Coefficient of Variation for Inflation Rate, GDP and Interest Rate
Different Periods (Quarterly Data)
Interest Rate Period
Inflation Rate GDP
3. Constructing Credibility
The success of inflation targeting hinges, to a large extent, on the construction of
credibility. Private agents should believe that the central bank will act consistently
within the inflation-targeting framework. Gaining credibility, however, takes time. In
the context of large shocks, even with a strong response by the monetary authority,
expectations will tend to deviate from the targets. In this case, communication with the
public so as to explain the reasons of the non-fulfillment of the targets becomes crucial.
Furthermore, it is important that expectations converge to the target over a certain time
horizon. In this section, we present some evidence on: i) the behavior of the central
10
bank, ii) the behavior of private agents' expectations, iii) the change in inflation
dynamics.
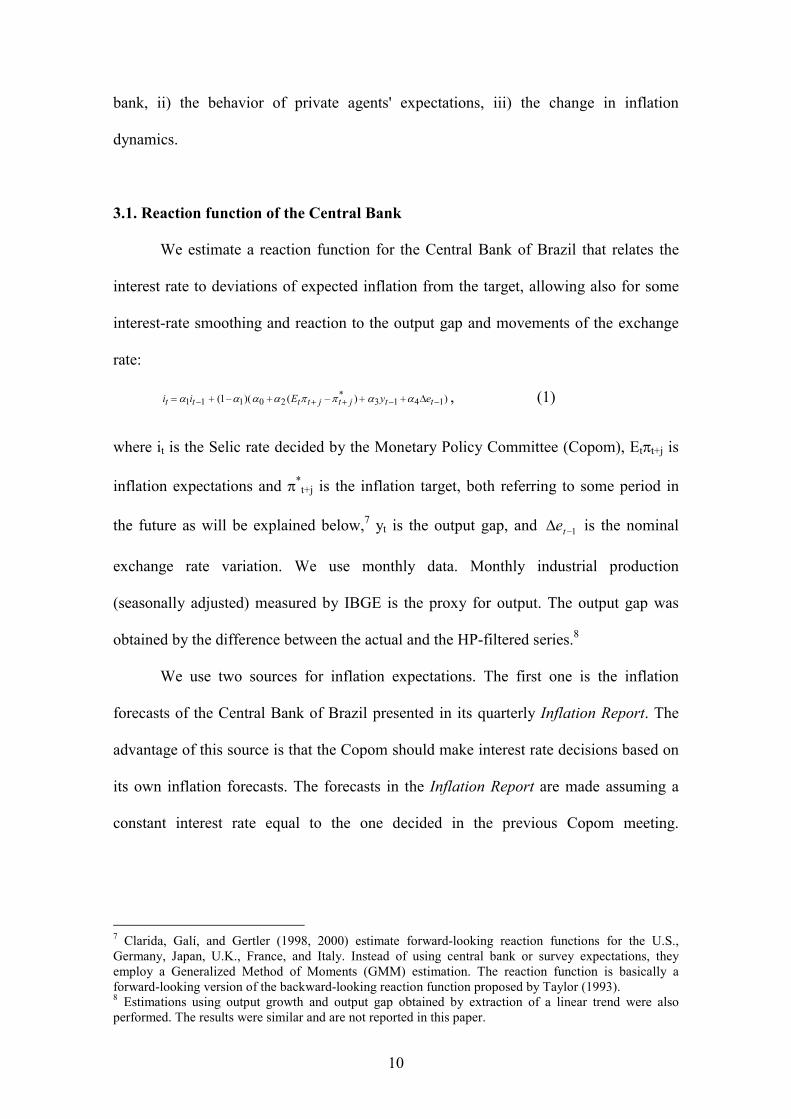
3.1. Reaction function of the Central Bank
We estimate a reaction function for the Central Bank of Brazil that relates the
interest rate to deviations of expected inflation from the target, allowing also for some
interest-rate smoothing and reaction to the output gap and movements of the exchange
rate:
))()(1( 1413*
20111 ������������� ttjtjtttt eyEii �������� , (1)
where it is the Selic rate decided by the Monetary Policy Committee (Copom), Et�t+j is
inflation expectations and �*t+j is the inflation target, both referring to some period in
the future as will be explained below,7 yt is the output gap, and 1�� te is the nominal
exchange rate variation. We use monthly data. Monthly industrial production
(seasonally adjusted) measured by IBGE is the proxy for output. The output gap was
obtained by the difference between the actual and the HP-filtered series.8
We use two sources for inflation expectations. The first one is the inflation
forecasts of the Central Bank of Brazil presented in its quarterly Inflation Report. The
advantage of this source is that the Copom should make interest rate decisions based on
its own inflation forecasts. The forecasts in the Inflation Report are made assuming a
constant interest rate equal to the one decided in the previous Copom meeting.
7 Clarida, Galí, and Gertler (1998, 2000) estimate forward-looking reaction functions for the U.S.,Germany, Japan, U.K., France, and Italy. Instead of using central bank or survey expectations, theyemploy a Generalized Method of Moments (GMM) estimation. The reaction function is basically aforward-looking version of the backward-looking reaction function proposed by Taylor (1993).8 Estimations using output growth and output gap obtained by extraction of a linear trend were alsoperformed. The results were similar and are not reported in this paper.
11
Therefore, they signal whether the Central Bank should change the interest rate.9 The
second source is obtained from a daily survey that the Central Bank conducts among
financial institutions and consulting firms.10 The survey asks what firms expect for year-
end inflation in the current and in the following years.11
The Brazilian inflation-targeting regime sets year-end inflation targets for the
current and the following two years. Since it is necessary to have a single measurement
of the deviation of inflation from the target, we have used a weighted average of current
year and following year expected deviation of inflation from the target, where the
weights are inversely proportional to the number of months remaining in the year.12
Tables 3 and 4 report the estimations using the Central Bank's inflation forecasts
(sample 1999:07-2002:12) and the market forecasts (sample 2000:01-2002:12),
respectively.13 We present three specifications: the first includes only the deviation of
expected inflation from the targets, the second one adds the output gap term, and the
third includes also the 12-month exchange rate change. When relevant, we also compare
the results to an estimation with sample ending in 2002:06 (not shown).
9 Public information about the Copom’s inflation forecasts is available only on a quarterly basis. In orderto obtain monthly figures, it was necessary to interpolate the data.10 This survey is available at the Central Bank of Brazil website (www.bcb.gov.br). In this estimation, weuse the inflation expectations collected on the eve of Copom meetings, avoiding possible endogeneityproblems.11 In November 2001 the survey started collecting expectations for the following 12 months as well.12 )(
12)(
12)12( *
11*
�����
�
� ttjttjj EjEjD ���� , where Dt is the measure of expected deviation of inflation
from the target, j indexes the month, and t indexes the year. Observe that Dt does not contain inflationexpectations referring to two years in advance, despite the existence of a target for such period. Given theshorter lags in the transmission mechanism of monetary policy estimated for the Brazilian economy andthe higher uncertainty associated with the forecasts, it is reasonable to assume the Copom concentrates oncurrent and following year forecasts when making interest rate decisions.13 The data on market expectations for the IPCA are available only as of January 2000.
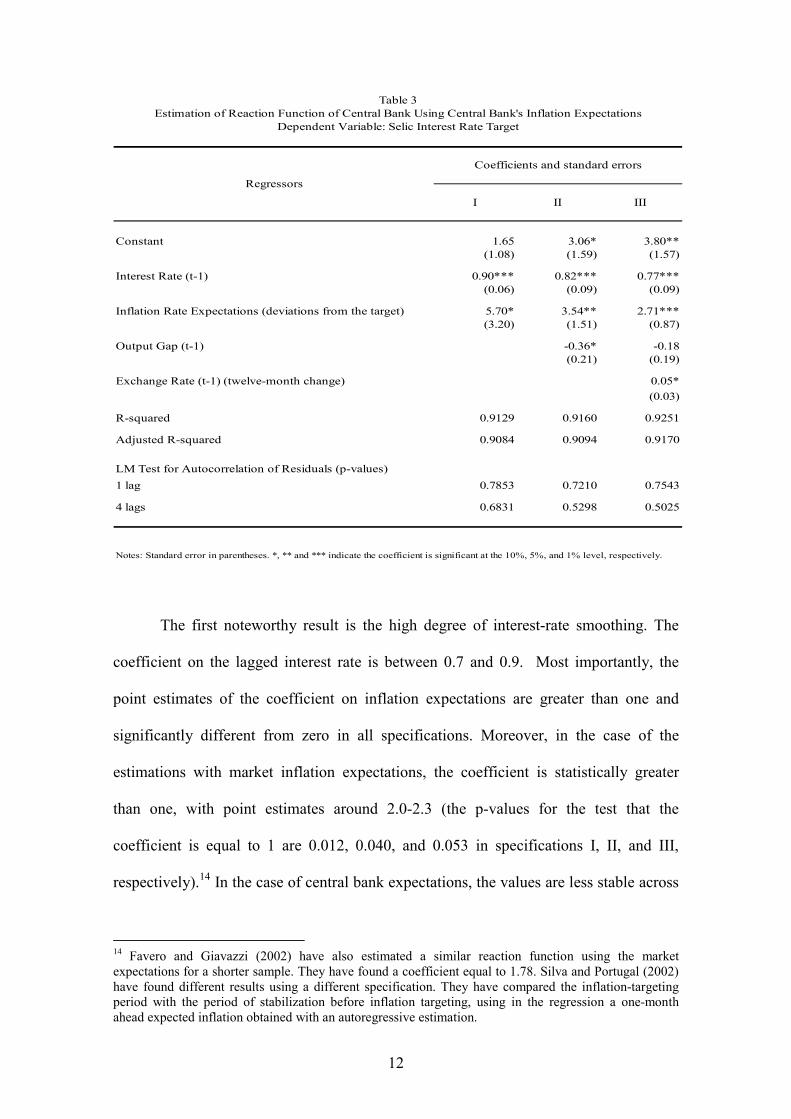
12
I II III
Constant 1.65 3.06* 3.80**(1.08) (1.59) (1.57)
Interest Rate (t-1) 0.90*** 0.82*** 0.77***(0.06) (0.09) (0.09)
Inflation Rate Expectations (deviations from the target) 5.70* 3.54** 2.71***(3.20) (1.51) (0.87)
Output Gap (t-1) -0.36* -0.18(0.21) (0.19)
Exchange Rate (t-1) (twelve-month change) 0.05*(0.03)
R-squared 0.9129 0.9160 0.9251
Adjusted R-squared 0.9084 0.9094 0.9170
LM Test for Autocorrelation of Residuals (p-values)1 lag 0.7853 0.7210 0.7543
4 lags 0.6831 0.5298 0.5025
Notes: Standard error in parentheses. *, ** and *** indicate the coefficient is significant at the 10%, 5%, and 1% level, respectively.
Regressors
Table 3Estimation of Reaction Function of Central Bank Using Central Bank's Inflation Expectations
Dependent Variable: Selic Interest Rate Target
Coefficients and standard errors
The first noteworthy result is the high degree of interest-rate smoothing. The
coefficient on the lagged interest rate is between 0.7 and 0.9. Most importantly, the
point estimates of the coefficient on inflation expectations are greater than one and
significantly different from zero in all specifications. Moreover, in the case of the
estimations with market inflation expectations, the coefficient is statistically greater
than one, with point estimates around 2.0-2.3 (the p-values for the test that the
coefficient is equal to 1 are 0.012, 0.040, and 0.053 in specifications I, II, and III,
respectively).14 In the case of central bank expectations, the values are less stable across
14 Favero and Giavazzi (2002) have also estimated a similar reaction function using the marketexpectations for a shorter sample. They have found a coefficient equal to 1.78. Silva and Portugal (2002)have found different results using a different specification. They have compared the inflation-targetingperiod with the period of stabilization before inflation targeting, using in the regression a one-monthahead expected inflation obtained with an autoregressive estimation.

13
specifications (from 2.7 to 5.7).15 The estimated coefficient is significantly different
from 1 or close to that (the p-values for the test that the coefficient is equal to 1 are
0.150, 0.101, and 0.058 in specifications I, II, and III, respectively). Therefore, we can
conclude that the Central Bank has been reacting strongly to expected inflation. It
conducts monetary policy on a forward-looking basis, and responds to inflationary
pressures.
I II III
Constant 4.58*** 5.38** 5.24**(1.52) (2.07) (2.12)
Interest Rate (t-1) 0.71*** 0.67*** 0.67***(0.09) (0.12) (0.12)
Inflation Rate Expectations (deviations from the target) 2.32*** 2.09*** 2.05***(0.53) (0.53) (0.54)
Output Gap (t-1) -0.10 -0.07(0.15) (1.67)
Exchange Rate (t-1) (twelve-month change) 0.01(0.03)
R-squared 0.9205 0.9214 0.9219
Adjusted R-squared 0.9157 0.9140 0.9118
LM Test for Autocorrelation of Residuals (p-values)1 lag 0.6586 0.6411 0.5794
4 lags 0.5362 0.3991 0.4150
Notes: Standard error in parantheses. *, ** and *** indicate the coefficient is significant at the 10%, 5%, and 1% level, respectively.
Regressors
Table 4Estimation of Reaction Function of Central Bank Using Market's Inflation Expectations
Dependent Variable: Selic Interest Rate Target
Coefficients and standard errors
The coefficient on output gap has the wrong sign, but it is statistically significant
only in one of the specifications. One possible explanation for the negative sign is that
part of the supply shocks that hit the economy led to an increase in inflation and
15 If we compare to a sample that ends in 2002:06, the point estimates in that shorter sample are similarwhen using market’s expectations, and are lower in the case of central bank’s expectations, although notstatistically different.
14
simultaneously to a reduction in output. This clearly occurred in the case of the
rationing in electricity. Since we observe a simultaneous interest rate increase and
reduction of output, if the inflation expectations term does not capture this change
completely, we tend to obtain negative coefficients for the output gap term.
Furthermore, note that when we include the exchange rate the coefficient becomes not
significant. External shocks tend to generate inflationary pressures at the same time that
tend to decrease output, at least in the short run.
3.2. Inflation expectations and the role of the targets
Since mid-2001, 12-month inflation has been above the upper limit of the target
tolerance interval.16 A naive analysis of the inflation-targeting regime in Brazil might
say that this regime has not been successful in controlling inflation. Nevertheless,
inflation outcomes are not a sufficient statistic to evaluate the performance of the
Central Bank given the magnitude of the supply shocks. The evolution of inflation
expectations, and the role of the target are also relevant variables in assessing the
credibility of the Central Bank.
In the context of significant shocks, it is crucial that private agents understand
that, even with a monetary policy consistent with the inflation-targeting framework,
actual inflation may breach the targets. Given the magnitude of the shocks that hit the
Brazilian economy, a strong reaction of the monetary authorities cannot avoid an
increase in the inflation rate and some departure of inflation expectations from the
original targets. In terms of inflation expectations, it is important is that they converge
to the targets over a certain time horizon.
16 The targets are established only for year-end inflation. We have calculated targets for the other monthsof the year using linear interpolation.

15
Two conditions are necessary to guarantee inflation expectations will remain
under control. The first is that the conduct of monetary policy should be consistent with
the main guidelines expressed by the Copom. In this sense, the reaction function
estimated in the previous subsection shows that the Central Bank has been acting
consistently within the inflation-targeting framework. The second condition for
controlling expectations is clear communication with the public. It is important that
private agents understand why actual inflation was above the target and how monetary
policy is being conducted in order to drive inflation back to the target. The Central Bank
of Brazil communicates with the market via informal speeches and formal documents,
such as the minutes of the Copom meetings, which are released one week after the
meetings, and the Inflation Report, which is published on a quarterly basis.
Furthermore, the reasons for the non-fulfillment of the inflation targets in 2001 and
2002 were thoroughly explained in open letters to the Minister of Finance.
The conduct of monetary policy has been based on accommodating the first-
round effects of supply and cost-push shocks. This means monetary policy will allow
relative price movements to affect inflation, but will neutralize the second-round effects.
The Central Bank has developed a methodology that calculates the inflationary impact
of current supply shocks as well as the secondary impact of past shocks (due to inertia
in the inflation process). Since the primary effect is accommodated, the optimal
inflation path may imply that 12-month ahead inflation is above the previous annual
target. Therefore, in this situation, given that the Central Bank is no longer aiming for
the previous inflation target, it uses an "adjusted target". More specifically, the original
target is adjusted in order to take into account the primary effects of the change in
relative prices and of past inertia that will be accommodated. Part of inertia is
accommodated because the Central Bank also takes output volatility into account in its

16
decisions. The new target is publicly announced.17 Although there is a credibility loss
stemming from the target change itself, the gains in terms of transparency and
communication are more significant. Private agents know the target the Central Bank is
pursuing. Actually, keeping the old target would affect the credibility of the Central
Bank because it could be considered unattainable.
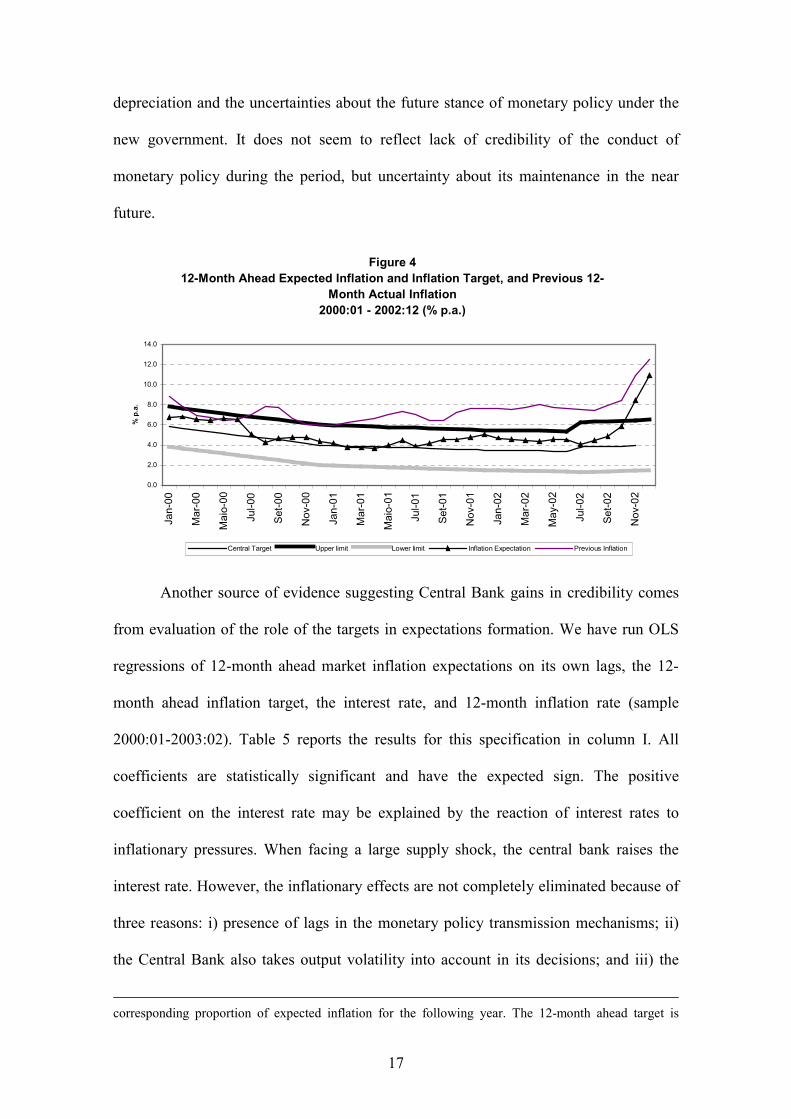
Figure 4 shows the 12-month ahead inflation that is expected by the market, the
12-month ahead target, and the actual 12-month accumulated inflation.18 It is clear that
inflation expectations remained below the upper limit of the tolerance interval prior to
the last quarter of 2002. This is true even since the second half of 2001, when actual
inflation surpassed the tolerance interval. The correlation coefficient between the actual
and expected inflation series has increased. From 2000:1 to 2002:1, the correlation is
0.22, but with the sample ending in 2002:12, the value is 0.74. As the graph shows,
since mid-2000, the 12-month ahead inflation expectations have been below the actual
12-month inflation. This indicates that private agents tend to expect that the rise in the
inflation rate will tend to reverse in the medium run. The fact that actual inflation has
been above the value that was expected 12 months ago reflects basically the frequent
and large cost-push shocks that hit the economy during this period. It is noteworthy that
the difficulties the country faced last year impacted inflation expectations more
significantly only in the last quarter of 2002. The median of inflation expectations for
2002 leveled out at around 4.5% through September, but then rapidly deteriorated
afterwards and reached 11% at the end of December. The increase in expectations is
associated with the expected inflationary effects of the strong exchange rate
17 The adjusted targets for 2003 and 2004, 8.5% and 5.5%, were published in the open letter from theGovernor of the Central Bank to the Minister of Finance on 1/21/03 (Banco Central do Brasil, 2003). Fora more detailed explanation of the methodology, see Freitas, Minella, and Riella (2002).18 We estimate the 12-month ahead expected inflation rate using the expected inflation for the remainingmonths of the current year and, for the remaining months necessary to achieve 12 months, the
17
depreciation and the uncertainties about the future stance of monetary policy under the
new government. It does not seem to reflect lack of credibility of the conduct of
monetary policy during the period, but uncertainty about its maintenance in the near
future.
Figure 412-Month Ahead Expected Inflation and Inflation Target, and Previous 12-
Month Actual Inflation2000:01 - 2002:12 (% p.a.)
0.0
2.0
4.0
6.0
8.0
10.0
12.0
14.0
Jan-
00
Mar
-00
Mai
o-00
Jul-0
0
Set-0
0
Nov
-00
Jan-
01
Mar
-01
Mai
o-01
Jul-0
1
Set-0
1
Nov
-01
Jan-
02
Mar
-02
May
-02
Jul-0
2
Set-0
2
Nov
-02
% p
.a.
Central Target Upper limit Lower limit Inflation Expectation Previous Inflation
Another source of evidence suggesting Central Bank gains in credibility comes
from evaluation of the role of the targets in expectations formation. We have run OLS
regressions of 12-month ahead market inflation expectations on its own lags, the 12-
month ahead inflation target, the interest rate, and 12-month inflation rate (sample
2000:01-2003:02). Table 5 reports the results for this specification in column I. All
coefficients are statistically significant and have the expected sign. The positive
coefficient on the interest rate may be explained by the reaction of interest rates to
inflationary pressures. When facing a large supply shock, the central bank raises the
interest rate. However, the inflationary effects are not completely eliminated because of
three reasons: i) presence of lags in the monetary policy transmission mechanisms; ii)
the Central Bank also takes output volatility into account in its decisions; and iii) the
corresponding proportion of expected inflation for the following year. The 12-month ahead target is

18
Central Bank has acted so as to accommodate first order effects of the change in relative
prices (and neutralize second-order effects). As a result, we observe that interest rate
and inflation expectations move in the same direction. Since the Central Bank reacts to
its own expectations of inflation, interest rate movements also reflect the central bank's
inflation expectations.
I II III IV
Constant -7.35*** -7.33*** -6.22** -6.33**(2.33) (2.32) (2.30) (2.33)
Market Inflation Rate Expectations (t-1) 0.91*** 0.86*** 0.89*** 0.86***(0.18) (0.19) (0.18) (0.19)
Market Inflation Rate Expectations (t-2) -0.80*** -0.72*** -0.62*** -0.60***(0.17) (0.19) (0.19) (0.20)
Interest Rate (t-1) 0.24** 0.19 0.18 0.15(0.12) (0.13) (0.12) (0.12)
Inflation Rate Target (12-Month Ahead) 1.06*** 1.22*** 0.92*** 1.01**(0.33) (0.36) (0.32) (0.37)
12-Month Inflation Rate (t-1) 0.45*** 0.46*** 0.35** 0.37**(0.15) (0.15) (0.15) (0.16)
12-Month Exchange Rate Change (t-1) 0.01 0.01(0.01) (0.01)
Embi Plus Brazil (t-1) 0.06* 0.05(0.03) (0.03)
R-squared 0.9148 0.9186 0.9247 0.9255
Adjusted R-squared 0.9007 0.9017 0.9091 0.9069
LM Test for Autocorrelation of Residuals (p-values)1 lag 0.2403 0.25875 0.5061 0.5465
4 lags 0.3869 0.2711 0.1725 0.0540
Notes: Standard error in parentheses. *, ** and *** indicate the coefficient is significant at the 10%, 5%, and 1% level, respectively.
Estimation of Inflation ExpectationsTable 5
RegressorsCoefficients and standard errors
Dependent Variable: Market Inflation Rate Expectations - 2000:1 - 2003:2
Most importantly, expected inflation reacts significantly to the inflation targets
(coefficient around 1). One could consider that this result could be a consequence of
some correlation between targets and past inflation, but note that the regression also
includes the actual 12-month inflation rate. Therefore, there are indications that the
inflation targets play an important role for expectations. The past inflation term,
however, has a statistically significant coefficient, indicating that past inflation still
estimated by interpolation.
19
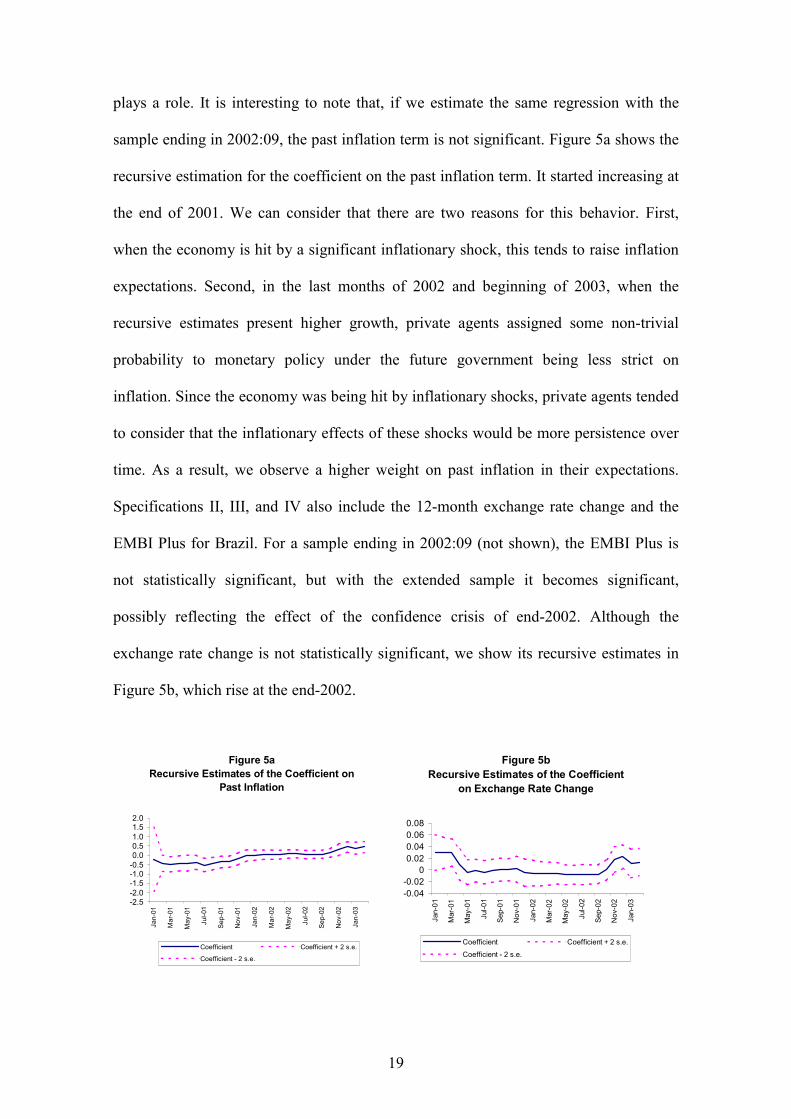
plays a role. It is interesting to note that, if we estimate the same regression with the
sample ending in 2002:09, the past inflation term is not significant. Figure 5a shows the
recursive estimation for the coefficient on the past inflation term. It started increasing at
the end of 2001. We can consider that there are two reasons for this behavior. First,
when the economy is hit by a significant inflationary shock, this tends to raise inflation
expectations. Second, in the last months of 2002 and beginning of 2003, when the
recursive estimates present higher growth, private agents assigned some non-trivial
probability to monetary policy under the future government being less strict on
inflation. Since the economy was being hit by inflationary shocks, private agents tended
to consider that the inflationary effects of these shocks would be more persistence over
time. As a result, we observe a higher weight on past inflation in their expectations.
Specifications II, III, and IV also include the 12-month exchange rate change and the
EMBI Plus for Brazil. For a sample ending in 2002:09 (not shown), the EMBI Plus is
not statistically significant, but with the extended sample it becomes significant,
possibly reflecting the effect of the confidence crisis of end-2002. Although the
exchange rate change is not statistically significant, we show its recursive estimates in
Figure 5b, which rise at the end-2002.
Figure 5aRecursive Estimates of the Coefficient on
Past Inflation
-2.5-2.0-1.5-1.0-0.50.00.51.01.52.0
Jan-
01
Mar
-01
May
-01
Jul-0
1
Sep-
01
Nov
-01
Jan-
02
Mar
-02
May
-02
Jul-0
2
Sep-
02
Nov
-02
Jan-
03
Coefficient Coefficient + 2 s.e.
Coefficient - 2 s.e.
Figure 5bRecursive Estimates of the Coefficient
on Exchange Rate Change
-0.04-0.02
00.020.040.060.08
Jan-
01
Mar
-01
May
-01
Jul-0
1
Sep-
01
Nov
-01
Jan-
02
Mar
-02
May
-02
Jul-0
2
Sep-
02
Nov
-02
Jan-
03
Coefficient Coefficient + 2 s.e.Coefficient - 2 s.e.

20
The particularity of the transition period to the new government is clear when we
estimate the four specifications with a sample ending in September 2002, and forecast
inflation expectations for the following five months. Figure 6 shows these out-of-sample
forecasts. All of them point to an increase in inflation expectations, but are significantly
below actual inflation expectations, in spite of a adjusted R-squared greater than 0.90.
Figure 6Actual and Forecast Values for Inflation Expectations (% p.a.)
2 3 4 5 6 7 8 9
10 11 12
Jul-02 Aug-02 Sep-02 Oct-02 Nov-02 Dec-02 Jan-03 Feb-03 Inflation Expectations Forecast Specification I Forecast Specification IV Forecast + 2 s.e. (I) Forecast - 2 s.e. (I)
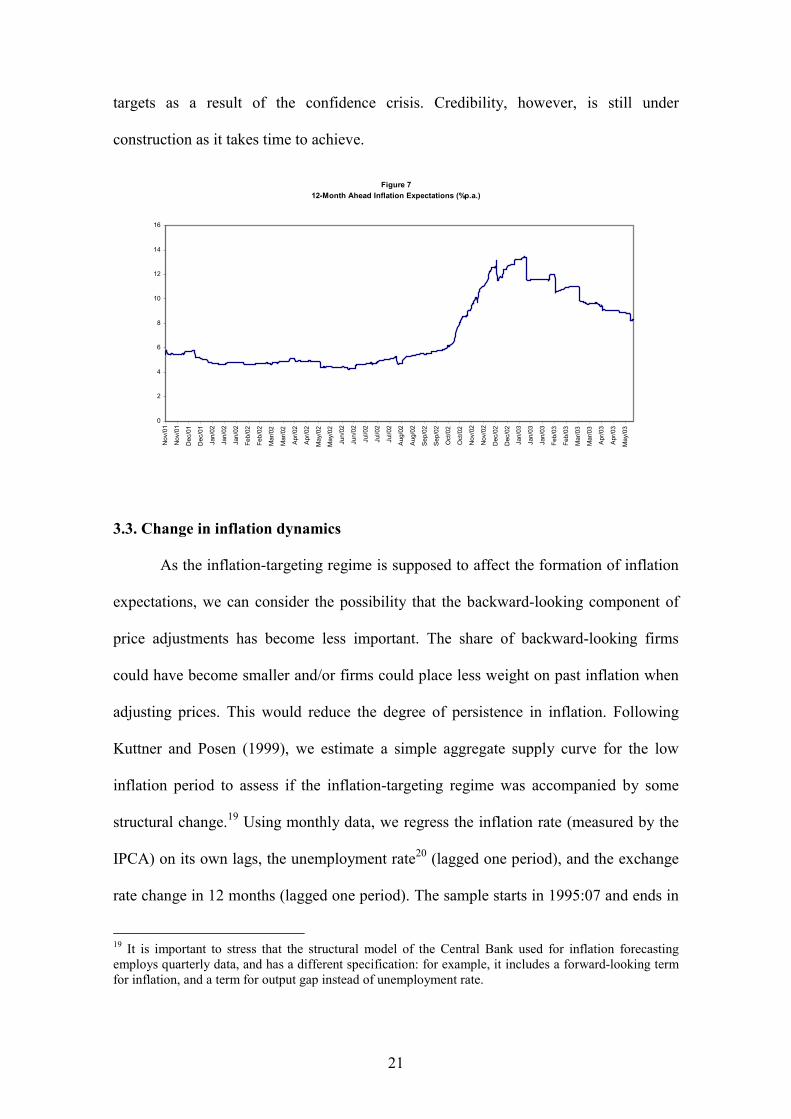
Since November 2001, the Central Bank has published 12-month ahead inflation
expectations, which is recorded in Figure 7. In the estimations we have used so far, we
have employed a weighted average of the expectations for the end of the current and
following years. We can see that inflation expectations have reverted since the
beginning of 2003.
In summary, although the actual inflation rate has been above the upper limit of
the tolerance interval in 2001 and 2002, the inflation-targeting regime has been
successful in anchoring expectations. This is a consequence of the credibility gains that
the Central Bank has achieved since the implementation of the inflation-targeting
regime. Only in the fourth quarter of 2002 did inflation expectations depart from the
21
targets as a result of the confidence crisis. Credibility, however, is still under
construction as it takes time to achieve.
Figure 712-Month Ahead Inflation Expectations (%p.a.)
0
2
4
6
8
10
12
14
16
Nov
/01
Nov
/01
Dec
/01
Dec
/01
Jan/
02
Jan/
02
Jan/
02
Feb/
02
Feb/
02
Mar
/02
Mar
/02
Apr/0
2
Apr/0
2
May
/02
May
/02
Jun/
02
Jun/
02
Jul/0
2
Jul/0
2
Jul/0
2
Aug/
02
Aug/
02
Sep/
02
Sep/
02
Oct
/02
Oct
/02
Nov
/02
Nov
/02
Dec
/02
Dec
/02
Jan/
03
Jan/
03
Jan/
03
Feb/
03
Feb/
03
Mar
/03
Mar
/03
Apr/0
3
Apr/0
3
May
/03
3.3. Change in inflation dynamics
As the inflation-targeting regime is supposed to affect the formation of inflation
expectations, we can consider the possibility that the backward-looking component of
price adjustments has become less important. The share of backward-looking firms
could have become smaller and/or firms could place less weight on past inflation when
adjusting prices. This would reduce the degree of persistence in inflation. Following
Kuttner and Posen (1999), we estimate a simple aggregate supply curve for the low
inflation period to assess if the inflation-targeting regime was accompanied by some
structural change.19 Using monthly data, we regress the inflation rate (measured by the
IPCA) on its own lags, the unemployment rate20 (lagged one period), and the exchange
rate change in 12 months (lagged one period). The sample starts in 1995:07 and ends in
19 It is important to stress that the structural model of the Central Bank used for inflation forecastingemploys quarterly data, and has a different specification: for example, it includes a forward-looking termfor inflation, and a term for output gap instead of unemployment rate.
22
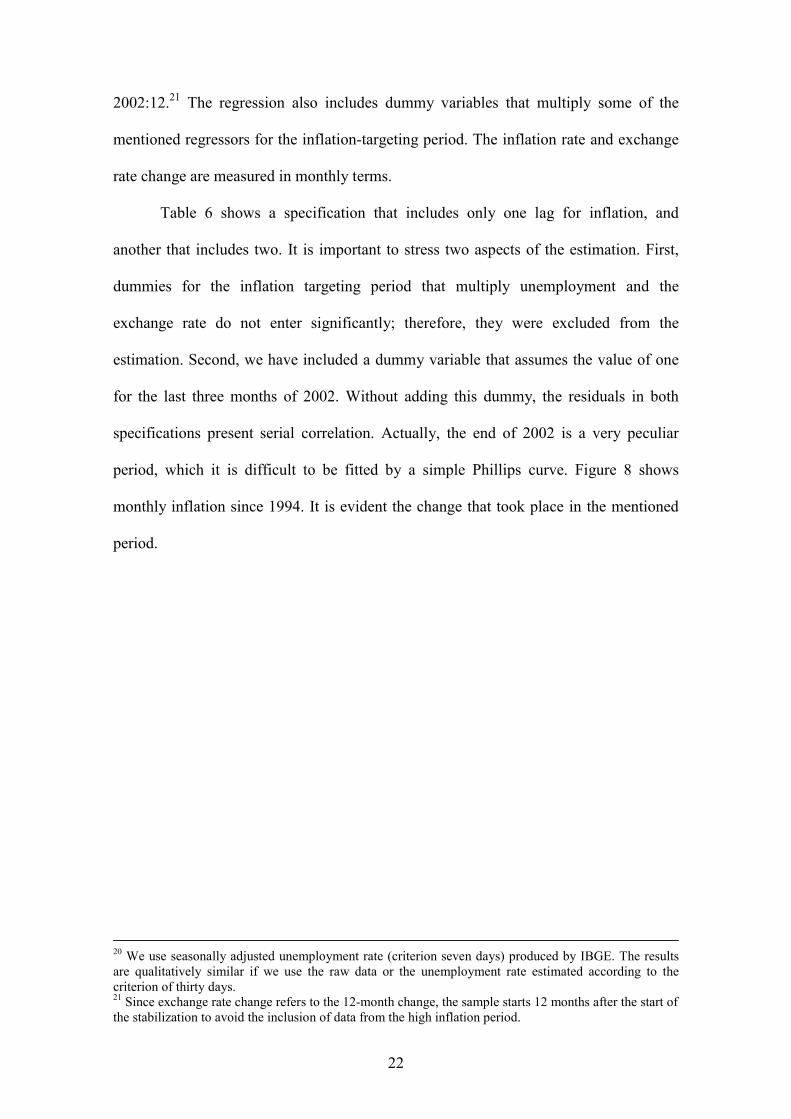
2002:12.21 The regression also includes dummy variables that multiply some of the
mentioned regressors for the inflation-targeting period. The inflation rate and exchange
rate change are measured in monthly terms.
Table 6 shows a specification that includes only one lag for inflation, and
another that includes two. It is important to stress two aspects of the estimation. First,
dummies for the inflation targeting period that multiply unemployment and the
exchange rate do not enter significantly; therefore, they were excluded from the
estimation. Second, we have included a dummy variable that assumes the value of one
for the last three months of 2002. Without adding this dummy, the residuals in both
specifications present serial correlation. Actually, the end of 2002 is a very peculiar
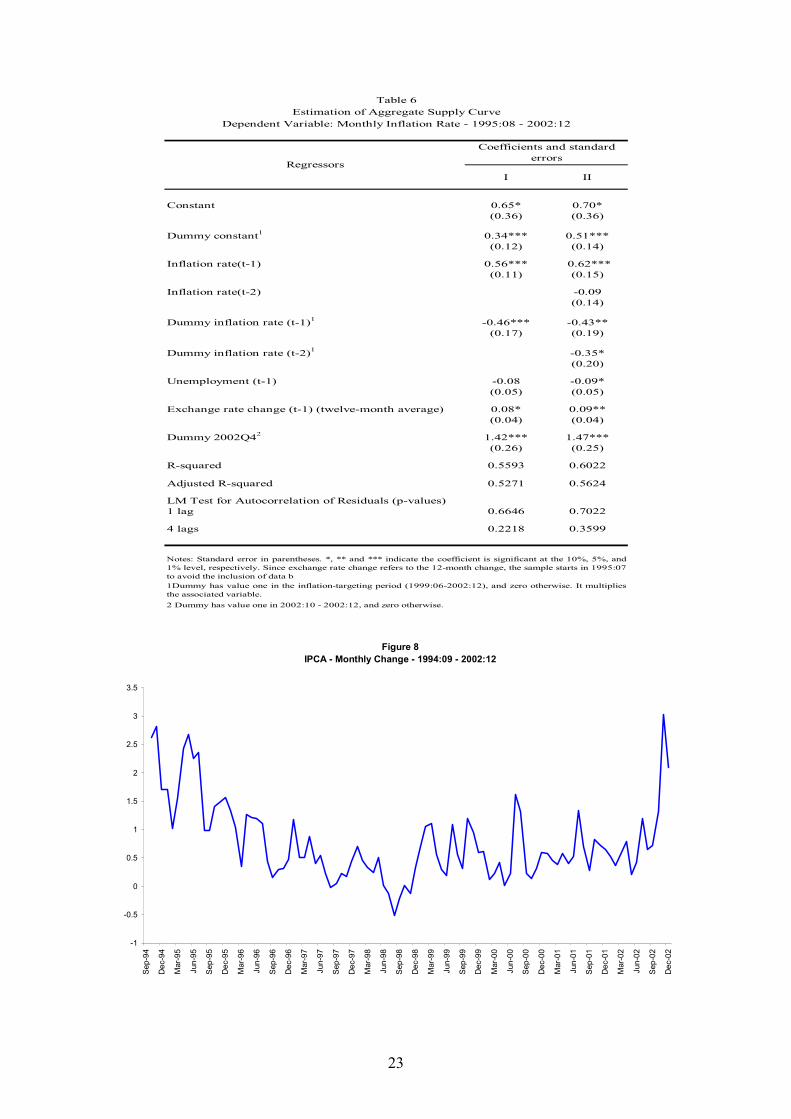
period, which it is difficult to be fitted by a simple Phillips curve. Figure 8 shows
monthly inflation since 1994. It is evident the change that took place in the mentioned
period.
20 We use seasonally adjusted unemployment rate (criterion seven days) produced by IBGE. The resultsare qualitatively similar if we use the raw data or the unemployment rate estimated according to thecriterion of thirty days.21 Since exchange rate change refers to the 12-month change, the sample starts 12 months after the start ofthe stabilization to avoid the inclusion of data from the high inflation period.
23
I II
Constant 0.65* 0.70*(0.36) (0.36)
Dummy constant1 0.34*** 0.51***(0.12) (0.14)
Inflation rate(t-1) 0.56*** 0.62***(0.11) (0.15)
Inflation rate(t-2) -0.09(0.14)
Dummy inflation rate (t-1)1 -0.46*** -0.43**(0.17) (0.19)
Dummy inflation rate (t-2)1 -0.35*(0.20)
Unemployment (t-1) -0.08 -0.09*(0.05) (0.05)
Exchange rate change (t-1) (twelve-month average) 0.08* 0.09**(0.04) (0.04)
Dummy 2002Q42 1.42*** 1.47***(0.26) (0.25)
R-squared 0.5593 0.6022
Adjusted R-squared 0.5271 0.5624
LM Test for Autocorrelation of Residuals (p-values)1 lag 0.6646 0.7022
4 lags 0.2218 0.3599
2 Dummy has value one in 2002:10 - 2002:12, and zero otherwise.
Table 6Estimation of Aggregate Supply Curve
Dependent Variable: Monthly Inflation Rate - 1995:08 - 2002:12
Notes: Standard error in parentheses. *, ** and *** indicate the coefficient is significant at the 10%, 5%, and1% level, respectively. Since exchange rate change refers to the 12-month change, the sample starts in 1995:07to avoid the inclusion of data b1Dummy has value one in the inflation-targeting period (1999:06-2002:12), and zero otherwise. It multipliesthe associated variable.
Regressors
Coefficients and standard errors
Figure 8IPCA - Monthly Change - 1994:09 - 2002:12
-1
-0.5
0
0.5
1
1.5
2
2.5
3
3.5
Sep-
94
Dec
-94
Mar
-95
Jun-
95
Sep-
95
Dec
-95
Mar
-96
Jun-
96
Sep-
96
Dec
-96
Mar
-97
Jun-
97
Sep-
97
Dec
-97
Mar
-98
Jun-
98
Sep-
98
Dec
-98
Mar
-99
Jun-
99
Sep-
99
Dec
-99
Mar
-00
Jun-
00
Sep-
00
Dec
-00
Mar
-01
Jun-
01
Sep-
01
Dec
-01
Mar
-02
Jun-
02
Sep-
02
Dec
-02

24
From the estimated coefficients on the dummy variables in both specifications,
we can conclude there is a statistically significant change in the constant and in the
coefficient on lagged inflation in the inflation-targeting period. The point estimate of the
autoregressive coefficient in specification I falls from 0.56 to 0.10 in the inflation
targeting period (0.56 minus 0.46). This estimation indicates that there has been a
substantial reduction in the degree of inflation persistence after inflation targeting was
adopted. This implies a lower output cost to curb inflationary pressures and to reduce
average inflation.22 Using recursive estimation for the lagged coefficient, however, we
do not observe a reduction in the coefficient. We have also used time-varying
coefficient estimation for the simple aggregate supply equation. We regress the inflation
rate on its own lag, the unemployment rate, and the exchange rate change, setting the
coefficient on the lagged inflation as time varying. The filtered values for the coefficient
are drawn in Figure 9. We can see a decreasing tendency for the coefficient, except for
the last months of 2002, when it rises rapidly.
22 Note that, although the constant in the regression is higher in the inflation-targeting period, theunconditional expected inflation (up to a constant referring to the natural unemployment rate) is equal to1.5 and 1.1 for the periods before and after inflation-targeting adoption using the first specification, and1.5 and 1.0 employing the second specification.

25
Figure 9Time-Varying Coefficients for Lagged Inflation Term - Filtered Estimates
-0.2
0
0.2
0.4
0.6
0.8
1
1.2Ja
n-97
Mar
-97
May
-97
Jul-9
7
Sep-
97
Nov
-97
Jan-
98
Mar
-98
May
-98
Jul-9
8
Sep-
98
Nov
-98
Jan-
99
Mar
-99
May
-99
Jul-9
9
Sep-
99
Nov
-99
Jan-
00
Mar
-00
May
-00
Jul-0
0
Sep-
00
Nov
-00
Jan-
01
Mar
-01
May
-01
Jul-0
1
Sep-
01
Nov
-01
Jan-
02
Mar
-02
May
-02
Jul-0
2
Sep-
02
Nov
-02
Coefficient Coefficient + 2 s.e. Coefficient - 2 s.e.
The coefficient on lagged unemployment is negative and statistically significant
or close to that. Its p-values are 0.130 and 0.068 in specifications I and II, respectively.
Since the coefficient value is about -0.08, a one-percentage point increase in the
unemployment rate decreases the inflation rate by 1.0 percentage points when measured
in annual terms. Considering the indirect effects via inflation inertia, the total effect on
inflation over a year is 1.95 p.p. and 1.06 p.p. for the whole sample and for the inflation-
targeting period, respectively (the periods have different degrees of inflation
persistence).
The exchange rate change also enters significantly. The coefficient is around
0.08, which, considering the lagged inflation term, generates a 12-month pass-through
of 18% and 9% for the whole sample and for the inflation-targeting period, respectively.
As in the unemployment case, the smaller pass-through in the recent period is a
consequence of the lower degree of persistence in inflation. However, using a recursive
estimation for the coefficient on the exchange rate change, we observe a decline in the
pass-through with the adoption of the floating exchange regime in January 1999 (Figure
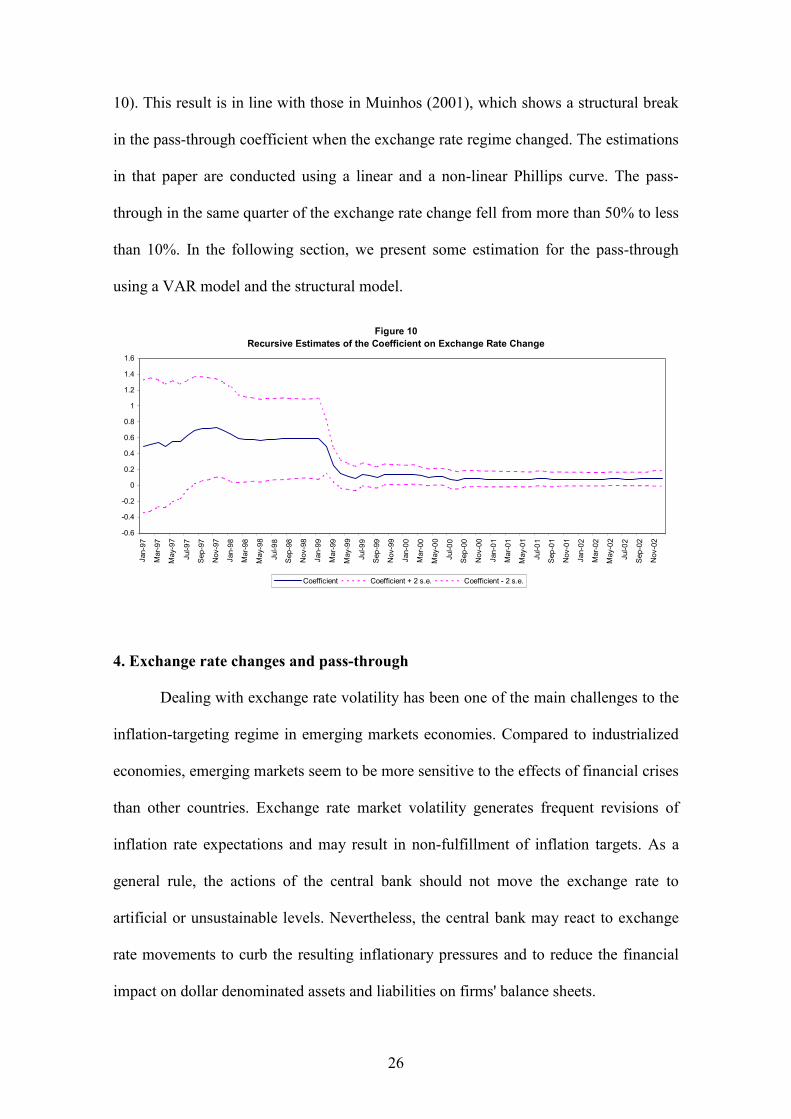
26
10). This result is in line with those in Muinhos (2001), which shows a structural break
in the pass-through coefficient when the exchange rate regime changed. The estimations
in that paper are conducted using a linear and a non-linear Phillips curve. The pass-
through in the same quarter of the exchange rate change fell from more than 50% to less
than 10%. In the following section, we present some estimation for the pass-through
using a VAR model and the structural model.
Figure 10Recursive Estimates of the Coefficient on Exchange Rate Change
-0.6
-0.4
-0.2
0
0.2
0.4
0.6
0.8
1
1.2
1.4
1.6
Jan-
97
Mar
- 97
May
-97
Jul-9
7
Sep-
97
Nov
-97
Jan-
98
Mar
- 98
May
- 98
Jul -9
8
S ep-
98
Nov
-98
Jan-
99
Mar
- 99
May
-99
Jul- 9
9
Sep-
99
Nov
- 99
Jan-
00
Mar
- 00
May
-00
Jul- 0
0
Sep-
00
Nov
-00
Jan-
01
Mar
-01
May
- 01
Jul- 0
1
Sep-
01
Nov
- 01
Jan-
02
Mar
-02
May
- 02
Jul -0
2
Sep-
02
Nov
- 02
Coefficient Coefficient + 2 s.e. Coefficient - 2 s.e.
4. Exchange rate changes and pass-through
Dealing with exchange rate volatility has been one of the main challenges to the
inflation-targeting regime in emerging markets economies. Compared to industrialized
economies, emerging markets seem to be more sensitive to the effects of financial crises
than other countries. Exchange rate market volatility generates frequent revisions of
inflation rate expectations and may result in non-fulfillment of inflation targets. As a
general rule, the actions of the central bank should not move the exchange rate to
artificial or unsustainable levels. Nevertheless, the central bank may react to exchange
rate movements to curb the resulting inflationary pressures and to reduce the financial
impact on dollar denominated assets and liabilities on firms' balance sheets.
27
Regarding the financial problems associated with exchange rate volatility,
Haussmann, Panizza and Stein (2001) have argued that all countries that are not able to
issue debt in their own currency are more vulnerable to the impact of currency
mismatches in their balance sheets. Those mismatches are even more dramatic in a
financially integrated world, where rumors of financial problems may lead to capital
flight that might produce self-fulfilling crises, generating a bad equilibrium. As
observed by Schmidt-Hebel and Werner (2002), the level of reserves works as insurance
against the occurrence of this bad equilibrium. If all the burden of the adjustment to
capital outflows during financial crisis is supported by exchange rate depreciation, the
country might have a backward bending exchange rate supply curve with no equilibrium
being possible. They justify foreign exchange rate intervention based on the following
reasons: (i) facilitate adjustment to sudden reductions in capital inflows; (ii) accumulate
reserves; (iii) reduce excessive exchange rate volatility (associated with lower liquidity
in foreign exchange markets); and (iv) raise the supply of exchange rate insurance.
Given the problems associated with exchange rate volatility and the pros of
intervention, the Central Bank of Brazil, like those in other emerging markets
economies, including some that have also adopted inflation targeting, has actually been
implementing a dirty-floating exchange rate policy.23 Interventions are made as
transparent as possible in order to avoid the concern expressed by Mishkin (2000) that
intervention may hinder the credibility of monetary policy as the public may realize that
stabilizing the exchange rate takes precedence over promoting price stability as a policy
objective.
In Brazil, the volatility of the exchange rate has been considerable. From
1999:07 through 2002:12, the exchange rate (monthly average) depreciated on average
23 Calvo and Reinhart (2002) discuss the limited empirical evidence of truly free-floating countries.
28
1.8% per month, with a standard error of 4.2 and a coefficient of variation (ratio of
standard error to average) of 2.4. The inflationary pressures resulting from exchange
rate depreciation are more related to the magnitude of the depreciation than to the pass-
through coefficient.24 According to the structural model of the Central Bank, the pass-
through to market prices inflation, as a percentage of the observed depreciation, is 12%
after one year of the depreciation. The pass-through to administered prices is estimated
to be 25%, resulting in a pass-through of about 16% for the headline IPCA. In line with
these estimates, between January 2001 and December 2002, the price of the dollar
moved from R$ 1.95 to R$ 3.64, implying an increase of 86.7%. In the same period,
IPCA rose 21.2%. In this sense, Brazil seems to be closer to the lower end of the
estimates done by Haussmann, Panizza and Stein (2001). They estimated the pass-
through accumulated in 12 months for more than 40 countries and found a value below
5% for G-7 countries, and, on the other extreme, figures above 50% for countries like
Mexico, Paraguay and Poland.
We can also use a VAR estimation with monthly data to assess the pass-through
and the importance of exchange rate shocks to the variability of inflation. We use two
specifications. Both include output, the spread of EMBI+ (Emerging Markets Bond
Index Plus) over Treasury bonds,25 the exchange rate (monthly average), and the interest
rate (Selic rate - monthly average). Output is measured by seasonally-adjusted industrial
production. The inclusion of the EMBI+ was necessary because it is a good indicator for
financial crises, both foreign crises (Mexico, Asia, Russia, Argentina) and domestic
(beginning of 1999), which have an important impact on interest rates. In the first
specification, we use administered and market prices as variables, whereas in the second
we use the consumer price index (IPCA) instead. We estimate the model in levels, that
24 See Goldfajn and Werlang (2000) for the reasons for the low pass-through in the Brazilian January1999 devaluation episode.
29
is, using I(1) and I(0) regressors instead of using the error correction representation.26
The estimation is consistent and captures possible existing cointegration relationships
(Sims, Stock, and Watson, 1990; Watson, 1994). The variables used are the log-levels
of output, administered prices, market prices, IPCA and the exchange rate, and the
levels of the EMBI+ spread and the interest rate.27 We use a Cholesky decomposition
with the following order in the first specification: output, administered prices, market
prices, EMBI+, exchange rate, and interest rate. In the second specification, the
consumer price index substitutes for administered and market prices. Since the financial
variables react more rapidly to shocks, we include them after output and price. We also
conduct the estimate using the interest rate before the exchange rate. The results are
very similar. The sample includes all the period of the Real Plan, from September 1994
through December 2002.28 In order to capture possible changes in the second semester
of 2002, we also estimate the impulse responses using a sample that ends in 2002:06.
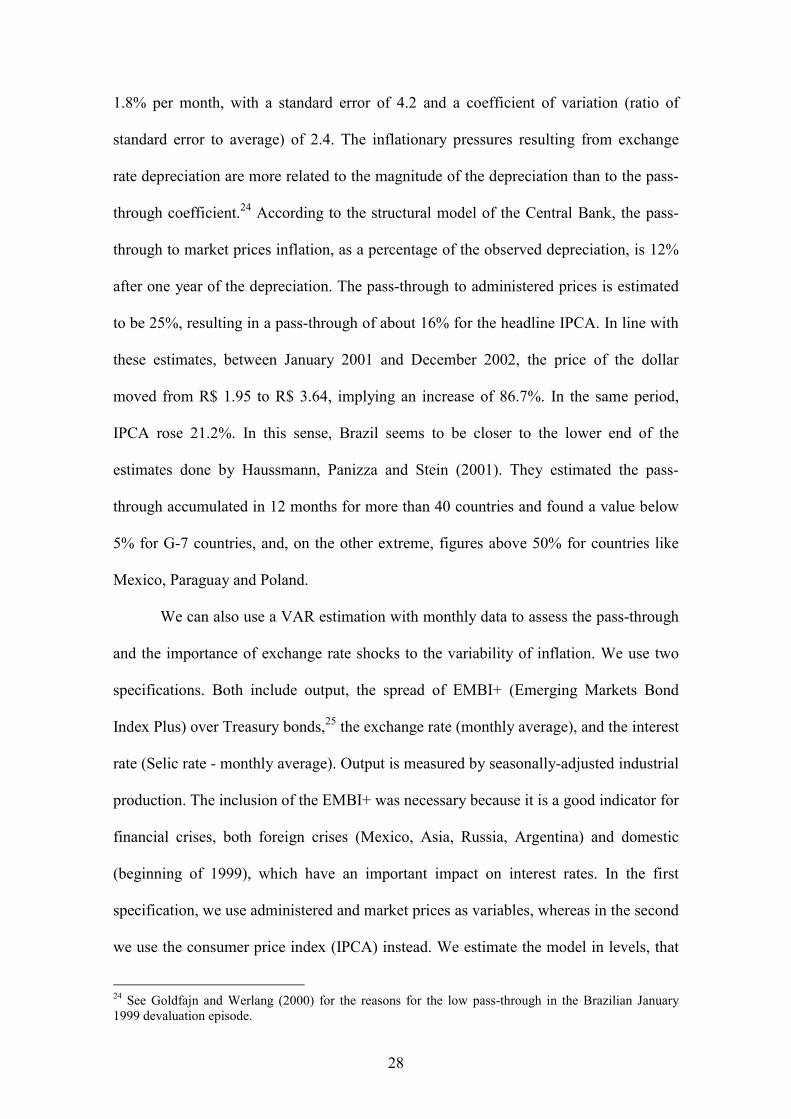
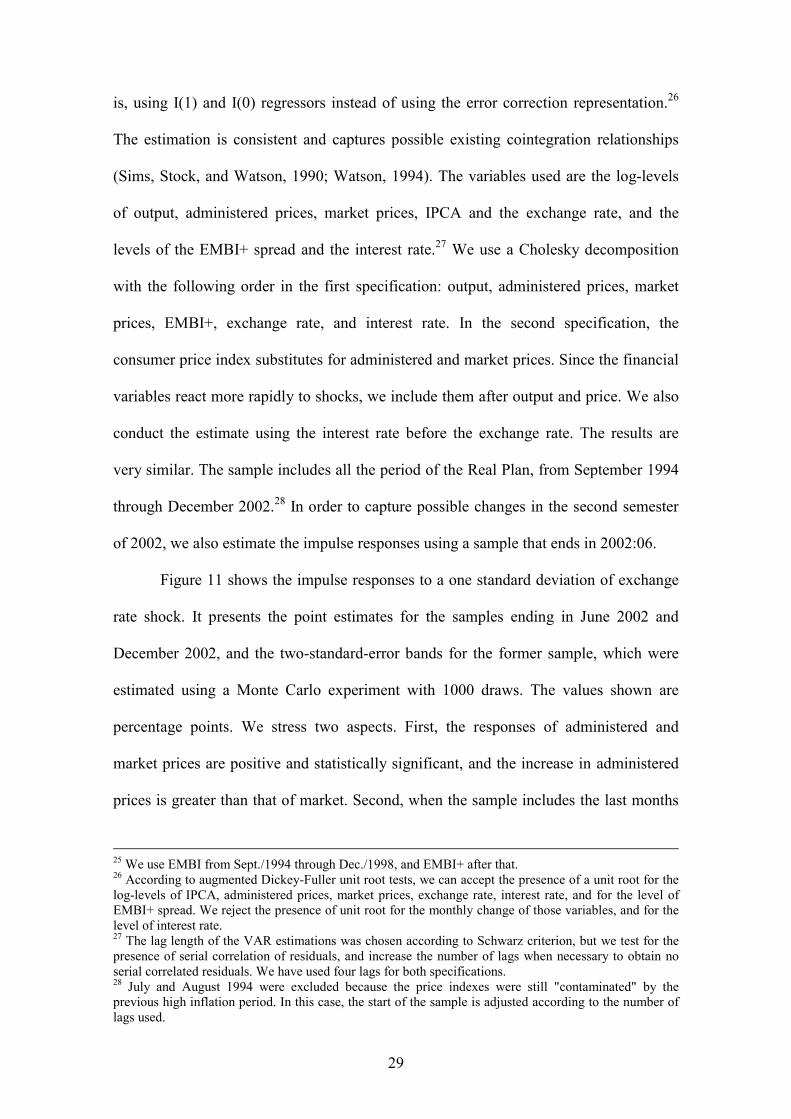
Figure 11 shows the impulse responses to a one standard deviation of exchange
rate shock. It presents the point estimates for the samples ending in June 2002 and
December 2002, and the two-standard-error bands for the former sample, which were
estimated using a Monte Carlo experiment with 1000 draws. The values shown are
percentage points. We stress two aspects. First, the responses of administered and
market prices are positive and statistically significant, and the increase in administered
prices is greater than that of market. Second, when the sample includes the last months
25 We use EMBI from Sept./1994 through Dec./1998, and EMBI+ after that.26 According to augmented Dickey-Fuller unit root tests, we can accept the presence of a unit root for thelog-levels of IPCA, administered prices, market prices, exchange rate, interest rate, and for the level ofEMBI+ spread. We reject the presence of unit root for the monthly change of those variables, and for thelevel of interest rate.27 The lag length of the VAR estimations was chosen according to Schwarz criterion, but we test for thepresence of serial correlation of residuals, and increase the number of lags when necessary to obtain noserial correlated residuals. We have used four lags for both specifications.28 July and August 1994 were excluded because the price indexes were still "contaminated" by theprevious high inflation period. In this case, the start of the sample is adjusted according to the number oflags used.
30
of 2002, we notice an increase in the responses, but still inside the confidence interval
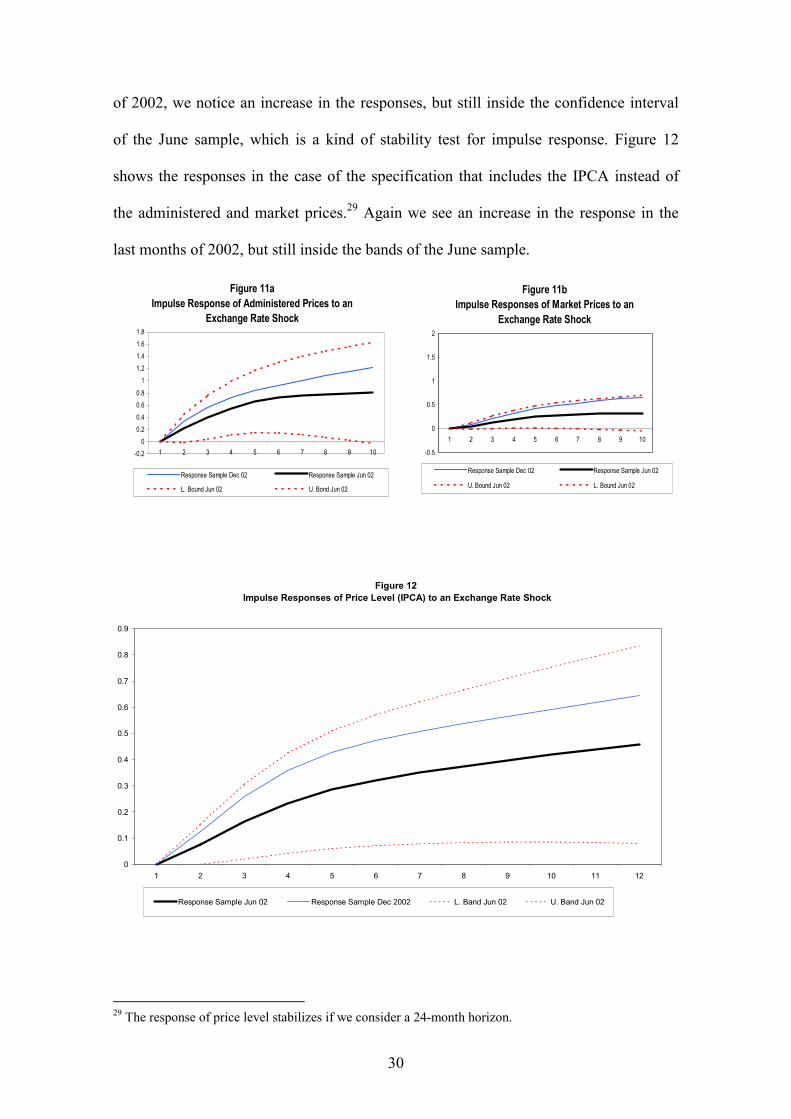
of the June sample, which is a kind of stability test for impulse response. Figure 12
shows the responses in the case of the specification that includes the IPCA instead of
the administered and market prices.29 Again we see an increase in the response in the
last months of 2002, but still inside the bands of the June sample.
Figure 11aImpulse Response of Administered Prices to an
Exchange Rate Shock
-0.20
0.20.40.60.8
11.21.41.61.8
1 2 3 4 5 6 7 8 9 10
Response Sample Dec 02 Response Sample Jun 02
L. Bound Jun 02 U. Bond Jun 02
Figure 11bImpulse Responses of Market Prices to an
Exchange Rate Shock
-0.5
0
0.5
1
1.5
2
1 2 3 4 5 6 7 8 9 10
Response Sample Dec 02 Response Sample Jun 02
U. Bound Jun 02 L. Bound Jun 02
Figure 12 Impulse Responses of Price Level (IPCA) to an Exchange Rate Shock
0
0.1
0.2
0.3
0.4
0.5
0.6
0.7
0.8
0.9
1 2 3 4 5 6 7 8 9 10 11 12
Response Sample Jun 02 Response Sample Dec 2002 L. Band Jun 02 U. Band Jun 02
29 The response of price level stabilizes if we consider a 24-month horizon.
31
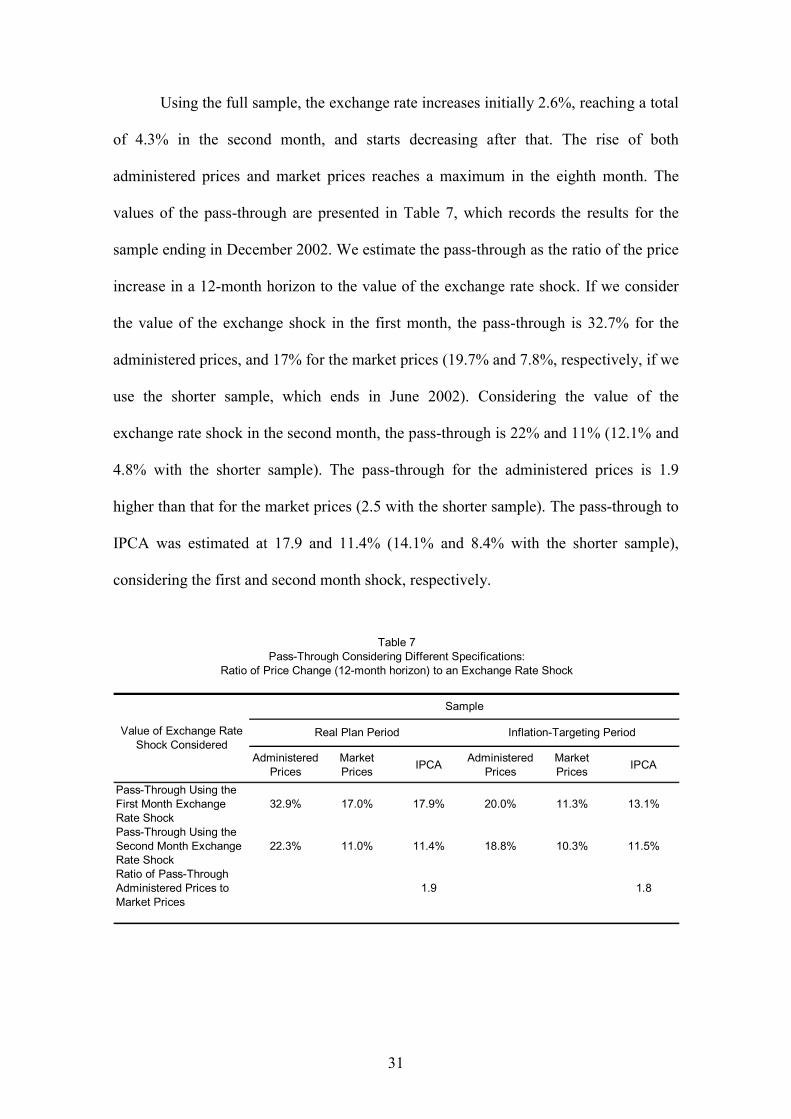
Using the full sample, the exchange rate increases initially 2.6%, reaching a total
of 4.3% in the second month, and starts decreasing after that. The rise of both
administered prices and market prices reaches a maximum in the eighth month. The
values of the pass-through are presented in Table 7, which records the results for the
sample ending in December 2002. We estimate the pass-through as the ratio of the price
increase in a 12-month horizon to the value of the exchange rate shock. If we consider
the value of the exchange shock in the first month, the pass-through is 32.7% for the
administered prices, and 17% for the market prices (19.7% and 7.8%, respectively, if we
use the shorter sample, which ends in June 2002). Considering the value of the
exchange rate shock in the second month, the pass-through is 22% and 11% (12.1% and
4.8% with the shorter sample). The pass-through for the administered prices is 1.9
higher than that for the market prices (2.5 with the shorter sample). The pass-through to
IPCA was estimated at 17.9 and 11.4% (14.1% and 8.4% with the shorter sample),
considering the first and second month shock, respectively.
Administered Prices
Market Prices IPCA Administered
PricesMarket Prices IPCA
Pass-Through Using the First Month Exchange Rate Shock
32.9% 17.0% 17.9% 20.0% 11.3% 13.1%
Pass-Through Using the Second Month Exchange Rate Shock
22.3% 11.0% 11.4% 18.8% 10.3% 11.5%
Ratio of Pass-Through Administered Prices to Market Prices
1.9 1.8
Table 7Pass-Through Considering Different Specifications:
Ratio of Price Change (12-month horizon) to an Exchange Rate Shock
Value of Exchange Rate Shock Considered
Sample
Real Plan Period Inflation-Targeting Period

32
Since the inflation-targeting regime may have represented a structural change in
the relationships, and the exchange rate regime is different from the majority of the
previous period, we estimate a VAR model for the first three years of inflation targeting
(1999:07-2002:12). However, the sample size is too short, and the response of
administered and market prices is positive, but not statistically significant using a two-
standard-error band (they are significant in the first months if we use a one-standard-
error band). To compare with the Real Plan period, however, we show the point
estimates in Table 7.30 One can see a decrease in the pass-through specially using the
first month exchange rate shock in both administered and market prices31. These results
using a VAR model are in line with those in the recursive estimation of the aggregate
supply curve shown in subsection 3.3 and again in Muinhos (2001).
Therefore, exchange rate volatility is an important source of inflation variability.
The design of the inflation-targeting framework has to take into account this issue to
avoid that a possible non-fulfillment of inflation targets as a result of exchange rate
volatility may reduce the credibility of the central bank.
5. Conclusions
The inflation-targeting regime in Brazil is relatively new, but has shown to be
important in achieving low levels of inflation even in a context of large shocks. The
presence of a central bank committed to the achievement of pre-announced inflation
targets has worked as an important coordinator of expectations and generated a more
stable inflation scenario. The pursuit of this goal and the significant increase in
30 We have used two lags in both specifications. With IPCA and three lags, however, the values aresmaller for the pass-through: 9.6% and 4.8%.31 With the sample only until June 2002, all the pass-throughs were smaller, and there was no differencebetween the Real plan and inflation-targeting periods.
33
transparency that has marked the action of monetary policy have contributed to the
development of the awareness of the importance of the commitment to price stability.
During this period, the regime has faced many challenges, including the
construction of credibility – which is still a work in progress – the change in relative
prices, and exchange rate volatility. Dealing with these challenges has required a large
effort by the Central Bank, which itself has also learned substantially and has improved
the system. The Central Bank has reacted strongly to inflation expectations, consistent
with the inflation-targeting framework. Market expectations have remained under
controlled, even in the presence of inflationary shocks. The estimations also indicate a
reduction in the degree of inflation persistence.
Even with the confidence crisis in the second half of 2002, the inflation targeting
framework supported the burden of the crisis, allowing the nominal exchange rate to
adjust and the interest rate to increase to prevent inflation from persisting in high levels
in the economy. In view of the intensity and magnitude of the shocks that hit the
Brazilian economy in 2001 and 2002, the cost in terms of output losses of a policy
aimed at completely offsetting these shocks in a short period of time and keeping
inflation within the tolerance intervals would have been significantly higher. The
Brazilian experience has been a successful stress test for the inflation targeting
framework.
References
Banco Central do Brasil (2003), "Open-Letter sent by Banco Central do Brasil'sGovernor, Henrique de C. Meirelles, to the Minister of Finance, Antonio PalocciFilho", available at www.bcb.gov.br
Bogdanski, Joel, Alexandre A. Tombini, and Sérgio R. C. Werlang (2000),"Implementing Inflation Targeting in Brazil", Working Paper Series no. 1, CentralBank of Brazil, July.

34
Calvo, Guillermo, and Carmen Reinhart (2002), “Fear of Floating”, Quarterly Journalof Economics, 117(2): 379-408, May.
Clarida, Richard, Jordi Galí, and Mark Gertler (1998), "Monetary Policy Rules inPractice: Some International Evidence", European Economic Review, 42: 1033-1067.
Clarida, Richard, Jordi Galí, and Mark Gertler (2000), "Monetary Policy Rules andMacroeconomic Stability: Evidence and Some Theory", Quarterly Journal ofEconomics, Feb.
Favero, Carlo A., and Francesco Giavazzi (2002), "Why are Brazil's Interest Rates soHigh", mimeo.
Fraga, Arminio, Ilan Goldfajn, and André Minella (2003), “Inflation Targeting inEmerging Market Economies”, forthcoming in Gerlter, Mark and Kenneth Rogoff(eds.), NBER Macroeconomics Annual 2003, Volume 18, MIT Press.
Freitas, Paulo S. de, André Minella, and Gil Riella (2002), "Metodologia de Cálculo daInércia Inflacionária e dos Efeitos dos Choques dos Preços Administrados", NotasTécnicas do Banco Central do Brasil no. 22, July. (English translation in BancoCentral do Brasil (2002), Inflation Report, 4(2):123-128, June)
Goldfajn, Ilan, and Sergio R.C. Werlang (2000) “The Pass-Through from Depreciationto Inflation: A Panel Study", Banco Central do Brasil, Working Paper Series nº5,Brasília
Hausmann, Ricardo, Ugo Panizza, and Ernesto Stein (2001), "Why do Countries Floatthe Way They Float", Journal of Development Economics, 66(2): 387-414
Kuttner, Kenneth N., and Adam S. Posen (1999), "Does Talk Matter After All? InflationTargeting and Central Bank Behavior", mimeo
Mishkin, Frederic (2000), “Inflation Targeting in Emerging Market Countries”, NBERWorking Paper Series 7618, Cambridge MA
Muinhos, Marcelo K. (2001), “Inflation Targeting in an Open Financially IntegratedEmerging Economy: the Case of Brasil”, Working Paper Series no.26, CentralBank of Brazil, Aug.
Schmidt-Hebel, Klaus, and Alejandro Werner (2002), "Inflation Targeting in Brazil,Chile, and Mexico: Performance, Credibility and the Exchange Rate", WorkingPaper no. 171, Central Bank of Chile, July
Silva, Marcelo E. A. da, and Marcelo S. Portugal (2002), "Inflation Targeting in Brazil:an Empirical Evaluation", mimeo.
Sims, Christopher A., James H. Stock, and Mark W. Watson (1990), “Inference inLinear Time Series Models with Some Unit Roots”, Econometrica, 58 (1): 113-144, Jan.

35
Taylor, John B. (1993), "Discretion versus Policy Rules in Practice", Carnegie-Rochester Conference Series on Public Policy, 39:195-214.
Watson, Mark W. (1994), “Vector Autoregression and Cointegration”, In: Engle, R. F.and D. L. McFadden (eds.), Handbook of Econometrics, vol. IV, Amsterdam,Elsevier, pp. 2844-2915.