inflation report 4th quarter 2017 - bsp.gov.ph · this inflation report is published by the bsp as...
TRANSCRIPT

INFLATION REPORT 4th Quarter 2017
ISSN 1655-5104

i
The primary objective of monetary policy is to promote a low and stable rate of inflation conducive to
a balanced and sustainable economic growth. The adoption in January 2002 of the inflation targeting
framework for monetary policy was aimed at helping to fulfill this objective.
One of the key features of inflation targeting is greater transparency, which means greater disclosure and
communication by the BSP of its policy actions and decisions. This Inflation Report is published by the BSP
as part of its transparency mechanisms under inflation targeting. The objectives of this Inflation Report
are: (i) to identify the risks to price stability and discuss their implications for monetary policy; and (ii) to
document the economic analysis behind the formulation of monetary policy and convey to the public the
overall thinking behind the BSP’s decisions on monetary policy. The broad aim is to make monetary policy
easier for the public to understand and enable them to better monitor the BSP’s commitment to the
inflation target, thereby helping both in anchoring inflation expectations and encouraging informed
debate on monetary policy issues.
The government’s target for annual headline inflation under the inflation targeting framework has been
set at 3.0 percent ± 1.0 percentage point (ppt) for 2017-2020 by the Development Budget Coordination
Committee (DBCC). This is consistent with the desired disinflation path over the medium term, favorable
trends in inflation dynamics, and expected higher capacity of the economy for growth under a low
inflation environment.
The report is published on a quarterly basis, presenting an analysis of the various factors affecting
inflation. These include recent price and cost developments, inflation expectations, prospects for
aggregate demand and output, labor market conditions, monetary and financial market conditions,
fiscal developments, and the international environment. An entire section is devoted to a discussion
of monetary policy developments in the most recent quarter, while a separate section provides a
comprehensive analysis of the BSP’s view of the inflation outlook for the policy horizon.
The Monetary Board approved this Inflation Report at its meeting on 11 January 2018.
Foreword
NESTOR A. ESPENILLA, JR.
Governor

ii
The BSP Mandate
The BSP’s main responsibility is to formulate and implement policy in the areas of money, banking and
credit, with the primary objective of maintaining stable prices conducive to a balanced and sustainable
economic growth in the Philippines. The BSP also aims to promote and preserve monetary stability and
the convertibility of the national currency.
Monetary Policy Instruments
The BSP’s primary monetary policy instrument is its overnight reverse repurchase (RRP) or borrowing rate.
Other instruments to implement the desired monetary policy stance to achieve the inflation target
include (a) increasing/decreasing the reserve requirement; (b) conducting auctions for the term deposit
facility (TDF);1 (c) adjusting the rediscount rate on loans extended to banking institutions on a short-term
basis against eligible collateral of banks’ borrowers; and (d) outright sales/purchases of the BSP’s holdings
of government securities.
Policy Target
The BSP’s target for monetary policy uses the Consumer Price Index (CPI) or headline inflation rate, which
is compiled and released to the public by the National Statistics Office (NSO). The policy target is set by
the Development Budget Coordination Committee (DBCC)2 in consultation with the BSP. The inflation
target for 2017-2020 is 3.0 percent ± 1.0 ppt.3
BSP’s Explanation Clauses
These are the predefined set of acceptable circumstances under which an inflation-targeting central bank
may fail to achieve its inflation target. These clauses reflect the fact that there are limits to the
effectiveness of monetary policy and that deviations from the inflation target may sometimes occur
because of factors beyond the control of the central bank. Under the inflation targeting framework of
`the BSP, these exemptions include inflation pressures arising from: (a) volatility in the prices of
agricultural products; (b) natural calamities or events that affect a major part of the economy; (c) volatility
in the prices of oil products; and (d) significant government policy changes that directly affect prices such
as changes in the tax structure, incentives, and subsidies.
1
The TDF was introduced under the interest rate corridor system which was implemented on 3 June 2016. 2 The DBCC, created under Executive Order (E.O.) No. 232 dated 14 May 1970, is an inter-agency committee tasked primarily to
formulate the National Government's fiscal program. It is composed of the Office of the President (OP), Department of Budget
and Management (DBM), National Economic and Development Authority (NEDA), and the Department of Finance (DOF).
The BSP attends the Committee meetings as a resource agency. 3 On 20 December 2016, the DBCC set an inflation target of 3 ± 1 percentage point for 2017-2018 and approved the inflation
target of 3.0 percent ± 1.0 percentage point for 2019-2020 . These decisions were announced by the BSP to the public on
22 December 2016. During its meeting on 22 December 2017, the DBCC decided to keep the current inflation target at
3.0 percent ± 1.0 percentage point for 2018 – 2020.
The Monetary Policy of the Bangko Sentral ng Pilipinas

iii
* The Monetary Board of the BSP was comprised of the following members until 30 June 2017: Amando M. Tetangco, Jr. (Governor
and Chairman); Carlos G. Dominguez III; Alfredo C. Antonio; Felipe M. Medalla; Armando L. Suratos; Juan D. De Zuñiga, Jr.; and
Valentin A. Araneta.
** The Advisory Committee was composed of the following members until 30 June 2017: Amando M. Tetangco. Jr. (Chairman);
Diwa C. Guinigundo (Deputy Governor - Monetary Stability Sector); Nestor A. Espenilla, Jr. (Deputy Governor - Supervision and
Examination Sector); Ma. Ramona GDT Santiago (Assistant Governor - Treasury Department); and Francisco G. Dakila, Jr. (Managing
Director - Monetary Policy Sub-sector)
The Monetary Board *
The powers and functions of the BSP, such as the conduct of monetary policy and the supervision over
the banking system, are exercised by its Monetary Board, which has seven members appointed by the
President of the Philippines. The Monetary Board holds eight (8) monetary policy meetings in a year to
review and decide on the stance of monetary policy.
Chairman & Governor
Nestor A. Espenilla, Jr.
Members
Carlos G. Dominguez III
Felipe M. Medalla
Juan D. De Zuñiga, Jr.
Valentin A. Araneta
Peter B. Favila
Antonio S. Abacan, Jr.
The Advisory Committee **
The Advisory Committee was established as an integral part of the institutional setting for inflation targeting.
It is tasked to deliberate, discuss, and make recommendations on monetary policy to the Monetary Board.
Like the Monetary Board, the Committee meets eight times a year but may also meet between regular
meetings, whenever deemed necessary.
Chairman
Nestor A. Espenilla, Jr.
Governor
Members
Diwa C. Guinigundo
Deputy Governor
Monetary Stability Sector
Ma. Cyd Tuaño-Amador
Deputy Governor
Resource Management Sector
Chuchi G. Fonacier
Deputy Governor
Supervision and Examination Sector
Ma. Ramona GDT Santiago
Assistant Governor
Treasury Department
Johnny Noe E. Ravalo
Assistant Governor
Office of Systemic Risk Management
Francisco G. Dakila, Jr.
Managing Director
Monetary Policy Sub-sector

iv
Technical Staff ***
Chairman
Zeno Ronald R. Abenoja
Director, Department of Economic Research
Vice-Chairman
Jose Recon S. Tano
Director, Office of the Supervsory Policy Development
Members
Mary Jane T. Chiong
Managing Director, Office of the Governor
Veronica B. Bayangos
Director, Center for Monetary and Financial Policy
Lorelei S. Fernandez
Chief Dealer, Treasury Department
Rosabel B. Guerrero
Director, Department of Economic Statistics
Dennis D. Lapid
Deputy Director, Department of Economic Research
Dennis M. Bautista
Deputy Director, Department of Economic Research
Ma. Mediatriz M. Boelsch
Assistant Chief Dealer, Treasury Department
Thea Josefina Natalia W. Santos
Deputy Director, Supervision and Examination Sub-Sector I
Lara Romina E. Ganapin
Bank Officer V, Department of Economic Research
Cherrie F. Ramos
Bank Officer V, Department of Economic Research
Jasmin E. Dacio
Bank Officer V, Department of Economic Research
Gabrielle Roanne L. Moral
Bank Officer V, Department of Economic Research
Eduard Joseph DP Robleza
Bank Officer V, Department of Economic Research
Jan Christopher G. Ocampo
Bank Officer V, Department of Economic Research
Marites B. Oliva
Bank Officer V, Center for Monetary and Financial Policy
Alvin Joshua P. Fama
Acting Bank Officer V, Office of Systemic Risk Management
Sol Elizah T. Roxas
Bank Officer VI, Provident Fund Office
*** Assistant Governor Edna C. Villa of the Office of the Governor served as a member of the Technical Staff of the Advisory
Committee until 31 May 2017 and is currently on her secondment to the International Monetary Fund.

v
2018 SCHEDULE OF MONETARY POLICY MEETINGS, INFLATION REPORT
PRESS CONFERENCE AND PUBLICATION OF MB HIGHLIGHTS
2018
Advisory
Committee (AC)
Meeting
Monetary Board
(MB) Meeting
MB Highlights
Publication
Inflation Report
(IR) Press
Conference
Jan 11 (Thu)
(14 Dec 2017 MB meeting) 19 (Fri)
(Q4 2017 IR)
Feb 2 (Fri)
(AC Meeting No. 1) 8 (Thu)
(MB Meeting No. 1)
Mar 16 (Fri)
(AC Meeting No. 2) 22 (Thu)
(MB Meeting No. 2) 8 (Thu)
(8 Feb 2018 MB meeting)
Apr 19 (Thu)
(22 Mar 2018 MB meeting)
20 (Fri)
(Q1 2018 IR)
May 4 (Fri)
(AC Meeting No. 3) 10 (Thu)
(MB Meeting No. 3)
Jun 15 (Fri)
1
(AC Meeting No. 4) 21 (Thu)
(MB Meeting No. 4) 7 (Thu)
(10 May 2018 MB meeting)
Jul 19 (Thu)
(21 Jun 2018 MB meeting) 20 (Fri)
(Q2 2018 IR)
Aug 3 (Fri)
(AC Meeting No. 5) 9 (Thu)
(MB Meeting No. 5)
Sep 21 (Fri)
(AC Meeting No. 6) 27 (Thu)
(MB Meeting No. 6) 6 (Thu)
(9 Aug 2018 MB meeting)
Oct 25 (Thu)
(27 Sep 2018 MB meeting) 19 (Fri)
(Q3 2018 IR)
Nov 9 (Fri)
(AC Meeting No. 7) 15 (Thu)
(MB Meeting No. 7)
Dec 7 (Fri)
(AC Meeting No. 8) 13 (Thu)
(MB Meeting No. 8) 6 (Thu)
(15 Nov 2018 MB meeting)
1 15 June 2018 (Friday) may be declared a national holiday in observance of Eidul Fitr. The National Commission on Muslim
Filipinos (NCMF) shall inform the Office of the President of the actual date on which the holiday shall fall. The approximate
dates shall be determined in accordance with the Islamic calendar (Hijra) or the lunar calendar, or upon Islamic astronomical
calculations, whichever is possible or convenient.

vi
List of Acronyms, Abbreviations, and Symbols
AL
BES
Auto Loans
Business Expectations Survey
NBQBs Non-Bank Financial Institutions with
Quasi-Banking Functions
BTr
CAMPI
Bureau of the Treasury
Chamber of Automotive Manufacturers of the
Philippines, Inc.
NEDA
NEER
NNPL
National Economic and Development Authority
Nominal Effective Exchange Rate
Net Non-Performing Loan
CAR Capital Adequacy Ratio NFA Net Foreign Assets; National Food Authority
CBD Central Business District NG National Government
CES Consumer Expectations Survey NGCP National Grid Corporation of the Philippines
CDS Credit Default Swaps NPC National Power Corporation
CI Confidence Index NPI Net Primary Income
COV Coefficient of Variation NPL Non-Performing Loan
CPI
DBCC
Consumer Price Index
Development Budget Coordination Committee
OECD Organization for Economic Cooperation and
Development
DOE
DI
Department of Energy
Diffusion Index
OPEC Organization of the Petroleum Exporting
Countries
DOF Department of Finance OF Overseas Filipinos
EIA US Energy Information Administration PMI Purchasing Managers’ Index
EM
EMBIG
Emerging Market
JP Morgan Emerging Market Bond Index Global
PSA Philippine Statistical Authority;
Power Supply Agreement
ERC
FCDA
Energy Regulatory Commission
Foreign Currency Differential Adjustment
PSALM Power Sector Assets and Liabilities
Management Corporation
GDP Gross Domestic Product PSEi Philippine Stock Exchange Composite Index
GNI Gross NationaI Income RBs Rural Banks
GNPL Gross Non-Performing Loan REER Real Effective Exchange Rate
GS Government Securities ROP Republic of the Philippines
IEA International Energy Agency RP Repurchase
IMF International Monetary Fund RR Reserve Requirement
IPP Independent Power Producer RRP Reverse Repurchase
IRI International Research Institute for Climate and
Society
RWA
SDA
Risk-Weighted Asset
Special Deposit Account
LFS
LPG
Labor Force Survey
Liquefied Petroleum Gas
SEM
SME
Single-Equation Model
Small and Medium Enterprise
LTFRB Land Transportation Franchising and SOSFM Society of Fellows in Supply Management, Inc.
Regulatory Board TB Thrift Banks
MB
MEM
Monetary Board
Multi-Equation Model
TLP
U/KBs
Total Loan Portfolio
Universal and Commercial Banks
MERALCO Manila Electric Company VAPI Value of Production Index
MISSI Monthly Integrated Survey of Selected VOPI Volume of Production Index
MTP
Industries
Major Trading Partner
WESM Wholesale Electricity Spot Market

vii
Contents
Overview ................................................................................................... viii
I. Inflation and Real Sector Developments .................................................... 1
Prices ................................................................................................................................. 1
Private Sector Economists’ Inflation Forecasts. ......................................................... 2
Energy prices. ............................................................................................................ 4
Aggregate Demand and Supply ........................................................................................ 5
Aggregate Demand. ................................................................................................... 6
Other Demand Indicators. ......................................................................................... 7
Aggregate Supply. .................................................................................................... 14
Labor Market Conditions ................................................................................................ 15
II. Monetary and Financial Market Conditions .............................................. 17
Domestic Liquidity .......................................................................................................... 17
Monetary Operations ..................................................................................................... 18
Credit Conditions ............................................................................................................ 18
Interest Rates .................................................................................................................. 20
Financial Market Conditions ........................................................................................... 22
Banking System ............................................................................................................... 24
Exchange Rate ................................................................................................................. 26
III. Fiscal Developments ............................................................................... 29
IV. External Developments .......................................................................... 30
V. Monetary Policy Developments ............................................................... 33
VI. Inflation Outlook .................................................................................... 34
BSP Inflation Forecasts.................................................................................................... 34
Risks to the Inflation Outlook ......................................................................................... 36
Implications for the Monetary Policy Stance .................................................................. 37
Summary of Monetary Policy Decisions ....................................................... 38

viii
Overview
Headline inflation increase slightly. Average
headline inflation in Q4 2017 was higher at
3.3 percent from the quarter- and year-ago rates
of 3.1 percent and 2.5 percent, respectively. This
brought the full year average inflation to
3.2 percent, well within the target range of
3.0 percent ± 1.0 percentage point for 2017.
Inflation pressures during the review quarter were
traced mainly to upward adjustments in prices of
domestic petroleum products as well as higher
price increases in selected services. Meanwhile,
core inflation remained steady at 3.1 percent.
Based on alternative measures of core inflation,
the weighted median measure was unchanged at
1.8 percent while trimmed mean and net of
volatile items measures were slightly higher at
2.5 percent (from 2.3 percent) and 2.7 percent
(from 2.4 percent), respectively. In terms of the
number of items with inflation rates greater than
the threshold of 4.0 percent (the upper end of the
2017 inflation target range), there was a marginal
increase to 25 items (accounting for 23.2 percent
of the CPI basket) in Q4 2017 from 24 items in the
previous quarter. Majority of these items were
non-food commodities.
Inflation expectations rise but remain within the
range target. The BSP’s survey of private sector
economists for December 2017 showed that mean
inflation forecasts for 2017 to 2019 were higher
relative to the results in September 2017. Mean
inflation forecast for 2017 increased to 3.2 percent
(from 3.1 percent) on higher crude oil prices and
holiday spending, among others. For 2018 and
2019, mean inflation forecasts rose to 3.6 percent
(from 3.4 percent) and 3.5 percent (from
3.4 percent), respectively. Analysts attributed the
higher 2018 forecast on the impact of the
implementation of the National Government’s tax
reform program. On the other hand, results of the
June 2017 Consensus Economics inflation forecast
survey showed higher mean inflation forecasts for
2017 and 2018. Respondents expect 2017 inflation
to settle at 3.3 percent, from 3.2 percent in the
March survey. Likewise, the mean inflation
forecast for 2018 increased to 3.4 percent from
3.3 percent in the previous survey.
Domestic economy stays firm. Third quarter GDP
expanded by 6.9 percent, higher than the
6.7-percent growth a quarter ago but lower than
the 7.1-percent acceleration a year ago. This
brought the year-to-date GDP to 6.7 percent which
remains within the National Government’s target
of 6.5-7.5 percent for 2017. On the expenditure
side, GDP was supported by domestic spending,
i.e., household and government, as well as the
recovery in external demand. On the production
side, the strong performance of industry and
services sectors, which offset the moderation in
agriculture, propped up domestic growth.
Q4 inflation slightly above
midpoint, remains within 2017
target range
Higher-frequency demand indicators show firm
economic prospects in the near term.Vehicle sales
accelerated at double-digit rates during the review
quarter. Similarly, energy sales continued to grow.
The composite Purchasing Managers’ Index
as of November 2017 remained firmly above the
50-point expansion threshold, indicating sustained
strong economic activity ahead. For the results of
the BSP’s expectations survey, business confidence
improved for Q4 but turned circumspect for the
quarter ahead due mainly to post-holiday
slowdown in demand. Meanwhile, consumer
optimism remained broadly steady for Q4, on
availability of jobs, and well into the next quarter.
Global economic activity improves further.
The JP Morgan Global All-Industry Output Index
rose to 54.4 in December as output growth
accelerated in both the manufacturing and service
sectors, underpinned by a notable increase in new
business. The upbeat outlook is mirrored in the
brisker growth among key advanced economies.
In the US, Q3 real GDP expanded by 2.3 percent
as inflation fell to 2.1 percent in December due
primarily to the decrease in the gasoline price
index. Moreover, manufacturing PMI for
December was at 59.7 on gains in new orders.
Similarly in the euro area, Q3 GDP growth was
faster at 2.6 percent with inflation in December
expected at 1.4 percent due to lower energy price
index. The euro area composite PMI increased to
58.1 in December on domestic demand and export
orders. Japan’s Q3 GDP likewise expanded by
2.1 percent as inflation in November was at
0.6 percent. Manufacturing PMI rose to 54.2 in
December, due to faster growth in new orders.

ix
Domestic financial system shows strength during
the review quarter. Positive outturns on the
domestic front such as the strong Q3 GDP,
legislative support for the tax reform program and
the recent credit rating upgrade resulted in upbeat
investor sentiment on Philippine assets. The
Philippine stock exchange index rose by
4.2 percent, quarter-on-quarter, to average
8,354.1 index points during the review quarter.
Debt spreads narrowed generally while sovereign
credit default swaps remained low relative to
regional peers. However, the peso continued to
depreciate, averaging P50.93/US$1 on a quarter-
on-quarter basis due mainly to expectations of
firmer GDP in the US. Nonetheless, investor
demand for government securities remained
healthy as evidenced by oversubscriptions to the
Bureau of the Treasury’s regular auctions as well
as its issuance of the P255-billion Retail Treasury
Bonds in December. In addition, the banking
system saw continued increase in assets, lending,
and deposits, while capital adequacy ratios
remained comfortably above the BSP’s prescribed
levels and international norms. At the same time,
based on the latest round of the BSP survey on
senior bank loan officers, bank lending standards
for loans to both enterprises and households were
broadly unchanged in Q4 2017, indicating stable
supply of credit.
.
Monetary policy settings were maintained in
Q4 2017. The BSP decided to maintain its policy
interest rate at 3.0 percent at the November and
December monetary policy meetings. Reserve
requirement ratios were likewise kept steady.
The BSP’s decision to keep the policy rate steady
was based on the assessment that the inflation
environment has been broadly unchanged as
inflation expectations continue to be firmly
anchored to the target over the policy horizon.
Prospects for domestic economic activity are likely
to remain firm owing to buoyant consumer and
business sentiment, as reflected in high-frequency
demand indicators. At the same time, commodity
prices are expected to be manageable, reflecting
ample supply conditions. Moreover, prevailing
credit and liquidity conditions remain in line with
the overall requirements of the economy.
Prevailing monetary policy
stance remains appropriate
Prevailing monetary policy settings are seen to
be appropriate to the latest outlook. The current
setting of monetary policy can be deemed
appropriate for the time being given prevailing
conditions for inflation as well as output. Latest
baseline inflation projection path tracks the
midpoint of the target range in 2018-2019 due
mainly to the rise in global crude oil prices.
Inflation dynamics remain manageable given
well-contained inflation expectations over the
policy horizon. Inflation expectations – based on
forecast surveys of private sector economists by
the BSP – continue to be within target over
2018-2019. Moreover, output conditions are
expected to remain positive due to sustained
domestic activity and the recovery of external
demand.
Meanwhile, the balance of risks to the inflation
outlook remains tilted toward the upside which
argues for maintaining vigilance in setting the
stance of monetary policy going forward. Price
pressures could initially develop with the eventual
implementation of the tax reform program in
2018. Although movements in food and oil prices,
and changes in tax rates form part of the BSP's
explanation clauses under inflation targeting, the
BSP will watch closely for indications of increasing
underlying inflationary pressures and risks of
second-round effects in the near term.

Q3 2017 Inflation Report | | | | 1111
I. Inflation and Real Sector Developments
Prices
Headline inflation rise slightly. Headline inflation
for Q4 2017 increased to 3.3 percent4 from the
quarter- and year-ago rates of 3.1 percent and
2.5 percent, respectively. This brought the full
year average inflation to 3.2 percent, well within
the National Government’s (NG) announced target
range of 3.0 percent ± 1.0 percentage point (ppt)
for 2017.
Headline inflation slightly
above midpoint of target
range
Inflation pressures in Q4 2017 were traced mainly
to upward adjustments in prices of domestic
petroleum products as well as higher price
increases in selected services.
Chart 1. Quarterly Headline Inflation (2006=100)
in percent
0
1
2
3
4
5
6
Q1
2013
Q2 Q3 Q4 Q1
2014
Q2 Q3 Q4 Q1
2015
Q2 Q3 Q4 Q1
2016
Q2 Q3 Q4 Q1
2017
Q2 Q3 Q4
Food
Non-Food
Non-Alcoholic Beverages
Alcoholic Beverages and Tobacco
Headline Inflation
Source: Philipine Statistical Authority (PSA), BSP
Core Inflation. Core inflation, which measures
generalized price pressures by excluding volatile
items such as food and energy, was steady
at 3.1 percent in Q4 2017. In terms of the
BSP-computed alternative measures for core
inflation, the weighted median measure was
likewise unchanged at 1.8 percent. Meanwhile,
trimmed mean and net of volatile items measures
of core inflation were slightly higher at 2.5 percent
(from 2.3 percent) and 2.7 percent (from
2.4 percent), respectively.
4 It should be noted that prices for Marawi City were imputed
using data from sample municipalities of Lanao del Sur for
comparability.
Table 1. Alternative Core Inflation Measures
quarterly averages of year-on-year change
Quarter
Official
Headline
Inflation
Official Core
Inflation
Trimmed
Mean 1
Weighted
Median 2
Net of
Volatile
Items 3
2014 4.1 3.0 3.5 2.9 2.6
Q1 4.1 3.0 3.3 2.6 2.8
Q2 4.4 3.0 3.6 3.2 2.6
Q3 4.7 3.3 3.8 3.1 2.8
Q4 3.6 2.7 3.3 2.7 2.4
2015 1.4 2.1 1.9 1.9 1.8
Q1 2.5 2.5 3.0 3.0 2.3
Q2 1.7 2.2 2.1 2.2 1.9
Q3 0.6 1.6 1.3 1.2 1.5
Q4 1.0 1.8 1.3 1.3 1.5
2016 1.8 1.9 1.6 1.8 1.6
Q1 1.1 1.6 1.2 1.3 1.3
Q2 1.5 1.7 1.5 1.7 1.3
Q3 2.0 2.0 1.8 2.1 1.7
Q4 2.5 2.5 1.9 1.9 2.0
2017 3.2 2.9 2.4 1.9 2.4
Q1 3.2 2.7 2.2 1.9 2.2
Q2 3.1 2.9 2.4 1.9 2.2
Q3 3.1 3.1 2.3 1.8 2.4
Q4 3.3 3.1 2.5 1.8 2.71
The trimmed mean repres ents the average i nfl ati on rate of the (weighted) mi ddl e 70 percent
i n a l owest-to-hi ghes t ranking of year-on-year inflation rates for a l l CPI components .2
The weighted median repres ents the middl e inflation rate (corres pondi ng to a cumul ati ve CPI
wei ght of 50 percent) in a lowes t-to-highest ranki ng of year-on-year i nfl ati on rates .3
The net of volati l e i tems method excludes the fol lowi ng i tems: bread and cerea l s, meat, fis h,
frui t, vegetabl es, gas , s ol i d fuel s , fuels and l ubricants for pers ona l trans port equi pment, and
pas s enger transport by road, whi ch repres ents 39.0 percent of a l l i tems. The s eri es has been
recomputed usi ng a new methodol ogy that is a l igned with PSA's method of computi ng the
offi ci a l core inflation, which re-weights remaini ng items to compris e 100 percent of the core
bas ket a fter excl udi ng non-core i tems . The previous methodol ogy reta i ned the wei ghts of
volati l e i tems i n the CPI basket whi l e keepi ng thei r indices cons tant at 100.0 from month to month.
Source: PSA, BSP es timates
The number of items with inflation rates greater
than the threshold of 4.0 percent (the upper end
of the 2017 inflation target) increased slightly to
25 items in Q4 2017 from 24 items in the previous
quarter. Majority of these items were non-food
commodities. Collectively, these items accounted
for 23.2 percent of the CPI basket, slightly higher
than the quarter-ago share of 22.3 percent.
Chart 2. CPI Items with Inflation Rates
Above Threshold
0
10
20
30
40
50
60
0
5
10
15
20
25
30
35
Q1
20
13
Q2
Q3
Q4
Q1
20
14
Q2
Q3
Q4
Q1
20
15
Q2
Q3
Q4
Q1
20
16
Q2
Q3
Q4
Q1
20
17
Q2
Q3
Q4
Cumulative weight in % (LHS) No. of Items Above Threshold (RHS)
Source: Philippine Statistics Authority, BSP staff estimates

Q4 2017 Inflation Report | | | | 2222
Food Inflation. Food inflation was steady in
Q4 2017. Prices of selected agricultural products
such as, corn, meat, and fish went up as recent
weather disturbances that hit the country
continued to adversely impact domestic supply.
At the same time, the higher demand during the
holiday season also further contributed to the
price increase.
Prices of major food items
remain steady during the
quarter
Nevertheless, these factors were counterbalanced
by slower price adjustments for rice, milk, cheese,
and eggs as well as fruit and vegetables. It should
also be noted that the year-on-year (y-o-y)
inflation of sugar, jam, and honey remained
negative for the third consecutive quarter in
Q4 2017. Meanwhile, alcoholic beverages and
tobacco increased to 6.5 percent in Q4 2017 from
6.3 percent in Q3 2017.
Table 2. Inflation Rates for Selected Food Items quarterly averages in percent (2006=100)
Q1 Q2 Q3 Q4 Q1 Q2 Q3 Q4
Food and Non-Alcoholic Beverages 1.6 2.3 2.7 3.5 3.8 3.8 3.5 3.4
Food 1.6 2.4 2.8 3.6 4.0 3.9 3.5 3.5
Bread and Cereals -1.2 -0.2 0.9 1.5 1.8 2.0 1.6 1.4
Rice -2.0 -0.9 0.5 1.4 2.0 2.3 1.7 1.1
Corn 1.7 2.6 2.5 1.9 0.7 -0.4 0.8 5.4
Meat 1.0 2.2 2.0 1.6 2.4 4.5 4.0 5.3
Fish 2.8 2.7 4.3 4.9 6.9 8.2 9.2 9.8
Milk, Cheese and Eggs 1.2 1.5 2.0 2.2 2.4 2.4 2.1 1.8
Oils and Fats 0.3 2.1 3.9 4.6 6.1 6.7 5.8 5.7
Fruit 3.3 4.4 7.0 9.2 7.9 7.2 6.0 4.1
Vegetables 10.3 12.9 9.9 11.7 10.6 4.4 2.5 0.7
Sugar, Jam, Honey 6.4 5.0 3.4 3.0 1.1 -1.5 -2.6 -3.2
Food Products, N.E.C. 3.1 -1.0 -2.4 -0.1 1.2 0.2 0.6 1.1
Non-Alcoholic Beverages 1.2 1.2 1.2 1.3 1.2 1.1 1.1 1.0
Alcoholic Beverages and Tobacco 4.9 5.5 6.0 6.3 6.0 6.2 6.3 6.5
20172016
Source of Bas ic Data: PSA, BSP
Commodity
Non-Food Inflation. Inflation for non-food went up
during the quarter at 3.1 percent from
2.7 percent in Q3 2017 owing to price hikes of
domestic petroleum products, largely influenced
by rising imported crude oil prices. Electricity
prices went up in Q4 2017 with higher cost of
power from the Wholesale Electricity Spot Market
(WESM). Likewise, inflation for services also
accelerated in particular, postal and catering
services.
Price hikes in petroleum
products contribute to
non-food inflation
Table 3. Inflation Rates for Selected
Non-Food Items quarterly averages in percent (2006=100)
Q1 Q2 Q3 Q4 Q1 Q2 Q3 Q4
Non-Food 0.5 0.6 1.2 1.5 2.4 2.4 2.7 3.1
Clothing and Footwear 1.9 2.3 2.6 2.6 2.8 2.3 2.0 1.8
Housing, Water, Electricity,
Gas and Other Fuels -1.0 -1.0 0.2 1.2 2.9 3.1 2.9 3.9
Electricty, Gas, and Other Fuels -7.0 -6.8 -3.2 -0.2 6.0 6.8 5.5 9.1
Furnishings, Household Equipment
& Routine Maintenance of the House 1.5 1.6 2.1 2.4 2.3 2.3 1.9 1.8
Health 1.9 2.4 2.7 2.6 2.6 2.4 2.4 2.2
Transport 0.3 0.0 0.0 0.9 2.7 2.8 4.3 3.6
Transport Services 1.2 0.7 0.3 0.7 1.5 2.6 4.4 3.0
Communication 0.1 0.2 0.1 0.1 0.2 0.2 0.3 0.4
Recreation and Culture 1.1 1.6 1.7 1.7 1.8 1.4 1.4 1.5
Education 3.6 3.0 1.8 1.8 1.8 1.9 2.3 2.2
Restaurant and Miscellaneous
Goods and Services 1.6 2.2 2.4 2.2 2.1 1.6 2.2 2.8
2016
Source of Bas ic Data: PSA, BSP
Commodity2017
Private Sector Economists’ Inflation Forecasts.
Results of the BSP’s survey of private sector
economists for December 2017 showed that mean
inflation forecasts for 2017 to 2019 were higher
relative to the results in September 2017.5
Mean inflation forecasts for
2017 to 2019 are higher
In particular, the mean inflation forecast for 2017
increased to 3.2 percent from 3.1 percent in the
September 2017 survey, which analysts attributed
to higher crude oil prices, robust consumer
spending during the holiday season, rise in utility
rates, and adverse weather conditions that
affected the supply of some seafood items.
5 There were 28 respondents in the BSP’s survey of private
sector economists in December 2017. The survey was
conducted from 7 to 27 December 2017.

Q4 2017 Inflation Report | | | | 3333
Chart 3. BSP Private Sector Economists’ Survey
mean forecast for full year; in percent
1
2
3
4
5
Jan
20
15
Fe
bM
ar
Ap
rM
ay
Jun
Jul
Au
gS
ep
Oct
No
vD
ec
Jan
20
16
Fe
bM
ar
Ap
rM
ay
Jun
Jul
Au
gS
ep
Oct
No
vD
ec
Jan
20
17
Fe
bM
ar
Ap
rM
ay
Jun
Jul
Au
gS
ep
Oct
No
vD
ec
2017 2018 2019 Target Range
Source: BSP
3.2 3.6 3.5
Likewise, mean inflation forecast for 2018 and
2019 rose to 3.6 percent (from 3.4 percent in the
September 2017 survey) and 3.5 percent (from
3.4 percent), respectively. For 2018, analysts noted
possible upside risks to inflation such as the
implementation of the government’s tax reform
program (i.e., Tax Reform for Acceleration and
Inclusion), volatile global oil prices, weakening
peso, rise in utility rates and food prices, higher
transport fare, and higher government spending.
On the other hand, a key downside risk to inflation
was seen to emanate from global economic
slowdown due to some geopolitical tensions in the
Middle East, as well as in Korea; the slower growth
of China’s economy; the risk of recession and
deflation in Japan and the Euro zone.
Based on the probability distribution of the
forecasts provided by 23 out of 28 respondents,
there was a 96.5 percent probability that average
inflation for 2017 will settle between the
2-4 percent range. For 2018, the respondents
assigned an 81.4 percent probability that inflation
will fall within the 2-4 percent target range.
Chart 4. Probability Distribution
for Analysts’ Inflation Forecasts* 2017-2019
0
10
20
30
40
50
60
70
80
90
100
<1 1.0 – 1.99 2.0 – 3.0 3.1 – 4.0 4.1 – 5.0 5.1 – 6.0 6.1 – 7.0
2017 2018 2019
*Probability distributions were averages of those provided by 23 out of 28 respondents. Source: BSP Survey
Results of the June 2017 Consensus Economics
inflation forecast survey for the Philippines
showed higher mean inflation forecasts for 2017
and 2018. Respondents expect 2017 inflation to
settle at 3.3 percent, higher than the March 2017
survey’s mean forecast of 3.2 percent.6 Likewise,
respondents’ mean inflation forecast for 2018
increased to 3.4 percent from 3.3 percent in the
March 2017 survey.
Table 4. Private Sector Forecasts for Inflation,
December 2017
annual percentage change 2019
FY Q1 Q2 FY FY
1) Al-Amanah Islamic Bank 3.40 3.10 3.40 3.50 3.30
2) ANZ 3.10 3.90 4.10 4.20 3.80
3) Asia ING 3.20 3.60 3.80 3.70 3.60
4) Banco De Oro 3.20 3.02 3.42 3.40 3.30
5) Bangkok Bank 3.30 3.50 3.60 3.60 3.70
6) Bank of Commerce 3.18 - - - -
7) Bank of China Ltd. 3.20 3.50 3.60 3.60 3.60
8) Barclays 3.20 3.00 3.20 3.10 3.20
9) Citibank 3.10 3.30 3.90 3.60 3.20
10) Chinabank 3.40 3.20 3.30 3.30 3.30
11) CTBC Bank 3.20 3.50 3.30 3.60 4.00
12) Deutsche Bank 3.20 - - 3.40 -
13) Eastwest Bank 3.20 3.50 3.60 3.60 3.50
14) Korea Exchange Bank 3.05 3.45 3.45 3.45 3.45
15) Land Bank of the Phils 2.90 - 3.20 3.20 - 3.50 3.30 - 3.60 3.40 - 3.70 3.40 - 3.70
16) Maybank 3.10 3.14 3.20 3.28 3.45
17) Maybank-ATR KimEng 3.20 3.60 3.80 3.60 3.40
18) Metrobank 3.20 - - 3.80 3.50
19) Multinational Inv. Banc 3.16 3.20 3.40 3.50 -
20) Mizuho 3.20 3.20 3.30 3.30 -
21) Nomura 3.20 4.30 4.50 4.30 3.10
22) RCBC 3.10 - 3.30 3.10 - 3.60 3.70 - 4.20 3.60 - 4.10 3.50 - 4.00
23) Robinsons Bank 3.50 3.30 3.40 3.50 2.50
24) Philippine Equity Partners 3.18 3.38 3.87 3.81 3.53
25) Security Bank 3.20 3.50 3.50 3.60 3.60
26) Standard Chartered 3.20 3.20 3.60 3.50 3.20
27) Union Bank of the Phils. 3.20 3.60 3.80 3.80 4.00
28) UBS 3.30 3.20 3.60 3.80 3.40
Median Forecast 3.2 3.4 3.6 3.6 3.5
Mean Forecast 3.2 3.4 3.6 3.6 3.5
High 3.5 4.3 4.5 4.3 4.0
Low 3.1 3.0 3.2 3.1 2.5
Number of Observations 28 25 25 27 24
Government Target 3.0±1.00 3.0±1.00 3.0±1.00 3.0±1.00 3.0±1.00
2017
Source: BSP
2018
Based on the Q4 2017 BSP Business Expectations
Survey (BES), a higher number of respondents
expected inflation to increase in the current
quarter relative to the previous quarter (from a
diffusion index of 35.9 percent to 50.1 percent).
Inflation expectations close to
the midpoint of the target
By contrast, the number of respondents that
expect inflation to increase in the next quarter
decreased (from 42.3 percent to 31.9 percent).
6 There were 18 respondents in the Consensus Economics’
survey in June 2017.
Q4 2017 Inflation Report | | | | 4444
Meanwhile, results of the BSP Consumer
Expectations Survey (CES) for Q4 2017 indicated
that consumers expect higher inflation over the
next 12 months at 3.6 percent from 3.2 percent
in the Q3 2017 survey. A higher number of
respondents (from the previous survey) expect
inflation to rise but remain within the
government’s target range of 2-4 percent in
the next 12 months, which is indicative of strong
inflationary expectations.
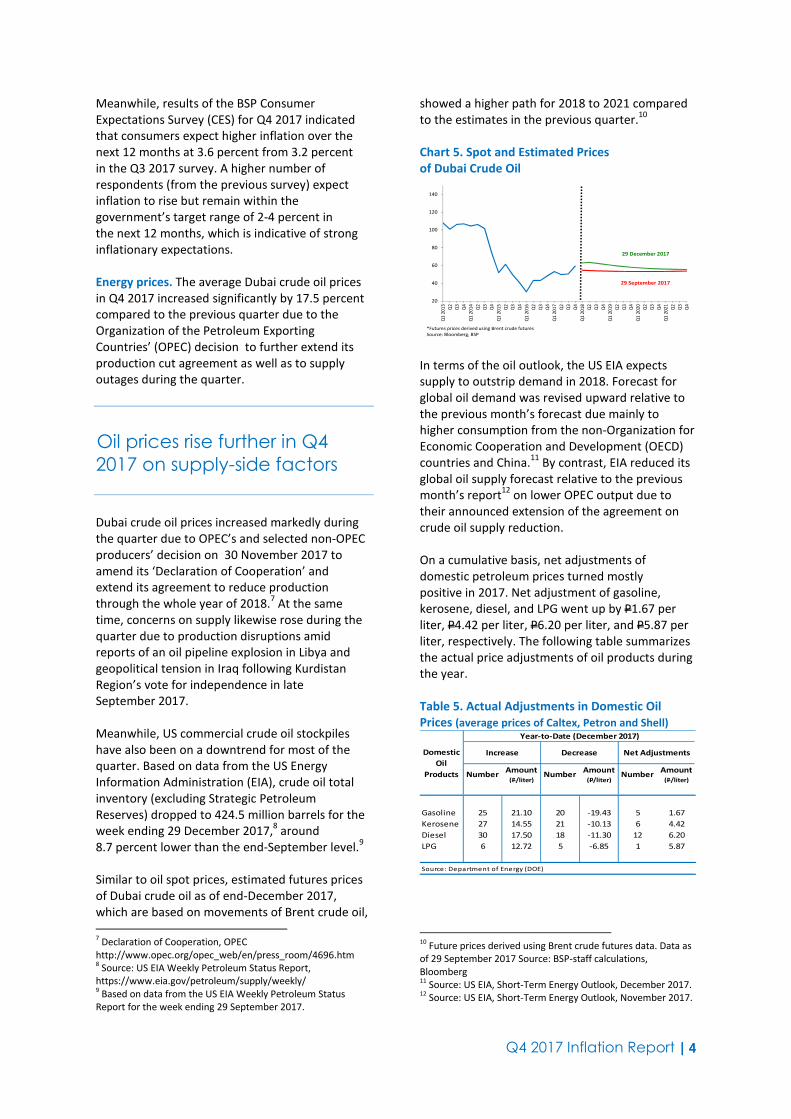
Energy prices. The average Dubai crude oil prices
in Q4 2017 increased significantly by 17.5 percent
compared to the previous quarter due to the
Organization of the Petroleum Exporting
Countries’ (OPEC) decision to further extend its
production cut agreement as well as to supply
outages during the quarter.
Oil prices rise further in Q4
2017 on supply-side factors
Dubai crude oil prices increased markedly during
the quarter due to OPEC’s and selected non-OPEC
producers’ decision on 30 November 2017 to
amend its ‘Declaration of Cooperation’ and
extend its agreement to reduce production
through the whole year of 2018.7 At the same
time, concerns on supply likewise rose during the
quarter due to production disruptions amid
reports of an oil pipeline explosion in Libya and
geopolitical tension in Iraq following Kurdistan
Region’s vote for independence in late
September 2017.
Meanwhile, US commercial crude oil stockpiles
have also been on a downtrend for most of the
quarter. Based on data from the US Energy
Information Administration (EIA), crude oil total
inventory (excluding Strategic Petroleum
Reserves) dropped to 424.5 million barrels for the
week ending 29 December 2017,8 around
8.7 percent lower than the end-September level.9
Similar to oil spot prices, estimated futures prices
of Dubai crude oil as of end-December 2017,
which are based on movements of Brent crude oil,
7 Declaration of Cooperation, OPEC
http://www.opec.org/opec_web/en/press_room/4696.htm 8 Source: US EIA Weekly Petroleum Status Report,
https://www.eia.gov/petroleum/supply/weekly/ 9 Based on data from the US EIA Weekly Petroleum Status
Report for the week ending 29 September 2017.
showed a higher path for 2018 to 2021 compared
to the estimates in the previous quarter.10
Chart 5. Spot and Estimated Prices
of Dubai Crude Oil
20
40
60
80
100
120
140
Q1
20
13
Q2
Q3
Q4
Q1
20
14
Q2
Q3
Q4
Q1
20
15
Q2
Q3
Q4
Q1
20
16
Q2
Q3
Q4
Q1
20
17
Q2
Q3
Q4
Q1
20
18
Q2
Q3
Q4
Q1
20
19
Q2
Q3
Q4
Q1
20
20
Q2
Q3
Q4
Q1
20
21
Q2
Q3
Q4
*Futures prices derived using Brent crude futures
Source: Bloomberg, BSP
29 December 2017
29 September 2017
In terms of the oil outlook, the US EIA expects
supply to outstrip demand in 2018. Forecast for
global oil demand was revised upward relative to
the previous month’s forecast due mainly to
higher consumption from the non-Organization for
Economic Cooperation and Development (OECD)
countries and China.11
By contrast, EIA reduced its
global oil supply forecast relative to the previous
month’s report12
on lower OPEC output due to
their announced extension of the agreement on
crude oil supply reduction.
On a cumulative basis, net adjustments of
domestic petroleum prices turned mostly
positive in 2017. Net adjustment of gasoline,
kerosene, diesel, and LPG went up by P1.67 per
liter, P4.42 per liter, P6.20 per liter, and P5.87 per
liter, respectively. The following table summarizes
the actual price adjustments of oil products during
the year.
Table 5. Actual Adjustments in Domestic Oil
Prices (average prices of Caltex, Petron and Shell)
NumberAmount
(P/liter)Number
Amount
(P/liter)Number
Amount
(P/liter)
Gasoline 25 21.10 20 -19.43 5 1.67
Kerosene 27 14.55 21 -10.13 6 4.42
Diesel 30 17.50 18 -11.30 12 6.20
LPG 6 12.72 5 -6.85 1 5.87
Source: Department of Energy (DOE)
Domestic
Oil
Products
Year-to-Date (December 2017)
Increase Decrease Net Adjustments
10
Future prices derived using Brent crude futures data. Data as
of 29 September 2017 Source: BSP-staff calculations,
Bloomberg 11
Source: US EIA, Short-Term Energy Outlook, December 2017. 12
Source: US EIA, Short-Term Energy Outlook, November 2017.

Q4 2017 Inflation Report | | | | 5555
Power. Overall electricity rates in the Meralco
franchise area increased in Q4 2017 due to higher
generation costs. For Q4 2017, the average
generation charge went up by P0.59 per kilowatt
hour (kWh) to P4.73 per kWh from P4.15 per kWh
in Q3 2017.
Higher generation rates lead
to upward adjustment in retail
electricity prices
The upward adjustment in the generation cost in
Q4 2017 was due primarily to the completion of
the installment of the refund of over-recovery on
pass-through charges (about P6.9 billion) in
August 2017, which reduced the generation cost
for September relative to October’s. At the same
time, the higher charges of power from the
Wholesale Electricity Spot Market (WESM),
Independent Power Producers (IPPs) and Power
Supply Agreements (PSA), due mainly to the peso
depreciation coupled with lower plant dispatch,
placed an upward pressure on generation charges.
Chart 6. Meralco’s Generation Charge
PhP/kWh; year-on-year growth rates in percent
-40
-30
-20
-10
0
10
20
30
40
50
0
1
2
3
4
5
6
7
8
9
Q1
2013
Q2 Q3 Q4 Q1
2014
Q2 Q3 Q4 Q1
2015
Q2 Q3 Q4 Q1
2016
Q2 Q3 Q4 Q1
2017
Q2 Q3 Q4
Generation Charge (PhP/kWh) (LHS)
Generation Charge (year-on-year growth rates in percent) (RHS)
Source: Meralco
Meanwhile, there are potential sources of upside
pressures on electricity charges. Meralco has
existing petitions for rate increases with ERC which
include the petition to implement the Maximum
Average Price for 2012, 2013, 2014, and 2015,
amended application for a rate increase in the
January 2014 billing (consisting of incremental fuel
costs and deferred generation cost to be collected
monthly for six months); and petitions for the
refund of generation over/under recovery (GOUR),
transmission over/under recovery (TOUR), system
loss over/under recovery (SLOUR), and lifeline
subsidy over/under recovery (LSOUR) for the
period January-December 2011. In addition, the
Power Sector Assets and Liabilities Management
(PSALM) has several pending petitions with ERC
for the recovery of True-Up Adjustments of Fuel
and Purchased Power Costs (TAFPPC), Foreign
Exchange Related Costs (TAFxA) and Purchased
Power Costs and Foreign Exchange Related Costs
by the National Power Corporation (NPC), and
NPC’s Stranded Debt portion of the universal
charge. Likewise, the National Grid Corporation of
the Philippines (NGCP) also filed several petitions
to recover connection charges and residual
sub-transmission charges for 2011-2013 and
the costs of repair on damages caused by force
majeure events such as earthquake, flooding,
landslides, and lightning incidents in 2011-2012.
Aggregate Demand and Supply
The Philippine economy grew by 6.9 percent y-o-y
in Q3 2017, higher than the 6.7-percent expansion
in the previous quarter but lower than the
7.1-percent growth in the same period last year.
Robust outturns for Q3 GDP
On the expenditure side, GDP expanded on the
back of government spending as well as the
sustained double-digit growth of total exports,
which offset the slowdown in private consumption
and fixed capital investment. On the production
side, the faster growth in GDP was due to the
strong performance in the industry and services
sectors, offsetting the slower growth in
agriculture.
Gross national income (GNI) accelerated by
6.7 percent in Q3 2017, slightly lower than the
quarter-ago’s growth of 6.8 percent but higher
than the 6.6-percent increase in Q3 2016. Net
primary income grew by 5.7 percent in Q3 2017,
lower than the 7.0-percent growth in the previous
quarter but higher than 4.1-percent in Q3 2016.
This can be attributed to the slowdown in the
growth of property income.

Q4 2017 Inflation Report | | | | 6666
Chart 7. Gross Domestic Product (GDP)
and Gross National Income (GNI) at constant prices
2
4
6
8
10
Q1
20
13
Q2
Q3
Q4
Q1
20
14
Q2
Q3
Q4
Q1
20
15
Q2
Q3
Q4
Q1
20
16
Q2
Q3
Q4
Q1
20
17
Q2
Q3
GDP GNI
Source: PSA
Aggregate Demand. On the expenditure side,
household and government spending as well as
investments contributed 3 percentage points
(ppts), 0.9 ppt, and 1.8 ppts, respectively, to total
GDP growth. The 10.1-ppt contribution of exports
outweighed the slowdown of imports (8.9 ppt)
resulting in the 1.2-ppt contribution of net exports.
Higher household spending
due to lower unemployment
rate in Q3
Household expenditure, which accounted for
66.7 percent of total GDP, rose by 4.5 percent
in Q3 2017, albeit lower than the 5.9-percent
growth a quarter ago and the 7.2-percent
increase in the same period last year. The slower
quarter-on-quarter (q-o-q) expansion was due to
the contraction in consumption of alcoholic
beverages and tobacco, and clothing and footwear
and the decelerated growth in spending on food
and non-alcoholic beverages, housing, water,
electricity, gas and other fuels, health, transport,
restaurants and hotels and miscellaneous goods
and services. Meanwhile, growth in expenditures
on furnishings, household equipment and routine,
communication, recreation and culture, and
education propped up household expenditure. The
firm growth in household spending can also be
attributed to the following factors: (a) lower
unemployment rate in Q3 2017 at 5.6 percent
from 5.7 percent in Q2 2017, (b) additional
income from Christmas bonuses, and (c) stable
inflation rate at 3.5 percent in Q3 2017 from
3.4 percent in Q2 2017.
Chart 8. Gross Domestic Product by Expenditure
Shares at constant prices
-10
0
10
20
30
40
50
60
Q1
2013
Q2 Q3 Q4 Q1
2014
Q2 Q3 Q4 Q1
2015
Q2 Q3 Q4 Q1
2016
Q2 Q3 Q4 Q1
2017
Q2 Q3
HH Consumption Govt Spending Capital Formation
Source: PSA
4.5 pct 8.3 pct 6.6 pct
Growth in capital formation decelerated to
6.6 percent in Q3 2017 from 8.5 percent in
Q2 2017 due to the slower growth in fixed
capital investments (7.1 percent in Q3 2017
from 9.4 percent a quarter ago) and higher
withdrawals in inventories in Q3 2017 at
P16.4 billion from P12.9 billion in the same
period last year.
The q-o-q slowdown in fixed capital investments
was attributed to the following:
- decelerated growth in construction spending
(2.8 percent in Q3 2017 from 7.6 percent) as
growth in private construction, which
accounted for 79.9 percent of the total
construction investment, decelerated to
0.6 percent from 5.1 percent a quarter ago
and 18.5 percent a year ago;
- slightly lower growth of investments in
durable equipment (8.3 percent in Q3 2017
from 8.8 percent) as growth of investments
in road vehicles, which accounted for
55.7 percent of durable equipment, dropped
to 7.9 percent from 13.8 percent; and
- lower growth in breeding stock and orchard
development and intellectual property
products.
Meanwhile, government infrastructure spending
improved with public construction expanding by
12.6 percent in Q3 2017, slightly higher than the
12.1-percent growth in the previous quarter.
The main drivers of capital formation growth were
the following: durable equipment (contributing
4.8 ppts) and public construction (contributing
2.3 ppts).
Government expenditures increased by
8.3 percent in Q3 2017 (from 7.1 percent in the
previous quarter) following the disbursement
for social protection programs, the filling up of

Q4 2017 Inflation Report | | | | 7777
government positions, and the implementation
of the second tranche of the salary adjustment
based on Executive Order No. 201, series of 2016,
which increases the base pay of civilian, military,
and uniformed personnel.
Table 6. Gross Domestic Product by Expenditure
Shares
at constant 2000 prices; growth rate in percent
Q1 Q2 Q3 Q4 Q1 Q2 Q3
Household Consumption 7.1 7.5 7.2 6.2 5.8 5.9 4.5
Government Consumption 11.8 13.5 3.1 4.5 0.1 7.1 8.3
Capital Formation 31.5 30.3 21.7 14.7 10.6 8.5 6.6
Fixed Capital Formation 28.3 30.3 25.4 18.5 14.7 9.4 7.1
Exports 10.2 10.6 9.0 13.4 20.3 20.4 17.2
Imports 21.1 25.4 13.3 15.4 18.6 18.7 13.9
BY EXPENDITURE ITEM2016 2017
Source: PSA Overall exports grew by 17.2 percent in Q3 2017,
lower than the 20.4-percent growth a quarter ago.
The slowdown in growth of exports of goods
(17.4 percent from 23.5 percent) was outweighed
by the acceleration in exports of services
(16 percent from 11 percent a quarter ago).
The lower growth in exports of goods was due
primarily to the decline in growth of exports of
ignition wiring sets (7 percent from 27.9 percent),
and other export goods (6.2 percent from
20.2 percent). Meanwhile, the sustained growth
in exports of services was driven mainly by the
expansion of exports of miscellaneous services13
(9 percent from 7.3 percent) and transportation
services (16.5 percent from 10.6 percent).
Overall imports increased by 13.9 percent in
Q3 2017, slower than the quarter-ago growth
of 18.7 percent, owing to the lower expansion
of imports of goods by 14.4 percent from
20.9 percent. The slowdown in growth of imports
of goods was due to the decelerated growth of
imports of base metals as well as sustained
contraction of imports of telecommunication, and
payments for imported office equipment and
artificial resins. Meanwhile, the double-digit rise in
imports of services was due to the higher growth
in imports of miscellaneous services (e.g.,
technical, trade-related, and other business
services) at 17.2 percent from 8.9 percent and
transportation services by 14.5 percent from
12.7 percent.
13
Export of miscellaneous services include technical, trade-
related, and other business services, computer services, and
manufacturing services on physical inputs owned by others.
Other Demand Indicators. Higher-frequency
demand indicators support the view of continued
firm economic activity in the near term. The
property sector showed sustained demand from
residential and office segments, vehicle sales
accelerated at double-digit rates while the
composite Purchasing Managers’ Index stayed
firmly above the 50-point expansion threshold.
Similarly, business and consumer confidence
indicate broad optimism in Q4 and the quarter
ahead.
Property Prices
Vacancy Rates, Makati CBD. The overall office
vacancy rate in Metro Manila rose to about
5.6 percent in Q3 2017 from 4.5 percent in
Q2 2017 due to record high completions in office
buildings. In particular, vacancy rates in the
Fort Bonifacio and Manila Bay Area increased
during the quarter while vacancy rates in the
Makati CBD and Ortigas area were broadly stable.
Demand from BPO, traditional
offices and offshore gaming
keep office vacancy low
Furthermore, with the sizeable upcoming supply,
Colliers expects overall vacancy rates in Metro
Manila to rise to above 6 percent by the end of
2017 and about 8 percent in 2018.
According to Colliers, the overall residential
vacancy rate in Metro Manila also increased to
about 12.7 percent in Q3 2017 from 11.7 percent
in Q2 2017 due to the influx of residential
condominium developments.
Chart 9. Vacancy Rates
(Makati Central Business District)
in percent
5
6
7
8
9
10
11
12
13
14
15
0
1
2
3
4
5
6
Q1
2013
Q2 Q3 Q4 Q1
2014
Q2 Q3 Q4 Q1
2015
Q2 Q3 Q4 Q1
2016
Q2 Q3 Q4 Q1
2017
Q2 Q3
Office (LHS) Residential (RHS)
Source: Colliers International Philippines

Q4 2017 Inflation Report | | | | 8888
Except for Ortigas Center, all major CBDs within
Metro Manila registered higher vacancy rates in
Q3 2017 compared to the previous quarter.
Colliers foresees that residential vacancy rates
will range to about 15–17 percent in 2018 and
then taper down to low double-digit levels in 2019.
Rental Values, Makati CBD. Monthly Grade A
office14
rents in the Makati CBD reached
P990/sq.m. in Q3 2017, representing an increase
of 2.1 percent from the previous quarter. Similarly,
monthly Grade A office rents in the Makati CBD
were higher by 5.9 percent relative to Q3 2016.
Office rental values increase in
nominal terms
Office rental rates continued to increase amid
strong demand from a diversified tenant mix from
the following sectors: business process
outsourcing (BPO) firms; traditional companies,
i.e., non-BPO and government agencies; and,
offshore gaming. Office rental values for Grade A
offices were above their 1997 levels in nominal
terms. In real terms, office rental values were
about 53.0 percent of the comparable levels in
1997.
Meanwhile, monthly rents for luxury three-
bedroom condominium units in the Makati CBD
was at P805/sq.m. in Q2 2017, declining by 1.8
percent from the previous quarter. Likewise,
monthly rents for the 3-bedroom segment were
lower by 5.3 percent compared to the year-ago
levels.
Luxury rental values decline
Residential rental rates in the Makati CBD as well
as other CBDs within Metro Manila, e.g. Fort
Bonifacio and Rockwell, continued to drop as the
rental market became more competitive due to
the ample supply of residential units across CBDs
14
Grade A office refers to office units that are located within
the CBD but not in the core area and have quality access to and
from the secondary or main avenues. Meanwhile, in terms of
general finish, Grade A office buildings have high quality
presentation and maintenance.
and in alternative locations outside CBDs.
Residential rental values for luxury three-bedroom
high-rise units were above their 1997 levels in
nominal terms but were only about 70.5 percent
of their 1997 levels in real terms.
Chart 10. Rental Values
(Makati Central Business District)
price per square meter
0
100
200
300
400
500
600
700
800
900
1,000
1,100
1,200
Q1
2013
Q2 Q3 Q4 Q1
2014
Q2 Q3 Q4 Q1
2015
Q2 Q3 Q4 Q1
2016
Q2 Q3 Q4 Q1
2017
Q2 Q3
Office (Grade A) Residential (Luxury)
Source: Colliers International Philippines
Capital Values, Makati CBD. Capital values15
for
Grade A office buildings in the Makati CBD in
Q3 2017 were higher in nominal terms than their
quarter- and year-ago levels.
Capital values for office and
residential buildings rise
Grade A office capital values in the Makati CBD
rose to P189,600/sq.m., higher by 4.1 percent and
by 32.6 percent compared to the quarter- and
year-ago levels, respectively. Grade A office capital
values were three times higher than the 1997
levels in nominal terms. In real terms, office capital
values are almost at comparable levels in 1997.
15
Probable price that the property would have fetched if sold
on the date of the valuation. The valuation includes imputed
land and building value.

Q4 2017 Inflation Report | | | | 9999
Chart 11. Capital Values
(Makati Central Business District) price per square meter
0
20,000
40,000
60,000
80,000
100,000
120,000
140,000
160,000
180,000
200,000
220,000
Q1
2013
Q2 Q3 Q4 Q1
2014
Q2 Q3 Q4 Q1
2015
Q2 Q3 Q4 Q1
2016
Q2 Q3 Q4 Q1
2017
Q2 Q3
Office (Grade A) Residential (luxury)
Source: Colliers International Philippines
Likewise, capital values for luxury residential
buildings16
in Makati CBD in Q3 2017 increased to
P194,050/sq.m. from their quarter- and year-ago
levels. Average prices for three-bedroom luxury
residential condominium units grew by 1.2 percent
quarter-on-quarter and 10.2 percent year-on-year.
Capital values for luxury residential buildings
nearly doubled from their levels in 1997. In real
terms, residential capital values were about
82.8 percent of the comparable levels in 1997.
BSP Residential Real Estate Price Index (RREPI).17
Residential real estate prices went up by
1.8 percent in Q3 2017, as the Residential Real
Estate Price Index (RREPI) 18
rose to 111.6 from
109.6 for the same quarter a year ago.
Year-on-year, prices of townhouses and
condominium units grew faster at 7.3 percent
and 3.6 percent, respectively, compared to the
16
In terms of location, luxury residential units are located
within the CBD core and have quality access to/from and have
superior visibility from the main avenue. Meanwhile, in terms
of general finish, luxury residential units have premium
presentation and maintenance. 17
The RREPI measures the average changes in prices of
different types of housing units over a period of time across
different geographical regions where the growth rate of the
index measures house inflation. It is computed as a weighted
chain-linked index based on the average appraised value per
square meter weighted by the share of floor area of new
housing units. 18
For Q3 2017, about eight in ten real estate loans were for
the purchase of new housing units (76.7 percent). By type of
housing unit, residential property loans were for the acquisition
of condominium units (48.0 percent), followed by single
detached units (40.8 percent) and townhouses
(10.8 percent). By area, condominium units were the most
common house purchases in NCR while single detached
houses were prevalent in AONCR. By region, NCR accounted
for 47.4 percent of the total number of residential real estate
loans granted during the quarter, followed by CALABARZON
(29.0 percent), Central Luzon (6.4 percent), Central Visayas
(5.2 percent), Western Visayas (4.3 percent), Davao Region
(3.0 percent) and Northern Mindanao (1.6 percent). These
seven regions accounted for 96.9 percent of total housing
loans granted by banks.
previous quarter. Meanwhile, prices of single
detached housing units grew at a slower rate of
0.8 percent.19
On a q-o-q basis, however, the
RREPI remained broadly steady.
Residential real estate prices
rise in Q3 2017
The average residential property prices in both the
National Capital Region (NCR) and Areas Outside
NCR (AONCR) increased by 2.2 percent and
1.8 percent, respectively. In NCR, the higher
growth in prices of townhouses and condominium
units offset the decline in prices of single detached
houses and duplex units. In AONCR, prices of
single detached houses, townhouses, and
condominium units grew while that of duplex
units declined.
Table 7. Residential Real Estate Price Index
By Area
Q1 2014=100; growth rate in percent
Overall NCR AONCR
2015 Q2 105.5 113.9 99.7
Q3 105.6 115.5 99.3
Q4 107.6 116.6 101.8
2016 Q1 106.9 113.4 103.3
Q2 111.7 116.1 109.3
Q3 109.6 115.7 106.2
Q4 111.1 117.3 107.9
2017 Q1 113.9 118.4 111.6
Q2 111.8 120.4 107.5
Q3 111.6 118.2 108.1
2015 Q2 5.7 4.9 12.9
Q3 -0.4 6.8 -4.1
Q4 1.1 4.6 0.8
2016 Q1 1.3 3.5 1.8
Q2 5.9 1.9 9.6
Q3 3.8 0.2 6.9
Q4 3.3 0.6 6.0
2017 Q1 6.5 4.4 8.0
Q2 0.1 3.7 -1.6
Q3 1.8 2.2 1.8
2015 Q2 4.1 8.6 0.9
Q3 0.1 1.4 -0.4
Q4 1.9 1.0 2.5
2016 Q1 -0.7 -2.7 1.5
Q2 4.5 2.4 5.8
Q3 -1.9 -0.3 -2.8
Q4 1.4 1.4 1.6
2017 Q1 2.5 0.9 3.4
Q2 -1.8 1.7 -3.7
Q3 -0.2 -1.8 0.6
Source: BSP
Year-on-Year Growth Rates
Quarter-on-Quarter Growth Rates
Residential Real Estate Price Index (By Area)Quarter
19
Prices of duplex units (which account for only 0.3 percent of
total new housing units reported) declined by 8.6 perecnt y-o-y.

Q4 2017 Inflation Report | | | | 10101010
Table 8. Residential Real Estate Price Index
By Housing Type Q1 2014=100; growth rate in percent
Overall
Single
Detached/
Attached
Duplex TownhouseCondominium
Unit
2015 Q2 105.5 97.9 97.9 96.8 120.0
Q3 105.6 97.3 101.9 97.7 122.1
Q4 107.6 100.6 99.8 101.2 121.1
2016 Q1 106.9 98.9 114.7 107.3 123.2
Q2 111.7 105.8 98.5 109.3 123.9
Q3 109.6 102.6 96.7 100.5 126.4
Q4 111.1 104.9 87.5 107.7 125.5
2017 Q1 113.9 108.0 91.2 107.6 128.3
Q2 111.8 103.6 103.6 112.7 129.3
Q3 111.6 103.4 88.4 107.8 131.0
2015 Q2 5.7 12.8 1.0 -6.7 7.4
Q3 -0.4 -2.2 14.5 -1.1 5.8
Q4 1.1 2.3 -5.8 5.0 2.3
2016 Q1 1.3 -0.9 10.4 4.0 8.7
Q2 5.9 8.1 0.6 12.9 3.3
Q3 3.8 5.4 -5.1 2.9 3.5
Q4 3.3 4.3 -12.3 6.4 3.6
2017 Q1 6.5 9.2 -20.5 0.3 4.1
Q2 0.1 -2.1 5.2 3.1 4.4
Q3 1.8 0.8 -8.6 7.3 3.6
2015 Q2 0.0 -1.9 -5.8 -6.2 5.9
Q3 0.1 -0.6 4.1 0.9 1.7
Q4 1.9 3.4 -2.1 3.6 -0.8
2016 Q1 -0.7 -1.7 14.9 6.0 1.7
Q2 4.5 7.0 -14.1 1.9 0.6
Q3 -1.9 -3.0 -1.8 -8.1 2.0
Q4 1.4 2.2 -9.5 7.2 -0.7
2017 Q1 2.5 3.0 4.2 -0.1 2.2
Q2 -1.8 -4.1 13.6 4.7 0.8
Q3 -0.2 -0.2 -14.7 -4.3 1.3
Source: BSP
Quarter-on-Quarter Growth Rates
Quarter
Residential Real Estate Price Index (By Housing Type)
Year-on-Year Growth Rates
Vehicle Sales. Sales of new vehicles from CAMPI20
members grew by 20.6 percent y-o-y in the first
two months of Q4 2017 from the 15.2-percent
growth recorded in the same period a year ago,
reflecting the expansion in the sales of commercial
vehicles which offset the slight contraction in the
sales of passenger cars.
Brisk growth in sales of new
vehicles continue
Sales of passenger cars declined by 0.2 percent
y-o-y in October-November 2017 compared to the
20
Vehicle sales data is gathered on a monthly basis by the
Chamber of Automotive Manufacturers of the Philippines
(CAMPI). CAMPI represents the local assemblers and
manufacturers of vehicle units in the Philippine automotive
industry. The following are the active members of CAMPI:
(1) Asian Carmakers Corp., (2) CATS Motors, Inc., (3) Columbian
Autocar Corp., (4) Honda Cars Philippines, Inc., (5) Isuzu
Philippines Corp., (6) Mitsubishi Motors Philippines Corp.,
(7) Nissan Motor Philippines Corp., (8) Suzuki Philippines Inc.,
(9) Toyota Motor Philippines Corp. and (10) Universal Motors
Corp.
8.0-percent growth in the same period in 2016.
New passenger car sales accrued to a total of
23,587 in the first two months of Q4 2017 units
from 23,642 units in the same period a year ago.
Chart 12. Vehicle Sales number of units
-15
-10
-5
0
5
10
15
20
25
30
35
Q1
20
13
Q2
Q3
Q4
*
Q4
Q1
20
14
Q2
Q3
Q4
*
Q4
Q1
20
15
Q2
Q3
Q4
*
Q4
Q1
20
16
Q2
Q3
Q4
*
Q4
Q1
20
17
Q2
Q3
Q4
*
* October - November
Source: Chamber of Automotive Manufacturers of the Philippines, Inc. (CAMPI)
The growth of commercial vehicle sales, which
account for about 69.5 percent of total vehicle
sales, accelerated to 32.8 percent y-o-y in the
first two months of Q4 2017 relative to
19.8-percent growth in the same period of 2016.
Commercial vehicles sold during the quarter
reached 53,723 units from 40,456 units in
October-November 2016.
Energy Sales. Meralco’s energy sales for Q4 2017
(October - November) grew by 6.1 percent, faster
than the 3.7-percent growth reported in the same
period a year ago. Energy sales from the
residential sector, commercial sector and
industrial sector grew by 6.7 percent, 5.0 percent,
and 6.9 percent, respectively.
Energy sales increase
Chart 13. Energy Sales
year-on-year growth in percent
-10
0
10
20
30
40
50
60
70
Q1
20
13
Q2
Q3
Q4
*
Q4
Q1
20
14
Q2
Q3
Q4
*
Q4
Q1
20
15
Q2
Q3
Q4
*
Q4
Q1
20
16
Q2
Q3
Q4
*
Q4
Q1
20
17
Q2
Q3
Q4
*
Total Energy Sales
Residential
Commercial
Industrial
Others
*October-November 2017
Source: Meralco, BSP calculations
6.1 pct
6.7 pct
5.0 pct
6.9 pct
2.2 pct

Q4 2017 Inflation Report | | | | 11111111
Capacity Utilization. Based on the Philippine
Statistics Authority’s Monthly Integrated Survey of
Selected Industries (MISSI), the average capacity
utilization rate of the manufacturing sector stood
at 83.9 percent in November 2017, unchanged
from the month-ago level.
Capacity utilization in
manufacturing remains above
80 percent
Of the 646 respondent-establishments,
59.7 percent operated at least at 80.0 percent
capacity in November 2017. Data showed that
most of the manufacturing companies have been
operating above the 80.0 percent capacity since
2010.
Chart 14. Monthly Average of Capacity Utilization
for Manufacturing in percent
80
81
82
83
84
85
Jan
20
13
Fe
bM
ar
Ap
rM
ay
Jun
Jul
Au
gS
ep
Oct
No
vD
ec
Jan
20
14
Fe
bM
ar
Ap
rM
ay
Jun
Jul
Au
gS
ep
Oct
No
vD
ec
Jan
20
15
Fe
bM
ar
Ap
rM
ay
Jun
Jul
Au
gS
ep
Oct
No
vD
ec
Jan
20
16
Fe
bM
ar
Ap
rM
ay
Jun
Jul
Au
gS
ep
Oct
No
vD
ec
Jan
20
17
Fe
bM
ar
Ap
rM
ay
Jun
Jul
Au
gS
ep
Oct
No
v
Source: PSA
Volume and Value of Production. Preliminary
results of the MISSI showed that volume of
production index (VoPI) posted a contraction of
8.1 percent year-on-year in November 2017 from a
5.8-percent (revised) contraction in the previous
month.
Manufacturing output posts
contraction
The cutback in output was due to the decline in
the production of chemical products
(-62.7 percent), tobacco products (-48.3 percent),
footwear and wearing apparel (-23.9 percent),
textiles (-33.8 percent), rubber and plastic products
(-8.4 percent), and food manufacturing
(-0.3 percent). Moreover, five major sub-sectors
grew at a slower pace in November that include
electrical machinery, fabricated metals, furniture
and fixtures, printing, beverages, and leather
products.
Chart 15. Volume and Value Indices
of Manufacturing Production
year-on-year in percent
-15
-10
-5
0
5
10
15
20
25
Jan
20
13
Fe
bM
ar
Ap
rM
ay
Jun
Jul
Au
gS
ep
Oct
No
vD
ec
Jan
20
14
Fe
bM
ar
Ap
rM
ay
Jun
Jul
Au
gS
ep
Oct
No
vD
ec
Jan
20
15
Fe
bM
ar
Ap
rM
ay
Jun
Jul
Au
gS
ep
Oct
No
vD
ec
Jan
20
16
Fe
bM
ar
Ap
rM
ay
Jun
Jul
Au
gS
ep
Oct
No
vD
ec
Jan
20
17
Fe
bM
ar
Ap
rM
ay
Jun
Jul
Au
gS
ep
Oct
No
v
VAPI VOPI
Source: PSA
The value of production index (VaPI) also posted a
contraction of 9.3 percent in November 2017 from
a 5.7-percent (revised) contraction a month ago.
This was attributed to the following sub-sectors:
chemical products (-63.6 percent), tobacco
products (-47.4 percent), footwear and wearing
apparel (-25.9 percent), food manufacturing
(-4.1 percent), textiles (-33.6 percent), rubber and
plastic products (-13.7 percent), and leather
products (-5.8 percent).
Business Expectations. Business outlook on the
economy turned more upbeat for Q4 2017, with
the overall confidence index (CI) of the Business
Expectations Survey (BES)21
rising to 43.3 percent
from 37.9 percent for Q3 2017. This means that
the number of optimists increased and continued
to be greater than the number of pessimists during
the quarter. The review quarter’s confidence level
was also higher compared to its year-ago level of
39.8 percent.
21
The Q4 2017 BES was conducted during the period 2 October
– 20 November 2017. Respondents, which were drawn from
the combined list of the Securities and Exchange Commission’s
Top 7,000 Corporations in 2010 and Business World’s Top 1,000
Corporations in 2015, consisted of 585 companies in NCR and
888 firms in AONCR and covered all 16 regions nationwide. The
survey response rate for this quarter was higher at 84.0 percent
(from 83.6 percent in the previous quarter). The response rate
was higher for NCR at 80.3 percent (from 80.0 percent in the
previous quarter) and higher for AONCR at 86.4 percent (from
86.0 percent in Q3 2017).

Q4 2017 Inflation Report | | | | 12121212
Q4 business sentiment upbeat
but moderates for next
quarter
Respondents cited the following factors behind
their more buoyant outlook for Q4: (a) expected
increase in orders and consumer purchases during
the Christmas holidays, (b) increasing number and
expansion of businesses, (c) higher disbursements
for the government’s infrastructure and other
development projects, (d) favorable
macroeconomic conditions in the country,
particularly manageable inflation and low interest
rates, and (e) expansion of export markets and
stronger demand for Philippine products.
Table 9. Business Expectations Survey
Current
Quarter
Next
Quarter
2015 Q1 45.2 58.2
Q2 49.2 47.3
Q3 41.4 53.1
Q4 51.3 43.9
2016 Q1 41.9 49.6
Q2 48.7 45.3
Q3 45.4 56.8
Q4 39.8 34.5
2017 Q1 39.4 47.2
Q2 43.0 42.7
Q3 37.9 51.3
Q4 43.3 39.7
Source: BSP
BUSINESS
OUTLOOK
INDEX
The sentiment of businesses in the Philippines
mirrored the more bullish business outlook in
Australia, Canada, Germany, and Indonesia, but
was in contrast to the less favorable views of those
in the US, UK, Hong Kong, South Korea, New
Zealand and Thailand, and steady outlook in
France.
For the quarter ahead (Q1 2018), business outlook
turned less optimistic, with the next quarter CI
declining to 39.7 percent from 51.3 percent in the
previous quarter’s survey results. Respondents
attributed their less positive outlook mainly to the
usual slowdown of demand after the holiday
season. Other reasons cited by firms were lag in
business transactions at the beginning of the year
(e.g., delay in renewal of contracts and drydock
season for the shipping industry), stiffer business
competition, concerns on the effect of the new
excise tax rates to the automobile industry, and
higher inflation.
Consumer Expectations. Consumer outlook was
broadly steady for Q4 2017, with the overall
confidence index (CI) of the Consumer
Expectations Survey (CES) 22
decreasing slightly to
9.5 percent from 10.2 percent for Q3 2017. This
means that the optimists continued to outnumber
the pessimists but the margin for the current
quarter was slightly lower relative to a quarter
ago.
Consumer confidence
broadly steady for Q4 and the
next quarter
Respondents indicated that their continued
positive sentiment during the current quarter was
on account of additional family income and higher
salary, and availability of more jobs leading to an
increase in the number of employed family
members. However, their slightly less favorable
outlook, which counterbalanced their positive
views, was due to concerns on: (a) higher prices of
goods and household expenditures, (b) peace and
order situations, (c) occurrence of calamities such
as typhoons, and (d) poor health and high medical
expenses.
Table 10. Consumer Expectations Survey
Current
Quarter
Next 3
Months
Next 12
Months
2015 Q1 -10.0 4.4 17.3
Q2 -16.2 -0.4 16.4
Q3 -11.6 5.8 15.8
Q4 -8.1 5.7 18.0
2016 Q1 -5.7 9.1 25.4
Q2 -6.4 5.6 26.6
Q3 2.5 27.3 43.8
Q4 9.2 18.8 33.4
2017 Q1 8.7 16.5 31.7
Q2 13.1 13.6 34.3
Q3 10.2 17.8 33.7
Q4 9.5 17.5 32.0
CONSUMER
OUTLOOK
INDEX
Source: BSP
The outlook of consumers in the Philippines
mirrored the steady sentiment of consumers in the
Netherlands and Cyprus. Meanwhile, consumers in
22
The Q4 2017 CES was conducted during the period
2-14 October 2017. The CES samples, which were drawn from
the Philippine Statistics Authority (PSA) Master Sample List
of Households, were generated using a stratified multi-stage
probability sampling scheme. It has a sample size of 5,581
households, of which 2,722 (48.8 percent) were from NCR
and 2,859 (51.2 percent) from AONCR.
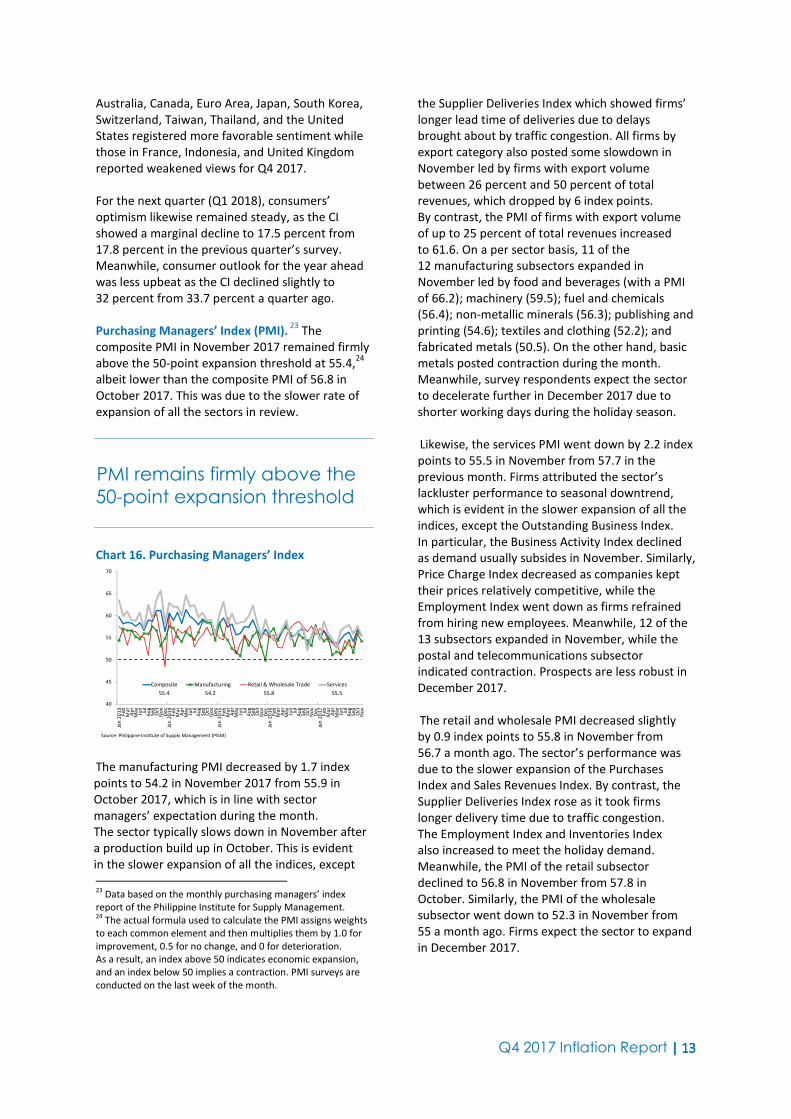
Q4 2017 Inflation Report | | | | 13131313
Australia, Canada, Euro Area, Japan, South Korea,
Switzerland, Taiwan, Thailand, and the United
States registered more favorable sentiment while
those in France, Indonesia, and United Kingdom
reported weakened views for Q4 2017.
For the next quarter (Q1 2018), consumers’
optimism likewise remained steady, as the CI
showed a marginal decline to 17.5 percent from
17.8 percent in the previous quarter’s survey.
Meanwhile, consumer outlook for the year ahead
was less upbeat as the CI declined slightly to
32 percent from 33.7 percent a quarter ago.
Purchasing Managers’ Index (PMI). 23
The
composite PMI in November 2017 remained firmly
above the 50-point expansion threshold at 55.4,24
albeit lower than the composite PMI of 56.8 in
October 2017. This was due to the slower rate of
expansion of all the sectors in review.
PMI remains firmly above the
50-point expansion threshold
Chart 16. Purchasing Managers’ Index
40
45
50
55
60
65
70
Jan
20
13
Feb
Ma
rA
pr
Ma
yJu
nJu
lA
ug
Sep
Oct
No
vD
ec
Jan
20
14
Feb
Ma
rA
pr
Ma
yJu
nJu
lA
ug
Sep
Oct
No
vD
ec
Jan
20
15
Feb
Ma
rA
pr
Ma
yJu
nJu
lA
ug
Sep
Oct
No
vD
ec
Jan
20
16
Feb
Ma
rA
pr
Ma
yJu
nJu
lA
ug
Sep
Oct
No
vD
ec
Jan
20
17
Feb
Ma
rA
pr
Ma
yJu
nJu
lA
ug
Sep
Oct
No
v
Composite Manufacturing Retail & Wholesale Trade Services
55.4 54.2 55.8 55.5
Source: Philippine Institute of Supply Management (PISM)
The manufacturing PMI decreased by 1.7 index
points to 54.2 in November 2017 from 55.9 in
October 2017, which is in line with sector
managers’ expectation during the month.
The sector typically slows down in November after
a production build up in October. This is evident
in the slower expansion of all the indices, except
23
Data based on the monthly purchasing managers’ index
report of the Philippine Institute for Supply Management. 24
The actual formula used to calculate the PMI assigns weights
to each common element and then multiplies them by 1.0 for
improvement, 0.5 for no change, and 0 for deterioration.
As a result, an index above 50 indicates economic expansion,
and an index below 50 implies a contraction. PMI surveys are
conducted on the last week of the month.
the Supplier Deliveries Index which showed firms’
longer lead time of deliveries due to delays
brought about by traffic congestion. All firms by
export category also posted some slowdown in
November led by firms with export volume
between 26 percent and 50 percent of total
revenues, which dropped by 6 index points.
By contrast, the PMI of firms with export volume
of up to 25 percent of total revenues increased
to 61.6. On a per sector basis, 11 of the
12 manufacturing subsectors expanded in
November led by food and beverages (with a PMI
of 66.2); machinery (59.5); fuel and chemicals
(56.4); non-metallic minerals (56.3); publishing and
printing (54.6); textiles and clothing (52.2); and
fabricated metals (50.5). On the other hand, basic
metals posted contraction during the month.
Meanwhile, survey respondents expect the sector
to decelerate further in December 2017 due to
shorter working days during the holiday season.
Likewise, the services PMI went down by 2.2 index
points to 55.5 in November from 57.7 in the
previous month. Firms attributed the sector’s
lackluster performance to seasonal downtrend,
which is evident in the slower expansion of all the
indices, except the Outstanding Business Index.
In particular, the Business Activity Index declined
as demand usually subsides in November. Similarly,
Price Charge Index decreased as companies kept
their prices relatively competitive, while the
Employment Index went down as firms refrained
from hiring new employees. Meanwhile, 12 of the
13 subsectors expanded in November, while the
postal and telecommunications subsector
indicated contraction. Prospects are less robust in
December 2017.
The retail and wholesale PMI decreased slightly
by 0.9 index points to 55.8 in November from
56.7 a month ago. The sector’s performance was
due to the slower expansion of the Purchases
Index and Sales Revenues Index. By contrast, the
Supplier Deliveries Index rose as it took firms
longer delivery time due to traffic congestion.
The Employment Index and Inventories Index
also increased to meet the holiday demand.
Meanwhile, the PMI of the retail subsector
declined to 56.8 in November from 57.8 in
October. Similarly, the PMI of the wholesale
subsector went down to 52.3 in November from
55 a month ago. Firms expect the sector to expand
in December 2017.

Q4 2017 Inflation Report | | | | 14141414
External Demand25
Exports. Exports of goods expanded at a slower
rate at 8.4 percent in Q3 2017 from 12.7 percent
in the previous quarter. Nevertheless, the growth
in exports in Q3 2017 is a turn-around from the
1.8-percent contraction posted in Q3 2016.
Exports of goods moderate
The expansion in foreign shipments of coconut
products, sugar and products, fruits and
vegetables, other agro-based products, forest
products, mineral products and manufactures
outweighed the decline in exports of petroleum
products during the quarter.
Table 11. Exports of Goods growth rate in percent
Q3 Q2 Q3
Coconut Products 12.0 31.9 26.3
Sugar and Products -67.5 2,804.4 3,043.5
Fruits and Vegetables 11.0 7.0 1.5
Other Agro-Based Products 8.3 24.7 0.6
Forest Products -21.6 724.7 619.6
Mineral Products 0.8 112.5 53.2
Petroleum Products -56.1 -6.3 -46.9
Manufactures -2.0 7.3 4.0
Special Transactions -26.2 31.0 209.1
Total Exports -1.8 12.7 8.4
Source: BSP
2017COMMODITY GROUP
2016
Imports. The growth of imports slowed down to
3.9 percent in Q3 2017 from 5.1-percent and
12.6 percent growth registered in Q2 2017 and
Q3 2016, respectively.
Imports of goods slow down
Nonetheless, the sustained growth in imports
during the quarter was due to the expansion in
inward shipments of raw materials and
intermediate goods, mineral fuels and lubricant,
and consumer goods, offsetting the contraction in
the importation of capital goods.
25
International Merchandise Trade Statistics (IMTS) concept
Table 12. Imports of Goods
growth rate in percent
Q3 Q2 Q3
Capital Goods 30.9 4.6 -2.9
Raw Materials and
Intermediate Goods -2.2 6.5 3.2
Lubricants -10.4 10.0 31.1
Consumer Goods 39.6 1.2 6.0
Special Transactions 34.5 -31.4 -35.0
Total Imports 12.6 5.1 3.9
2016
Mineral Fuels and
Source: BSP
2017COMMODITY GROUP
Aggregate Supply. On the production side, the
third quarter GDP growth was mainly driven by
services (contributing 4.2 percentage points) and
industry (contributing 2.5 percentage points).
Agriculture contributed 0.2 percentage point.
Services sector continues to
support supply-side growth
The services sector output increased by
7.1 percent in Q3 2017, higher than the
6.3 percent growth in Q2 2017. The expansion
is due to the improvement in growth of trade
and repair of motor vehicles, motorcycles,
personal, and household goods (6.8 percent from
5.7 percent), public administration and defense
and compulsory social security (8.2 percent from
7.6 percent), transport, storage and
communication (3.9 percent from 3.4 percent),
and other services (7.7 percent from 4.9 percent).
On public administration and defense, the higher
growth compared to a quarter ago was due to the
increased disbursement for personnel services and
funding for the creation and filling of positions in
various government agencies.
Meanwhile, financial intermediation, and
real estate, renting and business activities
and spending decreased from a quarter ago
(8.6 percent from 9.1 percent and 7.7 percent
from 8.3 percent, respectively). Financial
intermediation slowed down due to the lower
expansion of banking institutions, insurance, and
activities auxiliary to financial intermediation
compared to a quarter ago. The real estate,
renting and business activities grew slower
compared to that of the previous quarter on
account of lower growth of real estate (7.7 percent
from 12.8 percent in Q2 2017) and slight decline in

Q4 2017 Inflation Report | | | | 15151515
the growth of ownership of dwellings (2.9 percent
from 3.0 percent in the previous quarter).
Chart 17. Gross Domestic Product
by Industrial Origin (at constant prices)
year-on-year growth in percent
-6
-4
-2
0
2
4
6
8
10
12
14
Q1
2013
Q2 Q3 Q4 Q1
2014
Q2 Q3 Q4 Q1
2015
Q2 Q3 Q4 Q1
2016
Q2 Q3 Q4 Q1
2017
Q2 Q3
Agriculture Industry Services
Source: PSA
2.5 pct 7.5 pct 7.1 pct
Industry grew slightly stronger at 7.5 percent in
Q3 2017 compared to 7.4 percent in Q2 2017.
This can be attributed to the faster growth of
manufacturing (9.4 percent from 7.9 percent)
and electricity, gas and water supply (EGW)
(3.3 percent from 2.9 percent) which outweighed
the deceleration in the growth of mining and
quarrying (4.6 percent from 12.5 percent), and
construction (3.8 percent from 7.1 percent).
The higher growth of manufacturing can be mainly
attributed to the growth of paper and paper
products, publishing and printing, chemical and
chemical products, non-metallic mineral products,
basic metal industries, machinery and equipment
except electrical, office, accounting and computing
machinery, electrical machinery and apparatus,
furniture and fixtures, and miscellaneous
manufactures. On EGW, the accelerated growth
came from increased electricity production.
Meanwhile, the deceleration in the growth of
construction (6.3 percent from 9 percent) was due
to the lower growth of private construction.
The growth in the agriculture, hunting, forestry
and fishery (AHFF) sector decelerated to
2.5 percent in Q3 2017 from 6.3 percent, a quarter
ago. The slower growth of AHFF for the quarter
was largely due to the contraction in forestry and
decline in agriculture. Under agriculture, the
decline in the growth can be traced with the
deceleration in the growth of sugarcane, cassava,
poultry, and agricultural activities and services
and the contraction of corn and other crops.
The growth in agriculture can be attributed to
favourable weather conditions and increased
usage and availability of good quality seeds.
Table 13. Gross Domestic Product by
Industrial Origin at constant 2000 prices; growth rate in percent
Q1 Q2 Q3 Q4 Q1 Q2 Q3
Agri., Hunting, Forestry and Fishing -4.3 -2.0 3.0 -1.3 4.9 6.3 2.5
Agriculture and Forestry -4.0 -1.3 4.3 -0.7 5.6 8.1 3.7
Fishing -5.9 -5.2 -2.6 -3.8 1.2 -2.7 -2.6
Industry Sector 9.3 7.6 8.8 7.9 6.3 7.4 7.5
Mining and Quarrying 11.4 -4.0 -2.0 10.8 -18.0 12.5 4.6
Manufacturing 8.0 6.2 6.8 7.0 7.6 7.9 9.4
Construction 14.2 13.5 17.2 10.7 9.0 7.1 3.8
Electricity, Gas and Water Supply 10.2 10.3 9.6 9.2 1.5 2.9 3.3
Service Sector 7.5 8.2 6.8 7.2 6.7 6.3 7.1
Transport, Storage and
Communication 5.3 7.0 4.6 6.4 4.2 3.4 3.9
Trade and Repair of Motor Vehicles,
Motorcycles, Personal and
Household Goods 7.5 8.9 6.3 6.5 7.4 5.7 6.8
Financial Intermediation 9.7 6.9 8.5 5.5 7.0 9.1 8.6
Real Estate, Renting and
Business Activities 8.7 8.8 8.9 9.1 7.1 8.3 7.7
Public Administration and Defense;
Compulsory Social Security 5.2 6.4 3.7 13.3 5.5 7.6 8.2
Other Services 7.3 9.0 6.8 6.0 7.2 4.9 7.7
Source: PSA
BY INDUSTRIAL ORIGIN2016 2017
Labor Market Conditions
The Q4 labor market, as reported in the October
2017 round of the labor force survey (LFS), were
mixed when compared to year-ago rates
(October 2016 LFS). However, the October 2017
results showed improvement from a quarter ago
(July 2017 survey).
Q4 labor market show mixed
results from a year ago
Unemployment rate in the October 2017 LFS
increased to 5.0 percent from 4.7 percent a year
ago. In contrast, underemployment improved to
15.9 percent from 18.0 percent in the previous
year. Meanwhile, employment rate was generally
steady at 95.0 percent from 95.3 percent a year
ago.
Chart 18. Unemployment and Underemployment in percent
0
5
10
15
20
25
Jan
2013
Apr Jul Oct Jan
2014
Apr Jul Oct Jan
2015
Apr Jul Oct Jan
2016
Apr Jul Oct Jan
2017
Apr Jul Oct
Unemployment Underemployment
Source: PSA

Q4 2017 Inflation Report | | | | 16161616
The 5.0 percent unemployment rate in
October 2017 was equivalent to 2.2 million
unemployed individuals. Males comprised
64.2 percent of the unemployed. In terms
of age, the 15 to 24 age group comprised
43.9 percent of total unemployed while the
25 to 34 age group made up 28.9 percent.
By educational attainment, 20.4 percent of the
unemployed were college graduates, 14.1 percent
were college undergraduates, and 30.6 percent
have completed junior high school.
Chart 19. Employment Rate in percent
91
92
92
93
93
94
94
95
95
96
96
Jan
2013
Apr Jul Oct Jan
2014
Apr Jul Oct Jan
2015
Apr Jul Oct Jan
2016
Apr Jul Oct Jan
2017
Apr Jul Oct
Source: PSA
Of the employed persons, workers in the services
sector made up the largest proportion. These
workers accounted for 57.0 percent of the total
employed in October 2017. Workers in the
agriculture sector composed the second largest
group making up 25.0 percent while those in the
industry sector comprised the remaining
18.1 percent of the total employed.
Chart 20. Employment by Sector
in percent
-14
-12
-10
-8
-6
-4
-2
0
2
4
6
8
10
12
14
16
Jan
2013
Apr Jul Oct Jan
2014
Apr Jul Oct Jan
2015
Apr Jul Oct Jan
2016
Apr Jul Oct Jan
2017
Apr Jul Oct
Agriculture Industry Services
Source: PSA

Q4 2017 Inflation Report | | | | 17171717
II. Monetary and Financial Market Conditions
Domestic Liquidity
Domestic liquidity (M3) grew by 14.0 percent y-o-y
in November to about ₱10.4 trillion, slower than
the 14.5-percent expansion recorded in
end-Q3 2017.
Domestic liquidity continues to
expand
Money supply continued to increase due largely to
sustained demand for credit. Domestic claims
grew by 14.7 percent in November, albeit slower
than the 16.1 percent expansion in end-Q3 2017
as growth in credit to the private sector eased.
Meanwhile, net claims on the central government
increased by 10.2 percent from 10.0 percent at the
end of the previous quarter as a result of
continued borrowing by the National Government.
Chart 21. Domestic Liquidity
year-on-year growth rates in percent
0
5
10
15
20
25
30
35
40
Ma
r 2
01
3
Jun
Se
p
No
v
De
c
Ma
r 2
01
4
Jun
Se
p
No
v
De
c
Ma
r 2
01
5
Jun
Se
p
No
v
De
c
Ma
r 2
01
6
Jun
Se
p
No
v
De
c
Ma
r 2
01
7
Jun
Se
p
No
v
Source: BSP
Likewise, the growth in net foreign assets (NFA)
accelerated to 1.9 percent y-o-y in November from
0.1 percent in end-Q3 2017. The BSP’s NFA
position was supported during the review period
by steady foreign exchange inflows coming mainly
from overseas Filipinos’ remittances and business
process outsourcing receipts. The NFA of banks
expanded due mainly to the growth in banks’
foreign assets resulting from higher loans and
investments in marketable debt securities.
Preliminary data as of November 2017 show that
outstanding loans of commercial banks, net of
reverse repurchase (RRP) placements with the
BSP, grew by 19.2 percent y-o-y relative to the
21.1-percent and 17.3-percent expansions posted
at end-Q3 2017 and end-Q4 2016, respectively.
...as lending sustains growth
due to production activities
The sustained increase in bank lending was due
largely to loans for production activities, which
expanded by 18.5 percent y-o-y in November 2017
from 20.7-percent growth in end-Q3 2017 and
16.9-percent rise in end-Q4 2016.
Chart 22. Loans Outstanding of Commercial Banks
year-on-year growth rates in percent
10
12
14
16
18
20
22
Ma
r 2
01
3
Jun
Se
p
No
v
De
c
Ma
r 2
01
4
Jun
Se
p
No
v
De
c
Ma
r 2
01
5
Jun
Se
p
No
v
De
c
Ma
r 2
01
6
Jun
Se
p
No
v
De
c
Ma
r 2
01
7
Jun
Se
p
No
v
Source: BSP
The expansion in production loans was driven
primarily by increased lending to the following
sectors: real estate activities; electricity, gas,
steam and airconditioning supply; wholesale
and retail trade, repair of motor vehicles and
motorcycles; financial and insurance activities;
manufacturing; and, information and
communication.
Meanwhile, loans for household consumption
grew by 20.6 percent y-o-y as of end-November
2017, higher than the 20.0-percent growth
recorded in end-Q3 2017 but lower than the
23.4-percent increase in end-Q4 2016.

Q4 2017 Inflation Report | | | | 18181818
Monetary Operations
For Q4 2017, market demand for the 7-day TDF
remained strong with average bid-to-cover ratio at
1.1 in Q4 2017. Meanwhile, bid-to-cover ratio for
the 28-day term deposit facility (TDF) stood at
0.8. The results of the auction during the review
quarter reflected the strong demand for other
instruments such as the P255-billion issuance by
the NG of the five-year Retail Treasury Bonds
(RTBs) which was offered on 20-27 November
2017, as well as higher demand for cash by banks
in view of the December holidays. Similarly, the
average bid-to-cover ratio for the RRP facility was
at around 1.0 in Q4 2017.
The offered volume for the 28-day TDF during
the review quarter was calibrated downwards,
consistent with the BSP’s liquidity forecasts.
From P100 billion in October, the offered volume
was decreased to P90 billion in November and
P40 billion for 6 and 13 December. Meanwhile,
the 28-day tenor was not offered during the
20 and 27 December auctions. On the other hand,
the offered volume for the 7-day TDF was
maintained at P40 billion. The TDF auctions are
conducted every Wednesday while the RRP
auction is a daily fine-tuning operation.
Credit Conditions
Credit Standards. Results of the Q4 2017 Senior
Bank Loan Officers’ Survey (SLOS)26
showed that
most of the respondent banks continued to
maintain their credit standards for loans to both
enterprises and households during the quarter
based on the modal approach.27
This is the 35th
consecutive quarter since Q2 2009 that the
majority of respondent banks reported broadly
unchanged credit standards.
26
The survey consists of questions on loan officers’ perceptions
relating to the overall credit standards of universal/commercial
banks (U/KBs) in the Philippines, as well as to factors affecting
the supply of and demand for loans by both enterprises and
households. Survey questionnaires were sent to 35 U/KBs,
of which, 30 banks responded to the current survey
representing a response rate of 85.7 percent. As of
end-October 2017, U/KB loans accounted for about
87.8 percent of the banking system’s gross total outstanding
loans net of interbank loans and RRP agreements with BSP
and other banks. 27
In the modal approach, the results of the survey are analyzed
by looking at the option with the highest share of responses.
Majority of banks keep credit
standards steady
Meanwhile, the diffusion index (DI) approach28,29
showed a net easing of credit standards for loans
extended to both enterprises and households. In
the previous quarter, credit standards for
corporate lending showed a net tightening while
those for household lending were unchanged
based on the DI approach.
Lending to Enterprises. Most banks (88.9 percent
of banks that responded to the question) indicated
that credit standards for loans to enterprises
remained unchanged during the quarter using the
modal approach.
Table 14. General Credit Standards for Loans to
Enterprises (Overall)
Q1 Q2 Q3 Q4 Q1 Q2 Q3 Q4
Tightened Considerably 3.3 0.0 0.0 3.4 0.0 0.0 0.0 0.0
Tightened Somewhat 6.7 9.7 6.9 3.4 6.7 10.0 7.4 3.7
Remained Basically Unchanged 86.7 87.1 93.1 89.7 93.3 90.0 88.9 88.9
Eased Somewhat 3.3 3.2 0.0 3.4 0.0 0.0 3.7 7.4
Eased Considerably 0.0 0.0 0.0 0.0 0.0 0.0 0.0 0.0
Total 100.0 100.0 100.0 100.0 100.0 100.0 100.0 100.0
Diffusion Index for Credit Standards 6.7 6.5 6.9 3.4 6.7 10.0 3.7 -3.7
Weighted Diffusion Index for Credit Standards 5.0 3.2 3.4 3.4 3.3 5.0 1.9 -1.9
Mean 2.9 2.9 2.9 2.9 2.9 2.9 3.0 3.0
Number of Banks Responding 30 31 29 29 30 30 27 27
Note: A pos itive diffus ion index for credi t s ta nda rds indicates that more banks have ti ghtened thei r credit s tanda rds compared to
those that eased ("net tightening"), wherea s a nega tive diffus ion index for credi t s ta nda rds indicates that more banks have ea sed
their credi t s tandards compared to those tha t ti ghtened ("net eas ing").
Source: BSP
2016 2017
Meanwhile, results based on the DI approach
indicated a net easing of credit standards for
business loans, attributed to improved profitability
and liquidity of respondent banks’ portfolios, a
more favorable outlook on the economy, and
banks’ increased tolerance for risk, among others.
In terms of specific credit standards, the net easing
of overall credit standards is reflected in
respondent banks’ increased credit line sizes, less
28
In the diffusion index approach, a positive diffusion index (DI)
for credit standards indicates that the proportion of banks that
have tightened their credit standards are greater compared to
those that eased (“net tightening”), whereas a negative DI for
credit standards indicates that more banks have eased their
credit standards compared to those that tightened (“net
easing”). 29
From Q1 2010 to Q4 2012 survey rounds, the BSP used
largely the DI approach in the analysis of survey results.
Beginning in Q1 2013, the BSP used both the modal and DI
approaches in assessing the results of the survey.
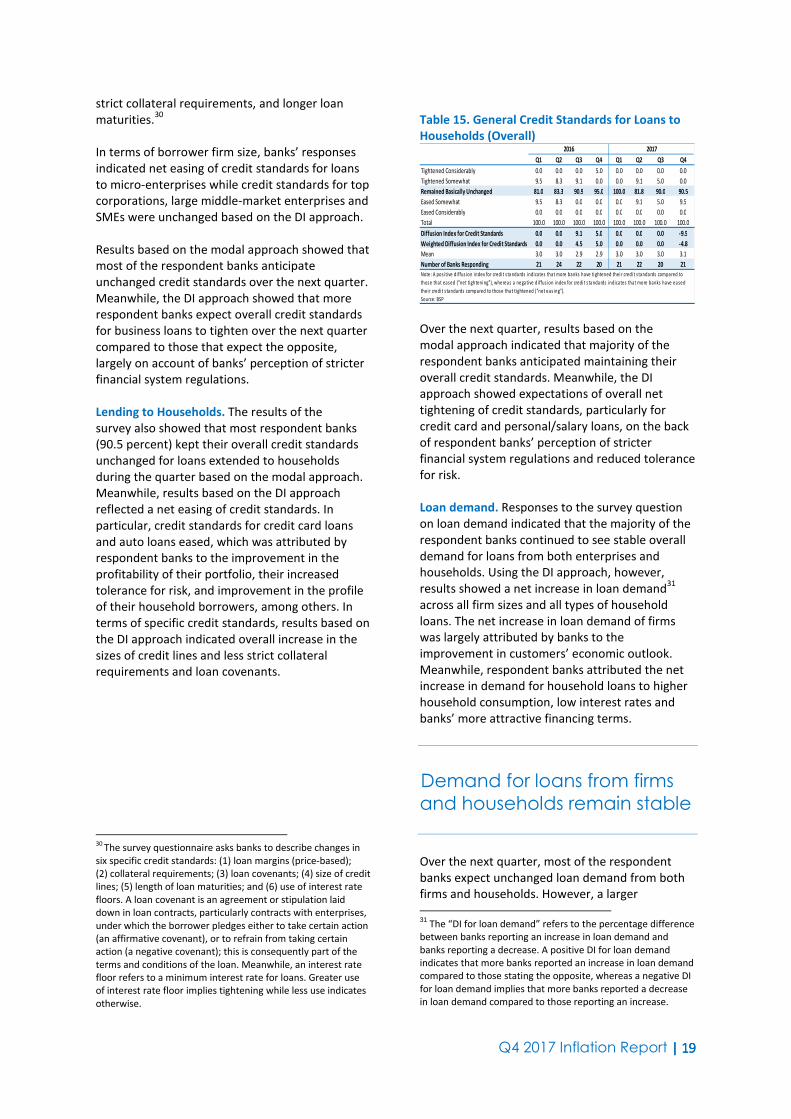
Q4 2017 Inflation Report | | | | 19191919
strict collateral requirements, and longer loan
maturities.30
In terms of borrower firm size, banks’ responses
indicated net easing of credit standards for loans
to micro-enterprises while credit standards for top
corporations, large middle-market enterprises and
SMEs were unchanged based on the DI approach.
Results based on the modal approach showed that
most of the respondent banks anticipate
unchanged credit standards over the next quarter.
Meanwhile, the DI approach showed that more
respondent banks expect overall credit standards
for business loans to tighten over the next quarter
compared to those that expect the opposite,
largely on account of banks’ perception of stricter
financial system regulations.
Lending to Households. The results of the
survey also showed that most respondent banks
(90.5 percent) kept their overall credit standards
unchanged for loans extended to households
during the quarter based on the modal approach.
Meanwhile, results based on the DI approach
reflected a net easing of credit standards. In
particular, credit standards for credit card loans
and auto loans eased, which was attributed by
respondent banks to the improvement in the
profitability of their portfolio, their increased
tolerance for risk, and improvement in the profile
of their household borrowers, among others. In
terms of specific credit standards, results based on
the DI approach indicated overall increase in the
sizes of credit lines and less strict collateral
requirements and loan covenants.
30
The survey questionnaire asks banks to describe changes in
six specific credit standards: (1) loan margins (price-based);
(2) collateral requirements; (3) loan covenants; (4) size of credit
lines; (5) length of loan maturities; and (6) use of interest rate
floors. A loan covenant is an agreement or stipulation laid
down in loan contracts, particularly contracts with enterprises,
under which the borrower pledges either to take certain action
(an affirmative covenant), or to refrain from taking certain
action (a negative covenant); this is consequently part of the
terms and conditions of the loan. Meanwhile, an interest rate
floor refers to a minimum interest rate for loans. Greater use
of interest rate floor implies tightening while less use indicates
otherwise.
Table 15. General Credit Standards for Loans to
Households (Overall)
Q1 Q2 Q3 Q4 Q1 Q2 Q3 Q4
Tightened Considerably 0.0 0.0 0.0 5.0 0.0 0.0 0.0 0.0
Tightened Somewhat 9.5 8.3 9.1 0.0 0.0 9.1 5.0 0.0
Remained Basically Unchanged 81.0 83.3 90.9 95.0 100.0 81.8 90.0 90.5
Eased Somewhat 9.5 8.3 0.0 0.0 0.0 9.1 5.0 9.5
Eased Considerably 0.0 0.0 0.0 0.0 0.0 0.0 0.0 0.0
Total 100.0 100.0 100.0 100.0 100.0 100.0 100.0 100.0
Diffusion Index for Credit Standards 0.0 0.0 9.1 5.0 0.0 0.0 0.0 -9.5
Weighted Diffusion Index for Credit Standards 0.0 0.0 4.5 5.0 0.0 0.0 0.0 -4.8
Mean 3.0 3.0 2.9 2.9 3.0 3.0 3.0 3.1
Number of Banks Responding 21 24 22 20 21 22 20 21
Note: A pos itive diffus ion index for credi t s ta nda rds indicates that more banks have ti ghtened thei r credit s tanda rds compared to
those that eased ("net tightening"), wherea s a nega tive diffus ion index for credi t s ta nda rds indicates that more banks have ea sed
their credi t s tandards compared to those tha t ti ghtened ("net eas ing").
Source: BSP
2016 2017
Over the next quarter, results based on the
modal approach indicated that majority of the
respondent banks anticipated maintaining their
overall credit standards. Meanwhile, the DI
approach showed expectations of overall net
tightening of credit standards, particularly for
credit card and personal/salary loans, on the back
of respondent banks’ perception of stricter
financial system regulations and reduced tolerance
for risk.
Loan demand. Responses to the survey question
on loan demand indicated that the majority of the
respondent banks continued to see stable overall
demand for loans from both enterprises and
households. Using the DI approach, however,
results showed a net increase in loan demand31
across all firm sizes and all types of household
loans. The net increase in loan demand of firms
was largely attributed by banks to the
improvement in customers’ economic outlook.
Meanwhile, respondent banks attributed the net
increase in demand for household loans to higher
household consumption, low interest rates and
banks’ more attractive financing terms.
Demand for loans from firms
and households remain stable
Over the next quarter, most of the respondent
banks expect unchanged loan demand from both
firms and households. However, a larger
31
The “DI for loan demand” refers to the percentage difference
between banks reporting an increase in loan demand and
banks reporting a decrease. A positive DI for loan demand
indicates that more banks reported an increase in loan demand
compared to those stating the opposite, whereas a negative DI
for loan demand implies that more banks reported a decrease
in loan demand compared to those reporting an increase.

Q4 2017 Inflation Report | | | | 20202020
proportion of respondents expect overall demand
for corporate and household loans (except credit
card loans) to increase further in the next quarter
relative to those who indicated the opposite.
Respondent banks cited expectations of higher
investment in plant or equipment, increased
working capital needs, and improvement in the
economic outlook of borrower firms as the key
factors behind the expected increase in demand
for business loans. Meanwhile, the anticipated net
increase in household loan demand was attributed
by respondent banks to expectations of more
attractive financing terms offered to clients and
low interest rates along with higher household
consumption.
Real Estate Loans. Most of the respondent banks
(73.7 percent) indicated unchanged credit
standards for commercial real estate loans in Q4
2017. The DI approach, however, continued to
indicate a net tightening of overall credit standards
for commercial real estate loans for the 8th
consecutive quarter. The tighter overall credit
standards for commercial real estate loans
reflected respondent banks’ wider loan margins,
reduced credit line sizes, stricter collateral
requirements and loan covenants, shorter loan
maturities, and increased use of interest rate
floors. Over the next quarter, while majority of the
respondent banks foresee maintaining their credit
standards for commercial real estate loans,
DI-based results point to expectations of
continued net tightening of credit standards for
the said type of loan.
Majority of banks maintain
credit standards for real
estate loans
Demand for commercial real estate loans was also
unchanged in Q4 2017 based on the modal
approach. A number of banks, however, indicated
increased demand for the said type of loan on the
back of increased investment in plant and
equipment, improvement in borrower firms’
economic outlook, banks’ more attractive
financing terms and lower interest rates. Over the
next quarter, although most of the respondent
banks anticipate generally steady loan demand,
a number of banks expect demand for commercial
real estate loans to continue to increase.
Meanwhile, in the case of housing loans extended
to households, results based on both modal and DI
approaches point to unchanged credit standards
as all of the respondent banks (100.0 percent)
reported that they maintained credit standards.
The unchanged credit standards for housing loans
was attributed by respondent banks largely to
unchanged profile of household borrowers, their
stable economic outlook as well as unchanged
tolerance for risk for the said type of loan. Over
the next quarter, results based on both the modal
and diffusion index approaches likewise showed
that banks foresee unchanged overall credit
standards for housing loans on the back of
their unchanged tolerance for risk, their stable
economic outlook, and steady profile of housing
loan borrowers. At the same time, results
continued to show increased demand for housing
loans in Q4 2017 as well as expectations of a
sustained increase in demand for the said type of
loan in the next quarter.
Interest Rates
Primary Interest Rates
In Q4 2017, the weighted average interest rates
for 91-day, 182-day and 364-day T-bills in the
primary market decreased to 2.034 percent,
2.497 percent, and 2.878 percent, respectively,
from 2.128 percent, 2.548 percent, and
2.936 percent in the previous quarter.
T-bill rates in the primary
market decrease
The results of the auction reflected market
players’ continued strong preference for
shorter-tenored notes amid geopolitical
concerns overseas.

Q4 2017 Inflation Report | | | | 21212121
Chart 23. Treasury Bill Rates
in percent
0
1
2
3
4
Q1
2013
Q1 Q2 Q3 Q1
2014
Q4 Q1 Q2 Q1
2015
Q3 Q4 Q1 Q1
2016
Q2 Q3 Q4 Q1
2017
Q2 Q3 Q4
91-day T-bill Rate
182-day T-bill Rate
364-day T-bill Rate
Source: BTr
Yield Curve. As of end-December 2017,
the secondary market yield for government
securities (GS) for all tenors rose relative to
the end-September 2017 levels, following
the US Federal Reserve interest rate hike on
13 December 2017.
Yield curve rose in end-
December 2017
Debt paper yields were higher by a range of
10.6 bps (5-year GS) to 109.0 bps (10-year GS)
compared to end-September 2017 levels.
Chart 24. Yields of Government Securities in the
Secondary Market in percent
0
1
2
3
4
5
6
3Mo 6Mo 1Yr 2Yr 3yr 4Yr 5Yr 7Yr 10Yr 20Yr
Dec 2016
Sep 2017
Dec 2017
Source: Bloomberg
Relative to year-ago levels, the secondary market
yields of GS for all maturities likewise increased by
a range of 0.1 bp for the 5-year GS to 107.1 bps for
the 10-year GS.
Interest Rate Differentials. The average
differentials between domestic and US interest
rates, gross and net of tax, narrowed further in
Q4 2017 relative to the previous quarter.
Interest rate differentials
continue to narrow
The average 91-day RP T-bill rate declined q-o-q
by 3.9 bps to 2.085 percent in Q4 2017 from
2.124 percent in Q3 2017. However, the average
US 90-day LIBOR and the US 90-day T-bill rate
increased by 16.9 bps and 18.3 bps, respectively,
to 1.484 percent and 1.289 percent in Q4 2017.
These developments led to narrower positive
gross and net of tax differentials between the
91-day RP T-bill rate and US interest rates.
Domestic interest rates declined due mainly to
robust demand. In addition, following the
P255-billion issuance of 5-year Retail Treasury
Bonds (RTBs) in November 2017, the NG rejected
all bids during the 27-November and 11-December
auctions. Meanwhile, foreign interest rates rose
during the quarter following the US Fed policy rate
hike and the passage of a tax-cut legislation by the
US Congress on 22 December 2017.
Chart 25. Interest Rate Differentials
quarterly averages; in basis points
-50
0
50
100
150
200
250
Q1
20
13
Q4
Q1
Q2
Q1
20
14
Q3
Q4
Q1
Q1
20
15
Q2
Q3
Q4
Q1
20
16
Q2
Q3
Q4
Q1
20
17
Q2
Q3
Q4
RP 91-day T-bill vs. US 90-day LIBOR (before tax) RP 91-day T-bill vs. US 90-day T-bill (before tax)
RP 91-day T-bill vs. US 90-day LIBOR (after tax) RP 91-day T-bill vs. US 90-day T-bill (after tax)
Source: Bloomberg, BTr and BSP
The positive differential between the BSP's
overnight borrowing or RRP rate and the
US Fed funds target rate narrowed to a range
of 150-175 bps in Q4 2017 from 175-200 bps in
Q3 2017, reflecting the impact of the 25-bp
increase in the US Fed funds target rate to
1.25-1.50 percent on 14 December 2017.

Q4 2017 Inflation Report | | | | 22222222
Chart 26. BSP RRP Rate and US Federal Funds
Target Rate
in percent
-1
0
1
2
3
4
5
Q1
20
13
Q4
Q1
Q2
Q1
20
14
Q3
Q4
Q1
Q1
20
15
Q2
Q3
Q4
Q1
20
16
Q2
Q3
Q4
Q1
20
17
Q2
Q3
Q4
BSP RRP Rate US Federal Funds Target Rate
Source: Bloomberg and BSP
Meanwhile, the interest rate differential between
the BSP’s overnight RRP rate and the US Fed funds
target rate adjusted for risk32
narrowed further to
79 bps as of end-December 2017 from 94 bps in
end-September 2017. This development could be
traced to a lower risk premium, following the
18-bp and 8-bp increases in the 10-year US note
and 10-year ROP note to 2.27 percent and
2.98 percent, respectively.
Chart 27. Risk-Adjusted Differentials
in basis points
45
70
95
120
145
170
195
220
245
270
295
320
Q1
20
13
Q4
Q1
Q2
Q1
20
14
Q3
Q4
Q1
Q1
20
15
Q2
Q3
Q4
Q1
20
16
Q2
Q3
Q4
Q1
20
17
Q2
Q3
Q4
Source: Bloomberg and BSP
The 10-year US and 10-year ROP notes rose on
higher US growth and inflation expectations
following the passage of a tax-cut legislation by
the US Congress; investors’ demand for safe-haven
assets amid the geopolitical tensions in North
Korea and Iran, and the European Central Bank’s
(ECB) decision to prolong its bond-buying program;
and the release of better-than-expected US data
showing lower unemployment and higher wages.
Domestic real lending rate33
increased to
0.38 percent in December 2017 from 0.06 percent
in September 2017. This was due to the 20-bp rise
32
The difference between the 10-year ROP note and the
10-year US Treasury note is used as proxy for the risk premium. 33
Real lending rate is measured as the difference between
actual bank lending rate and inflation.
in actual bank lending rate34
to 3.7 percent in
December 2017 combined with the 10-bp decline
in inflation to 3.3 percent.
Real lending rate increases
The Philippines’ real lending rate is the lowest in
a sample of 10 Asian countries in December 2017,
with Indonesia recording the highest real lending
rate at 7.2 percent followed by Thailand at
5.2 percent while Japan posted the second lowest
at 0.4 percent.
Chart 28. Philippines’ Real Lending Rate
in percent
-1
0
1
2
3
4
Mar
2013
Jun Sep Dec Mar
2014
Jun Sep Dec Mar
2015
Jun Sep Dec Mar
2016
Jun Sep Dec Mar
2017
Jun Sep Dec
Source: PSA and BSP
Financial Market Conditions
The domestic financial system showed solid
performance during the review quarter. Positive
outturns on the domestic front such as the strong
Q3 GDP, legislative support for the tax reform
program and the recent credit rating upgrade
resulted in upbeat investor sentiment on
Philippine assets.
Domestic financial market
conditions reflect external
uncertainty
Stock Market. The Philippine Stock Exchange
index (PSEi) rose by 4.2 percent, q-o-q, in Q4 2017,
to average 8,354.1 index points.
34
The actual bank lending rate for the Philippines is the
weighted average interest rate charged by reporting
commercial banks on loans and discounts granted during the
period.

Q4 2017 Inflation Report | | | | 23232323
Chart 29. Quarterly Average PSEi
In basis points
5,500
6,000
6,500
7,000
7,500
8,000
8,500
9,000
Q1
2013
Q2 Q3 Q4 Q1
2014
Q2 Q3 Q4 Q1
2015
Q2 Q3 Q4 Q1
2016
Q2 Q3 Q4 Q1
2017
Q2 Q3 Q4
Source: Philippine Stock Exchange, BSP
The benchmark index surpassed the 8,000-point
mark on the following factors: investors’ optimism
over the end of hostilities in Marawi in October;
strong economic prospects following a robust
Q3 GDP growth and positive Q3 earnings results;
the subdued domestic inflation for November;
the signing into law of the Tax Reform for
Acceleration and Inclusions (TRAIN) bill; and Fitch
Ratings’ latest rating upgrade for the Philippines.
Fitch Rating’s upgrade and
robust Q3 GDP growth boost
stock exchange index
Moreover, the nomination of a perceived dovish
new Federal Reserve Chief in Jerome Powell,35
the bullish outlook on the economic performance
of the US and Europe, and corporate window
dressing towards end-2017 helped the PSEi breach
the 8,000 mark. However, the rally was partly
tempered by concerns over the missile tests
conducted by North Korea.
Mirroring the rally in domestic shares, total market
capitalization went up by 2.8 percent q-o-q to
reach P17.58 trillion as of 29 December 2017.
The price-earnings ratio for listed firms rose from
the 22.72x in end-September to 23.10x as of
29 December 2017, indicating investors’ continued
willingness to hold domestic shares. Moreover,
preliminary data from the PSE showed that foreign
investors were net buyers of P0.29-billion worth of
domestic stocks during the review period.
35
Mr. Powell’s moderate stance at a confirmation hearing in
November reiterated the US Fed's current policy of increasing
interest rates slowly if the pace of economic growth remains
steadfast.
Government Securities. Results of the T-bill
auctions conducted in Q4 2017 (October -
December) continued to show healthy demand for
T-bills with total subscription for the quarter
amounting to P158.5 billion, about 1.8 times the
P90.0-billion total offered amount. The
oversubscription for the quarter, at P68.5 billion,
was lower than the P166.7 billion oversubscription
in the previous quarter.
Demand for local GS remains
robust
The Bureau of Treasury (BTr) awarded in full the
₱6.0-billion, ₱5.0-billion, and ₱4.0-billion offered
amounts for the 91-, 182-, and 364-day T-bills,
respectively, in the 9- and 23-October auctions.
For the 16-November auction, the BTr awarded in
full the ₱8.0-billion and ₱6.0-billion offered
amounts for the 91- and 182-day T-bills, while
partially awarding ₱4.5 billion of the offered
₱6.0 billion for the 364-day T-bills. Meanwhile, the
BTr rejected all bids for the 91-, 182- and 364-day
T-bills during the 27-November and 11-December
auctions on account of market players weak
appetite, following the P255-billion issuance by
the NG of the five-year Retail Treasury Bonds
(RTBs) which was offered to the public on
20-27 November 2017.
Chart 30. Total Oversubscription of T-bill Auctions
0
20
40
60
80
100
120
140
160
180
200
Q1
2013
Q2 Q3 Q4 Q1
2014
Q2 Q3 Q4 Q1
2015
Q2 Q3 Q4 Q1
2016
Q2 Q3 Q4 Q1
2017
Q2 Q3 Q4
Source: Bureau of the Treasury
Sovereign Bond and CDS Spreads. In October,
debt spreads narrowed as investor concerns
remained muted. On the domestic front, investor
sentiment improved on indications that the Senate
would be supporting an immediate passage of the
comprehensive tax reform measure. In addition,
the Philippine government has declared the end of
the Marawi war crisis.
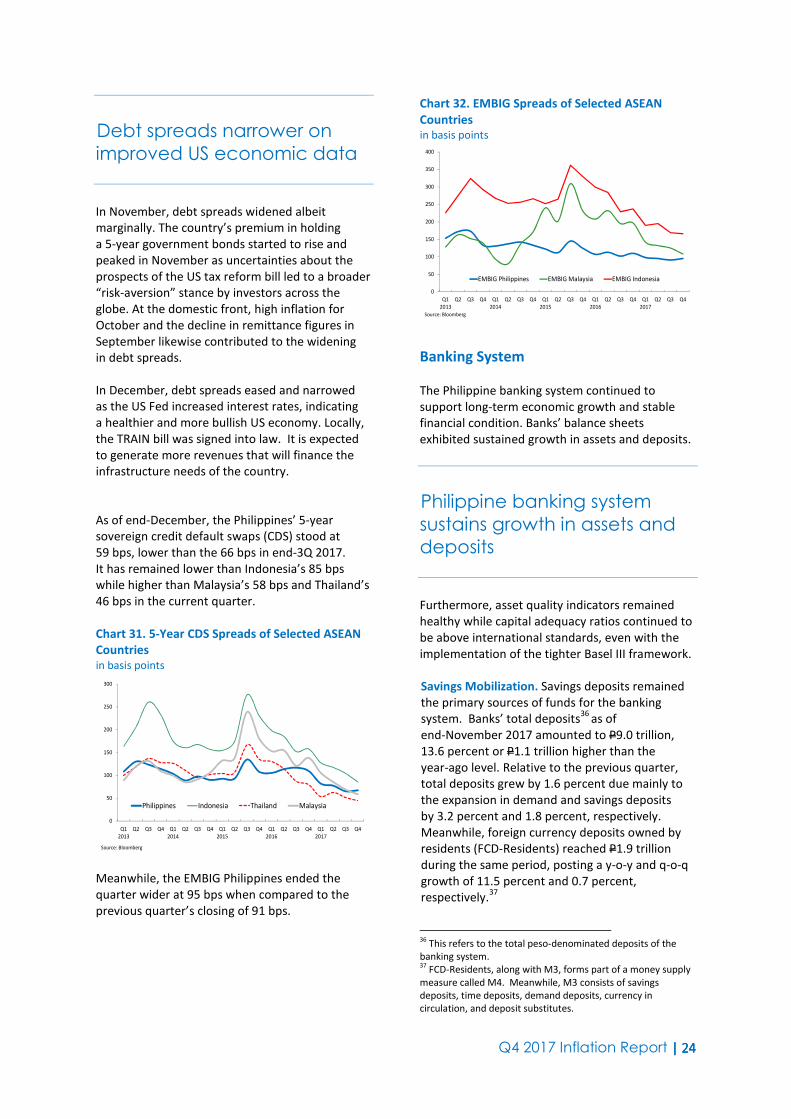
Q4 2017 Inflation Report | | | | 24242424
Debt spreads narrower on
improved US economic data
In November, debt spreads widened albeit
marginally. The country’s premium in holding
a 5-year government bonds started to rise and
peaked in November as uncertainties about the
prospects of the US tax reform bill led to a broader
“risk-aversion” stance by investors across the
globe. At the domestic front, high inflation for
October and the decline in remittance figures in
September likewise contributed to the widening
in debt spreads.
In December, debt spreads eased and narrowed
as the US Fed increased interest rates, indicating
a healthier and more bullish US economy. Locally,
the TRAIN bill was signed into law. It is expected
to generate more revenues that will finance the
infrastructure needs of the country.
As of end-December, the Philippines’ 5-year
sovereign credit default swaps (CDS) stood at
59 bps, lower than the 66 bps in end-3Q 2017.
It has remained lower than Indonesia’s 85 bps
while higher than Malaysia’s 58 bps and Thailand’s
46 bps in the current quarter.
Chart 31. 5-Year CDS Spreads of Selected ASEAN
Countries
in basis points
0
50
100
150
200
250
300
Q1
2013
Q2 Q3 Q4 Q1
2014
Q2 Q3 Q4 Q1
2015
Q2 Q3 Q4 Q1
2016
Q2 Q3 Q4 Q1
2017
Q2 Q3 Q4
Philippines Indonesia Thailand Malaysia
Source: Bloomberg
Meanwhile, the EMBIG Philippines ended the
quarter wider at 95 bps when compared to the
previous quarter’s closing of 91 bps.
Chart 32. EMBIG Spreads of Selected ASEAN
Countries in basis points
0
50
100
150
200
250
300
350
400
Q1
2013
Q2 Q3 Q4 Q1
2014
Q2 Q3 Q4 Q1
2015
Q2 Q3 Q4 Q1
2016
Q2 Q3 Q4 Q1
2017
Q2 Q3 Q4
EMBIG Philippines EMBIG Malaysia EMBIG Indonesia
Source: Bloomberg
Banking System
The Philippine banking system continued to
support long-term economic growth and stable
financial condition. Banks’ balance sheets
exhibited sustained growth in assets and deposits.
Philippine banking system
sustains growth in assets and
deposits
Furthermore, asset quality indicators remained
healthy while capital adequacy ratios continued to
be above international standards, even with the
implementation of the tighter Basel III framework.
Savings Mobilization. Savings deposits remained
the primary sources of funds for the banking
system. Banks’ total deposits36
as of
end-November 2017 amounted to P9.0 trillion,
13.6 percent or P1.1 trillion higher than the
year-ago level. Relative to the previous quarter,
total deposits grew by 1.6 percent due mainly to
the expansion in demand and savings deposits
by 3.2 percent and 1.8 percent, respectively.
Meanwhile, foreign currency deposits owned by
residents (FCD-Residents) reached P1.9 trillion
during the same period, posting a y-o-y and q-o-q
growth of 11.5 percent and 0.7 percent,
respectively.37
36
This refers to the total peso-denominated deposits of the
banking system. 37
FCD-Residents, along with M3, forms part of a money supply
measure called M4. Meanwhile, M3 consists of savings
deposits, time deposits, demand deposits, currency in
circulation, and deposit substitutes.

Q4 2017 Inflation Report | | | | 25252525
Chart 33. Deposit Liabilities of Banks
in billion pesos
0
1,000
2,000
3,000
4,000
5,000
6,000
7,000
8,000
9,000
10,000M
ar
20
13
Jun
Se
p
No
v
De
c
Ma
r 2
01
4
Jun
Se
p
No
v
De
c
Ma
r 2
01
5
Jun
Se
p
No
v
De
c
Ma
r 2
01
6
Jun
Se
p
No
v
De
c
Ma
r 2
01
7
Jun
Se
p
No
v
Demand Savings Time
Source: BSP
Institutional Developments. The total resources of
the banking system grew by 12.2 percent to reach
P15.1 trillion as of end-November 2017 from
P13.5 trillion a year ago, and by 1.2 percent
relative to the end-September 2017 level. As a
percent of GDP, total resources stood at
98.0 percent.38
Total resources of the banking
system continue to rise
Chart 34. Total Resources of the Banking System
levels in billion pesos; share in percent
50
60
70
80
90
100
110
4,000
5,000
6,000
7,000
8,000
9,000
10,000
11,000
12,000
13,000
14,000
15,000
16,000
Ma
r 2
01
3
Jun
Sep
No
v
De
c
Ma
r 2
01
4
Jun
Sep
No
v
De
c
Ma
r 2
01
5
Jun
Sep
No
v
De
c
Ma
r 2
01
6
Jun
Sep
No
v
De
c
Ma
r 2
01
7
Jun
Sep
No
v
Total Resources (LHS) as % of GDP (RHS)
Source: BSP
The number of banking institutions (head offices)
decreased to 592 offices as of end-September
2017 from 613 offices a year ago and 595 offices a
quarter ago. The banks’ head offices were
comprised of 43 U/KBs, 57 thrift banks (TBs), and
492 rural banks (RBs). This indicated continued
consolidation of banks as well as the exit of
weaker players in the banking system.
38 GDP as of the third quarter of 2017.
Chart 35. Number of Banking Institutions
1,000
1,500
2,000
2,500
3,000
3,500
4,000
4,500
5,000
5,500
6,000
6,500
7,000
Mar
2013
Sep Mar
2014
Sep Mar
2015
Sep Mar
2016
Sep Mar
2017
Sep
Universal and Commercial Banks Thrift Banks Rural Banks
Source: BSP
Meanwhile, the operating network (head
offices and branches/agencies) of the banking
system expanded to 11,571 offices as of
end-September 2017 from 11,024 offices a year
ago and 11,393 offices a quarter ago, due mainly
to the increase in branches/offices across U/KBs,
TBs, and RBs.
The Philippine banking system’s gross
non-performing loan (GNPL) ratio improved to
1.90 percent as of end-November 2017 relative to
the 2.03 percent registered a year ago and the
end-September 2017 ratio of 1.91 percent.
Asset quality of Philippine
banks remain healthy
Banks’ initiatives to improve their asset quality
along with prudent lending regulations helped
maintain the GNPL ratio below its pre-Asian crisis
level of 3.5 percent.39
Chart 36. Ratios of Gross Non-Performing Loans
and Net Non-Performing Loans to Total Loans
in percent
0.2
0.3
0.4
0.5
0.6
0.7
0.8
0.9
1.0
1.5
1.7
1.9
2.1
2.3
2.5
2.7
2.9
3.1
3.3
3.5
3.7
3.9
4.1
Ma
r 2
01
3
Jun
Se
p
No
v
De
c
Ma
r 2
01
4
Jun
Se
p
No
v
De
c
Ma
r 2
01
5
Jun
Se
p
No
v
De
c
Ma
r 2
01
6
Jun
Se
p
No
v
De
c
Ma
r 2
01
7
Jun
Se
p
No
v
Gross NPLs/Total Loans (LHS)
Net NPLs/Total Loans (RHS)
Source: BSP
39
The 3.5 percent NPL ratio was based on the pre-2013
definition.

Q4 2017 Inflation Report | | | | 26262626
Similarly, the net non-performing loan (NNPL) ratio
increased to 0.9 percent as of end-November 2017
relative to the previous year’s ratio of 0.7 percent
but remained unchanged with respect to the end-
September 2017 ratio. In computing for the
NNPLs, specific allowances for credit losses on
Total Loan Portfolio (TLP) are deducted from the
GNPLs. Said allowances increased to ₱90.0 billion
in end-November 2017 from ₱86.6 billion posted
as of end-September 2017.40
The Philippine banking system’s GNPL ratio of
1.9 percent was higher with respect to that of
South Korea (1.2 percent) and Malaysia
(1.2 percent) but lower than that of Indonesia
(2.9 percent) and Thailand (3.0 percent).41
Loan exposures of banks remained adequately
covered as the banking system registered an
NPL coverage ratio of 114.6 percent as of
end-November 2017. This was the same with the
ratio registered a year ago but slightly higher than
the end-September 2017 ratio of 114.2 percent.
U/KBs’ CAR remains above
international and regulatory
standards
The capital adequacy ratio (CAR) of U/KBs as of
end-June 2017 improved to 15.3 percent on solo
basis, relative to the previous quarter’s ratio of
15.0 percent. Likewise, the CAR on a consolidated
basis, increased to 16.0 percent from the quarter-
ago ratio of 15.8 percent. These figures were well
above the BSP regulatory threshold of
10.0 percent and international minimum of
8.0 percent.
40
This type of provisioning applies to loan accounts classified
under loans especially mentioned (LEM), substandard-secured
loans, substandard-unsecured loans, doubtful accounts and
loans considered as loss accounts. 41
Sources: South Korea (Domestic Banks’ Substandard or Below
Loans [SBLs] ratio, Q3 2017); Malaysia (Banking System’s Ratio
of net impaired loans to net total loans, November 2017);
Indonesia, IMF and financial stability reports (Banks’
Nonperforming Loans to Gross Loans Ratio, Q2 2017); and
Thailand (Total Financial Institutions’ Gross NPLs ratio,
Q3 2017).
Chart 37. Capital Adequacy Ratio of Univeral and
Commercial Banks
in percent
14
15
16
17
18
19
20
Mar
2013
Jun Sep Dec Mar
2014
Jun Sep Dec Mar
2015
Jun Sep Dec Mar
2016
Jun Sep Dec Mar
2017
Jun
Solo Basis Consolidated Basis
Source: BSP
The CAR of Philippine U/KBs, on a consolidated
basis, was higher than that of South Korea
(15.4 percent) but lower than that of Malaysia
(17.0 percent), Thailand (18.5 percent) and
Indonesia (26.7 percent).42
Exchange Rate On a q-o-q basis, the peso averaged P50.93/US$1,
depreciating slightly against the US dollar by
0.19 percent from the previous quarter’s average
of P50.84/US$1.
Peso depreciates against the
US dollar in Q4 2017
The peso’s depreciation during the review period
was due partly to the planned US corporate tax
cuts and expectations of strong third quarter US
GDP. Depreciation pressures were, however,
partly offset by the country’s stronger-than-
expected third quarter GDP growth and the
passage of the TRAIN bill into law. On a y-o-y
basis, the peso depreciated by 3.59 percent
relative to the P49.11/US$1 average in Q4 2016.43
42
Sources: South Korea (Domestic Banks’ Capital Ratio,
Q2 2017); Malaysia (Banking System’s Total Capital Ratio,
November 2017); Thailand (Commercial Banks’ Capital Funds
Percentage of Risk Assets, October 2017); and Indonesia, IMF
and financial stability reports (Commercial Banks, Regulatory
Capital to Risk-Weighted Assets Ratio Q2 2017).
43
Dollar rates (per peso) or the reciprocal of the peso-dollar
rates were used to compute for the percentage change.

Q4 2017 Inflation Report | | | | 27272727
Chart 38. Quarterly Peso-Dollar Rate PHp/US$; average per quarter
39
40
41
42
43
44
45
46
47
48
49
50
51
52
Q1
2013
Q2 Q3 Q4 Q1
2014
Q2 Q3 Q4 Q1
2015
Q2 Q3 Q4 Q1
2016
Q2 Q3 Q4 Q1
2017
Q2 Q3 Q4
Source: Reference Exchange Rate Bulletin, Treasury Department, BSP
In October, the peso averaged P51.34/US$1,
depreciating by 0.65 percent from the
P51.01/US$1 average in September as
markets turned bullish following reports of
better-than-expected US economic data on
services and manufacturing; and expectations of
stronger third quarter US GDP. The strengthening
of the dollar against the euro following the
European Central Bank (ECB)’s decision to prolong
its bond-buying program likewise added pressure
to the peso.
Meanwhile, the peso averaged P51.04/US$1 in
November, appreciating by 0.60 percent from
the October average. The strong performance of
the peso was due mainly to: (i) the appointment
of widely perceived “dovish” Fed Governor
Jerome H. Powell as the new US Fed chair;
(ii) growing skepticism on planned corporate
tax cut in the US; and (iii) the country’s
stronger-than-expected Q3 GDP growth.
The appreciation of the peso continued in
December as it averaged P50.39/US$1, gaining
1.28 percent from the November average. The
peso’s appreciation was due mainly to the passage
of the TRAIN bill into law and amid strong OF
(overseas Filipino) remittance and profit taking by
market players ahead of the holiday season.
On a year-to-date basis, the peso depreciated
against the US dollar by 0.42 percent on
29 December 2017 as it closed at P49.93/US$1.
This is in contrast with the strengthening of
monitored Asian currencies during the same
period, except for the Indonesian Rupiah which
likewise depreciated against the US dollar.44
44
Based on the last done deal transaction in the afternoon.
Table 16. Year-to-Date Changes in Selected Dollar
Rates appreciation/(-depreciation); in percent
2013 2014 2015 2016 2017*
Korean Won 1.13 -4.34 -6.61 -2.63 13.16
Thai Baht (Onshore) -4.59 -0.68 -8.86 0.14 9.69
Singaporean Dollar -2.72 -4.52 -5.99 -1.99 8.23
Indian Rupee -11.40 -2.94 -4.93 -2.88 6.27
Indonesian Rupiah -19.07 -2.08 -9.81 2.32 -0.64
Philippine Peso -7.02 -0.73 -4.97 -5.35 -0.42
Japanese Yen -16.26 -12.46 -0.47 3.33 3.83
Malaysian Ringgit -5.47 -6.30 -18.55 -4.21 10.69
Chinese Yuan 2.60 -2.70 -4.33 -6.62 6.68
New Taiwan Dollar -1.95 -6.16 -3.63 1.89 8.76Notes:
- Negative value represents depreciation of the currency against the US dollar.
- YTD changes are computed as the percent change between the closing prices for the
year indicated versus the closing prices for the preceding year.
* Data as of 4:00 p.m., 29 December 2017
Source: Treasury Department - BSP
Nonetheless, the sustained inflows of foreign
exchange from overseas Filipino remittances,
foreign direct investments, BPO receipts, and
recovery of exports, as well as the ample level
of the country’s gross international reserves and
the country’s robust economic growth, continued
to provide support to the peso.45
Meanwhile, the volatility of the peso’s daily closing
rates (as measured by the coefficient of variation)
stood at 1.02 percent during the review quarter,
higher than the 0.61 percent registered in the
previous quarter.46
Relative to other currencies in
the region, the volatility of the peso remained in
the middle of the pack.47
On a real trade-weighted basis, the peso gained
external price competitiveness in October and
November 2017 against the basket of currencies
of all trading partners (TPI), trading partners in
advanced (TPI-A) and developing countries (TPI-D).
Relative to Q3 2017, the real effective exchange
rate (REER) index of the peso decreased by
0.15 percent, 0.23 percent, and 0.41 percent,
45
As of end-November 2017, country’s gross international
reserves (GIR) stood at US$80.3 billion (revised). This can cover
8.4 months’ worth of imports of goods and payments of
services and primary income. It is also equivalent to 5.4 times
the country’s short-term external debt based on original
maturity and 3.7 times based on residual maturity. Foreign
direct investments (FDI) remained positive and registered a net
inflow of US$5.8 billion as of end-September 2017. Remittances
from OF workers continue to flow in from various geographical
locations globally, for the period January to October 2017, cash
remittances from OFs amounted to US$25.7 billion. Exports of
goods grew y-o-y by 18 percent in the first half of 2017. As of
end-June 2017, business process outsourcing (BPO) and
tourism receipts reached US$11.0 billion and US$3.1 billion,
respectively. 46
The coefficient of variation is computed as the standard
deviation of the daily closing exchange rate divided by the
average exchange rates for the period. 47
The volatility of the peso was higher than that of Indonesian
rupiah, Chinese yuan, Singapore dollar, Japanese yen, and
Thailand baht but lower than that of Malaysian ringgit and
South Korean won.

Q4 2017 Inflation Report | | | | 28282828
against the TPI, TPI-A, and TPI-D baskets,
respectively. The nominal depreciation of the
peso, partly countered by widening inflation
differential, contributed in the general decline
in the REER.48,49
Relative to Q4 2016, the peso likewise gained
external price competitiveness in October and
November 2017 against the TPI, TPI-A, and TPI-D
baskets. This developed as the nominal
depreciation of the peso offset the impact of
widening inflation differential against these
currency baskets, resulting to a decrease in
the REER index of the peso by 4.10 percent,
2.68 percent, and 5.06 percent against the TPI,
TPI-A, and TPI-D baskets, respectively.
48
The Trading Partners Index (TPI) measures the nominal and
real effective exchange rates of the peso across the currencies
of 14 major trading partners of the Philippines, which includes
US, Euro Area, Japan, Australia, China, Singapore, South Korea,
Hong Kong, Malaysia, Taiwan, Indonesia, Saudi Arabia, United
Arab Emirates, and Thailand. The TPI-Advanced measures the
effective exchange rates of the peso across currencies of
trading partners in advanced countries comprising of the US,
Japan, Euro Area, and Australia. The TPI-Developing measures
the effective exchange rates of the peso across 10 currencies of
partner developing countries which includes China, Singapore,
South Korea, Hong Kong, Malaysia, Taiwan, Indonesia, Saudi
Arabia, United Arab Emirates, and Thailand. 49
The REER index represents the Nominal Effective Exchange
Rate (NEER) index of the peso, adjusted for inflation rate
differentials with the countries whose currencies comprise the
NEER index basket. A decrease in the REER index indicates
some gain in the external price competitiveness of the peso,
while a significant increase indicates the opposite. The NEER
index, meanwhile, represents the weighted average exchange
rate of the peso vis-à-vis a basket of foreign currencies.

Q4 2017 Inflation Report | | | | 29292929
III. Fiscal Developments
The National Government’s (NG) fiscal position
was in a deficit of P243.5 billion for January-
November 2017, higher by 4 percent than the
deficit posted in the comparable period in 2016.
Fiscal deficit higher for
January – November 2017
Netting out the interest payments in expenditures,
the NG registered a primary surplus amounting to
P46.5 billion, lower by 7 percent compared to the
primary surplus in 2016.
Table 17. National Government Fiscal
Performance
in billion pesos
Nov Jan-Nov Nov Jan-Nov Nov Jan-Nov
Surplus/(Deficit) -19.1 -235.2 -8.6 -243.5 -55.0 4.0
Revenues 209.2 2,030.6 243.5 2,250.0 16.0 11.0
Expenditures 228.4 2,265.8 252.1 2,493.5 10.0 10.0
* Tota ls may not add up due to rounding
Source: Bureau of the Trea sury (BTr)
Growth Rate
(in percent)2016 2017
For the period January - November 2017, revenues
increased by 11 percent to P2,250.0 billion
compared to P2,030.6 billion in the same period in
2016. Revenue from tax increased as collections
from Bureau of Internal Revenue and Bureau of
Customs grew by 12 percent and 14 percent,
respectively. Meanwhile, non-tax revenues
declined as income from Bureau of the Treasury
decreased by 9 percent.
On the other hand, expenditures for the period in
review reached P2,493.5 billion, 10 percent higher
than the expenditures in the previous year.
Excluding interest payments, expenditures went
up by 11 percent to P2,203.5 billion. Meanwhile,
interest payments were higher by P4.6 billion
compared to its year-ago level. This brought
interest payments for the first eleven months
of the year to P290.0 billion.

Q4 2017 Inflation Report | | | | 30303030
IV. External Developments
The JP Morgan Global All-Industry Output Index
rose to 54.4 in December from 54.1 in November
as output growth accelerated in both the
manufacturing and service sectors, underpinned
by a steep increase in new business.
Global economic activity
strengthens further
Economic activity increased at faster rates in
China, the UK, India, and Australia. Growth slowed
slightly in the US and Russia but remained solid in
both cases. Meanwhile, economic activity in Brazil
remained in the contraction territory.50
Chart 39. JP Morgan Global All-Industry Output
Index index points
50
51
52
53
54
55
56
Q1
2013
Q2 Q3 Q4 Q1
2014
Q2 Q3 Q4 Q1
2015
Q2 Q3 Q4 Q1
2016
Q2 Q3 Q4 Q1
2017
Q2 Q3 Q4
*August 2017
Source: Markit Economics
US. Real GDP expanded by 2.3 percent on a
seasonally adjusted y-o-y basis in Q3 2017, higher
than the 2.2-percent growth rate in Q2 2017.
On a q-o-q basis, real output growth rose slightly
to 3.2 percent from 3.1 percent in the previous
quarter. The q-o-q growth in real GDP reflected
positive contributions from personal consumption
expenditures, private inventory investment,
nonresidential fixed investment, exports, federal
government spending, and state and local
government spending.51
50
JP Morgan Global Manufacturing & Services PMI,
http://www.markiteconomics.com/ 51
US Bureau of Economic Analysis, “Gross Domestic Product:
Third Quarter 2017 (Third Estimate),” news release, 21
December 2017.
https://www.bea.gov/newsreleases/national/gdp/2017/pdf/gd
p3q17_3rd.pdf
Growth in the US economy
holds firm
Meanwhile, the manufacturing PMI registered
59.7 in December, higher than the reading of
58.2 percent in November due to gains in new
orders and production indexes.52
The unemployment rate was 4.1 percent in
December, unchanged from the rate posted in
November. Total nonfarm employment rose by
148,000 in December, with gains in health care,
construction, and manufacturing. Meanwhile,
on a y-o-y basis, inflation fell to 2.1 percent in
December from 2.2 percent in November due
primarily to the decrease in the gasoline price
index.
The Thomson-Reuters/University of Michigan
Index of Consumer Sentiment decreased to
95.9 in December from 98.5 in November.53
The Conference Board Consumer Confidence Index
likewise fell to 122.1 in December from 128.6 in
November.54
Consumers’ optimism about the
short-term outlook eased in December while
consumers’ expectations for the labor market
were also less upbeat during the month.
Euro Area. On a q-o-q basis, real GDP growth in
the euro area decreased slightly to 0.6 percent in
Q3 2017 from 0.7 percent in Q2 2017. On a y-o-y
basis, real GDP expanded at a faster rate of
2.6 percent in Q3 2017 from 2.4 percent in
Q2 2017.55
Output growth in the euro
area keeps its momentum
Meanwhile, the composite PMI for the euro area
increased to 58.1 in December from 57.5 in
November as stronger domestic demand and
higher new export orders led to output growth in
the manufacturing sector, while the increase in
52
Institute for Supply Management,
https://www.instituteforsupplymanagement.org 53
University of Michigan Survey of Consumers,
http://www.sca.isr.umich.edu/ 54
The Conference Board, http://www.conference–board.org/ 55
Eurostat news release 186/2017 dated 7 December 2017

Q4 2017 Inflation Report | | | | 31313131
new work spurred growth in service sector
activity.56
Inflation in the euro area is expected to decrease
to 1.4 percent in December from 1.5 percent in
November due to lower energy price index.57
The seasonally adjusted unemployment rate
fell slightly to 8.7 percent in November from
8.8 percent in October.58
The European Commission’s Economic Sentiment
Indicator in the euro area rose to 116.0 in
December from 114.6 in November due to
stronger confidence in the services, retail trade,
and construction sectors. Confidence in the
industry sector and among consumers likewise
improved during the month.
Japan. On a q-o-q basis, real GDP grew by
0.6 percent in Q3 2017, slower than the
0.7 percent expansion in Q2 2017. Meanwhile, on
a y-o-y basis, real GDP expanded by 2.1 percent in
Q3 2017, faster than the 1.6 percent growth in the
previous quarter.59
The slower q-o-q GDP growth
in Japan was due mainly to weaker domestic
private and public demand.
Manufacturing conditions in
Japan improve
Meanwhile, the seasonally adjusted manufacturing
PMI rose to 54.2 in December from 53.6 in
November due to faster growth in new orders.60
Inflation was higher at 0.6 percent in November
from 0.2 in October due primarily to the increase
in the price index for fuel, light and water charges.
The seasonally adjusted unemployment rate was
at 2.7 percent in November, lower than the
2.8 percent recorded in October.
China. Real GDP in China expanded by 6.8 percent
y-o-y in Q3 2017, lower than the 6.9-percent
growth recorded in the previous quarter. The GDP
expansion was driven mainly by the services
56
Final Markit Eurozone PMI,
http://www.markiteconomics.com/ 57
Flash Eurostat news release 1/2018 dated 5 January 2018 58
Eurostat news release 4/2018 dated 9 January 2018 59
Second Preliminary Estimate. Department of National
Accounts, Economic and Social Research Institute, Cabinet
Office. http://www/esri.cao.go.jp/ 60
Flash Nikkei Japan Manufacturing PMI,
http://www.markiteconomics .com/
industry. However, government’s efforts to control
the property market and debt risks tempered
economic activity in China.
Indicators reflect stable
Chinese economic activity
Meanwhile, the seasonally adjusted manufacturing
PMI rose to 51.5 in December from 50.8 in
November due to faster growth of output, total
new work, and export sales during the month.61
Inflation rose to 1.8 percent in December from
1.7 percent in November due to an uptick in
non-food prices.
India. Real GDP in India accelerated to
6.3 percent y-o-y in Q3 2017 from 5.7 percent in
the previous quarter. The increase in the GDP
growth was due mainly to the expansion in
manufacturing; electricity, gas, water supply &
other utility services; and trade, hotels, transport
& communication and services related to
broadcasting.62
Economic activity in India
continues to expand
Meanwhile, the composite PMI rose to
53.0 in December from 50.3 in November as
manufacturing new orders increased.
Inflation rose to 5.2 percent in December from
4.9 percent in November due to price increases
in pan, tobacco, and intoxicants; clothing and
footwear; housing; fuel and light; and
miscellaneous items.
ASEAN Region. The Nikkei ASEAN Manufacturing
PMI fell into contraction territory to 49.9 in
December from 50.8 in November due to a softer
increase in output and largely stagnant new order
volumes.
61
Caixin China General Manufacturing PMI,
http://www.markiteconomics.com/ 62
Ministry of Statistics and Programme Implementation.
http://mospi.nic.in/

Q4 2017 Inflation Report | | | | 32323232
Manufacturing conditions
weaken in the ASEAN region
In December, output expanded faster in Vietnam,
while a slower rate of expansion was reported in
Myanmar. Output in Thailand expanded at a
steady pace, while Malaysia, Indonesia, and
Singapore slid into contraction.63
Policy Actions by Central Banks. On 2 November
2017, the Bank of England (BOE) increased its Bank
Rate by 25 bps to 0.5 percent to temper inflation
amid falling unemployment. Unemployment in the
UK has fallen to a 42-year low and the Monetary
Policy Committee (MPC) judges that the level of
remaining slack is limited. The MPC likewise noted
that the global economy is growing slowly,
domestic financial conditions are highly
accommodative and consumer confidence has
remained resilient. The MPC judges that it is now
appropriate to tighten monetary policy modestly
to allow for a sustainable return of inflation to the
target, with all MPC members agreeing that any
future increases in Bank Rate would be expected
to be at a gradual pace and to a limited extent.
The US Federal Reserve and
Bank of England tighten their
monetary policy settings
On 13 December 2017, the US Fed decided to
raise the target range for the federal funds rate to
1.25–1.5 percent in line with market expectations.
The Federal Open Market Committee (FOMC)
noted that the stance of monetary policy remains
accommodative and that gradual adjustments will
support strengthening labor market and economic
activity. The move is seen to remain consistent
with a gradual rise in inflation to the target level,
even as inflation developments will be carefully
monitored. The US Fed also maintained that the
timing and size of future adjustments will remain
data-driven and proceed at a gradual pace.
63
Nikkei ASEAN Manufacturing PMI,
http://www.markiteconomics.com/

Q4 2017 Inflation Report | | | | 33333333
V. Monetary Policy Developments During the monetary policy meetings on
9 November and 14 December, the BSP decided to
maintain the key policy interest rate at 3.0 percent
for the overnight reverse repurchase or RRP
facility. The corresponding interest rates on the
overnight lending and deposit facilities were also
kept steady. The reserve requirement ratios were
likewise left unchanged.
The BSP maintains monetary
policy settings during the
quarter
The BSP’s decision is based on its assessment that
the outlook for the inflation environment has been
broadly unchanged. Latest baseline forecasts
remain within the target range of 3.0 percent
± 1 percentage point for 2018-2019. Inflation
expectations also continue to be firmly anchored
to the target over the policy horizon.
Chart 40. BSP Policy Rates
in percent
0
1
2
3
4
5
6
7
Jan
20
13
Feb
Ma
rA
pr
Ma
yJu
nJu
lA
ug
Sep
Oct
No
vD
ec
Jan
20
14
Feb
Ma
rA
pr
Ma
yJu
nJu
lA
ug
Sep
Oct
No
vD
ec
Jan
20
15
Feb
Ma
rA
pr
Ma
yJu
nJu
lA
ug
Sep
Oct
No
vD
ec
Jan
20
16
Feb
Ma
rA
pr
Ma
yJu
nJu
lA
ug
Sep
Oct
No
vD
ec
Jan
20
17
Feb
Ma
rA
pr
Ma
yJu
nJu
lA
ug
Sep
Oct
No
vD
ec
Overnight RRP Rate
Overnight RP Rate
SDA Rate/Overnight Deposit Facility Rate*
* On 3 June 2016, Special Deposit Accounts (SDAs) were replaced by the Overnight Deposit Facility (ODF) in line with
the implementation of the Interest Rate Corridor (IRC) System.
Source: BSP
The BSP also recognizes that the overall balance of
risks to the inflation outlook remains tilted toward
the upside due in part to possible higher crude oil
prices. While there may be potential transitory
effects on consumer prices from the proposed tax
reform program, various mitigation measures and
the resulting improvement in output and
productivity are also expected to temper the
impact on inflation over the medium term.
Meanwhile, the proposed reforms in the rice
industry involving the replacement of quantitative
restrictions with tariffs and the deregulation of
rice imports could serve to temper inflation.
At the same time, geopolitical tensions and
lingering uncertainty over macroeconomic
policies in advanced economies continue to
pose downside risks to the near-term prospects
for global economic growth. Nonetheless, the
Monetary Board emphasized that prospects for
domestic economic activity are likely to remain
firm owing to buoyant consumer and business
sentiment and ample liquidity. Moreover, as credit
continues to expand in line with output growth,
the Monetary Board remains watchful over
evolving liquidity and credit conditions and their
implications for price and financial stability.
With these considerations, the BSP believes that
prevailing monetary policy settings should be kept.
Nevertheless, the BSP will remain vigilant against
any risks to the inflation outlook and will adjust its
policy settings as needed to ensure that future
inflation remains consistent with the medium-
term target while being supportive of sustainable
economic growth.

Q4 2017 Inflation Report | | | | 34343434
VI. Inflation Outlook
BSP Inflation Forecasts
The BSP’s latest forecasts
64 show that inflation
would likely settle above the midpoint of the
government’s target range of 3.0 percent
± 1.0 percentage point in 2018 to 2019.
Inflation is expected to settle
above the midpoint of the
target range in 2018 to 2019
Demand Conditions. Outturns for key demand
indicators attest to the view of robust domestic
real sector activity. The country’s real GDP growth
accelerated to 6.9 percent in Q3 2017 from
6.7 percent growth in the previous quarter.
Economic activity was mainly driven by stronger
government spending and the recovery in external
trade. This brought the first three quarter real
output growth to 6.7 percent.
Prospects for the domestic economy remain
favorable. Growth is expected to settle within
the Development Budget Coordination Committee
(DBCC)-approved medium-term growth targets of
6.5-7.5 percent in 2017 and 7.0-8.0 percent for
2018-2022. The sustained expansion in domestic
economic activity could be bolstered by robust
growth in the services sector and the recovery in
merchandise trade. Private demand is seen to
remain firm, aided mainly by steady remittance
inflows and stable inflation. Private capital
formation should also contribute to economic
growth with construction and investments in
durable equipment expected to remain solid,
as more infrastructure programs get underway.
High-frequency real sector indicators likewise
point to firm growth prospects in the near term.
Capacity utilization for the manufacturing sector
suggests more than half of all major
manufacturing sectors operating at above
80.0 percent. The composite PMI also
remains firmly above the 50-point mark
64
The inflation forecast path in this report refers to the
forecasts presented during the monetary policy meeting on
14 December 2017. In the discussion, these are compared to
the forecasts presented in the Q3 2017 Inflation Report which
correspond to the forecasts in the 21 September 2017
monetary policy meeting.
as of October 2017, indicating sustained expansion
across all sectors.
The optimistic economic outlook has also been
reflected in the results of the BSP expectations
surveys as business and consumer confidence
turned more upbeat in Q4 2017. This is in line with
the expectation of brisker operations during the
holiday season as well as generally favorable
macroeconomic conditions.
Supply Conditions. Commodity prices are
expected to remain manageable, reflecting ample
supply conditions. Food inflation could remain
benign over the near term given prospects of
favorable domestic supply. Meanwhile, oil prices
are projected to remain flat or slightly higher in
the medium term as suggested by futures prices.
Commodity prices are
expected to remain
manageable
Global agricultural prices are projected to settle at
moderate levels over the medium term. Forecasts
by the International Monetary Fund (IMF) and the
World Bank suggest benchmark prices of key
grains, particularly wheat and rice will rise slightly
in 2018 before easing in the medium term. 65,66
In the domestic front, palay production could
increase by 6.3 percent while corn production
could decline by 5.4 percent in Q4 2017 based on
standing crop estimates. The continued growth in
palay production could be attributed to sufficient
rainfall conditions during the early planting stages
and government programs providing support to
high-yielding varieties and fertilizer availability.67
International crude oil prices increased slightly
compared to the previous quarter’s level mainly
due to the decision of the OPEC and several non-
OPEC producers to extend their production cut
agreement until December 2018 with further
65
IMF, World Economic Outlook, October 2017, available
online at http://www.imf.org 66
World Bank, Commodity Markets Outlook, October 2017,
available online at http://www.worldbank.org 67
PSA, Rice and Corn Situation Outlook Update, 1 September
2017, available online at http://www.psa.gov.ph

Q4 2017 Inflation Report | | | | 35353535
production adjustments to be considered in mid-
2018.
The latest futures prices indicate that global crude
oil prices could remain slightly above US$50.00 per
barrel in 2018-2019. The EIA expects Brent crude
oil prices to average above US$55.00 per barrel in
2018. Similarly, forecasts by Oxford Economics and
World Bank point to a moderate rise in global
crude oil prices in 2018. Meanwhile, IMF projects
crude oil price to remain close to US$50.00 per
barrel. 68, 69,70, 71
Output gap remains positive
The balance of demand and supply conditions
as captured by the output gap (or the difference
between actual and potential output), provides an
indication of potential inflationary pressures in the
near term.72
Given the latest GDP data, estimates by the BSP
show that the output gap remains slightly positive
and is broadly stable relative to the previous
quarter.73
Key assumptions used to generate the BSP’s
inflation forecasts. The BSP's baseline inflation
forecasts generated from the BSP’s econometric
forecasting models are based on the following
assumptions:
1) BSP’s overnight RRP rate at 3.0 percent from
January 2018 to December 2019;
2) NG fiscal deficits for 2018 to 2019, which are
consistent with the DBCC-approved estimates;
3) Dubai crude oil price assumptions consistent
with the trend of futures prices of oil in the
international market;
68
EIA, Short-Term Energy Outlook, November 2017, available
online at http://www.eia.gov 69
IMF, World Economic Outlook, October 2017, available
online at http://www.imf.org 70
Oxford Economics, Commodity Price Forecasts, November
2017 71
World Bank, Commodity Markets Outlook, October 2017,
available online at http://www.worldbank.org 72
Inflation tends to rise (fall) when demand for goods and
services exert pressure on the economy’s ability to produce
goods and services, i.e., when the output gap is positive
(negative). 73
Based on the seasonally-adjusted GDP growth
4) Increase in nominal wage in October 2018 and
October 2019 consistent with labor
productivity growth and historical wage
increases;
5) Real GDP growth is endogenously determined;
and
6) Foreign exchange rate is endogenously
determined through the purchasing power
parity and interest rate parity relationships.

Q4 2017 Inflation Report | | | | 36363636
Risks to the Inflation Outlook
The risks to the inflation outlook may be presented
graphically through a fan chart. The fan chart
depicts the probability of different inflation
outcomes based on the central projection
(corresponding to the baseline forecast of the BSP)
and the risks surrounding the inflation outlook.
Compared to the previous inflation report, the
latest fan chart presents a slight upward shift in
the inflation projection for 2018-2019. The slight
increase in the projected inflation path could be
attributed mainly to the rise in global crude oil
prices.
Chart 41. Inflation Projection 74
Source: BSP estimates
The BSP’s review of current inflation dynamics
suggests that the risks surrounding the inflation
outlook remains tilted to the upside. This
assessment is depicted in the latest fan chart,
74
The fan chart shows the probability of various outcomes for
inflation over the forecast horizon. The darkest band depicts
the central projection, which corresponds to the BSP’s baseline
inflation forecast. It covers 25 percent of the probability
distribution. Each successive pair of bands is drawn to cover
a further 25 percent of probability, until 75 percent of the
probability distribution is covered. Lastly, the lightest band
covers the lower and upper 90 percent of the probability
distribution. The bands widen (i.e., “fan out”) as the time frame
is extended, indicating increasing uncertainty about outcomes.
The band in wire mesh depicts the inflation profile in the
previous report. The shaded area, which measures the range
of uncertainty, is based on the forecast errors from the past
years. In greater detail, it can be enhanced by adjusting the
level of skewness of the downside and upside shocks that could
affect the inflationary process over the next two years in order
to change the balance of the probability area lying above or
below the central projection enhanced by adjusting the level of
skewness of the downside and upside shocks that could affect
the inflationary process over the next two years in order to
change the balance of the probability area lying above or below
the central projection.
wherein the projection bands above the central
projection are greater than the bands below it.
The transitory impact of the government’s fiscal
reform program and pending petitions for
adjustments in transport fares and electricity rates
are the main upside risks to inflation. Meanwhile,
the slower global economic growth due to policy
uncertainty in advanced economies and
geopolitical tensions as well as the proposed
reform in the rice industry involving the
replacement of quantitative restrictions with
tariffs and the deregulation of rice imports
continue to be the main downside risks to
inflation.
The TRAIN bill was signed into law on
19 December 2017. The package consists of a
reduction in personal income taxes, higher excise
tax on petroleum products and coal, higher
automobile tax, higher tax on sugar-sweetened
beverages, VAT-base expansion, uniform donor
and estate tax, higher excise tax on non-metallic
minerals and quarry resources, adjustment in the
excise tax of tobacco products, doubled
documentary stamp tax rates on documents,
instruments, loan agreements and papers, higher
final tax on foreign currency deposit units and
excise tax on cosmetic procedures. The expected
net increase in revenue from these reforms,
together with some tax administration measures,
are intended largely for funding the government’s
key infrastructure and social spending programs,
which could boost domestic economic activity and
raise the country’s future productive capacity.
Given that higher tax revenues will be used to
sustain higher investment spending for physical
and human capital development, there could be
gains to productivity in the medium to long run.
With assumptions of sustained and more efficient
investment spending as well as healthy
macroeconomic fundamentals, the proposed
measures could potentially result in demand
pressures over the medium term.
In terms of inflationary impact, higher
consumption taxes, together with the demand
stimulus from the fiscal reform program, are
expected to initially generate higher inflation.
The crowding-in effect of higher public investment
on private investment would result in a beneficial
cycle of greater aggregate investment and
potential output. The ensuing productivity gains
would moderate inflationary pressures over the
medium term.

Q4 2017 Inflation Report | | | | 37373737
The risks to inflation outlook
remain tilted on the upside
The pending petitions of Meralco and Power
Sector Assets and Liabilities Management Corp.
(PSALM) is also a source of upside risks to inflation.
Included in the Meralco petitions are the
December 2013 rate adjustment, which is still
under the temporary restraining order of the
Supreme Court, and the ₱0.65 per kWh
adjustment for the January 2014 billing period that
is subject to the Energy Regulatory Commission’s
(ERC) approval. PSALM’s petitions meanwhile
cover adjustments for fuel and foreign exchange
costs.
The likelihood of slower global economic growth is
the main downside risk to the inflation outlook.
Continued policy uncertainty in the advanced
economies, such as the state of regulatory and
fiscal policies in the US, spillovers from tighter
global financial conditions due to the policy
normalization of Federal Reserve, the imposition
of inward looking policies as well as geopolitical
risks could lead to slower global trade and thereby
lead to downward price pressures.
In addition, the proposed reform in the rice
industry involving the replacement of quantitative
restrictions with tariffs and the deregulation of
rice imports could also pose downside risk to
inflation. The proposed removal of quantitative
restriction on rice imports could lead to lower
domestic rice prices, which account for 8.9 percent
of the CPI basket.
Implications for the Monetary Policy
Stance
The prevailing inflation outlook supports
keeping the policy rates steady. Moreover,
inflation dynamics remain manageable given well-
contained inflation expectations over the policy
horizon. On output conditions, the positive
outlook for economic activity is expected to
continue on the strength of both domestic and
external demand. In addition, prevailing credit and
liquidity conditions remain in line with the overall
requirements of the economy.
Nevertheless, the balance of risks to the inflation
outlook remains tilted toward the upside which
argues for maintaining vigilance in setting the
stance of monetary policy going forward. In
particular, price pressures could initially develop
with the eventual implementation of the tax
reform program in 2018. Although movements in
food and oil prices due to changes in tax rates
form part of the BSP's explanation clauses under
inflation targeting, the BSP will closely watch
indications of increasing underlying inflationary
pressures and risks of second-round effects in the
near term.

Q4 2017 Inflation Report | | | | 38383838
Summary of Monetary Policy Decisions
Effectivity Date
Levels (in percent)
Monetary Policy Decisions RRP
Overnight
RP
Overnight
2 0 0 8
31 Jan 2008 5.00 7.00
The Monetary Board (MB) decided to reduce by 25 basis
points (bps) the BSP’s key policy interest rates to 5 percent
for the overnight borrowing or reverse repurchase (RRP)
facility and 7 percent for the overnight lending or repurchase
(RP) facility. The interest rates on term RRPs, RPs, and special
deposit accounts (SDAs) were also reduced accordingly. In its
assessment of macroeconomic conditions, the MB noted
that the latest inflation forecasts indicated that inflation
would fall within the 4.0 percent ± 1 percentage point
target range in 2008 and the 3.5 ± 1 percentage point target
range in 2009.
13 Mar 2008 5.00 7.00
The MB decided to keep the BSP’s key policy interest rates at
5 percent for the overnight borrowing or RRP facility and
7 percent for the overnight lending or RP facility. The MB also
decided to implement immediately the following refinements
in the SDA facility: (1) the closure of existing windows for the
two-, three-, and six-month tenors; and (2) the reduction of
the interest rates on the remaining tenors. The interest rates
on term RRPs and RPs were also left unchanged.
24 Apr 2008 5.00 7.00
The MB kept the BSP’s key policy interest rates at
5.0 percent for the overnight borrowing or RRP facility
and 7.0 percent for the overnight lending or RP facility.
The interest rates on term RRPs and RPs were also left
unchanged.
5 Jun 2008 5.25 7.25
The MB decided to increase by 25 bps the BSP’s key
policy interest rates to 5.25 percent for the RRP facility
and 7.25 percent for RP facility as emerging baseline
forecasts indicate a likely breach of the inflation target
for 2008 along with indications that supply-driven
pressures are beginning to feed into demand. Given the
early evidence of second-round effects, the MB
recognized the need to act promptly to rein in
inflationary expectations. The interest rates on term
RRPs, RPs, and SDAs were also increased accordingly.
17 Jul 2008 5.75 7.75
The MB increased by 50 bps the BSP’s key policy
interest rates to 5.75 percent for the overnight
borrowing or RRP facility and 7.75 percent for the
overnight lending or RP facility. The interest rates on
term RRPs, RPs, and SDAs were also increased
accordingly.
28 Aug 2008 6.00 8.00
The MB increased by 25 bps the BSP’s key policy
interest rates to 6.0 percent for the overnight
borrowing or reverse repurchase (RRP) facility and
8.0 percent for the overnight lending or repurchase
(RP) facility. The interest rates on term RRPs, RPs, and
SDAs were also increased accordingly.

Q4 2017 Inflation Report | | | | 39393939
Summary of Monetary Policy Decisions
Effectivity Date
Levels (in percent)
Monetary Policy Decisions RRP
Overnight
RP
Overnight
6 Oct 2008 6.00 8.00
The MB kept the BSP’s key policy interest rates
unchanged at 6.0 percent for RRP facility and
8.0 percent for the RP facility. The interest rates on
term RRPs, RPs, and SDAs were also left unchanged.
6 Nov 2008 6.00 8.00
The MB decided to keep the BSP’s key policy interest
rates steady at 6 percent for the overnight borrowing
or RRP facility and 8 percent for the overnight lending
or RP facility. The interest rates on term RRPs, RPs,
and SDAs were also left unchanged.
18 Dec 2008 5.50 7.50
The MB decided to reduce the BSP’s key policy interest rates
by 50 bps to 5.5 percent for the overnight borrowing or RRP
facility and 7.5 percent for the overnight lending or RP facility.
The interest rates on term RRPs, RPs, and SDAs were also
adjusted accordingly. Latest baseline forecasts showed a
decelerating inflation path over the policy horizon, with
inflation falling within target by 2010. This outlook is
supported by the downward shift in the balance of risks,
following the easing of commodity prices, the moderation in
inflation expectations, and the expected slowdown in
economic activity.
2 0 0 9
29 Jan 2009 5.00 7.00
The MB decided to reduce the BSP’s key policy interest rates
by another 50 bps to 5 percent for the overnight borrowing or
RRP facility and 7 percent for the overnight lending or RP
facility. The interest rates on term RRPs, RPs, and SDAs were
also adjusted accordingly. Latest baseline forecasts showed a
decelerating inflation path over the policy horizon, with
inflation falling within target by 2010. The MB based its
decision on the latest inflation outlook which shows inflation
falling within the target range for 2009 and 2010. The Board
noted that the balance of risks to inflation is tilted to the
downside due to the softening prices of commodities, the
slowdown in core inflation, significantly lower inflation
expectations, and moderating demand.
5 Mar 2009 4.75 6.75
The MB decided to reduce the BSP’s key policy interest rates
by 25 bps to 4.75 percent for the overnight borrowing or RRP
facility and 6.75 percent for the overnight lending or RP
facility. The interest rates on term RRPs, RPs, and SDAs were
also reduced accordingly. Given possible upside risks to
inflation, notably the volatility in oil prices and in exchange
rates, increases in utility rates, and potential price pressures
coming from some agricultural commodities, the MB decided
that a more measured adjustment of policy rates was needed.

Q4 2017 Inflation Report | | | | 40404040
Summary of Monetary Policy Decisions
Effectivity Date
Levels (in percent)
Monetary Policy Decisions RRP
Overnight
RP
Overnight
16 Apr 2009 4.50 6.50
The MB reduced key policy rates by another 25 bps to
4.5 percent for the overnight borrowing or RRP facility and
6.5 percent for the overnight lending or RP facility, effective
immediately. This rate cut brings the cumulative reduction in
the BSP’s key policy rates to 150 bps since December last
year. The current RRP rate is the lowest since 15 May 1992.
Meanwhile, the interest rates on term RRPs, RPs, and SDAs
were also reduced accordingly. In its assessment of
macroeconomic conditions, the MB noted that the latest
baseline inflation forecasts indicated a lower inflation path
over the policy horizon, with average inflation expected to
settle within the target ranges in 2009 and 2010. In addition,
the MB considered that the risks to inflation are skewed to
the downside given expectations of weaker global and
domestic demand conditions and a low probability of a
significant near-term recovery in commodity prices.
28 May 2009 4.25 6.25
The MB decided to reduce the BSP’s key policy interest rates
by another 25 bps to 4.25 percent for the overnight
borrowing or RRP facility and 6.25 percent for the overnight
lending or RP facility. The interest rates on term RRPs, RPs,
and SDAs were also reduced accordingly. Baseline forecasts
indicated a lower inflation path over the policy horizon, with
average inflation expected to settle within the target ranges
in 2009 and 2010. In addition, the Monetary Board
considered that, on balance, the risks to inflation are skewed
to the downside given expectations of weaker global and
domestic demand conditions and a low probability of a
significant near-term recovery in commodity prices.
9 Jul 2009 4.00 6.00
The MB decided to reduce the BSP's key policy interest rates
by 25 bps to 4 percent for the overnight borrowing or RRP
facility and 6 percent for the overnight lending or RP facility,
effective immediately. The interest rates on term RRPs, RPs,
and SDAs were reduced accordingly. This is the sixth time
since December 2008 that the BSP has cut its policy interest
rates.
20 Aug 2009
1 Oct 2009
5 Nov 2009
17 Dec 2009
4.00 6.00
The MB kept key policy rates unchanged at 4 percent for the
RRP facility and 6 percent for the overnight lending RP facility.
The decision to maintain the monetary policy stance comes
after a series of policy rate cuts since December 2008 totaling
200 bps and other liquidity enhancing measures.
2 0 1 0
28 Jan 2010
11 Mar 2010
22 Apr 2010
3 Jun 2010
15 Jul 2010
26 Aug 2010
7 Oct 2010
18 Nov 2010
29 Dec 2010
4.00 6.00
The MB decided to keep the BSP's key policy interest rates
steady at 4 percent for the RRP facility and 6 percent for the
RP facility. The interest rates on term RRPs, RPs, and SDAs
were also left unchanged.

Q4 2017 Inflation Report | | | | 41414141
Summary of Monetary Policy Decisions
Effectivity Date
Levels (in percent)
Monetary Policy Decisions RRP
Overnight
RP
Overnight
2 0 1 1
10 Feb 2011 4.00 6.00
The MB decided to keep the BSP’s key policy interest rates
steady at 4 percent for the overnight borrowing or RRP facility
and 6 percent for the overnight lending or RP facility. The
interest rates on term RRPs, RPs, and SDAs were also left
unchanged.
24 Mar 2011 4.25 6.25
The MB decided to increase by 25 bps the BSP’s key policy
interest rates to 4.25 percent for the overnight borrowing or
RRP facility and 6.25 percent for the overnight lending or RP
facility. The interest rates on term RRPs, RPs, and SDAs were
also raised accordingly. The MB’s decision was based on signs
of stronger and broadening inflation pressures as well as a
further upward shift in the balance of inflation risks.
International food and oil prices have continued to escalate
due to the combination of sustained strong global demand
and supply disruptions and constraints.
5 May 2011 4.50 6.50
The MB decided to increase the BSP’s key policy interest rates
by another 25 bps to 4.5 percent for the overnight borrowing
or RRP facility and 6.5 percent for the overnight lending or RP
facility. The interest rates on term RRPs, RPs, and SDAs were
also raised accordingly. Baseline inflation forecasts continue
to suggest that the 3-5 percent inflation target for 2011
remains at risk, mainly as a result of expected pressures from
oil prices.
16 Jun 2011 4.50 6.50
The MB decided to keep policy rates steady at 4.5 percent for
the overnight borrowing or RRP facility and 6.5 percent for
the overnight lending or RP facility. At the same time, the
Board decided to raise the reserve requirement on deposits
and deposit substitutes of all banks and non-banks with
quasi-banking functions by one percentage point effective on
Friday, 24 June 2011. The MB's decision to raise the reserve
requirement is a preemptive move to counter any additional
inflationary pressures from excess liquidity.
28 Jul 2011 4.50 6.50
The MB maintained the BSP's key policy interest rates at
4.5 percent for the overnight borrowing or RRP facility and
6.5 percent for the overnight lending or RP facility. At the
same time, the Board increased anew the reserve
requirement on deposits and deposit substitutes of all banks
and non-banks with quasi-banking functions by one
percentage point effective on 5 August 2011. The MB's
decision to raise the reserve requirement anew is a
forward-looking move to better manage liquidity.
8 Sep 2011
20 Oct 2011
1 Dec 2011
4.50 6.50 The MB decided to keep the overnight policy rates steady.
At the same time, the reserve requirement ratios were kept
unchanged.

Q4 2017 Inflation Report | | | | 42424242
Summary of Monetary Policy Decisions
Effectivity Date
Levels (in percent)
Monetary Policy Decisions RRP
Overnight
RP
Overnight
2 0 1 2
19 Jan 2012 4.25 6.25
The MB decided to reduce the BSP's key policy interest rates
by 25 bps to 4.25 percent for the overnight borrowing or RRP
facility and 6.25 percent for the overnight lending or RP
facility. The interest rates on term RRPs, RPs, and SDAs were
also reduced accordingly The MB's decision is based on its
assessment that the inflation outlook remains comfortably
within the target range, with expectations well-anchored and
as such, allowed some scope for a reduction in policy rates to
help boost economic activity and support market confidence.
1 Mar 2012 4.00 6.00
The MB decided to reduce the BSP's key policy interest rates
by another 25 bps to 4.0 percent for the overnight borrowing
or RRP facility and 6.0 percent for the overnight lending or RP
facility. The interest rates on term RRPs, RPs, and SDAs were
also reduced accordingly. The MB is of the view that the
benign inflation outlook has allowed further scope for a
measured reduction in policy rates to support economic
activity and reinforce confidence.
19 Apr 2012 4.00 6.00
The MB decided to keep the BSP’s key policy interest rates
steady at 4 percent for the overnight borrowing or RRP facility
and 6 percent for the overnight lending or RP facility. The
interest rates on term RRPs, RPs, and SDAs were also left
unchanged.
14 Jun 2012 4.00 6.00
The MB decided to keep the BSP’s key policy interest rates
steady at 4 percent for the overnight borrowing or RRP facility
and 6 percent for the overnight lending or RP facility. The
interest rates on term RRPs, RPs, and SDAs were also left
unchanged. The MB’s decision was based on its assessment
that the inflation environment remains manageable. Baseline
forecasts continue to track the lower half of the 3-5 percent
target range for 2012 and 2013, while inflation expectations
remain firmly anchored. At the same time, domestic
macroeconomic readings have improved significantly in
Q1 2012.
26 Jul 2012 3.75 5.75
The MB decided to reduce the BSP’s key policy interest rates
by 25 bps to 3.75 percent for the overnight borrowing or RRP
facility and 5.75 percent for the overnight lending or RP
facility. The interest rates on term RRPs, RPs, and SDAs were
also reduced accordingly. This is the third time in 2012 that
the BSP has cut its policy rates. The MB’s decision was based
on its assessment that price pressures have been receding,
with risks to the inflation outlook slightly skewed to the
downside. Baseline forecasts indicate that inflation is likely to
settle within the lower half of the 3-5 percent target for 2012
and 2013, as pressures on global commodity prices are seen
to continue to abate amid weaker global growth prospects. At
the same time, the MB is of the view that prospects for global
economic activity are likely to remain weak.
13 SEP 2012 3.75 5.75
The MB decided to keep the BSP’s key policy interest rates
steady at 3.75 percent for the overnight borrowing or RRP
facility and 5.75 percent for the overnight lending or RP
facility. The interest rates on term RRPs, RPs, and SDAs were
also left unchanged. The MB’s decision was based on its
assessment that the inflation environment remains benign,

Q4 2017 Inflation Report | | | | 43434343
Summary of Monetary Policy Decisions
Effectivity Date
Levels (in percent)
Monetary Policy Decisions RRP
Overnight
RP
Overnight
with the risks to the inflation outlook appearing to be broadly
balanced.
25 Oct 2012 3.50 5.50
The MB decided to reduce the BSP’s key policy interest rates
by 25 bps to 3.50 percent for the overnight borrowing or RRP
facility and 5.50 percent for the overnight lending or RP
facility. The interest rates on term RRPs, RPs, and SDAs were
also reduced accordingly. This is the fourth time in 2012 that
the BSP has cut its policy rates. The MB’s decision was based
on its assessment that the inflation environment continued to
be benign with latest baseline forecasts indicating that the
future inflation path will remain within target for 2012-2014.
A rate cut would also be consistent with a symmetric
response to the risk of below-target inflation.
13 Dec 2012 3.50 5.50
The MB decided to keep the BSP’s key policy interest rates
steady at 3.50 percent for the overnight borrowing or RRP
facility and 5.50 percent for the overnight lending or RP
facility. The interest rates on term RRPs, RPs, and SDAs were
also left unchanged. The MB’s decision was based on its
assessment that current monetary settings remained
appropriate, as the cumulative 100-basis-point reduction in
policy rates in 2012 continued to work its way through the
economy.
2 0 1 3
24 Jan 2013 3.50 5.50
The MB decided to keep the BSP’s key policy interest rates
steady at 3.50 percent for the overnight borrowing or RRP
facility and 5.50 percent for the overnight lending or RP
facility. The interest rates on term RRPs and RPs were also
maintained accordingly. The reserve requirement ratios were
kept steady as well. At the same time, the MB decided to set
the interest rates on the SDA facility at 3.00 percent
regardless of tenor, effective immediately, consistent with
the BSP’s continuing efforts to fine-tune the operation of its
monetary policy tools.
14 Mar 2013 3.50 5.50
The MB decided to keep the BSP’s key policy interest rates
steady at 3.50 percent for the overnight borrowing or RRP
facility and 5.50 percent for the overnight lending or RP
facility. The interest rate on the RRP was also set at
3.50 percent regardless of tenor. Following its previous
decision to rationalize the SDA facility in January 2013, the
MB further reduced the interest rates on the SDA facility by
50 bps to 2.50 percent across all tenors effective immediately.
25 Apr 2013 3.50 5.50
The MB decided to keep the BSP’s key policy interest rates
steady at 3.50 percent for the overnight borrowing or RRP
facility and 5.50 percent for the overnight lending or RP
facility. The interest rate on the RRP was also set at
3.50 percent regardless of tenor. Meanwhile, the SDA rate
was further reduced by 50 basis points to 2.0 percent across
all tenors.
13 Jun 2013
25 Jul 2013
12 Sep 2013
24 Oct 2013
12 Dec 2013
3.50 5.50
The MB decided to keep the BSP’s key policy interest rates
steady at 3.50 percent for the overnight borrowing or RRP
facility and 5.50 percent for the overnight lending or RP
facility. The interest rates on term RRPs, RPs, and SDA were
also maintained.

Q4 2017 Inflation Report | | | | 44444444
Summary of Monetary Policy Decisions
Effectivity Date
Levels (in percent)
Monetary Policy Decisions RRP
Overnight
RP
Overnight
2 0 1 4
6 Feb 2014 3.50 5.50
The MB decided to keep the BSP’s key policy interest rates
steady at 3.50 percent for the overnight borrowing or RRP
facility and 5.50 percent for the overnight lending or RP
facility. The interest rates on term RRPs, RPs, and SDA were
also maintained.
27 Mar 2014 3.50 5.50
The MB decided to keep the BSP’s key policy interest rates
steady at 3.50 percent for the overnight borrowing or RRP
facility and 5.50 percent for the overnight lending or RP
facility. The interest rates on term RRPs, RPs, and SDA were
also maintained. Meanwhile, the MB decided to increase the
reserve requirement by one percentage point effective on
11 April 2014.
8 May 2014 3.50 5.50
The MB decided to keep the BSP's key policy interest rates
steady at 3.50 percent for the overnight borrowing or RRP
facility and 5.50 percent for the overnight lending or RP
facility. The interest rates on term RRPs, RPs, and SDA were
also maintained. Meanwhile, the MB decided to increase the
reserve requirements for U/KBs and TBs by a further one
percentage point effective on 30 May 2014.
19 Jun 2014 3.50 5.50
The MB decided to keep the BSP's key policy interest rates
steady at 3.50 percent for the overnight borrowing or RRP
facility and 5.50 percent for the overnight lending or RP
facility. The interest rates on term RRPs and RPs were also
maintained. The reserve requirement ratios were left
unchanged as well. Meanwhile, the MB decided to raise the
interest rate on the SDA facility by 25 basis points from 2.0
percent to 2.25 percent across all tenors effective
immediately.
31 Jul 2014 3.75 5.75
The MB decided to increase the BSP's key policy rates by
25 bps to 3.75 percent for the overnight borrowing or RRP
facility and 5.75 percent for the overnight lending or RP
facility. The interest rates on term RRPs and RPs were also
raised accordingly. The rate on special deposit accounts (SDA)
was left unchanged. Meanwhile, the reserve requirement
ratios were also kept steady.
11 Sep 2014 4.00 6.00
The MB decided to increase the BSP's key policy rates by
25 bps to 4.0 percent for the overnight borrowing or RRP
facility and 6.0 percent for the overnight lending or RP facility.
The interest rates on term RRPs, RPs, and SDA were also
raised accordingly. Meanwhile, the reserve requirement
ratios were left unchanged.
23 Oct 2014
11 Dec 2014 4.00 6.00
The MB decided to maintain the BSP’s key policy interest
rates at 4.0 percent for the overnight borrowing or reverse
repurchase (RRP) facility and 6.0 percent for the overnight
lending or repurchase (RP) facility. The interest rates on term
RRPs, RPs, and special deposit accounts were also kept
steady. The reserve requirement ratios were left unchanged
as well.

Q4 2017 Inflation Report | | | | 45454545
Summary of Monetary Policy Decisions
Effectivity Date
Levels (in percent)
Monetary Policy Decisions RRP
Overnight
RP
Overnight
2 0 1 5
12 Feb 2015
26 Mar 2015
14 May 2015
25 Jun 2015
13 Aug 2015
24 Sep 2015
12 Nov 2015
17 Dec 2015
4.00 6.00
The MB decided to maintain the BSP’s key policy interest
rates at 4.0 percent for the overnight borrowing or reverse
repurchase (RRP) facility and 6.0 percent for the overnight
lending or repurchase (RP) facility. The interest rates on term
RRPs, RPs, and special deposit accounts were also kept
steady. The reserve requirement ratios were left unchanged
as well.
2 0 1 6
11 Feb 2016
23 Mar 2016
12 May 2016
23 Jun 2016
11 Aug 2016
22 Sep 2016
10 Nov 2016
22 Dec 2016
4.00
3.00
6.00
3.50
The MB decided to maintain the BSP’s key policy interest
rates at 4.0 percent for the overnight borrowing or reverse
repurchase (RRP) facility and 6.0 percent for the overnight
lending or repurchase (RP) facility. The interest rates on term
RRPs, RPs, and special deposit accounts were also kept
steady. The reserve requirement ratios were left unchanged
as well.
The BSP formally adopted an interest rate corridor (IRC)
system as a framework for conducting its monetary
operations. The shift to IRC is an operational adjustment and
not a change in the monetary policy stance. The IRC is a
system for guiding short-term market rates towards the BSP
policy interest rate which is the overnight reverse repurchase
(RRP) rate. The IRC system consists of the following
instruments: standing liquidity facilities, namely, the
overnight lending facility (OLF) and the overnight deposit
facility (ODF); the overnight RRP facility; and a term deposit
auction facility (TDF). The interest rates for the standing
liquidity facilities form the upper and lower bound of the
corridor while the overnight RRP rate is set at the middle of
the corridor. The repurchase (RP) and Special Deposit Account
(SDA) windows will be replaced by standing overnight lending
and overnight deposit facilities, respectively. Meanwhile, the
reverse repurchase (RRP) facility will be modified to a purely
overnight RRP. In addition, the term deposit facility (TDF) will
serve as the main tool for absorbing liquidity.
The interest rates for these facilities will be set as follows
starting 3 June 2016:
� 3.5 percent in the overnight lending facility (a reduction of
the interest rate for the upper bound of the corridor from the
current overnight RP rate of 6.0 percent);
� 3.0 percent in the overnight RRP rate (an adjustment from
the current 4.0 percent); and
� 2.5 percent in the overnight deposit facility (no change from
the current SDA rate).

Q4 2017 Inflation Report | | | | 46464646
Summary of Monetary Policy Decisions
Effectivity Date
Levels (in percent)
Monetary Policy Decisions RRP
Overnight
RP
Overnight
2 0 1 7
9 Feb 2017
23 Mar 2017
11 May 2017
22 Jun 2017
10 Aug 2017
21 Sep 2017
9 Nov 2017
14 Dec 2017
3.00 3.50
The MB decided to maintain the BSP’s key policy interest
rates at 3.0 percent for the overnight reverse repurchase
(RRP) facility, 3.5 percent for the overnight lending facility
(OLF) and 2.5 percent for the overnight deposit facility (ODF).
The reserve requirement ratios were left unchanged as well.

Q4 2017 Inflation Report | | | | 47474747
The BSP Inflation Report is published every quarter by the Bangko
Sentral ng Pilipinas. The report is available as a complete document in
pdf format, together with other general information about inflation
targeting and the monetary policy of the BSP, on the BSP’s website:
www.bsp.gov.ph/monetary/inflation.asp
If you wish to receive an electronic copy of the latest BSP Inflation
Report, please send an e-mail to [email protected].
The BSP also welcomes feedback from readers on the contents of the
Inflation Report as well as suggestions on how to improve the
presentation. Please send comments and suggestions to the following
addresses:
By post: BSP Inflation Report
c/o Department of Economic Research
Bangko Sentral ng Pilipinas
A. Mabini Street, Malate, Manila
Philippines 1004
By e-mail: [email protected]