inferring pleiotropy by network analysis: linked diseases in the human ppi network
TRANSCRIPT

RESEARCH ARTICLE Open Access
Inferring pleiotropy by network analysis: linkeddiseases in the human PPI networkThanh-Phuong Nguyen1, Wei-chung Liu2 and Ferenc Jordán1*
Abstract
Background: Earlier, we identified proteins connecting different disease proteins in the human protein-proteininteraction network and quantified their mediator role. An analysis of the networks of these mediators shows thatproteins connecting heart disease and diabetes largely overlap with the ones connecting heart disease andobesity.
Results: We quantified their overlap, and based on the identified topological patterns, we inferred the structuraldisease-relatedness of several proteins. Literature data provide a functional look of them, well supporting ourfindings. For example, the inferred structurally important role of the PDZ domain-containing protein GIPC1 indiabetes is supported despite the lack of this information in the Online Mendelian Inheritance in Man database.Several key mediator proteins identified here clearly has pleiotropic effects, supported by ample evidence for theirgeneral but always of only secondary importance.
Conclusions: We suggest that studying central nodes in mediator networks may contribute to betterunderstanding and quantifying pleiotropy. Network analysis provides potentially useful tools here, as well as helpsin improving databases.
BackgroundThe systems perspective on complex biological systemsemphasizes that individual genes act in genetic networksand individual proteins play their roles in protein-pro-tein interaction (PPI) networks [1]. There is increasinginterest in these networks, as their analysis helps tounderstand the relationship between the components (i.e. genes, proteins) and how these are positioned in thewhole system. Well-connected hubs seem to be of highfunctional importance [2,3]. Consequently, studies ondiseases based on PPI networks had the starting pointby analysing the centrality of disease proteins. Genesassociated with a particular phenotype or function arenot randomly positioned in the PPI network, but tendto exhibit high connectivity; they may cluster togetherand can occur in central network locations [4,5].Beyond focusing on the number of neighbours of
graph nodes (their degree), wider neighbourhoods, indir-ect effects and larger subsets of nodes can also be
analyzed by the rich arsenal of network analytical tools.This non-local information may help, for example, toquantify the structural relationships between differentsets of proteins. In an earlier paper [6], we have deter-mined proteins that mediate indirect effects betweensets of proteins causing five diseases in the human PPInetwork. Their mediator role was quantified and theywere ranked according to structural importance. Theirfunctional role may be of high interest, as proteinsinvolved in certain pairs of diseases have no direct inter-actions among them [6]. These findings motivated anappealing problem: „which proteins connect diseases inthe human PPI network?”.To be connected to diverse regions of the PPI network
may lend a functionally pleiotropic character to a pro-tein in a classical, genetic sense: it has been demon-strated that high connectivity correlates well withpleiotropic effects [7,8]. The most central mediators areespecially important in connecting apparently distantnodes in the human PPI network. Specific network posi-tions may render strange but characteristic behaviour(expression pattern) to different proteins [9,10]. Insteadof being exceptional, these epistatic effects may be of
* Correspondence: [email protected] Microsoft Research - University of Trento, Centre for Computational andSystems Biology, Povo/Trento, ItalyFull list of author information is available at the end of the article
Nguyen et al. BMC Systems Biology 2011, 5:179http://www.biomedcentral.com/1752-0509/5/179
© 2011 Nguyen et al; licensee BioMed Central Ltd. This is an Open Access article distributed under the terms of the Creative CommonsAttribution License (http://creativecommons.org/licenses/by/2.0), which permits unrestricted use, distribution, and reproduction inany medium, provided the original work is properly cited.

primary importance in physiology [11] and in betterunderstanding animal development and adaptation.In this paper, (1) we compare two interaction net-
works of mediators (mediating indirect effects betweenheart disease and obesity, and between heart disease anddiabetes), (2) we analyse the structure of these two net-works and their aggregated total network, (3) we studythe overlap between the two mediator networks, and (4)we infer biological functions for some proteins and pro-vide supporting literature data. All in all, we illustratethat network analysis is an excellent tool for identifyingpleiotropy and epistasis from complex networksextracted from multiple databases.
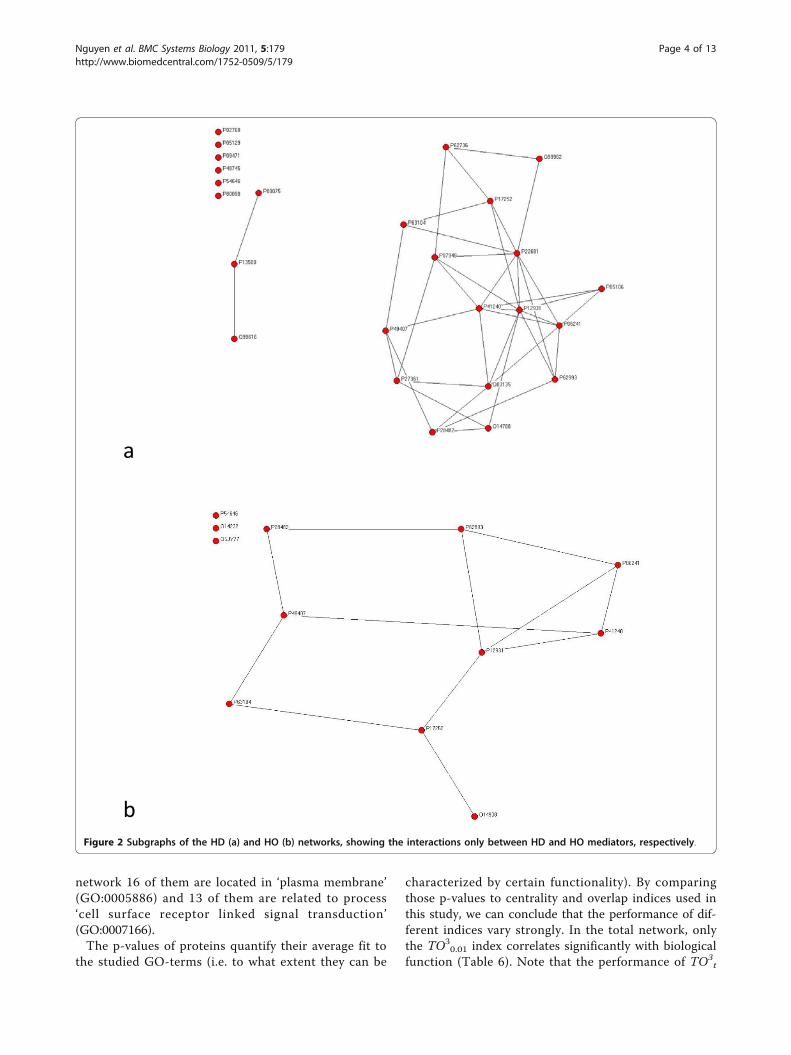
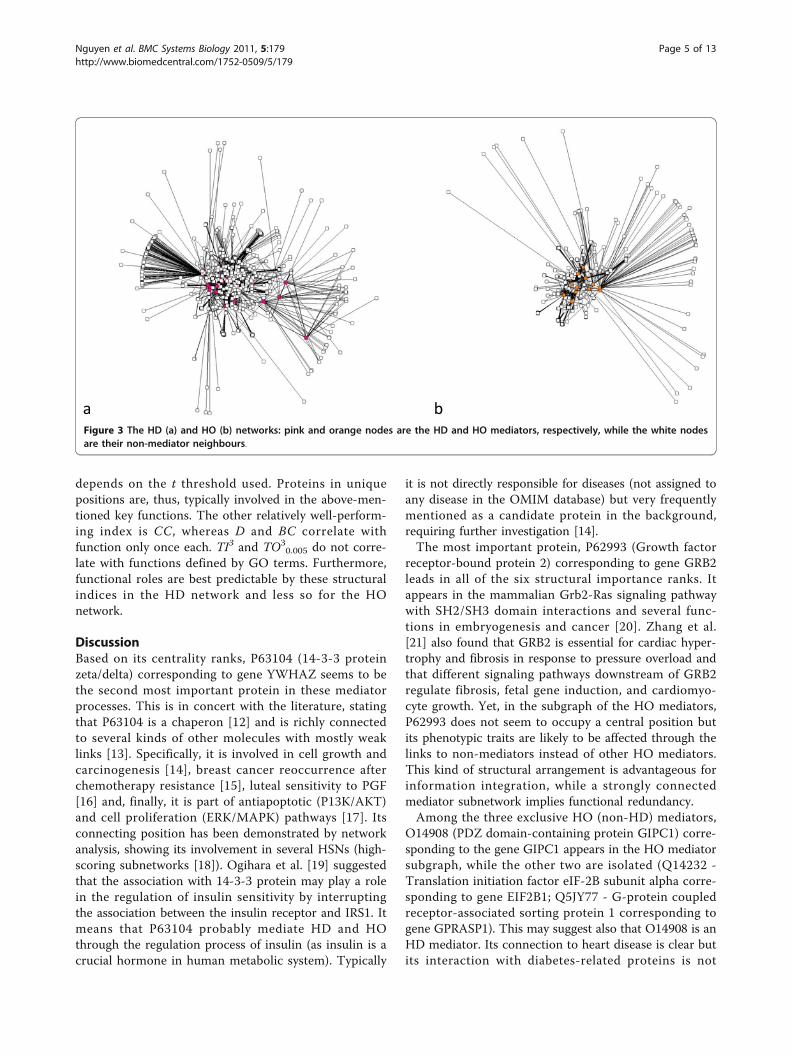
ResultsNetwork analysisWe obtained 9 proteins involved in heart diseases (H),as well as 44 and 20 involved in diabetes (D) and obesity(O), respectively. The HD network contains N = 2142nodes and L = 3537 links, while the HO network con-tains N = 1746 nodes and L = 2567 links and the totalnetwork contains N = 2221 nodes and L = 3686 links.Figure 1 provides a schematic illustration for how thenetworks had been constructed (see Methods). Figure 2shows the relationships between mediator proteins inthe HD (Figure 2a) and the HO (Figure 2b) networks.The HD network (Figure 3a) contains 25 HD mediatorsand their 2117 neighbours and the HO network (Figure3b) contains 12 HO mediators and their 1734 neigh-bours. In the „total” network (Figure 4), 9 shared media-tors appear, so it contains only 28 mediator proteins. Inthis total network, 1667 nodes are present in both theHD and the HO network, 475 only in the HD and 79only in the HO network.The distributions of individual structural indices are
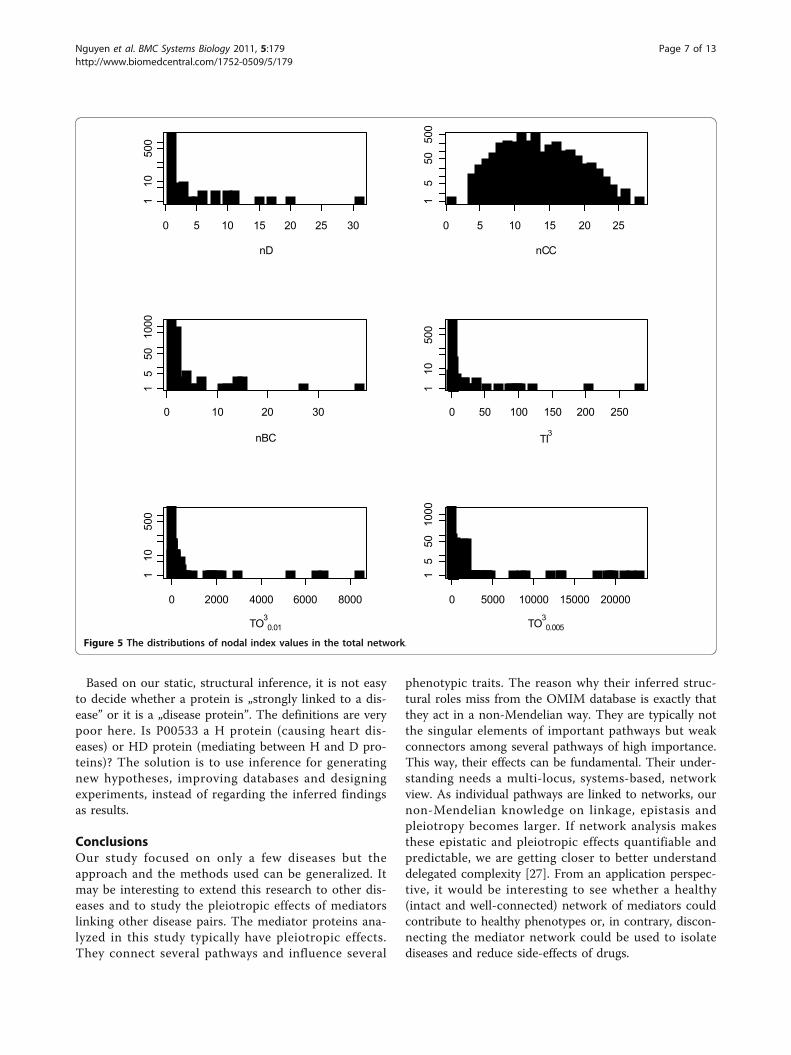
very similar for all of the three analyzed networks. Addi-tional file 1 shows all values of the six network indicesfor all nodes in the three networks. Figure 5 showsthese distributions only for the total network. We canobserve that almost all indices follow a strongly left-skewed distribution where only a few nodes are extre-mely important. While degree (D), topological impor-tance (TI) and betweenness centrality (BC) have reallyonly one or a few hubs, topological overlap (TO) indi-cates several key nodes. Closeness centrality (CC) has aunimodal, normal-like distribution.For each network, there seem to be strong and positiverank correlation between all centrality indices but notfor the overlap indices (TO3
0.01 and TO30.005). TO
indices correlate positively and weakly with other cen-trality indices whereas they correlate negatively andweakly with CC (see Table 1). D best correlates withTI3. The TO measure offers different, complementaryinformation than the centrality indices.
Table 2 summarizes the results of the randomizationtest (note that only the means are shown in the table,for simplicity). The observed rank correlation coeffi-cients are all significantly lower than those for the ran-dom networks (with 95% confidence interval). Thissuggests that there are stronger rank correlationsbetween different centrality indices in the random net-works, in comparison to the results obtained from theHD, HO and total networks. One possible explanationfor this discrepancy is that, beyond the mathematicalproperties, real networks are structured also by biologi-cal constraints. Thus, different centrality indices cancapture different aspects of network topology, thereforecorrelation between different indices are weaker for realnetworks. This provides more support on using variousnetwork indices to capture different topological proper-ties embedded in real networks.
Biological resultsWe now examine more closely the rank order of the topnodes in each network. The degree ranks for the threenetworks are almost identical (see Tables 3, 4 and 5).The most central nodes are P62993 (Growth factorreceptor-bound protein 2), P63104 (14-3-3 protein zeta/delta) and P06241 (Tyrosine-protein kinase Fyn). The 9shared proteins rank in the same order in HD and HOand there is no change in rank order also in the totalnetwork. In the HO network, the 12 mediators lead theranking, and then come their neighbours. However, inthe HD rank (and also in the total network), there isone non-mediator protein in the top 26 of the rank(among the 25 HD mediators); this is P00533 (Epider-mal growth factor receptor) in the 23rd position.The betweenness ranks correspond quite well to the
degree ranks with some exceptions. For example in theHD network, P06241 (Tyrosine-protein kinase Fyn) isthree positions lower in betweenness ranking when com-pared to its degree rank position. In the HD network,instead of one, now five non-mediators are mixed withHD mediators in the top of the list, while some HD med-iators such as Q99616 (C-C motif chemokine 13) losetheir high degree-based rank completely. In contrast, thedegree rank order seems to be consistent with itsbetweennes counterpart for HO and total networks.Despite the large overlap between the HD and HO
networks, the rank positions of HD and HO mediatorproteins are quite different in the two networks. Forexample, both P17302 (Gap junction alpha-1 protein)and P43405 (Tyrosine-protein kinase SYK) rank high inthe HD network but not in the HO network. As it isshown on Figure 2b, O14908 (PDZ domain-containingprotein GIPC1) is the only protein among the threeexclusive HO mediators that is part of the interactionnetwork of HO mediators.
Nguyen et al. BMC Systems Biology 2011, 5:179http://www.biomedcentral.com/1752-0509/5/179
Page 2 of 13

Additional File 2 shows the extracted GO terms ofproteins ranked by different structural indices for theHD network, the HO network and the total network.For example, by considering the top 30 proteins ranked
by degree in the HD network, we found that half ofthem are related to the processes ‘intracellular signalingcascade’ (GO:0007242) and ‘protein amino acid phos-phorylation’ (GO:0006468), meanwhile in the HO
Figure 1 The HD and HO mediator networks and their subnetworks. Red, blue and yellow proteins are involved in three diseases (H: heartdiseases, D: diabetes, O: obesity). Pink proteins mediate indirect effects between the red and the blue ones, while orange proteins mediatebetween the red and the yellow ones. Black proteins mediate between both pairs. White proteins are the non-mediator neighbours of themediator proteins. We analyzed five networks: the HD mediator network (pink and black nodes with their white neighbours), the HO mediatornetwork (orange and black nodes with their white neighbours), the total mediator network (pink, orange and black nodes with their whiteneighbours), the subnetwork of interactions among HD mediators (pink and black nodes) and the subnetwork of interactions among HOmediators (orange and black nodes).
Nguyen et al. BMC Systems Biology 2011, 5:179http://www.biomedcentral.com/1752-0509/5/179
Page 3 of 13
network 16 of them are located in ‘plasma membrane’(GO:0005886) and 13 of them are related to process‘cell surface receptor linked signal transduction’(GO:0007166).The p-values of proteins quantify their average fit to
the studied GO-terms (i.e. to what extent they can be
characterized by certain functionality). By comparingthose p-values to centrality and overlap indices used inthis study, we can conclude that the performance of dif-ferent indices vary strongly. In the total network, onlythe TO3
0.01 index correlates significantly with biologicalfunction (Table 6). Note that the performance of TO3
t
a
b Figure 2 Subgraphs of the HD (a) and HO (b) networks, showing the interactions only between HD and HO mediators, respectively.
Nguyen et al. BMC Systems Biology 2011, 5:179http://www.biomedcentral.com/1752-0509/5/179
Page 4 of 13
depends on the t threshold used. Proteins in uniquepositions are, thus, typically involved in the above-men-tioned key functions. The other relatively well-perform-ing index is CC, whereas D and BC correlate withfunction only once each. TI3 and TO3
0.005 do not corre-late with functions defined by GO terms. Furthermore,functional roles are best predictable by these structuralindices in the HD network and less so for the HOnetwork.
DiscussionBased on its centrality ranks, P63104 (14-3-3 proteinzeta/delta) corresponding to gene YWHAZ seems to bethe second most important protein in these mediatorprocesses. This is in concert with the literature, statingthat P63104 is a chaperon [12] and is richly connectedto several kinds of other molecules with mostly weaklinks [13]. Specifically, it is involved in cell growth andcarcinogenesis [14], breast cancer reoccurrence afterchemotherapy resistance [15], luteal sensitivity to PGF[16] and, finally, it is part of antiapoptotic (P13K/AKT)and cell proliferation (ERK/MAPK) pathways [17]. Itsconnecting position has been demonstrated by networkanalysis, showing its involvement in several HSNs (high-scoring subnetworks [18]). Ogihara et al. [19] suggestedthat the association with 14-3-3 protein may play a rolein the regulation of insulin sensitivity by interruptingthe association between the insulin receptor and IRS1. Itmeans that P63104 probably mediate HD and HOthrough the regulation process of insulin (as insulin is acrucial hormone in human metabolic system). Typically
it is not directly responsible for diseases (not assigned toany disease in the OMIM database) but very frequentlymentioned as a candidate protein in the background,requiring further investigation [14].The most important protein, P62993 (Growth factor
receptor-bound protein 2) corresponding to gene GRB2leads in all of the six structural importance ranks. Itappears in the mammalian Grb2-Ras signaling pathwaywith SH2/SH3 domain interactions and several func-tions in embryogenesis and cancer [20]. Zhang et al.[21] also found that GRB2 is essential for cardiac hyper-trophy and fibrosis in response to pressure overload andthat different signaling pathways downstream of GRB2regulate fibrosis, fetal gene induction, and cardiomyo-cyte growth. Yet, in the subgraph of the HO mediators,P62993 does not seem to occupy a central position butits phenotypic traits are likely to be affected through thelinks to non-mediators instead of other HO mediators.This kind of structural arrangement is advantageous forinformation integration, while a strongly connectedmediator subnetwork implies functional redundancy.Among the three exclusive HO (non-HD) mediators,
O14908 (PDZ domain-containing protein GIPC1) corre-sponding to the gene GIPC1 appears in the HO mediatorsubgraph, while the other two are isolated (Q14232 -Translation initiation factor eIF-2B subunit alpha corre-sponding to gene EIF2B1; Q5JY77 - G-protein coupledreceptor-associated sorting protein 1 corresponding togene GPRASP1). This may suggest also that O14908 is anHD mediator. Its connection to heart disease is clear butits interaction with diabetes-related proteins is not
a b Figure 3 The HD (a) and HO (b) networks: pink and orange nodes are the HD and HO mediators, respectively, while the white nodesare their non-mediator neighbours.
Nguyen et al. BMC Systems Biology 2011, 5:179http://www.biomedcentral.com/1752-0509/5/179
Page 5 of 13

documented in the OMIM databases (also not for theother two proteins). However, this inferred function is wellsupported by Klammt et al. [22] reporting on the role ofO14908 in diabetes. A possible outcome of network analy-sis is to suggest potential updates in the databases.The only protein that ranks higher than HD mediator
proteins in the degree-based centrality rank of the HDnetwork is P00533 (Epidermal growth factor receptor),corresponding to the gene EGFR. We could speculatethat this protein might also mediate between H and Dproteins. In the total PPI network, it is linked to two Dproteins (Q9UQF2 - JNK-interacting protein 1;
Q9UQQ2 - Signal transduction protein Lnk) but not toH protein. EGFR and its ligands are cell signaling mole-cules involved in a wide range of cellular functions,including cell proliferation, differentiation, motility, andtissue development [23]. Research on EGFR’s pathogen-esis have been focused on lung cancer [24] and have notdiscovered its link to heart diseases. However, Iwamotoand his colleagues observed the role of ErbB signaling inheart functions [25]. Also, it has been shown to be acentral protein according to other sophisticated networkanalysis techniques [26], dominating the clique composi-tion of certain pathways.
Figure 4 The total network: black nodes are the HD or HO mediators, while the white nodes are their non-mediator neighbours.
Nguyen et al. BMC Systems Biology 2011, 5:179http://www.biomedcentral.com/1752-0509/5/179
Page 6 of 13
Based on our static, structural inference, it is not easyto decide whether a protein is „strongly linked to a dis-ease” or it is a „disease protein”. The definitions are verypoor here. Is P00533 a H protein (causing heart dis-eases) or HD protein (mediating between H and D pro-teins)? The solution is to use inference for generatingnew hypotheses, improving databases and designingexperiments, instead of regarding the inferred findingsas results.
ConclusionsOur study focused on only a few diseases but theapproach and the methods used can be generalized. Itmay be interesting to extend this research to other dis-eases and to study the pleiotropic effects of mediatorslinking other disease pairs. The mediator proteins ana-lyzed in this study typically have pleiotropic effects.They connect several pathways and influence several
phenotypic traits. The reason why their inferred struc-tural roles miss from the OMIM database is exactly thatthey act in a non-Mendelian way. They are typically notthe singular elements of important pathways but weakconnectors among several pathways of high importance.This way, their effects can be fundamental. Their under-standing needs a multi-locus, systems-based, networkview. As individual pathways are linked to networks, ournon-Mendelian knowledge on linkage, epistasis andpleiotropy becomes larger. If network analysis makesthese epistatic and pleiotropic effects quantifiable andpredictable, we are getting closer to better understanddelegated complexity [27]. From an application perspec-tive, it would be interesting to see whether a healthy(intact and well-connected) network of mediators couldcontribute to healthy phenotypes or, in contrary, discon-necting the mediator network could be used to isolatediseases and reduce side-effects of drugs.
0 5 10 15 20 25 30
110
500
nD
0 5 10 15 20 25
15
50500
nCC
0 10 20 30
15
501000
nBC
0 50 100 150 200 2501
10500
TI3
0 2000 4000 6000 8000
110
500
TO30.01
0 5000 10000 15000 20000
15
501000
TO30.005Figure 5 The distributions of nodal index values in the total network.
Nguyen et al. BMC Systems Biology 2011, 5:179http://www.biomedcentral.com/1752-0509/5/179
Page 7 of 13

MethodsDataWe have analyzed human protein-protein interactionnetwork (PPI) data extracted from the I2D database.I2D (Interologous Interaction Database) is an on-linedatabase of known and predicted mammalian andeukaryotic protein-protein interactions [28]. It is one of
the most comprehensive sources of known and pre-dicted eukaryotic PPIs.We carefully considered the completeness of the PPI
network by investigating various human PPI databases.In their database, the Authors have collected data fromalmost all of the well-known human protein interactiondatabases including HRPD http://www.hprd.org/, BINDhttp://bind.ca/, MINT http://mint.bio.uniroma2.it/mint/and Intact http://www.ebi.ac.uk/intact/, among others.Those databases are built by arrange of methods, someare experimental ones, some are predicted ones, andsome are curated from the literature. By using the I2Ddatabase, we could thus construct the network integratedfrom multiple data sources. We investigated other data-bases not included in the I2D database, particularly theSTRING database http://string.embl.de/ and we foundthat almost all high-scoring interactions in STRING werecovered in our data set. Combining data from varioussources is supposed to be more comprehensive for ana-lyzing the PPI network than studying each data sourceseparately. To obtain a more reliable set of protein inter-actions, we excluded all the interactions obtained byhomology methods: only experimentally verified oneswere included in our analysis. For the disease phenotypes,the clinical Online Mendelian Inheritance in Man data-base (OMIM, [29]) was investigated. We have checkedwhether we need to update our database used in Nguyenand Jordán [6] and found that we can use the same dataset as the number of updates is negligible.
AnalysisFrom the human PPI network data, we constructed: (1)a network of proteins mediating indirect effect betweenheart disease (H) and diabetes (D) proteins (i.e. HDmediators) and their direct neighbours (i.e. HD net-work); (2) a network of proteins mediating indirecteffect between heart disease (H) and obesity (O) pro-teins (i.e. HO mediators) and their direct neighbours (i.e. HO network); and (3) an aggregated network of thetwo previous networks (i.e. total network). We consid-ered only two-step mediator proteins, directly connectedto two proteins related to different diseases and beingotherwise unconnected (so, we do not consider chainsof mediators). We have also studied the subnetworks of(1) and (2) without non-mediator neighbours. See Figure1 for schematically illustrating the relationships betweenthese five networks. Figure 2 shows the subnetworkswithout non-mediator neighbours (Figure 2a for HDand Figure 2b for HO). Figure 3a shows the HD andFigure 3b shows the HO network. The total network isshown in Figure 4.Earlier we have determined the identity of these HD
and HO mediators and quantified the strength of theirmediator effect [6]. Here, we focus on the networks of
Table 1 Correlations between indices of the realnetworks.
HD nCC nBC TI3 TO30.01 TO3
0.005
nD 0.713 0.816 0.862 0.216 0.309
nCC 0.59 0.516 -0.092 -0.051
nBC 0.73 0.249 0.324
TI3 0.265 0.265
TI30.01 0.717
HO nCC nBC TI3 TO30.01 TO3
0.005
nD 0.737 0.72 0.82 0.069 0.187
nCC 0.579 0.377 -0.225 -0.138
nBC 0.625 0.181 0.249
TI3 0.262 0.302
TI30.01 0.836
total nCC nBC TI3 TO30.01 TO3
0.005
nD 0.704 0.819 0.862 0.169 0.27
nCC 0.585 0.47 -0.186 -0.132
nBC 0.732 0.223 0.307
TI3 0.272 0.29
TI30.01 0.775
The Spearman rank correlation coefficients between each pair of centralityindices for the HD and HO networks as well as the total network.
Table 2 Correlations between indices of the randomizednetworks.
HD nCC nBC TI3 TO30.01 TO3
0.005
nD 0.82 0.96 0.935 0.929 0.93
nCC 0.878 0.621 0.836 0.887
nBC 0.87 0.918 0.927
TI3 0.79 0.773
TI30.01 0.942
HO nCC nBC TI3 TO30.01 TO3
0.005
nD 0.796 0.954 0.926 0.919 0.91
nCC 0.853 0.571 0.857 0.894
nBC 0.849 0.913 0.908
TI3 0.749 0.723
TI30.01 0.95
total nCC nBC TI3 TO30.01 TO3
0.005
nD 0.839 0.962 0.936 0.931 0.933
nCC 0.893 0.647 0.864 0.901
nBC 0.874 0.921 0.931
TI3 0.792 0.779
TI30.01 0.945
The mean Spearman rank correlation coefficients between each pair ofcentrality indices obtained from 1000 random networks of the same size asthe HD, HD and the total network.
Nguyen et al. BMC Systems Biology 2011, 5:179http://www.biomedcentral.com/1752-0509/5/179
Page 8 of 13

mediators. Links in these networks are undirected (ifprotein i is linked to protein j, then j is also linked to i)and unweighted (we have no data for the intensity orstrength of the interactions). We have characterizedeach network by some simple network statistics.(i) The simplest index that provides the most local
information about node i is its degree (Di). This is thenumber of other nodes connected directly to node i. Wehave calculated the normalized degree:
nDi =Di
N − 1, (1)
where N is the number of nodes in the network.(ii) A measure of positional importance quantifies how
frequently a node i is on the shortest path betweenevery pair of nodes j and k. This index is called“betweenness centrality” (BCi) and it is used routinely innetwork analysis [30]. The normalized betweenness cen-trality index for a node i (nBCi) is:
nBCi
2×∑j<k
gjk(i)/gjk
(N − 1)(N − 2), (2)
where i ≠ j and k; gjk is the number of equally shortestpaths between nodes j and k, and gjk (i) is the numberof these shortest paths to which node i is incident (gjkmay equal one). The denominator is twice the numberof pairs of nodes without node i. This index thus mea-sures how central a node is in the sense of being inci-dent to many shortest paths in the network.(iii) “Closeness centrality” (CCi) is a measure quantifying
how short are the minimal paths from a given node i to allothers [30]. The normalized index for a node i (nCCi) is:
nCCi =N − 1
N∑j=1
dij
,(3)
Table 3 Centrality ranks for the HD network.
nD nCC nBC TI3 TO30.01 TO3
0.005
P62993 31.11 P62993 46.54 P62993 37.39 P62993 277.53 P62993 8066 P12931 20642
P63104 19.80 P12931 44.47 P63104 26.06 P63104 204.08 P63104 7107 P62993 19760
P06241 16.21 P22681 44.31 P12931 13.57 P06241 117.74 P12931 6893 P06241 19595
P12931 14.67 P00533 43.76 P17252 13.52 P12931 100.73 P06241 5541 P63104 18434
P17252 10.32 P06241 42.78 P49407 13.33 P49407 100.05 P17252 4025 P49407 16818
P49407 10.32 Q13813 42.67 P06241 12.97 P62736 95.47 P28482 2338 P62736 16177
P62736 9.81 P00519 42.01 P62736 11.69 P17252 90.13 P07948 2104 P17252 15588
P28482 8.97 P21333 41.75 P02768 10.94 P02768 86.69 P62736 1875 P28482 13598
P27361 7.43 P63104 41.74 P28482 9.30 P28482 66.61 P27361 1800 P22681 13337
P02768 7.19 P17252 41.69 P22681 5.71 P27361 52.43 P49407 1661 P07948 12088
P22681 5.42 P07355 41.48 P27361 5.35 Q03135 36.93 P22681 1634 P27361 9436
P07948 5.37 P61978 41.45 Q03135 4.67 P22681 36.86 P51681 1280 Q03135 9271
Q03135 4.58 P28482 41.39 P07948 3.38 P07948 35.10 P05129 955 P41240 7227
P41240 2.80 Q02156 40.82 P09471 2.25 Q99962 18.32 P09471 925 P05129 3574
P05129 2.43 P29353 40.77 Q99962 2.08 P05106 18.32 O15303 875 P05106 3532
P05106 2.38 P07900 40.70 P05106 2.02 P09471 18.02 O15492 875 P98082 1867
Q99962 2.01 P62988 40.68 P41240 1.44 P05129 17.42 O15539 875 P51681 1828
P09471 1.54 O14939 40.64 P00533 0.97 P41240 15.68 O15552 875 Q99962 1730
P13500 1.03 P43405 40.52 Q9UBS5 0.89 P48745 6.64 O43566 875 P18031 1574
O14788 0.79 Q06124 40.51 P18545 0.84 P13500 6.11 O43665 875 P00533 1521
P80098 0.79 Q07889 40.51 P13500 0.84 P80098 5.16 O76081 875 O15492 1504
P48745 0.61 P06396 40.29 P05129 0.82 P54646 5.08 P04899 875 P04004 1471
P00533 0.51 P56945 40.28 P06396 0.80 O14788 4.81 P08913 875 P49757 1471
P80075 0.51 P06213 40.19 P48745 0.76 P80075 2.53 P16473 875 P16284 1440
P54646 0.47 O43707 40.16 P80098 0.69 Q99616 2.42 P18545 875 P29353 1440
Q99616 0.47 Q05655 40.06 P61981 0.69 P00533 2.14 P18825 875 Q05397 1440
P29353 0.42 P49407 40.01 P11532 0.67 P29353 1.58 P30542 875 Q99704 1440
P06213 0.37 Q15746 40.00 O14788 0.64 P17302 1.51 P32302 875 P31751 1308
P17302 0.37 P23528 39.93 Q92616 0.62 P43405 1.44 P34998 875 P02751 1297
P43405 0.37 Q00839 39.93 P02751 0.59 P06213 1.43 P35372 875 P06756 1297
The rank of the most central 30 nodes in the HD network, based on the six importance indices analyzed.
Nguyen et al. BMC Systems Biology 2011, 5:179http://www.biomedcentral.com/1752-0509/5/179
Page 9 of 13

where i≠j, and dij is the length of the shortest pathbetween nodes i and j in the network. This index thusmeasures how close a node is to others. The larger nCCi
is for node i, the more directly its deletion will affect themajority of other nodes.(iv) Topological importance can also be quantified
by general matrix algebra. In an undirected network,we define an,ij as the effect of j on i when i can bereached from j in n steps. The simplest way of calcu-lating an,ij is when n = 1 (i.e. the effect of j on i in 1step):
a1,i,j =1Di
, (4)
where Di is the degree of node i (i.e. the number ofits direct neighbours). We assume that indirect effectsare multiplicative and additive. For instance, we wishto determine the effect of j on i in 2 steps, and thereare two such 2-step pathways from j to i: one is
through k and the other is through h. The effects of jon i through k is defined as the product of two directeffects (i.e. a1,kj×a1,ik), therefore the term multiplica-tive. Similarly, the effect of j on i through h equals toa1,hj,1×a1,ih. To determine the 2-step effect of j on i(a2,ij), we simply sum up those two individual 2-stepeffects:
a2,ij = a1,kj · a1,ik + a1,hj · a1,ih, (5)
and therefore the term additive. When the effect ofstep n is considered, we define the effect received bynode i from all other nodes in the same network as:
ψn,i =N∑
j=1
an,ij, (6)
which is equal to 1 (i.e. each node is affected by thesame unit effect.). Furthermore, we define the n-stepeffect originated from node i as:
Table 4 Centrality ranks in the HO network.
nD nCC nBC TI3 TO30.01 TO3
0.005
P62993 38.17 P62993 50.40 P62993 47.09 P62993 307.09 P62993 6637 P62993 14457
P63104 24.30 P12931 46.24 P63104 32.23 P63104 215.63 P63104 6333 P63104 14457
P06241 19.89 P21333 45.68 P17252 17.01 P06241 134.44 P12931 5744 P49407 14244
P12931 17.99 P07355 45.61 P12931 16.91 P12931 117.55 P06241 5056 P17252 12792
P17252 12.67 Q13813 45.61 P49407 16.71 P49407 108.09 P17252 3089 P12931 12396
P49407 12.67 P22681 45.42 P06241 16.12 P17252 106.48 P28482 2667 P06241 10742
P28482 11.00 P00533 45.40 P28482 13.75 P28482 88.40 P49407 1797 P28482 10633
P41240 3.44 P61978 44.96 Q5JY77 4.04 Q5JY77 26.59 P41240 1035 P41240 4498
Q5JY77 2.69 Q07889 44.56 O14908 3.32 O14908 22.70 P07550 244 O14908 3414
O14908 2.58 Q13322 44.56 P41240 2.03 P41240 19.48 Q14232 242 Q5JY77 3363
Q14232 0.97 P06241 44.20 P07550 1.51 Q14232 8.44 P08913 215 P04629 3281
P54646 0.57 P11142 44.16 Q14232 0.94 P54646 5.41 P14866 215 P08588 3281
P00533 0.34 P07900 44.01 P08588 0.73 P07550 1.40 P18089 215 P98164 3281
P07550 0.34 P62988 44.00 P54646 0.69 P07900 1.37 P18825 215 P07550 2835
P07900 0.34 P63104 43.46 P21333 0.59 P00533 1.32 P81605 215 P08069 1976
P22681 0.34 P29353 43.38 P07900 0.57 P61978 1.28 O14908 208 O00222 1872
P29353 0.34 P35568 43.32 P07355 0.51 P22681 1.28 Q92793 189 O15534 1872
P61978 0.34 P00519 43.29 Q13813 0.51 P29353 1.25 P23508 186 O43193 1872
O14939 0.29 P56945 43.29 P61978 0.51 P21333 1.19 P05198 185 O43504 1872
P04049 0.29 P28482 42.94 Q9UQ35 0.48 P07355 1.18 P13667 180 O60518 1872
P06213 0.29 O43707 42.74 P00533 0.47 Q13813 1.18 P20042 180 O60925 1872
P07355 0.29 P11274 42.74 O43707 0.46 P04049 1.12 P49703 180 O75665 1872
P21333 0.29 P02545 42.47 P11274 0.46 Q02156 1.12 P49770 180 O95295 1872
P49023 0.29 P05783 42.47 P22681 0.46 Q05513 1.12 P52565 180 P08173 1872
P98082 0.29 Q16658 42.47 P04629 0.46 Q07889 1.11 Q13144 180 P08912 1872
Q02156 0.29 P17252 42.45 P23458 0.41 Q13322 1.11 Q9BYD3 180 P11229 1872
Q05513 0.29 P23458 42.45 P11142 0.39 P06213 1.06 Q9NR50 180 P20309 1872
Q07889 0.29 P04049 42.41 Q7KZI7 0.39 P08588 1.05 Q5JY77 168 P21452 1872
Q13322 0.29 Q02156 42.41 P30556 0.39 P49023 1.03 O00418 165 P25025 1872
Q13813 0.29 Q05513 42.41 Q07889 0.37 O14939 1.02 O00763 165 P25103 1872
The rank of the most central 30 nodes in the HO network, based on the six importance indices analyzed.
Nguyen et al. BMC Systems Biology 2011, 5:179http://www.biomedcentral.com/1752-0509/5/179
Page 10 of 13

Table 5 Centrality ranks in the total network.
nD nCC nBC TI3 TO30.01 TO3
0.005
P62993 30.23 P62993 46.11 P62993 36.84 P62993 278.83 P62993 8381 P62993 23017
P63104 19.10 P12931 44.07 P63104 25.10 P63104 201.37 P12931 6791 P63104 22032
P06241 15.81 P22681 43.81 P12931 13.34 P06241 118.70 P63104 6489 P12931 21112
P12931 14.28 P00533 43.04 P17252 13.07 P12931 101.69 P06241 5322 P49407 19777
P49407 10.00 P06241 42.16 P49407 12.99 P49407 98.76 P17252 2966 P06241 19449
P17252 9.96 Q13813 42.00 P06241 12.50 P62736 95.29 P28482 2240 P17252 19070
P62736 9.51 P17252 41.64 P62736 11.36 P17252 88.26 P07948 2084 P62736 17788
P28482 8.78 P63104 41.38 P02768 10.53 P02768 86.12 P62736 1818 P22681 13383
P27361 7.03 P00519 41.20 P28482 9.33 P28482 68.56 P49407 1784 P28482 13267
P02768 6.94 P21333 41.12 P22681 5.49 P27361 51.72 P27361 1734 P07948 12041
P22681 5.27 P28482 41.10 P27361 5.11 P22681 36.87 P22681 1628 P27361 8970
P07948 5.18 P07355 40.88 Q03135 4.51 Q03135 36.27 P05129 944 Q03135 8488
Q03135 4.37 P61978 40.67 P07948 3.22 P07948 35.12 P41240 677 P41240 7515
P41240 2.70 Q02156 40.28 Q5JY77 2.91 Q5JY77 24.85 P13500 559 P09471 4708
P05129 2.34 P29353 40.26 O14908 2.60 O14908 22.16 Q03135 552 O14908 4366
P05106 2.30 O14939 40.12 P09471 2.15 Q99962 18.30 P08254 525 Q5JY77 4319
Q5JY77 2.16 P62988 40.12 Q99962 2.01 P05106 18.15 P03956 511 P08588 4194
O14908 2.12 P43405 40.00 P05106 1.91 P09471 18.11 P05106 497 P05129 3488
Q99962 1.94 Q06124 39.99 P41240 1.45 P05129 17.16 P80075 444 P05106 3468
P09471 1.58 O43707 39.91 P00533 0.90 P41240 15.63 P80098 444 P04629 3288
P13500 0.90 P07900 39.86 P07550 0.89 Q14232 8.00 Q99616 438 P98164 3193
O14788 0.86 Q07889 39.82 Q9UBS5 0.83 P48745 6.63 P51681 435 P41143 2733
P80098 0.77 P49407 39.78 P05129 0.80 O14788 5.75 O14788 412 P35372 2721
Q14232 0.77 P06213 39.71 P18545 0.76 P13500 5.57 O00590 400 P07550 2551
P48745 0.59 P56945 39.58 P06396 0.75 P80098 5.25 P39900 400 P49795 2464
P00533 0.50 P06396 39.57 Q14232 0.74 P54646 5.07 P41597 400 P08648 2456
P80075 0.50 Q15746 39.50 P48745 0.73 P80075 2.48 P51677 400 Q08116 2452
P54646 0.45 Q05655 39.39 O14788 0.73 Q99616 2.38 Q9NPB9 400 P41594 2155
Q99616 0.45 P11142 39.31 P13500 0.71 P00533 2.12 P32246 373 P08069 1854
P29353 0.41 P35568 39.24 P61981 0.66 P29353 1.57 Q16570 373 P98082 1810
The rank of the most central 30 nodes in the total network, based on the six importance indices analyzed.
Table 6 Correlations between p-values and centrality.
nD nCC nBC TI3 TO30.01 TO3
0.005
HD/D 0.2568 0.3077 0.2635 0.2577 0.3365 0.2321
HD/TI 0.2467 0.2216 0.2062 0.1677 0.4971 0.3017
HD/TO 0.3957 0.432 0.3993 0.3775 0.3803 0.3386
nD nCC nBC TI3 TO30.01 TO3
0.005
HO/D 0.1501 0.144 0.1767 0.1925 0.1766 0.1487
HO/TI 0.0966 0.0007 0.0919 0.1127 0.1467 0.1254
HO/TO 0.3064 0.4051 0.3396 0.3211 0.3446 0.251
nD nCC nBC TI3 TO30.01 TO3
0.005
total/D 0.2687 0.2605 0.2136 0.1853 0.4245 0.3045
total/TI 0.2687 0.2605 0.2136 0.1853 0.4245 0.3045
total/TO 0.3734 0.3692 0.3599 0.3372 0.4258 0.3092
The Spearman rank correlation coefficients between the p-values of GO terms calculated for the most central nodes according to particular indices in particularnetworks and the node centrality values of the nodes. Bold numbers mean p < 0.05.
Nguyen et al. BMC Systems Biology 2011, 5:179http://www.biomedcentral.com/1752-0509/5/179
Page 11 of 13

σn,i =N∑
j=1
an,ji, (7)
which may vary among different nodes (i.e. effects ori-ginated from different nodes may be different). Here, wedefine the topological importance of node i when effects“up to” n step are considered as:
TIni =
n∑m=1
σm,i
n=
n∑m=1
N∑j=1
am,ji
n,
(8)
which is simply the sum of effects originated fromnode i up to n steps (one plus two plus three...up to n)averaged over by the maximum number of steps consid-ered (i.e. n). This TIn index measures the positionalimportance of a node by considering how effects origi-nated from such a given node can spread through thewhole network to reach all nodes after a pre-defined nstep length [31]. Calculations were performed by theCosBiLAB Graph software [32].(v) Basically every node in a network is connected to
each other, but it still matters how strongly they areconnected (whether two nodes are neighbors in the net-work, second neighbors or more distant ones). Thus, itis of interest to study the indirect neighborhood of par-ticular nodes, considering more than only the neighborsbut less than the whole network. For a given step lengthn and a given network, there is an interaction matrixpresenting the relative strengths of interactions betweeneach pair of nodes i and j. We note that interactionstrength is used here in a totally structural sense, withno dynamical component. If n exceeds 2 or 3, and thenetwork is not very large, then there is non-zero inter-action strength between each pair of nodes (everythingis connected to everything else). Thus, an effect thresh-old (t) can be set, determining the “effective range” ofthe interaction structure of a given graph node i, andnodes within this effective range are defined as stronginteractors of i (i.e. effects received from i being greaterthan t) whereas nodes outside this range are defined asi’s weak interactors (effects received from i is less thant). Since the sets of strong interactors of two or morenodes may overlap, it is possible to quantify this overlap(the number of shared strong interactors) in order tomeasure the positional uniqueness of individual graphnodes. The topological overlap between nodes i and j upto n steps (TOn
t, ij) is the number of strong interactorsappearing in both i’s and j’s effective ranges determinedby the threshold t. The sum of all TO-values betweennode i and others provides the summed topologicaloverlap of node i:
TOnt,i =
N∑
j=1
TOnt,ij(i �= j). (9)
For simplicity of representation, we drop the subscripti for all indices. A more detailed description of thisindex can be found in [33]. Calculations were performedby the CosBiLAB Graph software [32]. Two thresholdshave been used, t1 = 0.01 and t2 = 0.005.Each of the six above mentioned structural indices
were determined for every node in the networks. The 30most central ones are presented for the HD network(Table 3), the HO network (Table 4) and the total net-work (Table 5). Additional File 2 presents all indexvalues for all nodes in these networks.Since different network indices provide different rank-
ings, it is a question of how similar these rankings are.Similarity refers to robust importance ranks (irrespectiveto the index), while dissimilarity refers to the comple-mentary information content of the different indices.For statistical analysis, we calculated the Spearman rankcorrelation coefficient for each pair of the indices in thethree major networks (Table 1).In order to better understand the ranking of nodal
indices, we determined the distribution of each struc-tural index for each network. We present these distri-butions for the total network in Figure 5. To test thesignificance of the observed rank correlation coeffi-cients, we have constructed random networks. Foreach of our observed networks (i.e. HD, HO, total), wecalculated the probability of two nodes being linkedtogether:
p =L
(N2 −N)/2. (10)
We have constructed 1000 random networks withfixed N and a p link probability. For each random net-work, we calculated the same centrality indices anddetermined the Spearman rank correlation coefficientfor each pair of centrality indices. Since we have 1000random networks, for each pair of centrality indices wethus have 1000 Spearman rank correlation coefficients.From their distribution, we determined the mean andthe 95% confidence intervals. Results are summarized inTable 2.For the top 30 nodes ranked by a particular index in a
particular network, we quantified their biological func-tion by calculating the p-values of GO terms [34]. Speci-fically, we determined the ratio of the top 30 nodes thatcan be characterized by a certain GO term and com-puted the associated p-values (Table 6). Bold numbersmean p < 0.05.
Nguyen et al. BMC Systems Biology 2011, 5:179http://www.biomedcentral.com/1752-0509/5/179
Page 12 of 13
Additional material
Additional file 1: Network indices for three networks. The values ofthe six network indices are given here for all nodes in the threenetworks.
Additional file 2: The GO terms and p-values studied in this paper.The extracted GO terms and their statistics of proteins ranked bydifferent structural indices for the HD network, the HO network and thetotal network.
AbbreviationsOMIM: Online Mendelian Inheritance in Man; PPI: protein-protein interaction;D: degree; BC: betweenness centrality; CC: closeness centrality; TI: topologicalimportance; TO: topological overlap; GO: gene ontology
Author details1The Microsoft Research - University of Trento, Centre for Computational andSystems Biology, Povo/Trento, Italy. 2Institute of Statistical Science, AcademiaSinica, Taipei, Taiwan.
Authors’ contributionsTPN suggested the key idea, analyzed the database and wrote the paper.WCL contributed to analysis and wrote the paper. FJ made network analysisand wrote the paper. All authors read and approved the final manuscript.
Received: 5 July 2011 Accepted: 31 October 2011Published: 31 October 2011
References1. Barabási AL, Oltvai ZN: Network biology: understanding the cell’s
functional organization. Nature Reviews Genetics 2004, 5:101-113.2. Jeong H, Mason SP, Barabasi AL, Oltvai ZN: Lethality and centrality in
protein networks. Nature 2001, 411:41-42.3. He X, Zhang J: Why do hubs tend to be essential in protein networks?
PLoS Genet 2006, 2:e88.4. Goh KI, Cusick ME, Valle D, Childs B, Vidal M, Barabasi AL: The human
disease network. Proceedings of the National Academy of Sciences USA 2006,104:8685-8690.
5. Oti M, Brunner HG: The modular nature of genetic diseases. ClinicalGenetics 2006, 71:1-11.
6. Nguyen TP, Jordán F: A quantitative approach to study indirect effectsamong disease proteins in the human protein interaction network. BMCSystems Biology 2010, 4:103.
7. Promislow DEL: Protein networks, pleiotropy and the evolution ofsenescence. Proc Roy Soc L B 2004, 271:1225-1234.
8. Tyler AL, Asselbergs FW, Williams SM, Moore JH: Shadows of complexity:what biological networks reveal about epistasis and pleiotropy. BioEssays2009, 31:220-227.
9. Yu H, Kim PM, Sprecher E, Trifonov V, Gerstein M: The importance ofbottlenecks in protein networks: Correlation with gene essentiality andexpression dynamics. PLoS Comput Biol 2007, 3:e59.
10. Zou L, Sriswasdi S, Ross B, Missiuro PV, Liu J, Ge H: Systematic analysis ofpleiotropy in C. elegans early embryogenesis. PLoS Comput Biol 2008, 4:e1000003.
11. Featherstone DE, Broadie K: Wrestling with pleiotropy: Genomic andtopological analysis of the yeast gene expression network. BioEssays2002, 24:267-274.
12. Patrick DM, Zhang CC, Tao Y, Yao H, Qi X, Schwartz RJ, Huang LJS,Olson EN: Defective erythroid differentiation in miR-451 mutant micemediated by 14-3-3z. Genes Dev 2010, 24:1614-1619.
13. Csermely P: Strong links are important, but weak links stabilize them.Trends in Biochemical Sciences 2004, 29:331-334.
14. Lin MT: Identification of frequent gains of DNA copy number andcharacterization of potential novel oncogenes in head and necksquamous cell carcinoma. PhD thesis, The Ohio State University; 2007, 143.
15. Li Y, Zou L, Li Q, Richardson AL, Wang ZC: Amplification of LAPTM4B andYWHAZ contributes to chemotherapy resistance and recurrence ofbreast cancer. Nature Medicine 2010, 16:214-218.
16. Goravanahally MP, Salem M, Yao J, Inskeep EK, Flores JA: Differential geneexpression in the bovine corpus luteum during transition from earlyphase to midphase and its potential role in acquisition of luteolyticsensitivity to prostaglandin F2 Alpha. Biology of Reproduction 2009,80:980-988.
17. Tsui IF, Poh CF, Garnis C, Rosin MP, Zhang L, Lam WL: Multiple pathwaysin the FGF signaling network are frequently deregulated by geneamplification in oral dysplasias. International Journal of Cancer 2009,125:2219-2228.
18. Liu M, Liberzon A, Kong SW, Lai WR, Park PJ, Kohane IS, Kasif S: Network-based analysis of affected biological processes in Type 2 Diabetesmodels. PLoS Genetics 2007, 3:e96.
19. Ogihara T, Isobe T, Ichimura T, Taoka M, Funaki M, Sakoda H, Onishi Y,Inukai K, Anai M, Fukushima Y, Kikuchi M, Yazaki Y, Oka Y, Asano T: 14-3-3protein binds to insulin receptor substrate-1, one of the binding sites ofwhich is in the phosphotyrosine binding domain. J Biol Chem 1997,272:25267-25274.
20. Cheng AM, Saxton TM, Sakai R, Kulkarni S, Mbamalu G, Vogel W,Tortorice CG, Cardiff RD, Cross JC, Muller WJ, Pawson T: Mammalian Grb2regulates multiple steps in embryonic development and malignanttransformation. Cell 1998, 95:793-803.
21. Zhang S, Weinheimer C, Courtois M, Kovacs A, Zhang CE, Cheng AM,Wang Y, Muslin AJ: The role of the Grb2-p38 MAPK signaling pathway incardiac hypertrophy and fibrosis. J Clin Invest 2003, 111:833-841.
22. Klammt J, Pfäffle R, Werner H, Kiess W: IGF signaling defects as causes ofgrowth failure and IUGR. Trends in Endocrinology and Metabolism 2008,19:197-205.
23. Wang K, Yamamoto H, Chin JR, Werb Z, Vu TH: Epidermal growth factorreceptor-deficient mice have delayed primary endochondral ossificationbecause of defective osteoclast recruitment. J Biol Chem 2004,279:53848-53856.
24. Herbst RS, Heymach JV, Lippman SM: Lung cancer. New Eng J Med 2008,359:1367-1380.
25. Iwamoto R, Yamazaki S, Asakura M, Takashima S, Hasuwa H, Miyado K,Adachi S, Kitakaze M, Hashimoto K, Raab G, Nanba D, Higashiyama S,Hori M, Klagsbrun M, Mekada E: Heparin-binding EGF-like growth factorand ErbB signaling is essential for heart function. Proc Natl Acad Sci USA2003, 100:3221-3226.
26. Massa MS, Chiogna M, Romualdi C: Gene set analysis exploiting thetopology of a pathway. BMC Systems Biology 2010, 4:121.
27. Szathmáry E, Jordán F, Pál Cs: Can genes explain biological complexity?Science (Perspective) 2001, 292:1315-1316.
28. Brown KR, Jurisica I: Online predicted human interaction database.Bioinformatics 2005, 21:2076-2082.
29. Hamosh A, Scott AF, Amberger JS, Bocchini CA, McKusick VA: OnlineMendelian Inheritance in Man (OMIM), a knowledgebase of humangenes and genetic disorders. Nucleic Acids Res 2005, 33:D514-D517.
30. Wassermann S, Faust K: Social Network Analysis. Cambridge UniversityPress, Cambridge; 1994.
31. Jordán F, Liu WC, van Veen FJF: Quantifying the importance of speciesand their interactions in a host-parasitoid community. CommunityEcology 2003, 4:79-88.
32. Valentini R, Jordán F: CoSBiLab Graph: the network analysis module ofCoSBiLab. Environmental Modelling and Software 2010, 25:886-888.
33. Jordán F, Liu WC, Mike Á: Trophic field overlap: a new approach toquantify keystone species. Ecological Modelling 2009, 220:2899-2907.
34. The Gene Ontology Consortium: Gene ontology: tool for the unificationof biology. Nat Genet 2000, 25:25-9.
doi:10.1186/1752-0509-5-179Cite this article as: Nguyen et al.: Inferring pleiotropy by networkanalysis: linked diseases in the human PPI network. BMC Systems Biology2011 5:179.
Nguyen et al. BMC Systems Biology 2011, 5:179http://www.biomedcentral.com/1752-0509/5/179
Page 13 of 13