inferring mood instability on social media by … · inferring mood instability on social media by...
TRANSCRIPT
95
Inferring Mood Instability on Social Media by Leveraging
Ecological Momentary Assessments
KOUSTUV SAHA, Georgia Institute of Technology
LARRY CHAN, Georgia Institute of Technology
KAYA DE BARBARO, Georgia Institute of Technology
GREGORY D. ABOWD, Georgia Institute of Technology
MUNMUN DE CHOUDHURY, Georgia Institute of Technology
Active and passive sensing technologies are providing powerful mechanisms to track, model, and understand a range of health
behaviors and well-being states. Despite yielding rich, dense and high fidelity data, current sensing technologies often require
highly engineered study designs and persistent participant compliance, making them difficult to scale to large populations and to
data acquisition tasks spanning extended time periods. This paper situates social media as a new passive, unobtrusive sensing
technology. We propose a semi-supervised machine learning framework to combine small samples of data gathered through
active sensing, with large-scale social media data to infer mood instability (MI) in individuals. Starting from a theoretically-
grounded measure of MI obtained from mobile ecological momentary assessments (EMAs), we show that our model is able
to infer MI in a large population of Twitter users with 96% accuracy and F-1 score. Additionally, we show that, our model
predicts self-identifying Twitter users with bipolar and borderline personality disorder to exhibit twice the likelihood of high MI,
compared to that in a suitable control. We discuss the implications and the potential for integrating complementary sensing
capabilities to address complex research challenges in precision medicine.
Additional Key Words and Phrases: Social media; EMA; Ecological Momentary Assessments; Affect; Mood; Mood Instability;
Affective Instability; Mental Well-Being; Twitter; Health
ACM Reference format:
Koustuv Saha, Larry Chan, Kaya de Barbaro, Gregory D. Abowd, and Munmun De Choudhury. 2017. Inferring Mood Instability
on Social Media by Leveraging Ecological Momentary Assessments. Proc. ACM Interact. Mob. Wearable Ubiquitous Technol.
1, 3, Article 95 (September 2017), 27 pages.
http://doi.org/10.1145/3130960
1 INTRODUCTION
Mood and emotion are central constructs in the assessment of an individual’s mental well-being. While it is
typical for healthy individuals to fluctuate between various moods and feelings, a number of mood disorders
are characterized by patterns of persistence or fluctuation in mood. For example, persistent negative affect is a
diagnostic criterion of depression [6], and swings between depressed and elevated mood states are symptoms of
bipolar disorder [3]. In general, for many psychotic disorders and experiences, the ebb and flow of symptoms is
known to covary with changes in mood and affect [6, 55, 59].
Permission to make digital or hard copies of all or part of this work for personal or classroom use is granted without fee provided that copies are
not made or distributed for profit or commercial advantage and that copies bear this notice and the full citation on the first page. Copyrights for
components of this work owned by others than ACM must be honored. Abstracting with credit is permitted. To copy otherwise, or republish, to
post on servers or to redistribute to lists, requires prior specific permission and/or a fee. Request permissions from [email protected].
© 2017 Association for Computing Machinery.
2474-9567/2017/9-ART95
http://doi.org/10.1145/3130960
Proceedings of the ACM on Interactive, Mobile, Wearable and Ubiquitous Technologies, Vol. 1, No. 3, Article 95. Publication date:
September 2017.
95:2 • K. Saha et al
In addition to being a core criterion for many mood disorders, certain patterns of daily mood may also be
important for predicting the onset of mood and psychiatric disorders. For instance, a number of studies have observed
that individuals who show abnormally unstable moods are more likely to later develop severe psychosis [17].
Specifically, mood instability may indicate challenges with emotion regulation. Emotion regulation is the process,
which influences the emotional experience of an individual, as well as, how and when she expresses an emotion [35].
Difficulty in regulating emotions, in terms of their intensity or duration is, therefore, theorized to be at the root of
most major psychopathologies [64]. Consequently, measuring mood instability, or frequent temporal changes of
mood, in terms of its two dimensions, valence and arousal [63], is recognized to be critical in understanding causal
pathways between mood and mental well-being, as well as in developing intervention capabilities that can bring
timely help to those in need [63].
However, current capabilities to measure mood instability are limited. To measure mood instability, psychologists
and clinicians have deployed validated survey instruments, such as the Affective Lability Scale [37]. When these
instruments ask people to summarize their emotional experiences from a long segment of time in the past, the data
can be distorted by recall bias and by bias in the process of interpreting and integrating past experience [70]. When
researchers measure affect infrequently, they may further not capture short-term dynamics in mood or the context
of the experience, both of which are needed to fully describe the persistence or instability of mood. Taken together,
these weaknesses can substantially limit the utility of these instruments for the assessment of mood instability.
Since its emergence in the 1970s, a technique known as “ecological momentary assessment” (EMA), has been
increasingly applied to overcome these challenges in questionnaire-based approaches to affect measurement [19,
39, 70]. With EMAs, participants are prompted to respond to survey items sporadically throughout the day as they
engage in typical activities. In fact, in recent work, mobile phone applications have been built to make EMA data
easier to collect and less burdensome for participants [62, 81]. These modern EMA applications can therefore
be considered “active" sensors, in that they require active participation by the individual. While EMA as a form
of active sensing enables capturing affective states in an individual’s natural habitat and uses a direct method to
gather accurate in-the-moment affective information, it requires careful and highly engineered study design, as
well as continual, proactive engagement of the user to answer questions [11]. Therefore, it may be vulnerable
to high participant burden and may result in low compliance when data acquisition is required for extended
periods of time [62, 81]. Researchers have begun to employ various forms of passive sensing [71], such as by
logging an individual’s phone usage and via wearable sensors, to address these limitations [2, 8, 38, 48, 49, 52].
There has been significant success in these sensing techniques when applied in the context of affect and mood
measurement [26, 36, 77]. However, despite the dense, high fidelity data they capture, existing active and passive
sensing paradigms are prone to biases and scalability issues due to resource and logistical constraints, such as cost
and active compliance of the participants [69, 75].
This article introduces a new modality of passively sensed health, social and behavioral data, specifically that
gathered from social media, to overcome some of the challenges noted above. A growing body of work has
employed social media data as a “sensor” to identify markers and assess risk to a variety of different health and
well-being concerns that have social underpinnings, including mood and affective disorders [15, 23]. In the context
of this paper, social media based sensing of moods and their fluctuations over time can capture affective experiences
and behaviors spontaneously, reducing the significant bias impacting affect and mood recognition in controlled
environments [21]. Moreover, social media data, through quantification of language can enable capturing rich
contextual information about mood and its dynamics. However, since sensed data gathered from social media is
often sparse and often does not include gold standard markers of well-being states, research has begun to utilize
it in conjunction with other conventional forms of sensing, such as active sensing [50]. Our work in this paper
extends these early investigations.
Our research objective in this paper examines whether and how high fidelity active sensing data may be
augmented with large-scale, naturalistically-shared social media data to infer mood instability. The computational
Proceedings of the ACM on Interactive, Mobile, Wearable and Ubiquitous Technologies, Vol. 1, No. 3, Article 95. Publication date:
September 2017.
Inferring Mood Instability on Social Media by Leveraging Ecological Momentary Assessments • 95:3
investigations presented in this paper leverage a pilot mobile sensing study within the CampusLife project at
Georgia Tech, that provided access to 1,606 mobile EMAs over five weeks, and a Facebook archive of 13,340
posts from 23 college student participants. We also consider a complementary population experiencing a set of
mental health challenges who can highly benefit from capabilities that enable sensing mood instability, and who,
per literature [3, 18], are likely to exhibit signs of high mood instability. Thus we employ a Twitter corpus of
over 21 million posts from 9,654 individuals who self-reported their diagnosis of bipolar or borderline personality
disorder on the platform. Using a theoretically-grounded quantification of mood instability from EMAs [42, 76],
we make the following contributions:
• A seed classifier to detect binary mood instability status (low, high), utilizing the EMA responses of the
CampusLife participants as ground truth, and psycholinguistic attributes from their Facebook posts as features.
• A semi-supervised machine learning framework to augment the above seed classifier of mood instability by
incorporating data samples acquired from Twitter; specifically, an approach by which the model can learn from
both (scarce) labeled and (voluminous) unlabeled data around mood instability.
• A lexicon of language cues appropriated on Twitter, that are highly indicative of low or high mood instability.
Our results show that the proposed semi-supervised learning approach makes significant contributions towards
exploring how very small samples of actively sensed data can be augmented with large-scale social media data
to detect individuals’ binary mood instability status (low, high), robustly, with 96% accuracy and F-1 score. Our
proposed semi-supervised learning method can detect high mood instability, that, in comparison to a suitable control
population, reveals meaningful linguistic ‘signatures’ in the social expression of Twitter users who self-disclose
to suffer from bipolar or borderline personality disorder. Our method indicates that the bipolar and borderline
personality disorder populations exhibit high mood instability, with almost twice the likelihood of a control
population; an observation aligning with relevant literature in psychology [3, 18].
Through our findings, we demonstrate that we can use social media as a source of passively and unobtrusively
sensed data to identify individuals with high or low mood instability, and can, in fact, significantly augment existing
small-scale active sensing techniques. We situate the implications of our work within precision medicine, around
how multi-sensor integration of signals relating to health can improve our assessments and understanding of
challenging mental health concerns.
2 RELATED WORK
2.1 Mood Instability and Mental Well-Being
The Diagnostic and Statistical Manual of Mental Disorders (DSM) [6] defines mood instability as “marked shifts
from baseline mood to depression, irritability, or anxiety, usually lasting a few hours and only rarely more than a
few days”. In other words, mood instability is a form of emotional dysregulation that is accompanied by extreme,
impairing, and chronic irritability, accompanied by hyperarousal symptoms, such as markedly increased reactivity
to negative emotional stimuli, insomnia, physical restlessness, distractibility, pressured speech, intrusiveness, and
racing thoughts and ideas [54]. Prior work has studied mood instability as a common feature in many mental health
conditions, and it has been associated with poor clinical outcomes [59]. In general, studies have shown that mood
instability for bipolar disorder and borderline personality disorder patients is significantly greater than it is for
healthy controls and individuals with other disorders, such as major depression and anorexia nervosa [3, 18, 59].
For instance, Koenigsberg et al. [47] observed the presence of greater lability in terms of anger, anxiety, and
depression/anxiety oscillation in BPD patients. Furthermore, Henry et al. [40] noted that bipolar patients show
increased reactivity to emotional stimuli during the euthymic period, and such affective dimensions are associated
with the severity of the disorder. These observations motivated the selection of the datasets used in this paper to
build and validate our mood instability inference model.
Proceedings of the ACM on Interactive, Mobile, Wearable and Ubiquitous Technologies, Vol. 1, No. 3, Article 95. Publication date:
September 2017.
95:4 • K. Saha et al
However, we also note that the literature also emphasizes the challenges in measuring and characterizing the
experience of mood instability [42, 75]. Structured interviews ask respondents to judge whether they have often
had strong mood shifts within a day over the last 2 to 5 years [6] While as more formal instruments, the Self-Report
questionnaire (MOODS-SR) , the Mood Disorder Questionnaire (or MDQ) [41], and the Affective Lability Scale
(ALS) [37] are frequently used by clinical researchers to quantify affective instability. The ALS, for example, asks
respondents to rate how well a list of statements characterizes the respondent (e.g., “One minute I can be feeling
OK, and then the next minute I’m tense, jittery, and nervous."). However, no time frame is given, nor are any
thresholds provided (i.e., How many times must this experience occur in order for it to be characteristic?). Thus, it
is left to respondents to decide on the time frame for the responses (e.g., Over their lifetime? Over the past year?)
as well as the threshold for endorsement.
These traditional measures of mood instability thus rely on respondents’ retrospective recall and subjective
assessment of affective variability or reactivity on interview or questionnaire items. Regulation of mood being a
complex process [18], these methods are not able to capture the dynamics and context that embodies emotional
experiences. Moreover, it is known that memory of past events is influenced by cognitive processes used to
reconstruct past events. Since existing techniques of measuring mood instability employ retrospective recall,
individuals are more likely to recall or report experiences that seem more personally relevant, that occurred more
recently, that stand out as significant or unusual, or that are consistent with their current mood state [75]. As a
result, an individual may be biased when recalling past events or experiences, and such biases are particularly likely
when an individual is asked to aggregate moods or experiences over time. These may lead to reporting distortion
and subsequently poorer assessment of psychological states.
In essence, these self-reported questionnaire approaches do not consider the three core components of mood
instability: amplitude, frequency, and temporal dependency [42, 76]. In this paper we seek to address some of these
challenges by employing a naturalistic source of mood data, gathered from people’s social media activities.
2.2 Active Sensing of Health States with EMA
Ecological Momentary Assessment (or EMA) has been adopted as a prominent tool for active sensing of behaviors
and moods [70]. In fact, data gathered through EMAs have enabled researchers to study mood variability and
instability over time as well as the dynamic interplay between the environment, personal experiences, and psy-
chopathological symptoms [27, 28]. EMA methods prompt participants to respond to survey items sporadically
throughout the day as they engage in typical activities. EMAs have many advantages over traditional research
designs when investigators are interested in characterizing dynamic, clinically important, psychological pro-
cesses [72, 73]. Additionally, previous research shows benefits of in-the-moment data capturing over retrospective
reports [68]. The ecological nature of EMA assessments has clear advantages as mood processes can be studied in
individuals’ natural habitats, where individuals are subject to the many environmental and interpersonal factors that
typify everyday life but that cannot be recreated in a controlled setting. Moreover, compared with traditional forms
of assessment, EMA is simpler and lesser prone to bias and autobiographical memory. Noting the above strengths,
in a highly relevant study to ours, Wang et al. [78, 79] used mobile EMAs, alongside passive sensing, to gather
rich data about Dartmouth students’ activity, behaviors, mood, depression, and stress, which was then correlated
to academic performance. A number of related studies have appeared in recent years that have utilized EMAs to
reason about and infer health states, specifically around mental wellness [2, 8, 14, 65].
Despite the advantages of EMAs, active sensing poses scalability challenges, because of certain logistical and
economic constraints [69]. In particular, EMA methods impose a response burden on participants due to their
onerous and disruptive nature [74], forcing researchers to trade off between collection of large and comprehensive
datasets regarding their psychological processes of interest and reducing response burden such that participants
will consistently respond to prompts. Thus, reliable collection of excessive EMA items over an extended period of
Proceedings of the ACM on Interactive, Mobile, Wearable and Ubiquitous Technologies, Vol. 1, No. 3, Article 95. Publication date:
September 2017.

Inferring Mood Instability on Social Media by Leveraging Ecological Momentary Assessments • 95:5
time has been noted to be challenging [31], and at the extreme may also require substantial financial compensation
to be successfully achieved. Consequently, there is an emerging need to complement active sensing data sources
with passively sensed data that is captured without explicit participant input. Social media functions as one such
“passive sensor” which can be used to detect and infer mental health concerns. In addition, existing EMA techniques
typically have a bias toward certain contexts. Mobile EMA, for example, favors contexts in which individuals are
readily available to be interrupted, such that an accurate response might be obtained. Social media can alleviate
some of these challenges because of the ubiquitous and naturalistic nature of its use, and because it requires no
additional effort from a participant volunteering data, it can augment EMAs without increasing respondent burden.
Moreover, we note that, to date, only a limited number of empirical studies have utilized EMAs for assessing
mood instability [42]. Notable is the work of Trull et al., who studied mood instability in patients with borderline
personality disorder and depression, using EMAs [76]. Ebner-Priemer et al. also explored the advantages of EMAs
in assessing mood disorders and dysregulation [28]. In this paper, we extend these investigations by examining how
a pilot sample of mobile EMAs can enable inferring mood instability in a large social media population.
2.3 Mental Health Sensing with Social Media
Recent research has demonstrated social media technologies to have a number of benefits as a passive sensing
modality. In particular, it is low-cost, large-scale, non-intrusive to collect, and has the potential to comprehensively
reveal naturalistic patterns of mood, behavior, cognition, psychological states and social milieu, both in real-time
and across longitudinal time [32]. Consequently, considerable research has focused on developing approaches that
can (semi-) automatically assess health and wellness states by employing social media as a ‘sensor’. In an initial
work, we found that Twitter and Facebook based linguistic and emotional correlates for the postnatal course can
characterize and predict postpartum depression (PPD) in new mothers [22] . There have been many investigations
in this emergent area ever since: e.g., mood and depressive disorders [23], post-traumatic stress disorder [16],
eating disorders [9], addictive behaviors and substance abuse [58]. Prior work has also harnessed social media
for analyzing personality traits and their relationship to psychological well-being, through machine learning and
linguistic analysis [66]. Schwartz et al. leveraged the language on social media to predict individual well-being [67].
Further, analyzing moods with the circumplex model of affect [63], our other prior work examined how different
types of moods expressed on social media related to people’s sociability and informational engagement [21].
Despite this growing body of work, one challenge in the analysis of social media data is the limited availability
of gold standard information about individuals’ underlying psychological and emotional states. To address these
limitations, some recent studies have combined social media with active sensing data [50], specifically using the
latter as a source of ground truth. For instance, Lee et al. correlated social media activities of university students
with their mood changes, collected through EMAs [50]. However, outside of this work, to our knowledge, there is
limited research which bridges the gap between active and passive sensing. Part of the challenge stems from the fact
that studies like that of Lee et al. still require a sizable participant population to contribute both EMA and social
media data—a study design difficult to scale. In this paper, we therefore propose an approach which examines how
independently acquired large-scale social media data may be able to leverage small samples of EMA data to build
a robust mood instability classifier. We demonstrate that through this multi-sensor integration approach, we can
analyze the likelihood of mood shifts expressed in the social media feeds of a large population.
3 STUDY AND DATA
3.1 The CampusLife Study
The sensing data employed in this work is derived from a larger mobile sensing study that was conducted in April
2016 involving several college students at Georgia Tech, a large public university in the southeast of the U.S. The
study was approved by the Institutional Review Board at Georgia Tech (#H16009).
Proceedings of the ACM on Interactive, Mobile, Wearable and Ubiquitous Technologies, Vol. 1, No. 3, Article 95. Publication date:
September 2017.
95:6 • K. Saha et al
Table 1. Descriptive statistics of the DASS-21
data collected through enrollment question-
naire. Levels inferred per prior work [33].
Level Depression Anxiety Stress
Normal 26 27 26
Mild 5 6 9
Moderate 8 10 8
Severe 3 0 1
Extremely Severe 3 2 1
Table 2. Descriptive statistics of the Facebook seed dataset
collected from 23 participants in the CampusLife study.
Feature count mean median stdev.
Friends 10,578 459.91 372 321.20
Likes 3358 152.64 102 173.22
Profile Pictures 433 18.83 9 18.00
Status 13,340 580.00 294 713.48
Table 3. Descriptive statistics of the EMA
data collected in the CampusLife study.
Metric Value
Number of Participants 51
Number of Responses 1,606
Mean of Responses/Participant 31.49
Median of Responses/Participant 28.00
StDev. of Responses/Participant 21.13
Period of study 5 wks.
Table 4. Descriptive statistics of the Twitter mental health dataset.
Metric Bipolar Borderline Control
Number of Users 6,326 3,328 9,394
Number of Tweets 14,780,813 7,095,801 15,136,451
Number of Tokens 194,801,582 101,397,309 411,656,658
Mean of Tweets/User 2,336.52 2,132.15 1,611.29
Median of Tweets/User 3,398.00 2,858.00 1,131.00
StDev. of Tweets/User 1,310.27 1,374.35 1,432.05
�
��
���
���
���
���
� � � � � �� �� �� �� �� �� ��
��� �������������
�� �������
Fig. 1. Distribution of EMA re-
sponses by the hour of the day.
�
��
���
����
� �� ��� ����
��������� ����
������������
Fig. 2. Distribution of number of
users by number of tweets in the
mental health dataset.
�
���
�����
�������
���������
������ ����� �����
�� �
�������� ������
Fig. 3. Comparative statistics of
Facebook seed dataset and Twit-
ter mental health dataset.
Participants. Participants (undergraduate and graduate students at the university) were recruited by word of mouth,
flyers, and social media advertising. In addition, recruitment email messages were sent to students by the registrar
and by instructors of a mandatory course for undergraduates. A total of 51 participants enrolled in a five week-long
study (40% females and 60% males; 46% undergraduates and 54% graduates; mean age 22 years). Similar to the
study conducted within the StudentLife project [78], the smartphones (the Android operating system only) of the
participants were instrumented to collect a variety of actively and passively sensed data: active data were collected
through a commercial EMA platform, called Quedget and passive data were collected through the sensors on board.
Participants also answered different psychological survey questionnaires, during the study. At the end of the study,
participants could also volunteer for a one-time access to their social media data.
Proceedings of the ACM on Interactive, Mobile, Wearable and Ubiquitous Technologies, Vol. 1, No. 3, Article 95. Publication date:
September 2017.

Inferring Mood Instability on Social Media by Leveraging Ecological Momentary Assessments • 95:7
Study Procedure. The CampusLife study consisted of orientation, data collection and exit stages, as also employed
in the StudentLife study [78].
Orientation. At the start of the study (orientation), participants were first required to watch a pre-recorded video
and tutorial developed by the study team that described the research goals of the study, the study procedures, the
types and mechanisms of data collection, the privacy considerations, as well as the risks and benefits involved
in participation. Each participant was then provided with an IRB approved consent form to sign; on signing this
form, participants agreed to allow the research team to acquire active and passive sensing data from their personal
Android smartphones. Members of the research team also familiarized the participants with the EMA software
interface and the procedure for responding to EMA prompts on their phones.
During the study, we sought information on the participants’ intent to share with us their social media data
(through a yes/no survey question). The participants were then directed to an online survey (administered through
Qualtrics) that included a battery of already validated questionnaires to assess their mood, individual differences
(e.g., demographics), and mental well-being status (Perceived Stress Scale (PSS) , Flourishing Scale, and Depression
Anxiety and Stress Scale (DASS-21) [4] ). The purpose of using these questionnaires was to establish baselines
for the mental well-being of the participants: For instance, among the participants who answered the DASS-21
questionnaire, we found notable variation in their psychological well-being, although our study population is not a
clinical one. That is, mapping the responses given on the DASS-21 scale to levels of depression, anxiety, and stress
based on prior work [33], we observed that about 47% of our participants showed above-normal levels of either
depression, anxiety or stress (ref: Table 1). This indicates the presence of sufficient proportion of the population in
which a wide range of expression of mood instability levels may be expected.
Exit Stage. At the time of study conclusion (exit stage), participants who indicated affirmatively about their
willingness to share social media data during orientation, met with the researchers face to face. During this meeting,
they were provided with a second consent form for the social media data collection. This consent form enabled a
one-time download of a participant’s social media, specifically Facebook and/or Twitter archives which we then
de-identified and stored in a secure, encrypted server for the ensuing analysis presented in this paper. Participants
could consent to share both or either of these two types of social media data. All participants were instructed
to bring their laptop computers to this meeting, as a privacy-preserving mechanism to download their Facebook
data. Our choice of Facebook and Twitter as the two social media platforms was driven by statistics from the Pew
Research Center [34], which reports these as two of the most popular platforms in college-aged populations.
Incentives. Participants were given $40 for the time and effort required to enroll in the study and install software
on their phones. Additionally, they were paid in direct proportion for each answered EMA (up to a maximum of
$40). They were given additional compensation if they consented to share any of their social media data, with a
maximum of $40 if they shared all of the social media data we requested. As an incentive to attend the information
sessions in which we introduced the study, we provided food, beverages, and $5 gift cards to those in attendance.
3.2 Sensing Data
Next, in this subsection we describe the data collection methods employed for the purposes of the objectives we
focus on in this paper.
EMA Data. As mentioned above, we collected EMA data from the participants through a platform known as
Quedget. The process of responding to a questionnaire item can impose a burden even before a subject faces the
labor of responding. Consider the potential for annoyance when a time-sensitive prompt demands attention while
one is focused on conversing or on a complex objective [74]. Quedget is designed to use the lock-screen of a
smartphone as a way of gaining attention only when a subject is between operations. On this Android-only platform,
a researcher-defined schedule determines when and which questionnaire item is displayed on the lock-screen of a
Proceedings of the ACM on Interactive, Mobile, Wearable and Ubiquitous Technologies, Vol. 1, No. 3, Article 95. Publication date:
September 2017.

95:8 • K. Saha et al
participant’s phone. For the purposes of this study, we defined four mutually exclusive four-hour long time windows
between 9 am and 11 pm, during participants were presented with questions. Within a specific window, Quedget
calculated a random time to trigger the prompt.
Fig. 4. Screenshot
of PAM.
Our EMAs spanned a variety of questions, such as a Photographic Affect Meter (PAM) [62]
(see Figure 4). Psychology literature situates valence and arousal dimensions to comprehen-
sively describe an individual’s affective state at any moment [64], and PAM has been found
to be well-suited for the purpose [62]. The PAM EMA questions showed participants a set of
images ordered in a 4 ×4 grid, where each image corresponded to a mood of specific valence
and arousal (e.g., “angry”, “excited”, “satisfied”, “tired”) – the rightmost top image in the
grid refer to High Valence and High Arousal, whereas the leftmost bottom image refer to
Low Valence and Low Arousal (see Figure 4). Participants could select the image that best
captured their current mood. By the end of the five-week study period, we collected a total
of 1,606 PAM EMA responses spanning all of the participants; that is, for 1606 of the EMA
prompts out of a total of 3220 that were triggered, we were able to log valid responses. The
participants responded to these EMA questions mostly during the period of 9AM to 10PM,
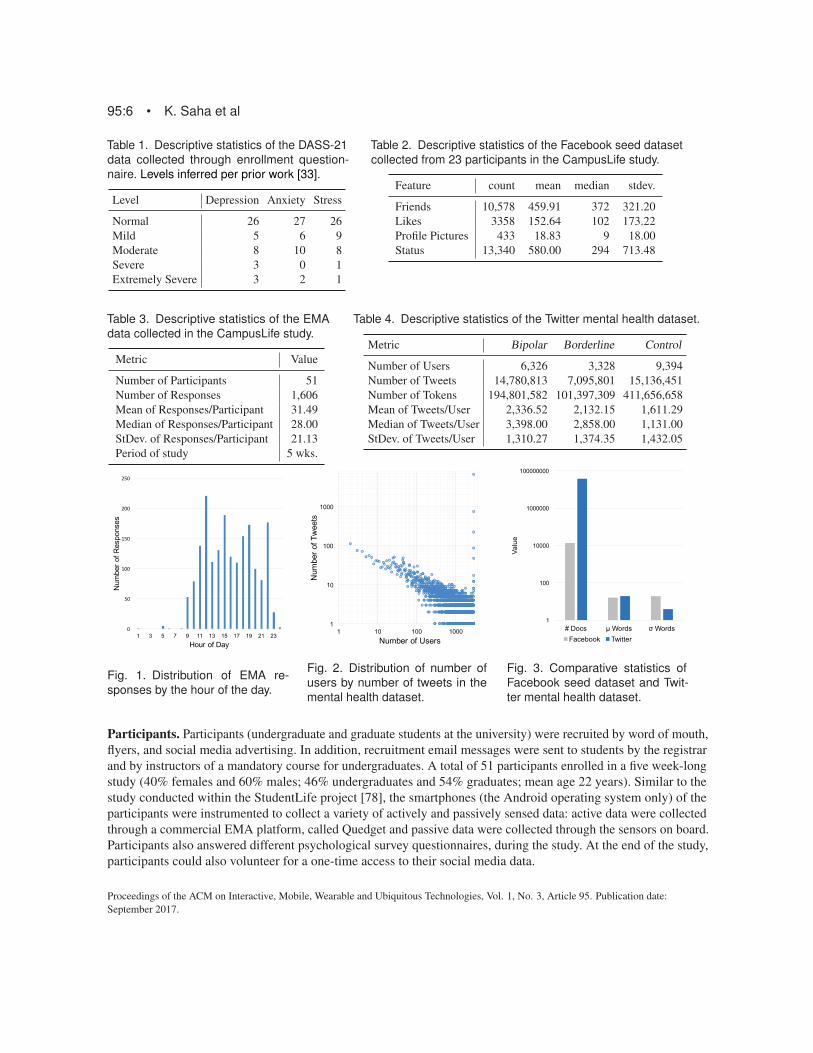
based on the previously described Quedget schedule (ref: Fig: 1). We report the studies of
our PAM EMA data in Table 3.
Social Media Data. At the exit stage of the study, participants who consented in sharing their Facebook data,
downloaded and shared their Facebook profile’s data dump (starting from the data of their account creation to the
date of data collection) as HTML files on their laptops, which they brought to the exit stage meeting. For this, the
participants used a feature provided by Facebook, wherein any user can create a data dump of items shared on their
timeline, as well as all forms of activity that they engage on the platform. To preserve the privacy expectations of
the participants, we asked the participants to personally delete their private messages and all photos from the data
dump created on their laptops. The downloaded and curated data from the participants’ laptops was then stored by
one of the study support volunteers into a detachable hard drive (per the approved IRB instructions), which was
eventually uploaded to a secure, encrypted server. These downloaded Facebook data files were finally parsed, and
timeline activities were extracted (which includes “like” information, friend connections initiated and accepted,
posts about profile pictures, status updates, check ins into different locations, etc.). For the purposes of this study,
our main focus is on the linguistic content of the 13,340 status updates of the participants. Table 2 reports the
statistics of the Facebook Data. In all, out of the 51 participants for whom we had full EMA data, we were also
able to obtain Facebook data for 23 of them. We refer to this dataset of 23 participants in the rest of this paper as
the “seed dataset”.
Further, we identified a set of 10 participants in the above population of 23 who also consented to share their
public Twitter data; that is, they shared their Twitter usernames (or handles) during the exit stage of the study.
Utilizing these handles as query terms, we leveraged Twitter’s official API to crawl all of their posts shared in their
entire timelines1. We refer to this as the “validation dataset”. It contained 1425 posts in all, with a mean and median
of 142.5 and 58.5 posts per participant respectively.
3.3 Twitter Mental Health Data
One of the limitations of the dataset collected through the above CampusLife mobile sensing study was its small
sample size, which presented significant challenges in employing it to build computational models that can detect
levels of mood instability. To circumvent this challenge, and in order to develop inference frameworks for mood
instability on larger scale of social media data, we chose Twitter as a source to augment our existing social media
data gathered through the CampusLife study. Our choice of the Twitter platform was motivated by observations and
1The API returns the last 3,200 posts of a given user, which in most cases of an average Twitter user, covers their entire timeline data.
Proceedings of the ACM on Interactive, Mobile, Wearable and Ubiquitous Technologies, Vol. 1, No. 3, Article 95. Publication date:
September 2017.
Inferring Mood Instability on Social Media by Leveraging Ecological Momentary Assessments • 95:9
Table 5. Search phrase/method for Twitter data collection for three different samples.
Bipolar Borderline Control
“i have bipolar disorder” “i have borderline personality disorder” Twitter stream with en as filter
“i have been diagnosed with bipolar dis-
order”
“i have been diagnosed with borderline
personality disorder”
Remove usernames in Bipolar and Bor-
derline datasets
“i was diagnosed with bipolar disorder” “i have been diagnosed with bpd” Remove user timelines with text contain-
ing ‘bipolar disorder’
“i suffer from bpd” Remove user timelines with text contain-
ing ‘borderline personality disorder’
“i was diagnosed with bpd”
“i am suffering from bpd”
findings in prior work: Due to its largely public nature, in contrast to Facebook, Twitter data has been utilized to
study mental health concerns [22, 23]. This facilitates not only the collection of large-scale data toward studies like
ours, but also, enables identifying and gathering data of individuals who publicly share self-reported diagnosis
of their mental health conditions, such as depression, bipolar disorder, or post-traumatic stress disorder [15].
In the scope of this study, we were particularly interested in augmenting our seed data from Facebook with
complementary Twitter data of individuals who are likely to exhibit a wide range of mood instability. As noted
earlier, two conditions wherein sufferers are known to be challenged by significant mood variability include bipolar
disorder and borderline personality disorder [3, 18, 59]. Our Twitter mental health data collection pursued a strategy
to collect data around these two conditions.
We began this second data collection by separately searching for tweets with the Twitter Search API, wherein
users had made explicit self-disclosure of the diagnosis or experience of bipolar disorder and borderline personality
disorder. These searches were spawned with a set of keyphrases given in Table 5. Our choice of the keyphrases
were motivated from prior work where a similar data acquisition strategy has been successfully applied to identify
populations struggling with a mental illness [15], and where it has been observed that these self-reports do indeed
capture actual clinical conditions as assessed by experts and psychiatrists [24]. Next, for all of these tweets, we
queried the timelines of their authors using the Twitter API, like we did for the Twitter data collection of the
CampusLife participants. Each user timeline refers to a collection of text (capped to a maximum of 3,200) tweeted
by a single user. Using this mechanism, we collected 6,326 and 3,328 user timelines of individuals who disclosed
the diagnosis or experience of bipolar disorder and borderline personality disorder respectively. Hereforth, we refer
to these datasets as Bipolar and Borderline respectively. We also collected an independent sample of tweets using
the Twitter Streaming API, which returns live tweets at a particular time. We repeated our above approach to fetch
user timelines for these tweets; then we filtered out any user who occurred in the datasets Bipolar or Borderline,
or if they mentioned ‘bipolar disorder’ or ‘borderline disorder’ in their tweets. This third sample of filtered user
timelines resulted to 9,394 users and we call this dataset Control in this paper.
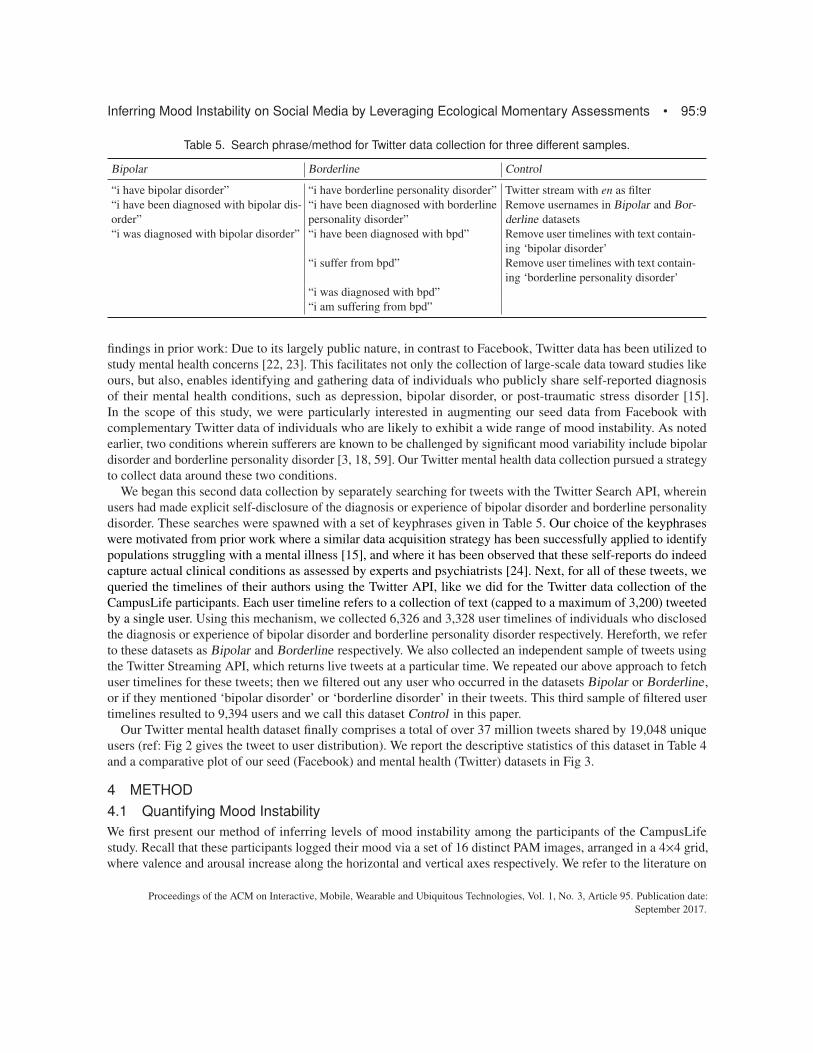
Our Twitter mental health dataset finally comprises a total of over 37 million tweets shared by 19,048 unique
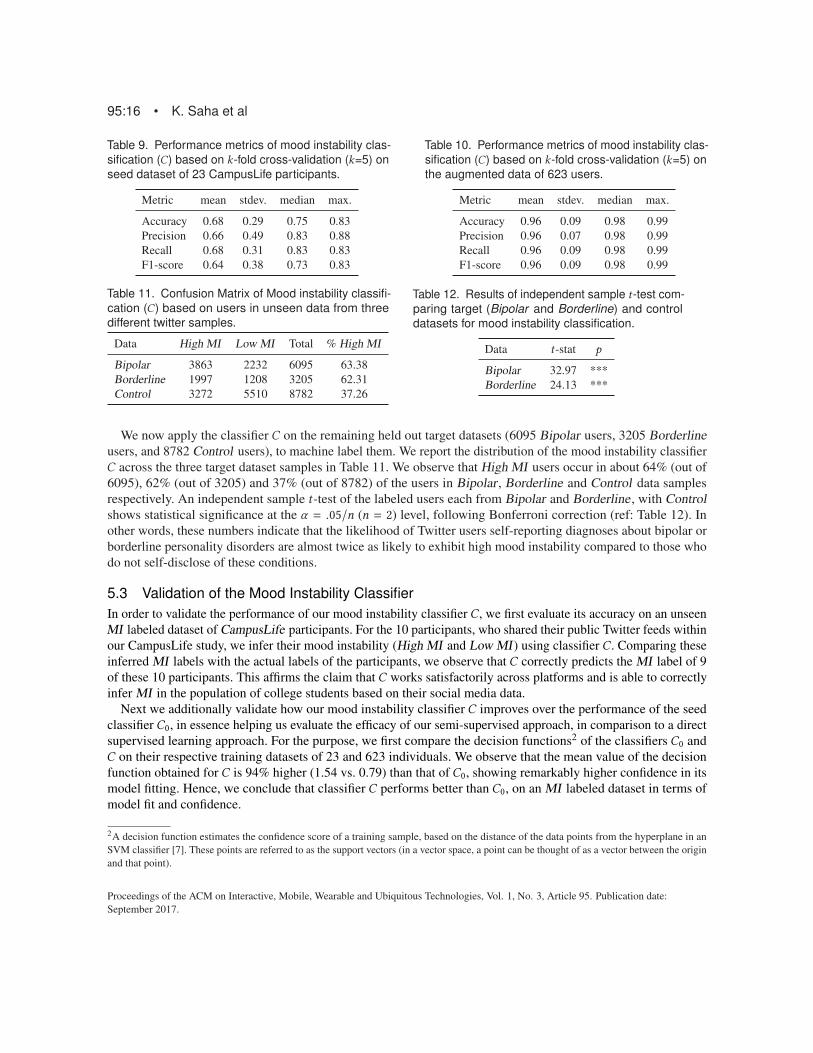
users (ref: Fig 2 gives the tweet to user distribution). We report the descriptive statistics of this dataset in Table 4
and a comparative plot of our seed (Facebook) and mental health (Twitter) datasets in Fig 3.
4 METHOD
4.1 Quantifying Mood Instability
We first present our method of inferring levels of mood instability among the participants of the CampusLife
study. Recall that these participants logged their mood via a set of 16 distinct PAM images, arranged in a 4×4 grid,
where valence and arousal increase along the horizontal and vertical axes respectively. We refer to the literature on
Proceedings of the ACM on Interactive, Mobile, Wearable and Ubiquitous Technologies, Vol. 1, No. 3, Article 95. Publication date:
September 2017.

95:10 • K. Saha et al
����������
���������
�������
��������
�
� ��������
� ��������
��������ASD
�������MAD(ASD)
������ ��
������ ��
� ��������
� ��������
���������
��������
������
�����
�������
��������
Fig. 5. A schematic diagram showing the computation of the High MI and Low MI classes with EMA data.
PAM [62] to map the 16 PAM moods into numeric tuples of valence and arousal values— these values are derived
from the absolute position of a mood image in the 4×4 grid, where the values can be -2, -1, 1 and 2 [62]. Using
the mapping given in Table 6, we quantify a participant’s momentary mood states in terms of valence and arousal,
which we further leverage to quantify their mood instability.
Specifically, in order to quantify mood instability of a participant, it is necessary to calculate the successive
differences in momentary mood states logged by each of the participants. Since, the consecutive observations for
any participant do not have uniform time differences in our study (EMAs were randomly triggered at different
times of the day), changes or fluctuations in mood cannot be quantified from simple time series analysis of EMA
responses. Hence we adopt a method proposed in [42] to compute the Adjusted Successive Difference (ASD)
functions for the valence (and arousal) dimensions of a participant’s mood. If xi is the valence (or arousal) of a
participant’s logged mood state at time ti , we compute its ASDs based on Equations 1 and 2:
ASDi+1 =
xi+1 − xi
[(ti+1 − ti )/Mdn(ti+1 − ti )]λ(1)
Here λ is chosen by minimizing the following cost function, sum of square of the error of expectation (SSEE):
SSEE(λ) =∑i
[EAASD(ti+1−ti )(λ) −C(λ)]2
=
N−1∑i=1
{E
{|xi+1 − xi |
[(ti+1 − ti/Mdn(ti+1 − ti )]
}−C(λ)
}2 (2)
The expected absolute successive difference (EASD) is obtained by nonparametric curve fitting regression method
of lowess—a method for fitting a smooth curve [13]. Further, the expected adjusted absolute successive difference
(EAASD) is calculated by an adjustment, which eliminates the dependency of EASD on the time intervals. The
EAASD(λ) at the median time interval is used as the C(λ) (ref: Equation 2).
Once, we have obtained the valence (and arousal) ASD functions of all of a participant’s mood states reported
throughout the study period, we calculate the mean absolute deviation (or MAD) for these functions, referred to as
MAD(ASDv ) and MAD(ASDa), corresponding to the valence and arousal dimensions respectively.
The sum of MAD(ASDv ) and MAD(ASDa) is then referred to as a participant’s overall mood instability MI
throughout the study period—a high MI would indicate that either valence or arousal or both dimensions of their
mood states tend to generally show large fluctuations, whereas lower values of MI would imply one or both of
the dimensions to exhibit fewer shifts over time. Finally, employing the median of the MI distribution over all
participants as a threshold, we categorize the participants into two classes, with binary labels High MI and Low
MI respectively. Those whose MI lies above the median of the MI distribution, we assign them to the High MI
class, while the participants with MI under the median are classified to belong to the Low MI class. We represent
Proceedings of the ACM on Interactive, Mobile, Wearable and Ubiquitous Technologies, Vol. 1, No. 3, Article 95. Publication date:
September 2017.

Inferring Mood Instability on Social Media by Leveraging Ecological Momentary Assessments • 95:11
the steps involved in categorizing users as High MI and Low MI from their EMA data, in Fig. 5, and with the
following equations:
MI = MAD(ASDv ) +MAD(ASDa)
MI Class Label =
{Low MI if MI ≤ Mdn(MI )
High MI otherwise
(3)
Here we note that median is a conservative, yet intrinsically understandable and robust measure for central
tendency of a distribution. Hence we adopt it as a decision boundary for assessing levels of mood instability in
the participants of our study. Although a more continuous estimate of the distribution would have been a better
quantification of mood instability, it would have made the MI inference task far more difficult, especially in cases
like ours, where we have a small amount of ground truth data.
4.2 Building a Seed Classifier of Mood Instability
Utilizing the above inferred binary levels of mood instability (High MI and Low MI ) in the participants of our
CampusLife study, we now present a classification framework to predict these class labels from the seed dataset,
that is, the participants’ corresponding Facebook data. Although the CampusLife study also acquired Twitter data
from a small set of the participants, we employ Facebook as our data source for the seed classifier as it provides us
with a larger sample of ground-truth labels over Twitter (23 vs. 10 participants).
To build a classifier for mood instability, we first extract psycholinguistic features from the Facebook posts of
the participants—we specifically focus on the status messages shared on their timeline. We employ Linguistic
Inquiry and Word Count, or LIWC [60] on the Facebook posts—this psycholinguistic lexicon has been extensively
applied and validated on several studies of social media, behaviors, moods, and mental health [22, 23]. We use
50 of the most relevant LIWC categories per prior work [23], grouped as: (1) affective attributes (categories:
anger, anxiety, sadness, swear, positive and negative affect), (2) cognitive attributes (categories: cognitive mech,
discrepancies, inhibition, negation, causation, certainty, and tentativeness), (3) temporal references (categories:
future, past and present tense), (4) interpersonal focus (categories: first person singular pronoun, second person
plural pronoun, third person plural pronoun and indefinite pronoun) (5) lexical density and awareness (categories:
adverbs, verbs, exclusive, inclusive and preposition), (6) perception (categories: feel, insight, percept and see),
and (7) social/personal concerns (categories: achievement, bio, body, death, home, humans, sexual and social).
For every participant, we aggregate the occurrence of the word and word stems in each of these LIWC categories,
followed by their normalization based on the total number of tokens (words) in the participants’ posts. Using this
approach, we construct a feature vector of 50 dimensions, for the participants. In the following paragraph we
explain how we build the mood instability classifier.
Now we build supervised machine learning models utilizing the data obtained so far in this section—the ground
truth labels of mood instability (High MI and Low MI ) in the 23 CampusLife study participants (dependent
variable), and the psycholinguistic features extracted with the LIWC lexicon above (independent variables). We
consider and evaluate multiple classifiers, including Naive Bayes, Logistic Regression, Random Forest and Support
Vector Machines (with different kernels such as linear, radial basis functions and polynomial). We employ a k-fold
cross validation (k=5) strategy for parameter tuning.
4.3 Semi-Supervised Modeling of Mood Instability
We note that the number of examples in our seed training data from Facebook (23) is much smaller than the
dimensionality of our feature set (50), which risks the seed classifier C0 in overfitting the data. Semi-supervised
learning is one of the recommended techniques in cases where labeled data is expensive or scarce, but where
unlabeled data is abundant and significantly easy to gather [10]. Unlike completely supervised learning such as
Proceedings of the ACM on Interactive, Mobile, Wearable and Ubiquitous Technologies, Vol. 1, No. 3, Article 95. Publication date:
September 2017.

95:12 • K. Saha et al
Table 6. Mapping of PAM categories to
numeric values of Valence and Arousal,
per prior work [62].
PAM Valence Arousal
Afraid -2 2
Angry -1 1
Calm 1 -1
Delighted 2 2
Excited 1 2
Frustrated -2 1
Glad 2 1
Gloomy -2 -2
Happy 1 1
Miserable -2 -1
Sad -1 -1
Satisfied 2 -1
Serene 2 -2
Sleepy 1 -2
Tense -1 2
Tired -1 -2
Algorithm 1: Semi Supervised Mood Instability Classifier
Input: CampusLife Facebook Data F (Seed Dataset), Twitter User
Timelines T (Target Datasets).
Output: Mood Instability MI of Twitter Users
X0, Y0 ← Psycholinguistic Features, Mood Instability of F
T1,T2 ← Random Samples of T {T1 < T2}
X1 ← Psycholinguistic Features of T1X2 ← Psycholinguistic Features of T2Classifier C0 ← SVM (X0, Y0)
Clusters < S >← K-Means Clustering (X1)
CD ← Initialize Dictionary < Key,Value >
for every i in K docc[i] ← computeVectorCentroid (S[i])
l[i] ← C0.predict (cc[i])
Add < cc[i], l[i] > as < Key,Value > in CD
end
for every i in length(X1) dolabel ← Value for S[i] in CD
Add label to Y1end
X ← concatenate (X0 + X1)
Y ← concatenate (Y0 + Y1)
Classifier C ← SVM (X , Y )
Y2 ← C .predict (X2)
return Y1 + Y2
classification, these approaches devise ways of utilizing both labeled and unlabeled data to learn better models. In
prior work, similar methods have also been used in problem domains where positive examples are a considerably
rare occurrence, creating huge imbalance between the sizes of labeled and unlabeled data [82]. These conditions
satisfy our context as well. Thus we employ a semi-supervised approach of improving the robustness of C0, by
augmenting it with training data from the Twitter mental health datasets (Bipolar , Borderline and Control ).
4.3.1 Establishing Linguistic Equivalence. We note that the above semi-supervised learning approach
involves combining datasets spanning multiple social media platforms (Facebook, Twitter) as well as multiple
populations (college students, general population). Hence, first we conduct two tests of linguistic equivalence to
demonstrate the feasibility of adopting the semi-supervised learning approach. The tests aim to establish that: a)
content shared across the seed and mental health datasets (from Facebook and Twitter respectively) are comparable—
establishing cross-platform equivalence; and b) that social media data of a college population (the CampusLife
participants) may be utilized to measure mood instability in an independent population self-reporting bipolar
or BPD diagnoses (Bipolar and Borderline data), and whose specific demographics are unknown—establishing
cross-population equivalence. For both of these, we adopt an approach involving pairwise comparison of word
vectors, drawing from a suggested technique in the computational linguistics literature [5]. The technique involves
first constructing word vectors using the frequently occurring n-grams in each source of data, and then employing
a distance metric, e.g., cosine similarity, to assess their linguistic similarity. Cosine similarity of word vectors is
an effective measure of quantifying the linguistic similarity between two datasets [61], and a high value would
indicate that the posts in the two datasets are linguistically equivalent.
To establish cross-platform equivalence, we extract the most frequent 500 n-grams from our seed dataset
(Facebook), and the same from our mental health datasets (Twitter) (sample size = 10,000). Next, using the
word-vectors of these top n-grams (obtained from the Google News dataset of about 100 billion words [57]), we
Proceedings of the ACM on Interactive, Mobile, Wearable and Ubiquitous Technologies, Vol. 1, No. 3, Article 95. Publication date:
September 2017.

Inferring Mood Instability on Social Media by Leveraging Ecological Momentary Assessments • 95:13
compute the cosine similarity of the two datasets in a 300-dimensional vector space. We observe that seed and
mental health datasets exhibit high cosine similarity (0.9), providing confidence in the use of the semi-supervised
learning approach. Additionally, we conduct a pairwise equivalence test to validate the linguistic similarity between
the Facebook and Twitter data of the same participants, using the same technique. We do not observe any significant
differences in the manner in which Facebook and Twitter are used in our participant pool – for the 10 participants
for whom we have both Facebook and Twitter data, we noted high similarity (mean 0.85, standard deviation 0.15)
in linguistic attributes (n-grams).
Next, towards assessing cross-population equivalence, we again employ word vector comparison to first assess if
the cosine similarity between the word vectors of the Twitter data of the 10 CampusLife participants and that in the
Bipolar and Borderline datasets is high. We observe this similarity to be 0.94 and 0.95 respectively, indicating that
the college student participants’ social media data is linguistically similar to the unlabeled mental health datasets
we use in our ensuing semi-supervised learning approach.
Finally, in order to assess the correspondence between the psycholinguistic features from the Facebook and
Twitter posts of the same participants, we conduct two-sample Kolmogorov-Smirnov tests (KS tests) for each of
the psycholinguistic features. We observe that the KS-statistic is very low, ranging between 0.01 and 0.38 across
the features (median = 0.07 and standard deviation = 0.08), and only 33 out of 50 features exhibit a p-value lesser
than 0.05. This suggests that there is very little significant statistical difference between the features of Facebook
and Twitter datasets of the 10 participants who shared their data from both the sources.
4.3.2 Augmenting Training Data with Self-Training. Once we have successfully established cross-platform
and cross-population linguistic equivalence, we proceed with our semi-supervised learning approach. We specifically
borrow from a method known as “self-training” that assumes the data to naturally cluster into groups (in our case
we would expect High MI and Low MI to exhibit similarities in their respective behaviors), and therefore employs
a clustering algorithm to categorize the whole dataset, and then label each cluster with labeled data [20].
First, we proportionately separate random samples of 200, 100 and 300 users from our Twitter target datasets,
Bipolar, Borderline and Control . Next, we cluster these users in an unsupervised fashion using K-Means (K=2)
clustering. For each of these clusters, we find the cluster centroids, and machine label the cluster centroids usingC0.
Using the predicted labels of cluster centroids as labels, we augment our training data with 600 additional users
from Twitter. We describe our algorithm of classification in Algorithm 1.
4.3.3 Machine Labeling of Mood Instability in Unseen Data. Now that we have obtained an augmented
training dataset of 623 users (23 from the CampusLife study and 600 from Twitter), we use this to build a mood
instability classifier C. First, based on the method outlined in section 4.2, we extract psycholinguistic features for
the posts of each user in this augmented dataset. Since the volume of posts of the users within the Facebook and
Twitter (seed and target) datasets vary significantly, we scale the feature vectors separately for our Facebook and
Twitter dataset based on standarization (i.e., re-scaling the distribution of each feature to have zero mean and unit
variance [45]). Like before, we build and evaluate multiple classification models, and use k-fold cross-validation
(k=5). Finally, we employ the trained classifier to predict the mood instability labels (High MI and Low MI ) of the
users in the held out target datasets, Bipolar , Borderline , and Control respectively.
4.4 Characterizing the Language of Inferred Mood Instability
This final subsection presents the methods we use for characterizing the language expressed in social media that
relate to High MI and Low MI . Specifically, on the corpus of the posts of all of the Bipolar, Borderline, and
Control users that are labeled or inferred to be of High MI or Low MI , we extract the top occurring most relevant
n-grams (n=1, 2, 3) and compute their Log Likelihood Ratio (LLR) [25] across the two classes High MI and Low
MI. We consider the minimum threshold of occurrence for an n-gram in any class as 500, and then calculate the
probability of occurrence of every such n-gram in the High MI , to the same in the Low MI . The LLR for an
Proceedings of the ACM on Interactive, Mobile, Wearable and Ubiquitous Technologies, Vol. 1, No. 3, Article 95. Publication date:
September 2017.

95:14 • K. Saha et al
Apr 19 Apr 24 Apr 29
−2
−1
01
23
TimeStamp
AS
D
ValenceArousal
Apr 19 Apr 24 Apr 29 May 04
−4
−2
02
4TimeStamp
AS
D
ValenceArousal
Apr 17 Apr 21 Apr 25 Apr 29
−4
−2
02
4
TimeStamp
AS
D
ValenceArousal
Fig. 6. Adjusted Successive Difference (ASD) plots of EMAs for three sample participants in the seed dataset.
n-gram is determined by calculating the logarithm (base 2) of the ratio of its two probabilities, following add-1
smoothing [44]. Thus, when an n-gram is comparably frequent in the two classes, its LLR is close to 0; it is closer
to 1, when the n-gram is more frequent in High MI , whereas, closer to -1, for the converse.
5 RESULTS
5.1 Seed Classifier for Mood Instability
In this subsection, we present the results of developing a seed classifier of mood instability, utilizing the Facebook
data of the 23 CampusLife participants, and their mood instability labels (High MI and Low MI ) inferred from
their EMA data during the study period.
To quantify these mood instability labels, we begin by calculating Adjusted Successive Difference (ASD) values
of the EMA responses for each of the CampusLife participants. First, we find λ by minimizing cost function, or sum
of square of successive differences (SSEE(λ)) as defined in Equation 2. For this purpose, we iterate on n = [1, 10],
where λ = 1/n, chosen based on the method described in [76]. Fig. 6 shows the ASD curves for three sample
participants in our study. Per these ASD values, we find that the overall MI of the participants in our study ranges
from 1.65 to 30.8, with a median value of 3.14. Based on our definition of High MI and Low MI given in Fig. 5,
we obtain 11 and 12 users belonging to these two classes respectively.
Next, in order to build a seed classifier for mood instability, we extract frequency of occurrences of the
psycholinguistic categories from the above labeled seed dataset of 23 CampusLife participants. After normalizing
the distribution of these occurrences per the method described in section 4.2, we use them as features and build
several classification algorithms on the binary mood instability labels High MI and Low MI. Table 7 summarizes
the accuracy returned by each of these classification algorithms, including Naive Bayes, Logistic Regression,
Random Forest, and Support Vector Machines (SVM) with different kernels based on k-fold cross-validation
(k = 5). The SVM Classifier with linear kernel returns the highest accuracy (mean = 0.68 andmax . = 0.83). This
motivates our choice for using this as our seed classifier of mood instability. We refer to it as the C0 model.
5.2 Classification with Semi-Supervised Learning
Now we present the results of augmenting the above seed classifier of mood instability (C0) with additional training
data from the target datasets (Bipolar , Borderline , and Control ); for the purpose, we employ the semi-supervised
learning method described in section 4.3.
We build the semi-supervised mood instability classifier, per the method described in section 4.3. Specifically,
we apply KMeans (K=2) clustering on the psycholinguistic feature vectors from a dataset of 600 Twitter users
Proceedings of the ACM on Interactive, Mobile, Wearable and Ubiquitous Technologies, Vol. 1, No. 3, Article 95. Publication date:
September 2017.

Inferring Mood Instability on Social Media by Leveraging Ecological Momentary Assessments • 95:15
Table 7. Accuracy of the seed mood instability clas-
sifier (C0) based on k-fold cross-validation (k=5) on
the seed dataset of 23 CampusLife participants.
Metric mean stdev. median max.
Naive Bayes 0.58 0.54 0.75 0.83
Logistic Regression 0.51 0.35 0.50 0.80
Random Forest 0.48 0.64 0.50 0.83
SVM (Kernel=Poly.) 0.56 0.24 0.50 0.80
SVM (Kernel=RBF) 0.51 0.35 0.50 0.80
SVM (Kernel=Linear) 0.68 0.29 0.75 0.83
Table 8. Augmented training data following K-Means
(K=2) clustering.
Data High MI Low MI Total
CampusLife 11 12 23
Bipolar 120 80 200
Borderline 65 35 100
Control 110 190 300
Total 306 317 623
Fig. 7. A two-dimensional repre-
sentation of the K-Means clusters.
The axes correspond to the two
largest principal components.
Fig. 8. ROC (Receiver Operating
Characteristic) curve of mood in-
stability classifier (C), built with aug-
mented training data.
Fig. 9. Precision-Recall curve of
classifier C, built with augmented
training data. Small slope indicates
good performance.
sampled from Bipolar, Borderline , and Control. Our choice of two clusters is motivated from the observation that
we intend to identify groups of users exhibiting one of the two mood instability labels—High MI or Low MI. We
obtain two clusters with 295 and 305 user vectors respectively. Fig. 7 shows a visual 2-dimensional representation
of these clusters based on the two largest eigenvectors – we use principal component analysis [43] to extract the
eigenvectors of the user vectors in each cluster. We label the centroids of these clusters using the C0 classifier, to
determine the first cluster to consist of users with High MI , while the second to be comprising those with Low MI .
These cluster-labeled data, along with the labeled Facebook data of the 23 CampusLife participants (623 users in
all) becomes our augmented training data (ref: Table 8. This augmented dataset has 306 and 317 users with High
MI and Low MI labels respectively.
Next, with this data, we build multiple classifiers of mood instability, with an SVM classifierC with linear kernel,
yielding the best performance described as follows. We obtain an Area under curve (AUC) of 0.99 for C’s Receiver
operating characteristic (ROC), Fig. 8 shows the ROC curve of C and Fig. 9 gives the precision-recall curve. We
validateC, on the augmented data obtained above, using a k-fold cross-validation (k=5). TheC model gives a mean
accuracy of 0.68 and 0.96 on the seed and augmented training data respectively. We report these performance
metrics in Table 9 and Table 10 respectively, for the seed and augmented training datasets. Based on these numbers,
we infer that our classifierC is stable and works well on the augmented data containing target datasets from Bipolar ,
Borderline , and Control, without dropping accuracy in classifying the seed data of the 23 CampusLife participants.
Proceedings of the ACM on Interactive, Mobile, Wearable and Ubiquitous Technologies, Vol. 1, No. 3, Article 95. Publication date:
September 2017.
95:16 • K. Saha et al
Table 9. Performance metrics of mood instability clas-
sification (C) based on k-fold cross-validation (k=5) on
seed dataset of 23 CampusLife participants.
Metric mean stdev. median max.
Accuracy 0.68 0.29 0.75 0.83
Precision 0.66 0.49 0.83 0.88
Recall 0.68 0.31 0.83 0.83
F1-score 0.64 0.38 0.73 0.83
Table 10. Performance metrics of mood instability clas-
sification (C) based on k-fold cross-validation (k=5) on
the augmented data of 623 users.
Metric mean stdev. median max.
Accuracy 0.96 0.09 0.98 0.99
Precision 0.96 0.07 0.98 0.99
Recall 0.96 0.09 0.98 0.99
F1-score 0.96 0.09 0.98 0.99
Table 11. Confusion Matrix of Mood instability classifi-
cation (C) based on users in unseen data from three
different twitter samples.
Data High MI Low MI Total % High MI
Bipolar 3863 2232 6095 63.38
Borderline 1997 1208 3205 62.31
Control 3272 5510 8782 37.26
Table 12. Results of independent sample t-test com-
paring target (Bipolar and Borderline) and control
datasets for mood instability classification.
Data t-stat p
Bipolar 32.97 ***
Borderline 24.13 ***
We now apply the classifier C on the remaining held out target datasets (6095 Bipolar users, 3205 Borderline
users, and 8782 Control users), to machine label them. We report the distribution of the mood instability classifier
C across the three target dataset samples in Table 11. We observe that High MI users occur in about 64% (out of
6095), 62% (out of 3205) and 37% (out of 8782) of the users in Bipolar, Borderline and Control data samples
respectively. An independent sample t-test of the labeled users each from Bipolar and Borderline, with Control
shows statistical significance at the α = .05/n (n = 2) level, following Bonferroni correction (ref: Table 12). In
other words, these numbers indicate that the likelihood of Twitter users self-reporting diagnoses about bipolar or
borderline personality disorders are almost twice as likely to exhibit high mood instability compared to those who
do not self-disclose of these conditions.
5.3 Validation of the Mood Instability Classifier
In order to validate the performance of our mood instability classifier C, we first evaluate its accuracy on an unseen
MI labeled dataset of CampusLife participants. For the 10 participants, who shared their public Twitter feeds within
our CampusLife study, we infer their mood instability (High MI and Low MI ) using classifier C. Comparing these
inferred MI labels with the actual labels of the participants, we observe that C correctly predicts the MI label of 9
of these 10 participants. This affirms the claim that C works satisfactorily across platforms and is able to correctly
infer MI in the population of college students based on their social media data.
Next we additionally validate how our mood instability classifier C improves over the performance of the seed
classifier C0, in essence helping us evaluate the efficacy of our semi-supervised approach, in comparison to a direct
supervised learning approach. For the purpose, we first compare the decision functions2 of the classifiers C0 and
C on their respective training datasets of 23 and 623 individuals. We observe that the mean value of the decision
function obtained for C is 94% higher (1.54 vs. 0.79) than that of C0, showing remarkably higher confidence in its
model fitting. Hence, we conclude that classifier C performs better than C0, on an MI labeled dataset in terms of
model fit and confidence.
2A decision function estimates the confidence score of a training sample, based on the distance of the data points from the hyperplane in an
SVM classifier [7]. These points are referred to as the support vectors (in a vector space, a point can be thought of as a vector between the origin
and that point).
Proceedings of the ACM on Interactive, Mobile, Wearable and Ubiquitous Technologies, Vol. 1, No. 3, Article 95. Publication date:
September 2017.
Inferring Mood Instability on Social Media by Leveraging Ecological Momentary Assessments • 95:17
Second, we infer MI in our unlabeled mental health Twitter datasets, using the k-folds (k = 5) of Classifier
C0 and C. We observe that C0 shows an unstable performance in terms of the accuracy metric, with a standard
deviation of 10.3%, 11.8%, and 8.0% for predicting the percentage of High MI in Bipolar , Borderline and Control
users. On the other hand, C shows a comparatively stable performance for the same numbers with only 0.4%, 0.7%
and 0.3% standard deviation in accuracies respectively. We summarize the comparison values of our two classifiers
in Table 13. Thus, while we do not see a drastic improvement in classification accuracies between C and C0, our
results demonstrate the stability of the semi-supervised learning based classifier C especially in the face of limited
availability of ground truth labeled data.
Table 13. Comparison of MI classification in the mental health Twitter datasets using the seed classifier C0 and the
semi-supervised learning based classifier C. The higher standard deviation (stdev .) in the distribution of k-fold cross
validation (CV) accuracies of classifier C0 shows its high sensitivity (and therefore instability) across different folds.
Data ↓ k-fold CV accuracies of C0 (% High MI ) k-fold CV accuracies of C (% High MI )
Folds → 1 2 3 4 5 mean stdev . 1 2 3 4 5 mean stdev .
Bipolar 66.81 69.86 64.64 43.76 62.82 51.38 10.30 62.87 63.64 62.66 63.18 63.38 63.15 0.39
Borderline 61.37 63.81 54.41 34.04 56.13 45.06 11.76 61.06 61.81 62.44 62.84 62.31 62.09 0.68
Control 42.04 46.05 37.35 24.79 37.94 31.40 7.99 36.70 36.54 36.56 36.47 37.26 36.71 0.32
5.4 Examining Psycholinguistic Features
Next, in order to understand the prominent psycholinguistic features of the C classifier, in Table 14 we summarize
the statistically significant features and their values for the two mood instability classes High MI and Low MI.
Broadly, we note that the mean occurrences of each of the psycholinguistic features is substantially higher in the
timelines of users classified as High MI as compared to those inferred to show Low MI .
To start with, we observe that the features under Affective Attributes, especially anger, negative affect, and
positive affect have significant contribution towards the classification model. This agrees with the intuition that,
individuals having traits of mood instability, express themselves with affective words. To dig deeper into this
finding, we illustrate the class-wise differences in Fig. 10, where we plot the distribution of the different affective
features among users classified as High MI and Low MI . We observe that High MI users show a median score of
0.24, for positive affect, which is substantially higher than 0.04, the median score for the same by the Low MI users.
Additionally, we notice a similar trend in the case of negative affect as well, where the median value observed is
0.20 and 0.03 for High MI and Low MI users respectively.
Returning to other psycholinguistic features described in Table 14, we find that cognitive attributes like negation,
discrepancies, cognitive mechanics, certainty and tentativeness stand out, distinguishing the two mood instability
classes. First, we observe that High MI users show greater usage of cognitive attributes and perception. This finding
aligns with prior work, which associates higher use of cognitive and perceptive words with emotional upheavals,
and self disclosure about psychological conditions [60]. Next, the High MI users show heightened self-attentional
focus as illustrated in the usage of 1st person singular pronoun features; this value is significantly lower in the
case of the users classified to show Low MI . Self pre-occupation is observed in individuals challenged with many
mental health concerns, who in turn, in many cases, may also exhibit high instability in their emotional states [12].
In terms of temporal references, the High MI users show a greater focus on here and now, indicated in the high
usage of present tense words. Further, the occurrences of lexical density features such as verbs and adverbs in
High MI is almost 600% as compared in Low MI , indicating that individuals with higher mood instability tend to
express themselves via more complex narratives, as also known from prior work in psycholinguistics [12].
Proceedings of the ACM on Interactive, Mobile, Wearable and Ubiquitous Technologies, Vol. 1, No. 3, Article 95. Publication date:
September 2017.

95:18 • K. Saha et al
Table 14. Psycholinguistic categories and their distribution across the two classes of mood instability. Only significant
features for classifier C are reported here, with their score. Statistical significance is reported after Bonferroni
correction (α = .05/50).
Category High MI Low MI p-value Score
mean stdev. mean stdev.
Affective Attributes
Anger 0.21 0.12 0.04 0.05 *** 33.37
Negative Affect 0.20 0.10 0.03 0.04 *** 31.51
Positive Affect 0.24 0.10 0.04 0.05 *** 35.46
Sadness 0.17 0.08 0.03 0.05 *** 13.57
Swear 0.17 0.14 0.02 0.05 *** 13.57
Cognitive Attributes
Causation 0.18 0.08 0.03 0.04 *** 26.38
Certainty 0.34 0.12 0.05 0.06 *** 50.81
Cognitive Mech 0.39 0.12 0.07 0.07 *** 60.86
Discrepancies 0.30 0.11 0.05 0.05 *** 47.91
Negation 0.33 0.12 0.05 0.06 *** 54.91
Tentativeness 0.20 0.09 0.03 0.04 *** 31.41
Perception
Feel 0.17 0.08 0.03 0.04 *** 24.32
Insight 0.16 0.07 0.03 0.04 *** 21.62
Percept 0.24 0.13 0.04 0.05 *** 40.48
See 0.13 0.07 0.02 0.03 *** 20.87
Interpersonal Focus
1st P. Singular 0.28 0.12 0.05 0.06 *** 46.90
2nd PP. 0.20 0.11 0.04 0.05 *** 26.69
3rd PP. 0.10 0.07 0.01 0.03 *** 15.70
Indefinite P. 0.36 0.12 0.06 0.06 *** 59.35
Temporal References
Past Tense 0.23 0.11 0.03 0.04 *** 39.71
Present Tense 0.41 0.12 0.07 0.07 *** 69.02
Lexical Density and Awareness
Adverbs 0.39 0.13 0.06 0.07 *** 65.03
Verbs 0.43 0.12 0.07 0.07 *** 70.77
Exclusive 0.33 0.12 0.05 0.05 *** 57.33
Inclusive 0.25 0.10 0.05 0.05 *** 37.68
Preposition 0.37 0.13 0.07 0.07 *** 56.78
Social/Personal Concerns
Bio 0.16 0.07 0.03 0.04 *** 21.52
Body 0.17 0.08 0.03 0.04 *** 25.97
Death 0.09 0.07 0.02 0.04 *** 12.98
Humans 0.13 0.07 0.02 0.04 *** 17.12
Sexual 0.12 0.11 0.02 0.04 *** 19.07
Social 0.3 0.11 0.05 0.06 *** 46.18
Proceedings of the ACM on Interactive, Mobile, Wearable and Ubiquitous Technologies, Vol. 1, No. 3, Article 95. Publication date:
September 2017.

Inferring Mood Instability on Social Media by Leveraging Ecological Momentary Assessments • 95:19
�
��
���
����
� ��� ��� ��� ��� �
������ ������
�����
�����
�� ��� �������
�
��
���
����
� ��� ��� ��� ��� �
!�������������
���!�
����"�� �����
�#��� �������
�
��
���
����
� ��� ��� ��� ��� �
��������
�������
�����
���� ��������
������ ������
�
��
���
����
� ��� ��� ��� ��� �
�
����� ������
�����
�������
�� ��� �������
�
��
���
����
� ��� ��� ��� ��� �
�������������
� ���
� �����
������ �������
�
��
���
����
� ��� ��� ��� ��� �
����
�! �
"� "
� ���
���
�!���� �������
Fig. 10. A comparative representation of the distribution of the values of different Affective Attributes in users
classified to be of High MI or Low MI.
5.5 Analyzing Mood Instability on Twitter
Our final set of results include an analysis of the linguistic markers of mood instability as manifested in the
target datasets from Twitter. Table 15 reports the top occurring, most relevant n-grams (n=2) based on their Log
Likelihood Ratio (LLR) across two classes. In doing so, we also investigate whether and how the usage of different
n-grams vary across the classes of mood instability. We observe that certain n-grams reported here, agree with the
distribution of the psycholinguistic features that are significantly distinct across the two classes. For instance, ‘argue’
which occurs predominantly in High MI , is categorized under the social and anger features in the psycholinguistic
lexicon LIWC. In fact, these specific features of anger and social occur almost 6 times more frequently in High
MI as compared to Low MI. This indicates, users in High MI tend to be more expressive and argumentative on
social media, such as “We curse, fight, kiss, hug, We text, talk, argue, laugh, We smile, We love. That’s just us!".
Similar is the case with ‘afraid’, which exists under the anxiety feature in LIWC. We observe that a few phrases
related to pregnancy and child birth, such as ‘baby born’, ‘birth’, ‘feeding’ and ‘pregnant’ are predominant in High
MI . Some example tweets include, “Everyones pregnant or married and I’m..", “looking at my stomach, I can’t
believe I’m pregnant and I’m really having my own baby", “hungry + sleepy is a bad combination for a pregnant
woman.” and “this baby hurting my damn back. im not having any more kids". This concurs with prior literature, on
the association of mood instability with pregnancy related conditions [53]. We also observe the presence swear
words, like ‘fucked’ and words associated with highly negative depressive acts and forms of expression as well as
Proceedings of the ACM on Interactive, Mobile, Wearable and Ubiquitous Technologies, Vol. 1, No. 3, Article 95. Publication date:
September 2017.

95:20 • K. Saha et al
Table 15. Log Likelihood Ratios (LLRs) of top 20 n-grams more frequent in the posts of users classified as High MI
(left), Low MI (center) and comparably frequently in both (right).
ngram (High>Low) LLR n-gram (Low<High) LLR ngram (High=Low) LLR
argue 1 finance -1 followed people 0.03
awww 1 fountain pen -1 red 0.04
baby born 1 global investment -1 chocolate 0.04
birth 1 gus music -1 smile 0.04
eyebrows 1 profit -1 healthy 0.04
failed 1 health equity -1 unfollowed automatically 0.04
fall asleep 1 health money -1 followed 0.04
feeding 1 health money bitcoins -1 goodbye 0.04
funding 1 investment plan -1 learning 0.05
hip hop 1 irregular traffic -1 adorable 0.05
hurting 1 management -1 birthday 0.05
playing woman 1 millionaire -1 relationships 0.06
pregnant 1 pension -1 challenge 0.06
pressure 1 perfect money -1 holidays 0.06
racism 1 remixes -1 goodnight 0.06
republicans 1 single mother -1 magic 0.03
suicide 1 fastest investments -1 creative 0.02
fucked 0.41 equity careers -1 lips 0.02
racist 0.49 entertainer -1 thankful 0.01
favorite 0.47 download new -1 thanks 0.01
low self-esteem in High MI , like ‘suicide’, ‘hurting’ and ‘failed’. Example tweets here include, “I can’t believe my
suicide is delayed” and “everybody likes hurting me all the time”
On the other hand, the top n-grams from Low MI, contain some health, career and money related phrases
like, ‘health money’, ‘finance’, ‘perfect money’, ‘entertainer’, ‘equity careers’, ‘millionaire’, ‘pension’. This may
indicate a tendency of Low MI Twitter users to engage in discussing more general life and lifestyle oriented topics,
such as in tweets like, “what would you buy if you became a multi-millionaire overnight”. In other words the
lower presence of these n-grams in High MI may indicate a relatively greater detachment of these users from
the day-to-day realm. In contrast to pregnancy related words in High MI, we find, ‘single mother’ occurs as a
top n-gram in Low MI . Such a contrast interested us, and as we drill down to the corresponding tweets, we find
some expression of disinhibiting opinions and disclosures relating to people’s personal lives, such as “my single
mother worked without a penny from ‘him’ because she changed her lifestyle to be there for me. the real sign
of a mother.”, “of course a woman who was a poor single mother until she worked her way out of poverty can’t
possibly comment.”, “being a single mother works with her being a really independent fierce woman who didn’t
give up her motherhood for her” and campaign oriented tweets such as, “retirement income plan for single mother”.
Among the n-grams which occur almost equally in both the classes, we find quite a few phrases related to greetings,
vacation and occasion, for example: ‘goodbye’, ‘thanks’, ‘birthday’, ‘goodnight’, ‘holiday’ etc. which are typically
expected to surface in many casual social media chatter.
6 DISCUSSION
6.1 Implications
In this paper, we presented a novel machine learning approach for inferring psychological states (mood instability)
of an individual based on their social media data, leveraging dense, high fidelity ground truth information from
an independently acquired active sensor—specifically ecological momentary assessments (EMAs). We further
Proceedings of the ACM on Interactive, Mobile, Wearable and Ubiquitous Technologies, Vol. 1, No. 3, Article 95. Publication date:
September 2017.

Inferring Mood Instability on Social Media by Leveraging Ecological Momentary Assessments • 95:21
demonstrated that the passively gathered social media data can be utilized to build an enriched and scalable mood
instability classifier.
An interesting finding of our work is that the mood instability classifier is able to detect High MI almost twice as
frequently in Bipolar and Borderline Twitter users, compared to a non-clinical control sample. This observation is
consistent with psychology and clinical research that has found these two mental health challenges to be associated
with greater instability and variability in the expression of mood and affect [18]. In particular, Patel et al. analyzed
the health records of individuals seeking mental healthcare, and found that mood instability is most prevalent in
23% and 18% of patients diagnosed with bipolar disorder and personality disorders respectively [59]. The fact
that our results corroborate these previous findings demonstrates the promising performance of our approach in
detecting mood instability status of individuals spanning diverse mental health contexts.
Our work highlights an unconventional, yet creative mechanism to rethink certain study designs within the
ubiquitous computing community. Many of these studies typically employ sophisticated and highly engineered
systems for sensing behaviors, moods, and activities of individuals. Incentives are also needed to be built into
the design to maintain participant compliance while reducing burden. We show that with access to voluminous
naturalistic social and behavioral data gathered from social media unobtrusively and passively, these study designs
may be revisited. Existing sensing frameworks that employ small-scale active data collection could thereby tackle
the challenges of scalability to large populations and to extended periods of time, by utilizing complementary social
media data of the population being studied. Moreover, unlike most active sensing paradigms, we demonstrate that
with social media data, we can leverage access to the rich context within which activities and moods unfold and are
expressed, such as their social and behavioral underpinnings. Such information can be immensely helpful in many
health sensing applications [1], beyond the investigations presented in this paper.
Finally, by borrowing a semi-supervised learning approach from the machine learning community, we build
on the success of these methods as employed in problems in the text mining and computer vision fields [82].
While fully supervised approaches (e.g., regression and classification) are routinely used within the health sensing
community [26, 79], we demonstrate that with a semi-supervised approach, we can promisingly tackle the
challenges around paucity of labeled data (e.g., individuals suffering from a health condition), by incorporating
easily accessible unlabeled examples. Moreover, our findings suggest that a semi-supervised classification approach
improves the performance of a seed fully supervised classifier, both in terms of robustness and confidence, indicating
the applicability of the proposed approach in real-world affect and mood inference tasks, beyond laboratory studies.
Relatedly, we also believe our proposed methodology can be applied in a variety of other health sensing problems
beyond the question investigated in this paper—whether mood instability can be inferred by combining active
and passive sensing data. Especially in health sensing problems within the ubiquitous computing community that
are challenged by limited access to ground truth, however with availability of large-scale unlabeled data, our
semi-supervised learning classification approach can augment current techniques. For instance, to what extent can
high fidelity data on physiological signals of stress (heart rate variability, skin conductance) be complemented with
longitudinal, large-scale social media data? More generally, over half of American smartphone users are reported to
spend an average of 144 minutes per day browsing their mobile devices, aiming to stay socially connected with their
friends [34]. Meanwhile, these users often identify as quantified selfers, which includes measuring and tracking
various signals from a range of wearable sensors (such as heart rate, body acceleration or physical location). Given
the widespread adoption of social media technologies, our work shows how to bridge the gap in observations
between individuals’ online representation and actual physical and emotional status, and how they can mutually
benefit each other in health status sensing tasks.
Broadly, our work advances the vision proposed by Estrin [29] and Zhang et al. [80] around developing
approaches, within the precision medicine context, that can integrate multiple forms of technology facilitated
sensed data into improved understanding of health and wellness. We believe that the integration of EMA and social
media technologies will enable us to better understand the early signs that may indicate forthcoming risk to unusual
Proceedings of the ACM on Interactive, Mobile, Wearable and Ubiquitous Technologies, Vol. 1, No. 3, Article 95. Publication date:
September 2017.

95:22 • K. Saha et al
shifts in mood or another adverse health episode. To realize this goal, software infrastructures to enable automated
social media sensing of health, alongside other forms of sensing may be developed, akin to the Aware [30] and
SenSocial [56] frameworks that allows unobtrusive logging of passive data centered around people’s smartphone
activity. Through our work we also envision that novel systems and interventions that can pro-actively monitor risk
to mood instability may be designed and deployed, that can bring appropriate help to those in need. These can be in
the form of self-tracking tools that install greater awareness in individuals struggling with specific mood disorders,
or in the form of interfaces that could be used by clinicians and caregivers so as to direct timely and personalized
help to those in need.
6.2 Privacy and Ethics
Privacy challenges within ubiquitous sensing of health behaviors is well-recognized [46, 51]. Within our work,
we employed the best practices that would guard the privacy of the participants whose data was acquired or
employed in our investigations—including both the pilot CampusLife population, and the individuals whose Twitter
timelines were analyzed. For instance, we maintained the CampusLife data in a de-identified format in a secure
server with authorized researcher access. For the Twitter data, we utilized similar de-identification techniques,
including sanitizing any raw-form data that has been included in the paper for exemplary purposes. Nevertheless,
we recognize that data-intensive studies like ours are vulnerable to privacy and ethical lapses. In the case of social
media population, it is impracticable to gain informed consent from thousands of people, and therefore individuals
may be unaware of the implications of their publicly shared social media content, with regard to their ability to
signal underlying psychological risk. This necessitates developing improved health communication technologies
that can enable individuals glean more interpretable insights into the workings of the machine learning models, and
thereby improve their self-awareness of the health inferences being made.
Thus, we identify open questions relating to privacy and ethics, that would need resolution in the future to fully
realize the potential of integrating social media and other forms of sensing toward health inference. This includes
tackling the challenges of long-term monitoring and people’s perception and attitude regarding their willingness to
donate pre-existing or prospective multi-modal data to researchers.
6.3 Limitations and Future Directions
Our work includes some limitations, many of which suggest interesting directions for future research.
Clinical Relevance. Although we found that a sizable fraction of the participants in our CampusLife dataset showed
moderate to severe depression, anxiety, and stress—markers that are co-morbid with mood instability [76], we
cannot be certain of the clinical nature of mood disorders in this data. In fact, the manner in which we defined
MI levels in participants based on their EMAs may not align with clinical definitions of the phenomenon; our
technique only illustrates a proof-of-concept mechanism to infer MI by combining active and passive sensing data.
Moreover, while were able to build a model that utilizes the EMA data as ground truth labels of mood instability,
and it predicted MI in an independent Twitter population fairly accurately and robustly, it remains to be seen how
the model might generalize to mood instability in other samples, including college students at large, or in clinical
or psychiatric populations. In fact, it is possible that certain clinical populations may have qualitatively different
profiles of affect or affective dynamics that our current model may not be able to identify. Especially with a small
study population like ours, we note that fine-grained levels of mood instability may not be inferrable, beyond the
two-state representation of mood instability we adopted in this paper. In future work, however, in the presence
of richer datasets with larger populations, we believe our semi-supervised learning based approach can be easily
extended to a multi-class classification setting, allowing inferring a range of levels of mood instability.
We further acknowledge that discrepancies exist in the rates of High MI obtained in our bipolar, BPD and
control populations from Twitter, with respect to what is reported in the clinical literature. We note that the Twitter
Proceedings of the ACM on Interactive, Mobile, Wearable and Ubiquitous Technologies, Vol. 1, No. 3, Article 95. Publication date:
September 2017.
Inferring Mood Instability on Social Media by Leveraging Ecological Momentary Assessments • 95:23
mental health population on which we assessed mood instability is a self-identified population, that is, a set of
individuals who self-disclose about their diagnosis or experience of bipolar disorder or BPD on a public social
media platform. In this population, we found that the proportion of high mood instability to be lower, because
some of these individuals may be choosing not to share content that reflects their mood instability, as would be
measurable otherwise in a clinical population. This may be because of stigma concerns, a desire to craft a specific
identity on the social media platform, or for impression management purposes. On the other hand, we also do note
that in the Twitter control population, the rate of high mood instability was greater than in known healthy controls
in clinical studies. We conjecture that could be because this population is not a “true” control when it comes to
including individuals without an actual clinical diagnosis of bipolar or BPD. Future work could investigate these
discrepancies by using ground truth EMA data from a clinical sample, and then corroborating the results with
clinicians and domain experts.
Causal Claims. We suggest caution in deriving causal claims from our analyses, regarding the relationship between
psycholinguistic constructs of social media data, and an individual’s experience of MI . In future work, one could
apply advanced statistical techniques to harness social media data more extensively, such that causal relationships
between mental health conditions and lifestyle attributes could be detected and made actionable towards intervention
technologies and providers. Specifically, an imminent research direction could involve delineating causal pathways
associated with mood instability by aligning multi-level, multi-modal, comprehensive assessments as gleaned from
social media, and active and passive sensing. Then, by temporally aligning social media and sensed attributes,
statistical models may be able to explore dynamics of events around when or how soon an individual is likely to
experience a future episode of significant shift in their mood.
Limitations of Self-Reported and Social Media Data. There are also limitations of self-reported mood data that
may have influenced the accuracy of our results. For instance, any discrepancies between the PAM EMA response
and the subjective experience of affect that it is meant to measure, would distort the data in terms of both valence
and arousal dimensions. Therefore, any future work that improves the accuracy and reliability of these self-report
measures would, in turn, improve the accuracy available through our machine learning technique.
Further, we note limitations in the utility and applicability of social media data in inferring MI status of
individuals. In this paper, we leveraged publicly shared Twitter data of individuals who self-report their diagnoses
of bipolar or borderline personality disorder. Due to the stigmatized nature of these mental illnesses, there might be
a self-selection bias concerning individuals who choose to share their diagnoses of bipolar or borderline personality
disorder publicly on the platform. Self-censorship and impression management related issues may further impact
the manner in which individuals express their underlying behaviors, affect, experiences and other psychological
attributes via language on social media. It remains to be seen in future work how our findings will hold in the context
of alternative social media data sampling mechanisms, such as one in which large populations are collectively
consented to participate in a longitudinal study.
Harnessing Multimodal Data. The CampusLife Consortium is a multi-university endeavor, and this paper is based
on the data collected during our pilot run at Georgia Tech. We have plans to stage more data collection runs in
the near future, possibly recruiting a cohort of incoming freshmen throughout an academic year. Additionally, in
more comprehensive modeling of health and well-being, we are interested in including other passively collected
smartphone and wearable sensing based data, such as stress, conversational interactions, activities, and geo-location,
alongside social media. The StudentLife project [78, 79] indicated that such multi-modal sensor data can be
collected in a student population, and we hope to extend these investigations further within the context of precision
medicine.
Proceedings of the ACM on Interactive, Mobile, Wearable and Ubiquitous Technologies, Vol. 1, No. 3, Article 95. Publication date:
September 2017.

95:24 • K. Saha et al
7 CONCLUSION
In this paper, we provided a machine learning technique that uses social media data as a passive, unobtrusive sensor
for inferring mood instability, alongside actively sensed data given by EMAs. Specifically, we first developed a seed
classifier that utilized EMAs from a mobile sensing study as ground truth data to predict binary mood instability
status of individuals from their Facebook content. We then augmented this classifier to improve its robustness
and reduce overfitting, by adding independently obtained public data samples from Twitter. On evaluating this
augmented classifier on unseen populations of Twitter users who self-disclose suffering from bipolar and borderline
personality disorders, we found that our model predicts over 60% of these users to exhibit signs of heightened mood
instability; proportions of which are only 37% in a comparable control population from Twitter. Our work will
make available the first comprehensive lexicon of linguistic terms that tend to be highly prevalent in the expression
of individuals with high or low mood instability. In conclusion, we believe that our work advances the health
sensing research agenda by introducing a new modality of pre-existent, large-scale sensor data—social media,
which can significantly improve the modeling and inferential capabilities of small-scale active sensing frameworks.
8 ACKNOWLEDGMENTS
This research was supported by funds provided by the Human-facing Privacy Thrust of the IISP Institute at Georgia
Tech. We thank the members and participating institutions within the CampusLife Consortium, for their valuable
inputs in conceptualizing, designing, and conducting this pilot study. We especially thank Marie Le Pichon for her
help with the IRB protocol, as well as in providing guidance on the privacy considerations of the study.
REFERENCES[1] Gregory D Abowd, Anind K Dey, Peter J Brown, Nigel Davies, Mark Smith, and Pete Steggles. 1999. Towards a better understanding of
context and context-awareness. In International Symposium on Handheld and Ubiquitous Computing. Springer, 304–307.
[2] Phil Adams, Mashfiqui Rabbi, Tauhidur Rahman, Mark Matthews, Amy Voida, Geri Gay, Tanzeem Choudhury, and Stephen Voida. 2014.
Towards personal stress informatics: comparing minimally invasive techniques for measuring daily stress in the wild. In Proceedings
of the 8th International Conference on Pervasive Computing Technologies for Healthcare. ICST (Institute for Computer Sciences,
Social-Informatics and Telecommunications Engineering), 72–79.
[3] Jules Angst and Giovanni Cassano. 2005. The mood spectrum: improving the diagnosis of bipolar disorder. Bipolar disorders 7, s4 (2005),
4–12.
[4] Martin M Antony, Peter J Bieling, Brian J Cox, Murray W Enns, and Richard P Swinson. 1998. Psychometric properties of the 42-item
and 21-item versions of the Depression Anxiety Stress Scales in clinical groups and a community sample. Psychological assessment 10, 2
(1998), 176.
[5] Timothy Baldwin, Paul Cook, Marco Lui, Andrew MacKinlay, and Li Wang. 2013. How noisy social media text, how diffrnt social media
sources?. In IJCNLP. 356–364.
[6] Timothy A Brown, Bruce F Chorpita, and David H Barlow. 1998. Structural relationships among dimensions of the DSM-IV anxiety and
mood disorders and dimensions of negative affect, positive affect, and autonomic arousal. Journal of abnormal psychology 107, 2 (1998),
179.
[7] Christopher JC Burges and Bernhard Schölkopf. 1997. Improving the accuracy and speed of support vector machines. Advances in neural
information processing systems (1997), 375–381.
[8] Luca Canzian and Mirco Musolesi. 2015. Trajectories of depression: unobtrusive monitoring of depressive states by means of smartphone
mobility traces analysis. In Proceedings of the 2015 ACM International Joint Conference on Pervasive and Ubiquitous Computing. ACM,
1293–1304.
[9] Stevie Chancellor, Zhiyuan (Jerry) Lin, Erica Goodman, Stephanie Zerwas, and Munmun De Choudhury. [n. d.]. Quantifying and
Predicting Mental Illness Severity in Online Pro-Eating Disorder Communities. In Proceedings of the 19th ACM conference on Computer
supported cooperative work & social computing.
[10] Olivier Chapelle, Bernhard Scholkopf, and Alexander Zien. 2009. Semi-supervised learning (chapelle, o. et al., eds.; 2006)[book reviews].
IEEE Transactions on Neural Networks 20, 3 (2009), 542–542.
[11] Eun Kyoung Choe, Saeed Abdullah, Mashfiqui Rabbi, Edison Thomaz, Daniel A Epstein, Felicia Cordeiro, Matthew Kay, Gregory D
Abowd, Tanzeem Choudhury, James Fogarty, et al. 2017. Semi-Automated Tracking: A Balanced Approach for Self-Monitoring
Applications. IEEE Pervasive Computing 16, 1 (2017), 74–84.
Proceedings of the ACM on Interactive, Mobile, Wearable and Ubiquitous Technologies, Vol. 1, No. 3, Article 95. Publication date:
September 2017.

Inferring Mood Instability on Social Media by Leveraging Ecological Momentary Assessments • 95:25
[12] Cindy Chung and James W Pennebaker. 2007. The psychological functions of function words. Social communication (2007), 343–359.
[13] William S Cleveland. 1981. LOWESS: A program for smoothing scatterplots by robust locally weighted regression. The American
Statistician 35, 1 (1981), 54–54.
[14] Sunny Consolvo, David W McDonald, Tammy Toscos, Mike Y Chen, Jon Froehlich, Beverly Harrison, Predrag Klasnja, Anthony
LaMarca, Louis LeGrand, Ryan Libby, et al. 2008. Activity sensing in the wild: a field trial of ubifit garden. In Proceedings of the SIGCHI
Conference on Human Factors in Computing Systems. ACM, 1797–1806.
[15] Glen Coppersmith, Mark Dredze, and Craig Harman. 2014. Quantifying mental health signals in twitter. In ACL Workshop on Computa-
tional Linguistics and Clinical Psychology.
[16] Glen Coppersmith, Craig Harman, and Mark Dredze. 2014. Measuring post traumatic stress disorder in Twitter. In International Conference
on Weblogs and Social Media (ICWSM).
[17] William Coryell, William Scheftner, Martin Keller, Jean Endicott, Jack Maser, and Gerald L Klerman. 1993. The enduring psychosocial
consequences of mania and depression. The American journal of psychiatry (1993).
[18] Rex William Cowdry, David L Gardner, et al. 1991. Mood variability: A study of four groups. The American Journal of Psychiatry 148,
11 (1991), 1505.
[19] Mihaly Csikszentmihalyi and Reed Larson. 2014. Validity and reliability of the experience-sampling method. In Flow and the foundations
of positive psychology. Springer, 35–54.
[20] Rozita Dara, Stefan C Kremer, and Deborah A Stacey. 2002. Clustering unlabeled data with SOMs improves classification of labeled
real-world data. In Neural Networks, 2002. IJCNN’02. Proceedings of the 2002 International Joint Conference on, Vol. 3. IEEE,
2237–2242.
[21] Munmun De Choudhury, Scott Counts, and Michael Gamon. 2012. Not all moods re created equal! a exploring human emotional states in
social media. In Proc. ICWSM.
[22] Munmun De Choudhury, Scott Counts, and Eric Horvitz. 2013. Predicting postpartum changes in emotion and behavior via social media.
In Proceedings of the 2013 ACM annual conference on Human factors in computing systems. ACM, 3267–3276.
[23] Munmun De Choudhury, Michael Gamon, Scott Counts, and Eric Horvitz. 2013. Predicting depression via social media. In AAAI
Conference on Weblogs and Social Media.
[24] Munmun De Choudhury, Sanket S Sharma, Tomaz Logar, Wouter Eekhout, and René Clausen Nielsen. 2017. Gender and Cross-Cultural
Differences in Social Media Disclosures of Mental Illness. In Proc. CSCW. ACM.
[25] David A Dickey and Wayne A Fuller. 1981. Likelihood ratio statistics for autoregressive time series with a unit root. Econometrica:
Journal of the Econometric Society (1981), 1057–1072.
[26] Afsaneh Doryab, Jun Ki Min, Jason Wiese, John Zimmerman, and Jason I Hong. 2014. Detection of behavior change in people with
depression. AAAI.
[27] Ulrich W Ebner-Priemer, Michael Eid, Nikolaus Kleindienst, Simon Stabenow, and Timothy J Trull. 2009. Analytic strategies for
understanding affective (in) stability and other dynamic processes in psychopathology. Journal of abnormal psychology 118, 1 (2009),
195.
[28] Ulrich W Ebner-Priemer and Timothy J Trull. 2009. Ecological momentary assessment of mood disorders and mood dysregulation.
Psychological assessment 21, 4 (2009), 463.
[29] Deborah Estrin. 2014. Small data, where n= me. Commun. ACM 57, 4 (2014), 32–34.
[30] Denzil Ferreira, Vassilis Kostakos, and Anind K Dey. 2015. AWARE: mobile context instrumentation framework. Frontiers in ICT 2
(2015), 6.
[31] Jon Froehlich, Mike Y Chen, Sunny Consolvo, Beverly Harrison, and James A Landay. 2007. MyExperience: a system for in situ tracing
and capturing of user feedback on mobile phones. In Proceedings of the 5th international conference on Mobile systems, applications and
services. ACM, 57–70.
[32] Scott A Golder and Michael W Macy. 2011. Diurnal and seasonal mood vary with work, sleep, and daylength across diverse cultures.
Science 333, 6051 (2011), 1878–1881.
[33] Fernando Gomez. 2016. A Guide to the Depression, Anxiety and Stress Scale (DASS 21). (2016).
[34] Shannon Greenwood, Andrew Perrin, and Maeve Duggan. 2016. Demographics of Social Media Users in 2016. http://www.pewinternet.
org/2016/11/11/social-media-update-2016/. (2016). Accessed: 2017-02-12.
[35] James J Gross and Ross A Thompson. 2007. Emotion regulation: Conceptual foundations. (2007).
[36] Agnes Grünerbl, Amir Muaremi, Venet Osmani, Gernot Bahle, Stefan Oehler, Gerhard Tröster, Oscar Mayora, Christian Haring, and Paul
Lukowicz. 2015. Smartphone-based recognition of states and state changes in bipolar disorder patients. IEEE Journal of Biomedical and
Health Informatics 19, 1 (2015), 140–148.
[37] Philip D Harvey, Barbara R Greenberg, and Mark R Serper. 1989. The affective lability scales: development, reliability, and validity.
Journal of clinical psychology 45, 5 (1989), 786–793.
[38] Jennifer Healey and Rosalind W Picard. 2005. Detecting stress during real-world driving tasks using physiological sensors. Intelligent
Transportation Systems, IEEE Transactions on 6, 2 (2005), 156–166.
Proceedings of the ACM on Interactive, Mobile, Wearable and Ubiquitous Technologies, Vol. 1, No. 3, Article 95. Publication date:
September 2017.

95:26 • K. Saha et al
[39] Joel M Hektner, Jennifer A Schmidt, and Mihaly Csikszentmihalyi. 2007. Experience sampling method: Measuring the quality of everyday
life. Sage.
[40] Chantal Henry, Donatienne Van den Bulke, Frank Bellivier, Isabelle Roy, Joël Swendsen, Katia M’Baïlara, Larry J Siever, and Marion
Leboyer. 2008. Affective lability and affect intensity as core dimensions of bipolar disorders during euthymic period. Psychiatry research
159, 1 (2008), 1–6.
[41] Robert MA Hirschfeld, Janet BW Williams, Robert L Spitzer, Joseph R Calabrese, Laurie Flynn, Paul E Keck Jr, Lydia Lewis, Susan L
McElroy, Robert M Post, Daniel J Rapport, et al. 2000. Development and validation of a screening instrument for bipolar spectrum
disorder: the Mood Disorder Questionnaire. American Journal of Psychiatry 157, 11 (2000), 1873–1875.
[42] Seungmin Jahng, Phillip K Wood, and Timothy J Trull. 2008. Analysis of affective instability in ecological momentary assessment:
Indices using successive difference and group comparison via multilevel modeling. Psychological methods 13, 4 (2008), 354.
[43] Ian Jolliffe. 2002. Principal component analysis. Wiley Online Library.
[44] Daniel Jurafsky and H James. 2000. Speech and language processing an introduction to natural language processing, computational
linguistics, and speech. (2000).
[45] P Juszczak, D Tax, and Robert PW Duin. 2002. Feature scaling in support vector data description. In Proc. ASCI. Citeseer, 95–102.
[46] Predrag Klasnja, Sunny Consolvo, Tanzeem Choudhury, Richard Beckwith, and Jeffrey Hightower. 2009. Exploring privacy concerns
about personal sensing. In International Conference on Pervasive Computing. Springer, 176–183.
[47] Harold W Koenigsberg, Philip D Harvey, Vivian Mitropoulou, James Schmeidler, Antonia S New, Marianne Goodman, Jeremy M
Silverman, Michael Serby, Frances Schopick, and Larry J Siever. 2002. Characterizing affective instability in borderline personality
disorder. American Journal of Psychiatry 159, 5 (2002), 784–788.
[48] Martin Kusserow, Oliver Amft, and Gerhard Troster. 2013. Modeling arousal phases in daily living using wearable sensors. Affective
Computing, IEEE Transactions on 4, 1 (2013), 93–105.
[49] Nicholas D Lane, Emiliano Miluzzo, Hong Lu, Daniel Peebles, Tanzeem Choudhury, and Andrew T Campbell. 2010. A survey of mobile
phone sensing. IEEE Communications magazine 48, 9 (2010).
[50] James Alexander Lee, Christos Efstratiou, and Lu Bai. 2016. OSN mood tracking: exploring the use of online social network activity as an
indicator of mood changes. In Proceedings of the 2016 ACM International Joint Conference on Pervasive and Ubiquitous Computing:
Adjunct. ACM, 1171–1179.
[51] Yong Liu, Denzil Ferreira, Jorge Goncalves, Simo Hosio, Pratyush Pandab, and Vassilis Kostakos. 2016. Donating Context Data to
Science: The Effects of Social Signals and Perceptions on Action-Taking. Interacting with Computers (2016).
[52] Hong Lu, Denise Frauendorfer, Mashfiqui Rabbi, Marianne Schmid Mast, Gokul T Chittaranjan, Andrew T Campbell, Daniel Gatica-Perez,
and Tanzeem Choudhury. 2012. Stresssense: Detecting stress in unconstrained acoustic environments using smartphones. In Proceedings
of the 2012 ACM Conference on Ubiquitous Computing. ACM, 351–360.
[53] Bernard Lubin, Sprague H Gardener, and Aleda Roth. 1975. Mood and somatic symptoms during pregnancy. Psychosomatic Medicine 37,
2 (1975), 136–146.
[54] Dean F MacKinnon and Ronald Pies. 2006. Affective instability as rapid cycling: theoretical and clinical implications for borderline
personality and bipolar spectrum disorders. Bipolar disorders 8, 1 (2006), 1–14.
[55] Steven Marwaha, Matthew R Broome, Paul E Bebbington, Elizabeth Kuipers, and Daniel Freeman. 2014. Mood instability and psychosis:
analyses of British national survey data. Schizophrenia bulletin 40, 2 (2014), 269–277.
[56] Abhinav Mehrotra, Veljko Pejovic, and Mirco Musolesi. 2014. SenSocial: a middleware for integrating online social networks and mobile
sensing data streams. In Proceedings of the 15th International Middleware Conference. ACM, 205–216.
[57] Tomas Mikolov, Kai Chen, Greg Corrado, and Jeffrey Dean. 2013. Efficient estimation of word representations in vector space. arXiv
preprint arXiv:1301.3781 (2013).
[58] Megan A Moreno, Dimitri A Christakis, Katie G Egan, Libby N Brockman, and Tara Becker. 2011. Associations between displayed
alcohol references on Facebook and problem drinking among college students. Archives of pediatrics & adolescent medicine (2011),
archpediatrics–2011.
[59] Rashmi Patel, Theodore Lloyd, Richard Jackson, Michael Ball, Hitesh Shetty, Matthew Broadbent, John R Geddes, Robert Stewart, Philip
McGuire, and Matthew Taylor. 2015. Mood instability is a common feature of mental health disorders and is associated with poor clinical
outcomes. BMJ open 5, 5 (2015), e007504.
[60] James W Pennebaker, Matthias R Mehl, and Kate G Niederhoffer. 2003. Psychological aspects of natural language use: Our words, our
selves. Annual review of psychology 54, 1 (2003), 547–577.
[61] Jeffrey Pennington, Richard Socher, and Christopher D Manning. 2014. Glove: Global Vectors for Word Representation.. In EMNLP,
Vol. 14. 1532–1543.
[62] John P Pollak, Phil Adams, and Geri Gay. 2011. PAM: a photographic affect meter for frequent, in situ measurement of affect. In
Proceedings of the SIGCHI conference on Human factors in computing systems. ACM, 725–734.
[63] Jonathan Posner, James A Russell, and Bradley S Peterson. 2005. The circumplex model of affect: An integrative approach to affective
neuroscience, cognitive development, and psychopathology. Development and psychopathology 17, 03 (2005), 715–734.
Proceedings of the ACM on Interactive, Mobile, Wearable and Ubiquitous Technologies, Vol. 1, No. 3, Article 95. Publication date:
September 2017.

Inferring Mood Instability on Social Media by Leveraging Ecological Momentary Assessments • 95:27
[64] Michael I Posner and Mary K Rothbart. 2000. Developing mechanisms of self-regulation. Development and psychopathology 12, 03
(2000), 427–441.
[65] Sohrab Saeb, Mi Zhang, Christopher J Karr, Stephen M Schueller, Marya E Corden, Konrad P Kording, and David C Mohr. 2015. Mobile
phone sensor correlates of depressive symptom severity in daily-life behavior: an exploratory study. Journal of medical Internet research
17, 7 (2015).
[66] H Andrew Schwartz, Johannes C Eichstaedt, Margaret L Kern, Lukasz Dziurzynski, Stephanie M Ramones, Megha Agrawal, Achal Shah,
Michal Kosinski, David Stillwell, Martin EP Seligman, et al. 2013. Personality, gender, and age in the language of social media: The
open-vocabulary approach. PloS one 8, 9 (2013), e73791.
[67] H Andrew Schwartz, Maarten Sap, Margaret L Kern, Johannes C Eichstaedt, Adam Kapelner, Megha Agrawal, Eduardo Blanco, Lukasz
Dziurzynski, Gregory Park, David Stillwell, et al. 2016. Predicting individual well-being through the language of social media. In Pac
Symp Biocomput, Vol. 21. 516–527.
[68] Norbert Schwarz. 2007. Retrospective and concurrent self-reports: The rationale for real-time data capture. The science of real-time data
capture: Self-reports in health research (2007), 11–26.
[69] Christie Napa Scollon, Chu-Kim Prieto, and Ed Diener. 2009. Experience sampling: promises and pitfalls, strength and weaknesses. In
Assessing well-being. Springer, 157–180.
[70] Saul Shiffman, Arthur A Stone, and Michael R Hufford. 2008. Ecological momentary assessment. Annu. Rev. Clin. Psychol. 4 (2008),
1–32.
[71] Erez Shmueli, Vivek K Singh, Bruno Lepri, and Alex Pentland. 2014. Sensing, understanding, and shaping social behavior. IEEE
Transactions on Computational Social Systems 1, 1 (2014), 22–34.
[72] Arthur A Stone, Joseph E Schwartz, John M Neale, Saul Shiffman, Christine A Marco, Mary Hickcox, Jean Paty, Laura S Porter, and
Laura J Cruise. 1998. A comparison of coping assessed by ecological momentary assessment and retrospective recall. Journal of
personality and social psychology 74, 6 (1998), 1670.
[73] Arthur A Stone and Saul Shiffman. 1994. Ecological momentary assessment (EMA) in behavorial medicine. Annals of Behavioral
Medicine (1994).
[74] Hyewon Suh, Nina Shahriaree, Eric B Hekler, and Julie A Kientz. 2016. Developing and Validating the User Burden Scale: A Tool for
Assessing User Burden in Computing Systems. In Proceedings of the 2016 CHI Conference on Human Factors in Computing Systems.
ACM, 3988–3999.
[75] Roger Tourangeau, Lance J Rips, and Kenneth Rasinski. 2000. The psychology of survey response. Cambridge University Press.
[76] Timothy J Trull, Marika B Solhan, Sarah L Tragesser, Seungmin Jahng, Phillip K Wood, Thomas M Piasecki, and David Watson. 2008.
Affective instability: measuring a core feature of borderline personality disorder with ecological momentary assessment. Journal of
abnormal psychology 117, 3 (2008), 647.
[77] Rui Wang, Min SH Aung, Saeed Abdullah, Rachel Brian, Andrew T Campbell, Tanzeem Choudhury, Marta Hauser, John Kane, Michael
Merrill, Emily A Scherer, et al. 2016. CrossCheck: Toward passive sensing and detection of mental health changes in people with
schizophrenia. In Proceedings of the 2016 ACM International Joint Conference on Pervasive and Ubiquitous Computing. ACM, 886–897.
[78] Rui Wang, Fanglin Chen, Zhenyu Chen, Tianxing Li, Gabriella Harari, Stefanie Tignor, Xia Zhou, Dror Ben-Zeev, and Andrew T Campbell.
2014. StudentLife: assessing mental health, academic performance and behavioral trends of college students using smartphones. In
Proceedings of the 2014 ACM International Joint Conference on Pervasive and Ubiquitous Computing. ACM, 3–14.
[79] Rui Wang, Gabriella Harari, Peilin Hao, Xia Zhou, and Andrew T Campbell. 2015. SmartGPA: how smartphones can assess and predict
academic performance of college students. In Proceedings of the 2015 ACM International Joint Conference on Pervasive and Ubiquitous
Computing. ACM, 295–306.
[80] Daqing Zhang, Bin Guo, and Zhiwen Yu. 2011. The emergence of social and community intelligence. Computer 44, 7 (2011), 21–28.
[81] Xiaoyi Zhang, Laura R Pina, and James Fogarty. 2016. Examining Unlock Journaling with Diaries and Reminders for In Situ Self-Report
in Health and Wellness. In Proceedings of the 2016 CHI Conference on Human Factors in Computing Systems. ACM, 5658–5664.
[82] Xiaojin Zhu. 2005. Semi-supervised learning literature survey. (2005).
Received February 2017; revised May 2017, July 2017; accepted July 2017
Proceedings of the ACM on Interactive, Mobile, Wearable and Ubiquitous Technologies, Vol. 1, No. 3, Article 95. Publication date:
September 2017.