inferring heterozygosity from ancient and low coverage genomes · inferring heterozygosity from...
TRANSCRIPT

HIGHLIGHTED ARTICLE| INVESTIGATION
Inferring Heterozygosity from Ancient and LowCoverage Genomes
Athanasios Kousathanas,*,† Christoph Leuenberger,‡ Vivian Link,*,† Christian Sell,§ Joachim Burger,§
and Daniel Wegmann*,†,1
*Department of Biology and Biochemistry and ‡Department of Mathematics, University of Fribourg, 1700, Switzerland, †Statisticaland Computational Evolutionary Biology Group, Swiss Institute of Bioinformatics, Fribourg, 1700, Switzerland, and §Paleogenetics
Group, University of Mainz, 55122, Germany
ORCID ID: 0000-0003-2866-6739 (D.W.)
ABSTRACT While genetic diversity can be quantified accurately from high coverage sequencing data, it is often desirable to obtainsuch estimates from data with low coverage, either to save costs or because of low DNA quality, as is observed for ancient samples.Here, we introduce a method to accurately infer heterozygosity probabilistically from sequences with average coverage , 13 of asingle individual. The method relaxes the infinite sites assumption of previous methods, does not require a reference sequence, exceptfor the initial alignment of the sequencing data, and takes into account both variable sequencing errors and potential postmortemdamage. It is thus also applicable to nonmodel organisms and ancient genomes. Since error rates as reported by sequencing machines aregenerally distorted and require recalibration, we also introduce a method to accurately infer recalibration parameters in the presence ofpostmortem damage. This method does not require knowledge about the underlying genome sequence, but instead works with haploiddata (e.g., from the X-chromosome frommammalian males) and integrates over the unknown genotypes. Using extensive simulations weshow that a few megabasepairs of haploid data are sufficient for accurate recalibration, even at average coverages as low as 13 : Atsimilar coverages, our method also produces very accurate estimates of heterozygosity down to 1024 within windows of about 1 Mbp.We further illustrate the usefulness of our approach by inferring genome-wide patterns of diversity for several ancient human samples,and we found that 3000–5000-year-old samples showed diversity patterns comparable to those of modern humans. In contrast, twoEuropean hunter-gatherer samples exhibited not only considerably lower levels of diversity than modern samples, but also highly distinctdistributions of diversity along their genomes. Interestingly, these distributions were also very different between the two samples,supporting earlier conclusions of a highly diverse and structured population in Europe prior to the arrival of farming.
KEYWORDS heterozygosity; low coverage; ancient DNA; postmortem damage; base recalibration
THE genetic diversity at a particular location in the genomeis the result of its evolutionarypast.Comparing thegenetic
diversity between individuals or regions of the genome thusgives insight into differences in their respective evolutionaryhistories. For a diploid individual, the heterozygosity of agenomic region (the fraction of sites in a region at whichthe individual carries two different alleles) is the result ofmutations that occurred since the two alleles shared a com-
mon ancestor. It is thus a function of the local mutationrate and the time to the most recent common ancestor,which, in turn, is reflective of the demographic and se-lective past at that locus. Variation in local mutation ratesand, due to recombination, also in the strength of selec-tion and genetic drift leads to variable diversity across thegenome. Comparing heterozygosity between regions canthus identify locations that were affected differently byselection, or those with an increased mutation rate. Com-paring heterozygosity between individuals may furtherhighlight differences in the demographic histories of pop-ulations or different levels of inbreeding, which may leadto long runs of homozygosity.
While heterozygosity is readily obtained from high qual-ity genotype calls by counting, it is much harder to infer
Copyright © 2017 by the Genetics Society of Americadoi: 10.1534/genetics.116.189985Manuscript received April 1, 2016; accepted for publication October 19, 2016;published Early Online November 7, 2016.Available freely online through the author-supported open access option.Supplemental material is available online at www.genetics.org/lookup/suppl/doi:10.1534/genetics.116.189985/-/DC1.1Corresponding author: Department of Biology, University of Fribourg, Chemin duMusée 10, 1200 Fribourg, Switzerland. E-mail: [email protected]
Genetics, Vol. 205, 317–332 January 2017 317

accurately from low coverage genomes (i.e., genomes se-quenced at low depth). This is primarily due to a substantialprobability of observing only one of the two alleles and tosequencing errors, which occur at rates orders of magnitudehigher than the expected heterozygosity in many species, in-cluding humans. Additional biases may be introduced by re-lying on a reference genome or by postmortem DNA damage(PMD) when working with ancient DNA.
A natural way of circumventing these issues is to infergenetic diversity probabilistically by taking many of the men-tioned issues into account, and several such methods havebeen developed over the past decade. Johnson and Slatkin(2006), for instance, developed a method for estimating thepopulation scaled mutation rate u ¼ 4Nm; where N is thepopulation size, and m the mutation rate, from large meta-genomic data sets in the presence of sequencing errors. Shortlyafter, multiple moment based estimators were introduced toinfer heterozygosity from a single individual (Hellmann et al.2008; Jiang et al. 2008). Lynch (2008) then introduced alikelihood-based estimator that relaxed the assumption of aknown error rate by estimating it jointly with heterozygosityfrom the data itself. Despite the additional parameter, thislikelihood-based estimator is generally more accurate, evenif this implementation is ill-behaved at very low coverages(Lynch 2008).
Several methods to infer genetic diversity that relax theassumption of a constant error rate have since been proposed.These methods commonly make use of error rate estimatesprovided by the sequencing machines (the quality scores) tocalculate the genotype likelihoods then used in the inference.A particularly frequently used approach infers the site fre-quency spectrum (SFS) while integrating over genotype un-certainty at individual sites (Nielsen et al. 2012). If applied todata from a single individual, the SFS is a direct estimation ofheterozygosity. However, the current implementation of thisapproach in the software package ANGSD (Korneliussen2014) requires a priori knowledge of the two potentially ob-servable alleles at each site. While these may be inferredaccurately in the case of multiple samples with decent cover-age, such an inference from low coverage data are likelybiased.
Here, we present a direct extension of these previousapproaches to inferheterozygositywithina region that relaxesthe assumption of infinitely many sites, does not require anya priori knowledge of the underlying alleles, and takes addi-tional biases introduced by PMD fully into account. Weachieve this by explicitly modeling PMD using an extensionof the likelihood framework proposed by Maruki and Lynch(2015) to infer site allele frequencies by integrating over allpossible genotypes, and by modeling genotype frequenciesusing the classic substitution model of Felsenstein (1981),which allows for back mutations.
A major hurdle for all approaches relying on quality scoresprovided by sequencing machines is that these scores arenot reliable and must be recalibrated, particularly whencoverage is low. This is commonly achieved by learning
error rates from sites assumed a priori to be invariant, forinstance, by masking polymorphic sites, repetitive elements,and large structural variants (DePristo et al. 2011). While wehave extended this approach to tolerate PMD (Hofmanováet al. 2016), it requires detailed knowledge of the studyspecies, which is often lacking for nonmodel organisms.We propose here to circumvent this problem by using areference-free recalibration approach that relies on haploidsequences such as those from the X-chromosome in malemammals. Our approach does not require any a priori in-formation on the underlying sequence, as it integrates overall possible but hidden genotypes while taking PMD andcovariates such as position in read or read context into ac-count. This renders our approach essentially free of refer-ence biases, since the reference is only required for aligningraw reads by mapping and current mapping techniques tol-erate a sequence divergence of up to 10% (e.g., Lunter andGoodson 2011).
Using computer simulations, we show that our methodreliably estimates local genetic diversity in single, diploidindividuals even with average coverage below 23 for win-dows of�1 Mbp. We further show that a fewmegabasepairsof data at equally low coverage are sufficient to properlyrecalibrate distorted quality scores. Finally, we use themethods here developed to infer the genome-wide patternof diversity for several ancient and modern human samples.We found that these patterns differ between European andAfrican samples, but that samples from a few thousand yearsago cluster well with modern samples. In contrast, Euro-pean hunter-gatherer individuals differ strongly from mod-ern Europeans, but also from each other, illustrating thehigh diversity that existed in Europe before the Neolithictransition.
Theory
Inferring heterozygosity
Here we develop a method to estimate local heterozygosityin a genomic window from a collection of aligned reads byintegrating out the uncertainty of the local genotype, andby taking the potential effects of PMD into account. Spe-cifically, we are interested in inferring the stationary basefrequencies p ¼ fpA;pC;pG;pTg, together with the rate ofsubstitutions u ¼ 2Tm, along the genealogy connectingthe two alleles of an individual within a genomic region.Here, T corresponds to the time to the most recent com-mon ancestor of the two lineages, and m to the mutationrate per base pair per generation. Notably, it is not possibleto infer T and m independently, and we therefore onlyattempt to estimate the compound substitution rate u fromthe data.
We extend Felsenstein’s model of substitutions (Felsenstein1981) to infer u while accounting for the uncertainty in thegenotypes in the region of interest. Let us denote the hiddengenotype at site i by gi, where gi consists of a pair of nucleotides
318 A. Kousathanas et al.

kl with k; l ¼ A;G;C;T: Under the substitution model, theprobability of observing a specific genotype gi ¼ kl given thebase frequencies p ¼ fpA;pC;pG;pTg, and the substitutionrate u, is given by
ℙðgi ¼ klju;pÞ ¼�pk�e2u þ pk
�12 e2u
��if k ¼ l;
pkpl�12 e2u
�if k 6¼ l:
(1)
To integrate out the uncertainty in observed genotypes, weadopt a model similar to Lynch (2008), and those commonlyused for genotype calling (e.g., Li 2011). The subsequentnotation will closely follow the notation we recently intro-duced (Hofmanová et al. 2016).
The observed data di at site i shall correspond to what istypically obtained when individual reads of next generationsequencing approaches are mapped to a reference genome.Here, we will assume that all sequencing reads were accu-ratelymapped and that reads with lowmapping qualities havebeen filtered out. The data di obtained at site i thus consists ofa list of ni observed bases di ¼ fdi1; . . . ; dinig; dij ¼ A;C;G;T:
Wechose tomodel the observed data, di, at site i as a functionof the underlying genotype, gi, as well as the base-specific ratesof sequencing errors eij for j ¼ 1; . . . ; ni: We assume here thatthese rates are known (e.g., through quality scores provided bythe sequencing machine). Assuming further that sequencingerrors occur independently, the likelihood of the full data at site,i, is given by
ℙ dijgi; eið Þ ¼Yni
j¼1
ℙ dij��gi; eij� �
;
where ei ¼ fei1; . . . ; einig:Following Maruki and Lynch (2015), and commonly used
approaches (e.g., Li 2011), we will assume that a sequencingread is equally likely to cover any of the two alleles of anindividual, and that sequencing errors may result in any ofthe alternative bases with equal probability, eij=3: The prob-ability of observing a base, dij, given the underlying genotype,gi ¼ kl, is then given by
ℙ dij��gi ¼ kl; eij
� �¼
12 eij if k ¼ l ¼ dijeij
3if k 6¼ dij; l 6¼ dij
122eij
3if k 6¼ l; k ¼ dij or l ¼ dij
:
8>>>>><>>>>>:
Assuming sites to be independent, the full likelihood of ourmodel is given by
Lðu;pÞ ¼ ℙðdju;pÞ ¼YIi¼1
ℙðdiju;pÞ
¼YIi¼1
Xg
ℙðdijgi ¼ gÞℙðgi ¼ gju;pÞ;
where the sum runs over all combinations g ¼ AA;AG; . . . ;TT:
PMD damage: We will next extend this model with thepossibility of PMD. The most common form of PMD is C de-amination, which leads to a C/T transition on the affectedstrand and a G/A transition on the complimentary strand(e.g., Briggs and Stenzel 2007). These deaminations do notoccur randomly along the whole read, but are observedmuch more frequently at the beginning of a read. This isdue to fragment ends being more often single-stranded,and thus subject to a much higher rate of deamination.Consequently, the rates of PMD, while specific to the sam-ple and the sequencing protocol used, generally decayroughly exponentially with distance from the ends of theread Skoglund et al. (2014). Since ancient DNA is highlyfragmented, one read can often cover an entire DNAmolecule, and hence C/T and G/A transitions may beseen in a single read, but they are accumulated at oppositeends.
Here, we will develop our model for this form of PMDfollowing the formulation of Skoglund et al. (2014) andHofmanová et al. (2016), but we note that it is readily ex-tendable to incorporate other forms of PMD as well. We feelthat the rationale of the approach taken is best explainedwith a specific example. Consider dij ¼ T, given the underly-ing genotype gi ¼ CT: There are three possible ways to obtaina T: (i) by sequencing an allele T without error, (ii) by se-quencing an allele C affected by PMDwithout error, (iii) or bysequencing an allele C not affected by PMD with error. Wethus have
ℙ dij ¼ T��gi ¼ CT; eij;Dij
� �¼ 1
212 eij� �
þ Dij 12 eij� �
þ 12Dij� � eij
3
� �(2)
where Dij denotes the probability that a C/T PMD occurredat the base of read j covering site i.
The emission probabilities for all combinations of dij and giderived following the same logic are found in the Appendix.
Inference using expectation-maximization: In this section,we will detail how to find the maximum likelihood estimate(MLE) of themodel parameters u andp in a genomic windowof I sites using an expectation-maximization (EM) algorithm(Dempster et al. 1977). For this, wewill make the assumptionthat base-specific sequencing error rates, eij, and rates ofPMD, Dij, are given constants. For the cases in which theyare not known a priori, we show below how they can belearned accurately from genome-wide data prior to inferringu and p: In an effort to unburden the notation, we will thusrefer to the emission probabilities simply as ℙðdijgiÞ in thefollowing.
The relevant property to develop an EM algorithm is thecomplete data likelihood, which, in the case of our model, isgiven by
Lcðu;p;d; gÞ ¼YIi¼1
ℙðgi; diju;pÞ ¼YIi¼1
ℙðdijgiÞℙðgiju;pÞ
Heterozygosity of Ancient Genomes 319

and thus the complete data log-likelihood by
lcðu;p;d; gÞ ¼XIi¼1
ðlogℙðdijgiÞ þ logℙðgiju;pÞÞ:
E-step: The expected complete data log-likelihood is calcu-lated as
Qðu;p; u9;p9Þ ¼ E½lcðu;p;d; gÞjd; u9;p9�
¼XIi¼1
Xg
hlogℙðdijgÞ
þ logℙðgju;pÞiℙðgjdi; u9;p9Þ
where the sum runs over all combinations g ¼ AA;AG; . . . ;TT:Only the second part Q2 of this sum depends on the param-eters u;p: We have
Q2ðu;p; u9;p9Þ ¼XIi¼1
Xg
logℙðgju;pÞℙðgjdi; u9;pÞ9
¼Xg
logℙðgju;pÞXIi¼1
ℙðgjdi; u9;pÞ9
¼Xg
Pglogℙðgju;pÞ
where we use the shorthand notation Pg ¼XIi¼1
ℙðgjdi; u9;p9Þ:We have by Bayes’ Theorem
Pg ¼XIi¼1
ℙðdijgÞℙðgju9;p9ÞXgℙðdijgÞℙðgju9;p9Þ
: (3)
Let us write out Q2 explicitly:
Q2ðu;p; u9;p9Þ ¼Xk
Pkkhlogpk þ log
�e2u þ pk
�12 e2u
��i
þXk
Xl 6¼k
Pklhlogpk þ logpl
þ log�12 e2u
�i:
M-step: We have to maximize Q2 subject to theconstraint X
k
pk ¼ pA þ pG þ pC þ pT ¼ 1:
For this reason, we form the Lagrangian
Lðu;p;mÞ ¼ Q2ðu;p; u9;p9Þ2m
Xk
pk 2 1
!
where m is the Lagrange multiplier. We get the followingpartial derivatives of the Lagrangian:
@
@pkL ¼ Pkk
1pk
þ 12 e2u
e2u þ pkð12 e2uÞ
!þXl 6¼k
2Pklpk
2m;
@
@uL ¼2e2u
Xk
Pkkð12pkÞe2u þ pkð12 e2uÞ
þ e2u
12 e2u
Xk
Xl 6¼k
Pkl;
@
@mL ¼
Xk
pk 2 1:
Wehave to set these equations to zero and solve forpk; u; andm. Since this is not possible analytically, we will revert to theNewton-Raphson algorithm.
To streamline the notation, we will rename our variablesx1 ¼ pA; . . . ; x4 ¼ pT ; x5 ¼ e2u=ð12 e2uÞ, and x6 ¼ m: Withthese variable the above system can be simplified to a system
FðxÞ ¼ 0; (4)
where
Fkðx1; . . . ; x6Þ :5 Pkk
1þ xk
x5 þ xk
!þ 2
X4l¼1
Pkl 2 x6xk ¼ 0
for k ¼ 1; . . . ; 4; and
F5ðx1; . . . ; x6Þ :5 I2X4k¼1
Pkkðx5 þ 1Þx5 þ xk
¼ 0;
F6ðx1; . . . ; x6Þ :5X4k¼1
xk 21 ¼ 0:
To apply the Newton-Raphson algorithm, we determine the63 6 Jacobian matrix Jij ¼ @Fi=@xj: The nonzeros entries ofthe Jacobian with k ¼ 1; . . . ; 4 are:
Jkk ¼Pkkx5
ðxk þ x5Þ22 x6;
J5k ¼ ðx5 þ 1ÞX4l¼1
Pllðxl þ x5Þ2
;
J6k ¼ 1;
Jk5 ¼ 2Pkkxk
ðxk þ x5Þ2;
Jk6 ¼ 2 xk;
J55 ¼X4l¼1
Pllð12 xlÞðxl þ x5Þ2
:
(5)
We can now approximate the zero of Equation 4 with theiteration
xnew ¼ xold 2 J21ðxoldÞFðxoldÞ: (6)
320 A. Kousathanas et al.

After a few iterations, we get the new estimate for the originalparameters by setting pk ¼ xk for k ¼ 1; . . . ; 4; andu ¼ 2 log½x5=ð12 x5Þ�
Confidence intervals: We calculate an approximate confi-dence interval for u using the Fisher information. To simplifythe calculations, we consider the pk as constant. The ob-served Fisher information at the ML value u is
IðuÞ ¼ 2@2
@u2logLðu;pÞ
¼ 2XIi¼1
@2
@u2log
"Xg
ℙðdijgi ¼ gÞℙðgi ¼ gju;pÞ#;
and the corresponding derivatives are
@
@uℙðgi ¼ klju;pÞ ¼
��p2k 2pk
�e2u if k ¼ l;
pkple2u if k 6¼ l:(7)
Observe that@2
@u2ℙðgi ¼ klju;pÞ ¼ 2
@
@uℙðgi ¼ klju;pÞ: From
this we easily get that
IðuÞ ¼XIi¼1
RiðRi þ 1Þ (8)
where we have set
Ri ¼
XgℙðdijgÞ
@
@uℙðgju;pÞX
gℙðdijgÞℙðgju;pÞ
: (9)
An approximate ð12aÞ confidence interval is now given by
u6 z12a=2 IðuÞ21=2:
Estimating rates of PMD
As mentioned earlier, the method above assumes that rates ofPMD are known a priori. In cases in which they are notknown, they can be readily inferred from genome-wide dataas we outline in this section.
Following Jónsson et al. (2013), we present an approachto estimate PMD rates directly from genome-wide counts ofC/T and G/A transitions as a function of distance withinthe read. For this, we first build the three-dimensional tableT , where each entry T rsp corresponds to the number ofobserved bases, s, read at a site with reference base, r, atposition p within a read. While these counts depend on thedivergence between the sequenced individual and the refer-ence genome used for mapping, we develop here an ap-proach that takes this divergence into account.
Let us denote by mrs the probability of a true differencebetween the sequenced individual and the reference, suchthat the reference has base r and the sequenced individualbase s. Since the reference and a sequenced chromosomeform a genealogy on which these mutations occurred, it is
safe to assume that mrs ¼ msr:Wewill further assume that theobserved counts in a cell T rsp not affected by PMD are a directfunction of mrs:
Since the rate of PMD is generally low far away from theread ends, position-specific estimates may become noisy forthese positions, particularly if data are limited. We thus in-troduce a method to estimate parameters of a model ofexponential decay with the position in the read. The use ofsuch a model was first introduced by Skoglund et al. (2014),and we implement here a slightly more general version oftheir function. Specifically, we assume that the probabilityof observing base T when the reference sequence is a C atposition p is given by
ℙ dij ¼ T��gi ¼ C; p
� �¼ mCT þ ð12mCTÞðaþ be2cpÞ;
where mCT again denotes true differences between the indi-vidual and the reference.
Note that some of the parameters of this model are non-identifiable. In the Appendix, we show how to obtain MLestimates of the parameters of the probability function
ℙ dij ¼ T��gi ¼ C; p
� �¼ aþ de2gp: (10)
using the standard Newton-Raphson algorithm.To then obtain estimates for the original parameters
mCT ; a; b, and c, we assume that mCT ¼ mTC; and obtain aML estimate
mCT ¼ mTC ¼
XpT TCpX
pT TTp
:
Then, a ¼ d
12 mCT; b ¼ g, and c ¼ a2mCT
12mCT: We use the
analogous logic to infer PMD patterns for G/A damages,but measuring positions from the opposite end of the read.
Estimating base-specific error rates (recalibration)
The challenge of inferring genetic diversity from next-generation sequencing data lies in the fact that the perbase error rates are orders of magnitude higher than theexpected heterozygosity of many species (Lynch 2008).While this issue can easily be overcome with high cover-ages, accurate inference from low-coverage data relies onan exact knowledge of base-specific error rates. Crudeestimates of these rates are usually directly provided bythe sequencing machines themselves. However, these es-timates are often inaccurate, and are recommend to berecalibrated for genotype calling (DePristo et al. 2011).
The most commonly used approach for recalibration isBQSR (Base Quality Score Recalibration) implemented inGATK (McKenna et al. 2010; De-Pristo et al. 2011). This ap-proach infers new quality scores by binning the data intogroups based on covariates such as the raw quality score,the position in the read, or the sequence context. All baseswithin such a bin are assumed to share the same error rate,
Heterozygosity of Ancient Genomes 321

which can be readily inferred if the true underlying sequenceis known. As an alternative, Cabanski et al. (2012) proposedto fit a logistic regression to the full data where the responsevariable is the probability of a sequencing error and the ex-planatory variables are the raw quality scores, and covariatessuch as position in the read, or base context.
For our purpose, these methods suffer from two short-comings: first, they cannot be applied to ancient DNA sincethey do not take PMD into account. Second, both require areference sequence as well as knowledge of polymorphicpositions, such that they can be excluded from the analysis.While we have shown how to extend the BQSR method toancient DNA (Hofmanová et al. 2016), we develop here anapproach that also integrates over the unknown referencesequence.
Todo so,wewill assume the existence a genomic region forwhich the individual does not show any polymorphism. Agood example of such a genomic region are nonhomologoussequences from sex chromosomes in heterogametic individ-uals, and we will describe our approach with this type of datain mind. However, we note that our approach can also bereadily applied to diploid regions that are known to be mono-morphic, such as positions that are highly conserved amongspecies or positions retained after filtering out those withhigh minor allele counts (Cabanski et al. 2012).
Model
As above, let us denote the hidden (haploid) genotype at site iby gi;where gi is one of the nucleotides A;G;C;T: At each sitei, there are ni reads, and we denote by dij; j ¼ 1; . . . ; ni, thebase of read j covering site i. A sequencing error occurs withprobability eij: These probabilities shall now be given by amodel
eij ¼ e�qij;b
; (11)
where qij ¼ ðqij1; . . . ; qijLÞ is a given external vector of infor-mation, andb ¼ ðb0; . . . ;bLÞ are the parameters of themodelthat have to be estimated. While our approach is flexible
regarding the choice of included covariates, we will hereconsider the raw quality score, the position within the read,the squares of these to account for a nonlinear relationships,and all two-base contexts consisting of the bases of the readat positions i2 1 and i.
Following Cabanski et al. (2012), we impose the logit model
eij
�qij;b
¼
exphhijðbÞ
i1þ exp
hhijðbÞ
i (12)
with
hikðbÞ ¼ b0 þXLl¼1
qijlbl:
In the case of monomorphic or haploid sites only, the prob-ability of the read vector di given the hidden state gi can bewritten more generally as
ℙðdijgi;bÞ ¼Yni
j¼1
ð12DijÞ 12 eij� �
þ Dijeij
3
�; (13)
Here, the dependence on the parameters b is given by (12),
Dij ¼ D�dij; qij; gi
�¼
0 if gi ¼ dij ¼ A or TDC/T
�qij�
if gi ¼ C; dij ¼ C12DC/T
�qij�
if gi ¼ C; dij ¼ T12DG/A
�qij�
if gi ¼ G; dij ¼ ADG/A
�qij�
if gi ¼ G; dij ¼ G1 otherwise
;
8>>>>>>><>>>>>>>:
and DC/TðqijÞ and DG/AðqijÞ refer to the known probabilitythat a C/T or G/A PMD occurred at the position coveringsite i in read j.
Again, thismodel can be estimated using the EMalgorithmwith theNewton-Raphsonalgorithm in theM-step.Details aregiven in the Appendix.
Figure 1 Power to infer u from low coverage data. Results from sets of 100 simulations with PMD for different average coverage, window size, and trueu values. (A) Estimated u in windows of 1 Mbp as a function of average coverage. (B) Estimated u as a function of window size and fixed averagecoverage of 13 : (C) Accuracy of estimating u ¼ 1023 quantified as the median relative error (j12 u=uj) over replicates indicated by contour lines as afunction of both coverage and window size. (D) True vs. estimated u for different average coverages (see color legend). Polygons indicate the 95%quantile of estimated u values among all replicates. The diagonal black line indicates the expectation for perfect estimation. In (A, B, and D), replicatesresulting in a u, 1025 are not shown, but their fraction across replicates are printed below the horizontal black line.
322 A. Kousathanas et al.

Implementation
All approachesmentionedwere implemented in a custom C++program available at our laboratory website (http://www.unifr.ch/biology/research/wegmann/wegmannsoft). We used func-tions included in the library BamTools for manipulating bamfiles (Barnett et al. 2011).
Data availability
The authors state that all data necessary for confirming theconclusions presented in the article are represented fullywithin the article.
Simulations
Generating simulations
In this section, we illustrate the power and accuracy of ourinference approacheswith simulations. Thesewere generatedusing a custom-made R script that implements the followingsteps:
1. The first chromosome of length L was simulated using ran-dom bases with frequencies p ¼ f0:25; 0:25; 0:25; 0:25g:
2. The second, homologous chromosome was simulatedaccording to the Felsenstein (1981) substitution model(Equation 1) with p and a chosen u value.
3. Sequencing reads of 100 bases were then generated bycopying from one of the two chromosomes with equalprobability, and by choosing a starting position uniformlybetween positions 1 and L2 99 until the desired averagecoverage was reached. All reads copied from the secondchromosome were considered to map to the reversestrand.
4. PMD was simulated on all reads with probabilities follow-ing an exponential decay with increasing position in theread as proposed by Skoglund et al. (2014) to match re-alistic patterns. Specifically, we simulate PMD at position pwithin the read with probability
D ¼ ð12lÞp21 pþ C;
where l ¼ 0:3 and C ¼ 0:01 for both C/T and G/Abut with p counted from the 39 and 59 ends, respectively.
5. For each simulated base, a phred-scaled quality score wassimulated and sequencing errors were then added withprobabilities given by these scores. If not stated otherwise,quality scores were simulated from a normal distributionwith mean mQ ¼ 20 and SD sQ ¼ 4:5; truncated at zero.When testing our recalibration approach, however, thequality scores were simulated from a uniform distributionU½5; 60�, and then transformed according to Equation12 with coefficients b to obtain the true error rate, withwhich sequencing errors were simulated.
6. The simulated data were finally used to generate a refer-ence FASTA file containing the first chromosome and aSAM file containing the reads. The latter was then trans-formed into a BAM file using SAMtools (Li et al. 2009).
Power to infer u
To check the power of our approach to infer u from lowcoverage data, we first simulated data within a 1 Mbp win-dow with a true u ¼ 1023 for various coverages. The specificvalue of u ¼ 1023 was chosen to reflect the median hetero-zygosity in a modern, non-African human individual.
We found themedian of our u estimates across replicates tobe very close to the true value, but the variance to be a func-tion of coverage. At low coverage (, 13 ), u was ofteninferred to be zero. This is not surprising, as the informationabout genetic diversity can come only from sites covered atleast twice, which is rare at average coverages , 13: Thesimulations that did result in an estimate above zero werethus enriched for cases with slightly above average number ofpolymorphic sites among those covered twice. As soon asaverage coverage exceeded 1:53 ; however, our approachestimated u at 1023 very accurately (Figure 1A).
We next performed simulations with a fixed coverage of13 ; but varying the window size (Figure 1). Interestingly, wefound that an increase in window size has a positive effect onthe estimate accuracy, similarly to an increase in coverage,suggesting that larger windows help to increase accuracy ifcoverage is very low. To illustrate this effect, we performedsimulations at various window sizes and coverages, andrecorded the relative estimation error for a series of repli-cates. As expected, we found the median relative estimationerror to be a direct function of the product of window size andcoverage (Figure 1C), thus suggesting our method will per-form well also at average coverages below 13 if the windowsize is large enough.
Using the same setting,we also checked the accuracy of theapproximate confidence intervals obtained using the Fisherinformation. For this we inferred u from 1000 windows of1 Mbp simulatedwith u at 1023 for a coverage of 1.0 and 0.2.
Figure 2 Effect of sequencing quality on power to estimate u. Resultsfrom sets of 100 simulations to assess the power to estimate u of 1024
and 1023 for (A) and (B), respectively, for different average base qualitiesdistributed normally with mean 20, 40, or 60, and a SD of 4.5, buttruncated at 0. Polygon shapes indicate the 95% confidence intervalfor estimated u over all replicates, excluding those resulting in u,1025
(the fraction excluded are printed below the horizontal black line). Allsimulations were conducted with PMD, and the true PMD probabilityfunctions were used during the estimation.
Heterozygosity of Ancient Genomes 323

We found the true value to be included in the 95% confidenceinterval in 93.6 and 98.6%, respectively, suggesting theseconfidence intervals to be a very accurate reflection of esti-mation uncertainty.
Using a third set of simulations, we found that, at equalcoverage and window size, higher u values are estimatedmore accurately than lower values (Figure 1D). This isexpected since, in the case of low u, only few heterozygoussites are present in a given window, rendering the estimatemore dependent on the detection of individual sites. None-theless, we found our approach to infer u. 1024 very accu-rately in a window of 1 Mbp if the average coverage exceeds33.
All results above were generated assuming base-specificquality scores to be normally distributedwithmQ ¼ 20 and SDsQ ¼ 4:5; which is lower than the quality expected with cur-rent sequencing approaches (e.g., Utturkar et al. 2015). Se-quences generated with higher quality will positively affectestimation accuracy. Indeed we found that simulating datawith mQ ¼ 40 or mQ ¼ 60 resulted in much lower estimationerror, effectively rendering the estimation of u feasible evenat very low average coverage (Figure 2). For instance, wefound that, at an average coverage of 0:83; more than 90%of windows with u ¼ 1024 and mQ ¼ 60 were estimatedwithin less than half an order of magnitude from the truevalue. At mQ ¼ 20; this accuracy was only reached with anaverage coverage of 3:23:
Comparison to an existing method
While there is currently no implemented method available toinfer heterozygosity in a window or region from a singleindividual, our method is very similar to those inferring theSFS from multiple individuals (e.g., Nielsen et al. 2012;Korneliussen 2014). Indeed, inferring the SFS from a singleindividual gives a direct estimate of heterozygosity, H, whichis related to u by
E½H� ¼Xg9
ℙ�gi ¼ g9
��u;p: (14)
The most commonly used approach to infer the SFS whileintegrating over genotype uncertainty at individual sites(Nielsen et al. 2012) is implemented in the software packageANGSD (Korneliussen 2014). This implementation assumesthat the two potential alleles are known a priori for each site,and hence have to be inferred first using the major-minoroption implemented in ANGSD. While the method imple-mented in ANGSD can be extended to address this limitation,we used our simulation framework to assess its effect on theinference of heterozygosity from low coverage data. In orderto make estimates comparable, we report those of ANGSD interms of u calculated according to Equation 14 from the frac-tion of sites reported to be heterozygous in the SFS.
As shown in Figure 3A, ANGSD inferred u very accurately ifthe reference allele was provided for each site, and only thesecond allele needed to be inferred. Making explicit use ofthis additional information, the estimates were more accu-rate than those obtained with our approach, which does notmake any assumption about the alleles present. However,when no information was given about the observable al-leles, and both had to be inferred using the major-minoroption of ANGSD prior to the inference of heterozygosity,u was grossly underestimated whenever coverage was be-low 103. While we note that ANGSD is designed for appli-cations involving multiple samples, in which case inferringthe two observable alleles accurately is much easier; thisresult illustrates the importance of taking the full genotypeuncertainty into account when inferring diversity from lowcoverage data.
Again using simulations, we next studied the impact ofPMD on the inference of heterozygosity (Figure 3B). Unsur-prisingly, the diversity estimated using the method imple-mented in ANGSD that does not take PMD into accountwas more than one order of magnitude too large. In contrast,our method properly accounts for PMD if its pattern is wellcharacterized. While ANGSD can readily be extended to ac-count for PMD, these results highlight the importance of ac-counting for PMD for any population genetic inference orcomparison involving ancient DNA.
Figure 3 Performance comparison withANGSD. Results from sets of 100 simula-tions with (A) or without (B) PMD, com-paring the performance of the methodpresented in this study and ANGSD in in-ferring u. ANGSD was run either with thereference sequence provided (ANGSD_wREF)or without (ANGSD_noREF), in which casethe major and minor alleles were firstinferred in an additional step. For all sim-ulations, we further assumed that basequalities were distributed normally, withmQ ¼ 20 and sQ ¼ 4:5; but truncated at0. Polygon shapes indicate the 95% con-fidence interval for estimated u; but ex-cluding replicates resulting in u,1025:
The fraction of replicates excluded areprinted below the horizontal black line. When applying our method in simulations conducted with PMD, we provided the true PMD probability patternsduring the estimation.
324 A. Kousathanas et al.
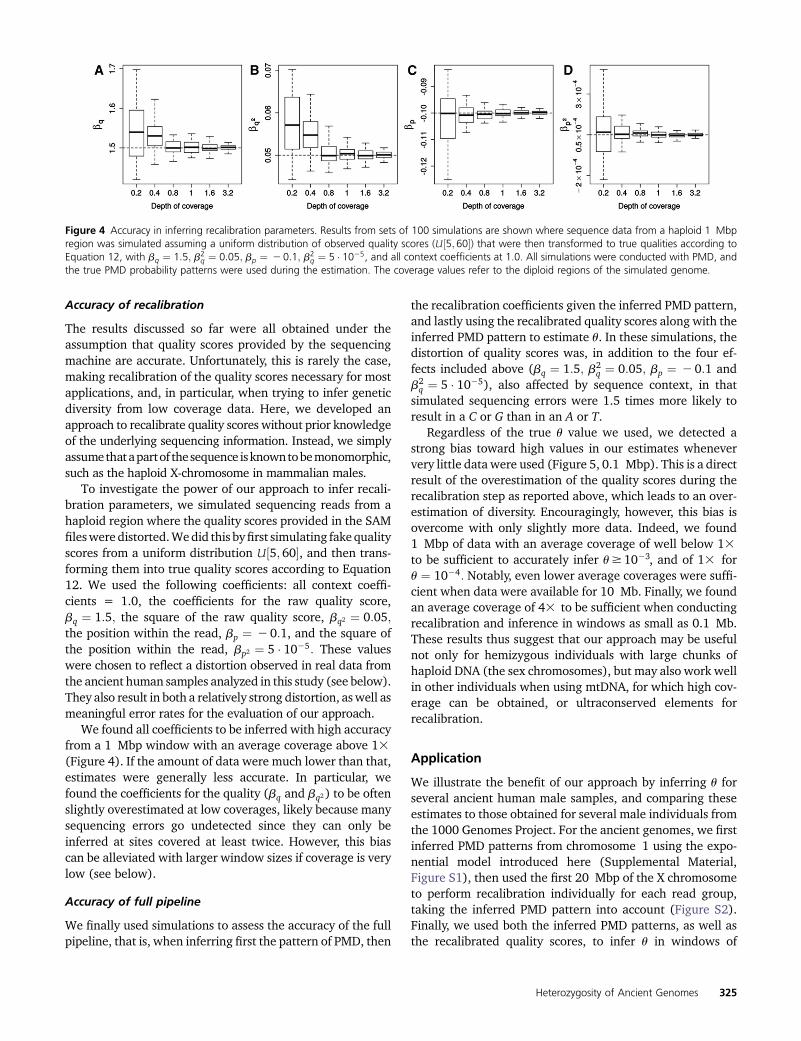
Accuracy of recalibration
The results discussed so far were all obtained under theassumption that quality scores provided by the sequencingmachine are accurate. Unfortunately, this is rarely the case,making recalibration of the quality scores necessary for mostapplications, and, in particular, when trying to infer geneticdiversity from low coverage data. Here, we developed anapproach to recalibrate quality scores without prior knowledgeof the underlying sequencing information. Instead, we simplyassumethatapartof thesequence isknowntobemonomorphic,such as the haploid X-chromosome in mammalian males.
To investigate the power of our approach to infer recali-bration parameters, we simulated sequencing reads from ahaploid region where the quality scores provided in the SAMfileswere distorted.Wedid this byfirst simulating fake qualityscores from a uniform distribution U½5; 60�, and then trans-forming them into true quality scores according to Equation12. We used the following coefficients: all context coeffi-cients = 1.0, the coefficients for the raw quality score,bq ¼ 1:5; the square of the raw quality score, bq2 ¼ 0:05;the position within the read, bp ¼ 2 0:1, and the square ofthe position within the read, bp2 ¼ 5 � 1025: These valueswere chosen to reflect a distortion observed in real data fromthe ancient human samples analyzed in this study (see below).They also result in both a relatively strong distortion, aswell asmeaningful error rates for the evaluation of our approach.
We found all coefficients to be inferred with high accuracyfrom a 1 Mbp window with an average coverage above 13(Figure 4). If the amount of data were much lower than that,estimates were generally less accurate. In particular, wefound the coefficients for the quality (bq and bq2 ) to be oftenslightly overestimated at low coverages, likely because manysequencing errors go undetected since they can only beinferred at sites covered at least twice. However, this biascan be alleviated with larger window sizes if coverage is verylow (see below).
Accuracy of full pipeline
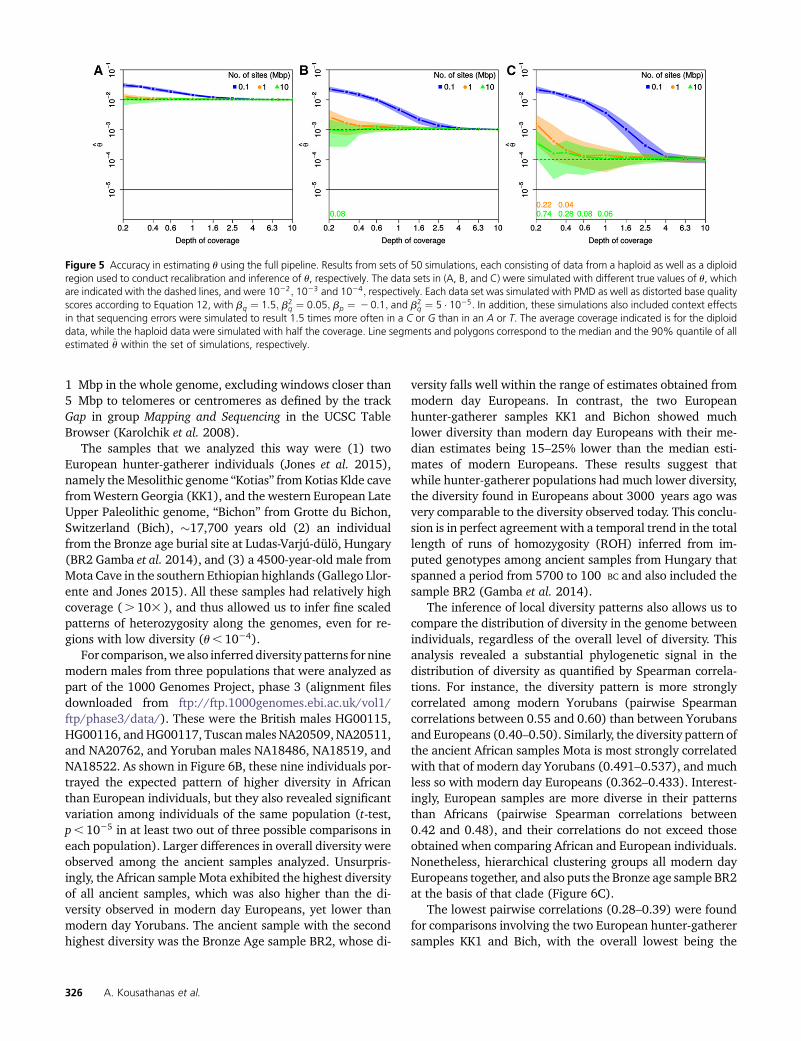
We finally used simulations to assess the accuracy of the fullpipeline, that is, when inferring first the pattern of PMD, then
the recalibration coefficients given the inferred PMD pattern,and lastly using the recalibrated quality scores along with theinferred PMD pattern to estimate u. In these simulations, thedistortion of quality scores was, in addition to the four ef-fects included above (bq ¼ 1:5; b2
q ¼ 0:05; bp ¼ 2 0:1 andb2q ¼ 5 � 1025), also affected by sequence context, in that
simulated sequencing errors were 1.5 times more likely toresult in a C or G than in an A or T.
Regardless of the true u value we used, we detected astrong bias toward high values in our estimates wheneververy little data were used (Figure 5, 0.1 Mbp). This is a directresult of the overestimation of the quality scores during therecalibration step as reported above, which leads to an over-estimation of diversity. Encouragingly, however, this bias isovercome with only slightly more data. Indeed, we found1 Mbp of data with an average coverage of well below 13to be sufficient to accurately infer u$1023, and of 13 foru ¼ 1024: Notably, even lower average coverages were suffi-cient when data were available for 10 Mb. Finally, we foundan average coverage of 43 to be sufficient when conductingrecalibration and inference in windows as small as 0.1 Mb.These results thus suggest that our approach may be usefulnot only for hemizygous individuals with large chunks ofhaploid DNA (the sex chromosomes), but may also work wellin other individuals when using mtDNA, for which high cov-erage can be obtained, or ultraconserved elements forrecalibration.
Application
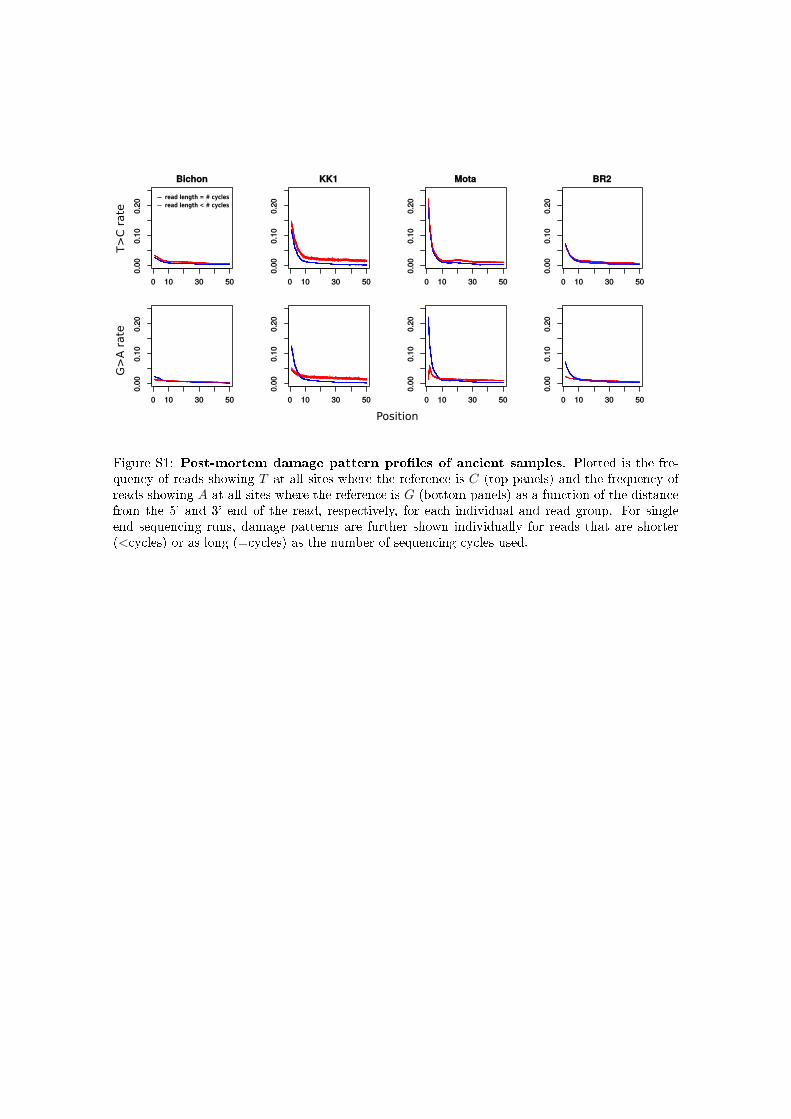
We illustrate the benefit of our approach by inferring u forseveral ancient human male samples, and comparing theseestimates to those obtained for several male individuals fromthe 1000 Genomes Project. For the ancient genomes, we firstinferred PMD patterns from chromosome 1 using the expo-nential model introduced here (Supplemental Material,Figure S1), then used the first 20 Mbp of the X chromosometo perform recalibration individually for each read group,taking the inferred PMD pattern into account (Figure S2).Finally, we used both the inferred PMD patterns, as well asthe recalibrated quality scores, to infer u in windows of
Figure 4 Accuracy in inferring recalibration parameters. Results from sets of 100 simulations are shown where sequence data from a haploid 1 Mbpregion was simulated assuming a uniform distribution of observed quality scores (U½5;60�) that were then transformed to true qualities according toEquation 12, with bq ¼ 1:5; b2
q ¼ 0:05; bp ¼ 2 0:1; b2q ¼ 5 � 1025, and all context coefficients at 1.0. All simulations were conducted with PMD, and
the true PMD probability patterns were used during the estimation. The coverage values refer to the diploid regions of the simulated genome.
Heterozygosity of Ancient Genomes 325
1 Mbp in the whole genome, excluding windows closer than5 Mbp to telomeres or centromeres as defined by the trackGap in group Mapping and Sequencing in the UCSC TableBrowser (Karolchik et al. 2008).
The samples that we analyzed this way were (1) twoEuropean hunter-gatherer individuals (Jones et al. 2015),namely theMesolithic genome “Kotias” from Kotias Klde cavefromWestern Georgia (KK1), and the western European LateUpper Paleolithic genome, “Bichon” from Grotte du Bichon,Switzerland (Bich), �17,700 years old (2) an individualfrom the Bronze age burial site at Ludas-Varjú-dülö, Hungary(BR2 Gamba et al. 2014), and (3) a 4500-year-old male fromMota Cave in the southern Ethiopian highlands (Gallego Llor-ente and Jones 2015). All these samples had relatively highcoverage (. 103 ), and thus allowed us to infer fine scaledpatterns of heterozygosity along the genomes, even for re-gions with low diversity (u, 1024).
For comparison,wealso inferreddiversity patterns for ninemodern males from three populations that were analyzed aspart of the 1000 Genomes Project, phase 3 (alignment filesdownloaded from ftp://ftp.1000genomes.ebi.ac.uk/vol1/ftp/phase3/data/). These were the British males HG00115,HG00116, andHG00117, Tuscanmales NA20509, NA20511,and NA20762, and Yoruban males NA18486, NA18519, andNA18522. As shown in Figure 6B, these nine individuals por-trayed the expected pattern of higher diversity in Africanthan European individuals, but they also revealed significantvariation among individuals of the same population (t-test,p, 1025 in at least two out of three possible comparisons ineach population). Larger differences in overall diversity wereobserved among the ancient samples analyzed. Unsurpris-ingly, the African sample Mota exhibited the highest diversityof all ancient samples, which was also higher than the di-versity observed in modern day Europeans, yet lower thanmodern day Yorubans. The ancient sample with the secondhighest diversity was the Bronze Age sample BR2, whose di-
versity falls well within the range of estimates obtained frommodern day Europeans. In contrast, the two Europeanhunter-gatherer samples KK1 and Bichon showed muchlower diversity than modern day Europeans with their me-dian estimates being 15–25% lower than the median esti-mates of modern Europeans. These results suggest thatwhile hunter-gatherer populations had much lower diversity,the diversity found in Europeans about 3000 years ago wasvery comparable to the diversity observed today. This conclu-sion is in perfect agreement with a temporal trend in the totallength of runs of homozygosity (ROH) inferred from im-puted genotypes among ancient samples from Hungary thatspanned a period from 5700 to 100 BC and also included thesample BR2 (Gamba et al. 2014).
The inference of local diversity patterns also allows us tocompare the distribution of diversity in the genome betweenindividuals, regardless of the overall level of diversity. Thisanalysis revealed a substantial phylogenetic signal in thedistribution of diversity as quantified by Spearman correla-tions. For instance, the diversity pattern is more stronglycorrelated among modern Yorubans (pairwise Spearmancorrelations between 0.55 and 0.60) than between Yorubansand Europeans (0.40–0.50). Similarly, the diversity pattern ofthe ancient African samples Mota is most strongly correlatedwith that of modern day Yorubans (0.491–0.537), and muchless so with modern day Europeans (0.362–0.433). Interest-ingly, European samples are more diverse in their patternsthan Africans (pairwise Spearman correlations between0.42 and 0.48), and their correlations do not exceed thoseobtained when comparing African and European individuals.Nonetheless, hierarchical clustering groups all modern dayEuropeans together, and also puts the Bronze age sample BR2at the basis of that clade (Figure 6C).
The lowest pairwise correlations (0.28–0.39) were foundfor comparisons involving the two European hunter-gatherersamples KK1 and Bich, with the overall lowest being the
Figure 5 Accuracy in estimating u using the full pipeline. Results from sets of 50 simulations, each consisting of data from a haploid as well as a diploidregion used to conduct recalibration and inference of u, respectively. The data sets in (A, B, and C) were simulated with different true values of u, whichare indicated with the dashed lines, and were 1022; 1023 and 1024; respectively. Each data set was simulated with PMD as well as distorted base qualityscores according to Equation 12, with bq ¼ 1:5; b2
q ¼ 0:05; bp ¼ 20:1; and b2q ¼ 5 � 1025: In addition, these simulations also included context effects
in that sequencing errors were simulated to result 1.5 times more often in a C or G than in an A or T. The average coverage indicated is for the diploiddata, while the haploid data were simulated with half the coverage. Line segments and polygons correspond to the median and the 90% quantile of allestimated u within the set of simulations, respectively.
326 A. Kousathanas et al.

correlation between these samples (0.28). This is also illus-trated visually when plotting our estimates of the first75 Mbp of chromosome 1, where we found relatively highconcordance in local diversity among the two European sam-ples, but vastly different patterns among the hunter-gatherersamples (Figure 6C). These results suggest that, despite verycomparable overall levels of diversity, the distribution of di-versity along the genome was very diverse among Europeanhunter-gatherer populations, and very different from the oneobserved among modern day individuals. Multiple observa-tions support such a conclusion: first, the two samples ana-lyzed here represent two vastly different geographic regions,with one being a sample from Switzerland, and the otherfrom Georgia, and were previously reported to belong totwo different clades that split 45,000 years ago, as inferredfrom genotyping data (Jones et al. 2015). Second, the ances-try of modern Europeans traces only partly back to Euro-pean hunter-gatherers, with early Neolithic people from theAegean (Hofmanová et al. 2016) and Yamnaya steppe herders(Haak et al. 2015) contributing themajority of themodern-daygenetic makeup. Finally, the two European hunter-gatherersamples both exhibit many, but unique, regions of very lowdiversity (u, 1024 in 4% of all windows, cf. 0.00–0.03% in allmodern Europeans), which do not have particularly low cov-erage. They are likely the result of small population sizes withsome level of consanguinity in the population (Pembertonet al. 2012).
Discussion
Quantifying genetic diversity and comparing it between dif-ferent individuals and populations is fundamental to under-standing theevolutionaryprocesses shapinggenetic variation.Unfortunately, the inference of heterozygosity is confounded
byboth sequencing errors, resulting in falsediversity aswell asthe statistical power to identify heterozygous sites, particu-larly when coverage is low. Several methods have beendeveloped to learn about heterozygosity probabilistically, thatis,without theneed tofirst call genotypes.A rather recent suchapproach (Bryc et al. 2013) proposes to leverage data fromexternal reference individuals to obtain an unbiased estimateof the probability that a specific sites is heterozygous. Theexpected heterozygosity is then estimated from these site-specific estimates. Since this approach requires per site esti-mates to be accurate, only sites with a coverage of 53 orhigher can be included in the analysis, which severely limitsthe scope of the application.
An alternative is to infer heterozygosity probabilisticallyfrom a collection of sites. Among the earliest such methodswas a likelihood-based estimator (Lynch 2008), which infersheterozygosity of an individual jointly with the rate sequenc-ing errors. We presented a natural extension of this approachthat relaxes the infinite sites assumption and integrates PMD,a particular feature of ancient DNA that is not captured bybase quality scores provided by sequencing machines. Weachieved this by extending Felsenstein’s model of substitutions(Felsenstein 1981) with an explicit model of next-generationsequencing data that incorporates both sequencing errors aswell as errors arising from PMD. We have previously used thesame PMD error model for variant calling from ancient sam-ples (Hofmanová et al. 2016), and we note that it may be usedto extend any other inference method based on genotype like-lihood to ancient DNA.
Following other recently developed approaches to infergenetic diversity from next-generation sequencing data (e.g.,Nielsen et al. 2012; Korneliussen 2014; Maruki and Lynch2015), our method also relaxes the assumption of constanterror across all reads by benefiting from the base-specific
Figure 6 Local diversity in ancient and modern humans. (A) Heterozygosity (u) inferred in 1 Mb windows along the first 75 Mbp of chromosome 1(excluding windows closer than 5 Mbp of the telomere) for two modern Europeans (TSI2 and GBR2), and two ancient European hunter-gatherers (KK1and Bich). Solid lines indicate the MLE estimate, shading indicates the 95% confidence intervals and dashed lines the genome-wide median for eachsample. (B) Distribution of estimates u in 1 Mbp windows across the first 22 chromosomes of each sample. (C) Similarity in the pattern of u along thegenome visualized by hierarchical clustering using 1 2 Spearman correlation as distance.
Heterozygosity of Ancient Genomes 327

quality information provided by current sequencing technol-ogies. Yet since these provided quality scores are often dis-torted, we also introduced here a method to recalibrate thequality scores for low coverage genomes. In contrast to com-monly used methods for recalibration (e.g., McKenna et al.2010; DePristo et al. 2011; Cabanski et al. 2012), our ap-proach does not require information about the underlyingsequence context. It only assumes sites to be monomorphicwhile integrating over the uncertainty of the sequenceitself. Examples of regions known to be monomorphicare the sex chromosomes in hemizygous individuals. But,since we found that our method recalibrates quality scoreswith high accuracy and reliably, even based on DNAstretches as short as 1 Mbp, we are confident that it willwork even on ultraconserved elements or plasmid DNA.Finally, we note that if multiple individuals are sequencedtogether, they are likely affected by the same distortionof quality scores, and can hence be recalibrated with pa-rameters inferred from a subset of them (e.g., the malesamples).
As an illustration, we applied the methods developed hereto modern and ancient human samples of various coverage.While our approach to infer heterozygosity incorporates thepossibility of PMD, it assumes that the probability of a PMDevent occurring is known.We thus also introduce amethod toinfer these probability functions from raw data, which isrobust to divergence between the sample and the referencegenome. By inferring PMD patterns for each sample, then therecalibration parameters, and,finally, local diversity in 1 Mbpwindows, we found that both ancient and modern Africansamples exhibited much larger diversity than European indi-viduals. In addition, the diversity inferred from two ancientEuropean hunter-gatherer samples wasmuch lower than thatof modern samples, which is likely explained by smaller pop-ulation sizes. Besides overall differences in diversity, also thepattern of diversity along the genome revealed a strong geo-graphic clustering among modern and ancient samples. Theexceptions were the two European hunter-gatherers thatshowed patterns very different from both modern samples,as well as from one another, further corroborating the view(Jones et al. 2015) that these samples represent different andancient clades that contributed onlymarginally to the geneticmake-up of modern day Europeans.
Acknowledgments
We are grateful to two anonymous reviewers for their veryconstructive comments on an earlier version of this work.This study was supported by Swiss National Foundationgrant number 31003A_149920 to D.W.
Literature Cited
Barnett, D. W., E. K. Garrison, A. R. Quinlan, M. P. Strömberg, andG. T. Marth, 2011 Bamtools: a C++ API and toolkit for ana-lyzing and managing BAM files. Bioinformatics 27: 1691–1692.
Briggs, A., and U. Stenzel, 2007 Patterns of damage in genomicDNA sequences from a Neandertal. Proc. Natl. Acad. Sci. USA104: 14616–14621.
Bryc, K., N. Patterson, and D. Reich, 2013 A novel approach toestimating heterozygosity from low-coverage genome sequence.Genetics 195: 553–561.
Cabanski, C. R., K. Cavin, C. Bizon, M. D. Wilkerson, J. S. Parkeret al., 2012 ReQON: a bioconductor package for recalibratingquality scores from next-generation sequencing data. BMC Bio-informatics 13: 221.
Dempster, A. A., N. N. Laird, and D. D. B. Rubin, 1977 Maximumlikelihood from incomplete data via the EM algorithm. J. R. Stat.Soc. B 39: 1–38.
DePristo, M. a., E. Banks, R. Poplin, K. V. Garimella, J. R. Maguireet al., 2011 A framework for variation discovery and genotyp-ing using next-generation DNA sequencing data. Nat. Genet. 43:491–498.
Felsenstein, J., 1981 Evolutionary trees from DNA sequences: amaximum likelihood approach. J. Mol. Evol. 17: 368–376.
Gallego Llorente, M., E. R. Jones, A. Eriksson, V. Siska, K. W. Arthuret al., 2015 Ancient Ethiopian genome reveals extensive Eur-asian admixture throughout the African continent. Science 350:820–822.
Gamba, C., E. R. Jones, M. D. Teasdale, R. L. McLaughlin,G. Gonzalez-Fortes et al., 2014 Genome flux and stasisin a five millennium transect of European prehistory.Nat. Commun. 5: 5257.
Haak, W., I. Lazaridis, N. Patterson, N. Rohland, S. Mallick et al.,2015 Massive migration from the steppe was a source forIndo-European languages in Europe. Nature 522: 207–211.
Hellmann, I., Y. Mang, Z. Gu, P. Li, F. M. de la Vega et al.,2008 Population genetic analysis of shotgun assemblies of ge-nomic sequences from multiple individuals. Genome Res. 18:1020–1029.
Hofmanová, Z., S. Kreutzer, G. Hellenthal, C. Sell, Y. Diekmannet al., 2016 Early farmers from across Europe directly de-scended from Neolithic Aegeans. Proc. Natl. Acad. Sci. USA113: 6886–6891.
Jiang, R., S. Tavare, and P. Marjoram, 2008 Population geneticinference from resequencing data. Genetics 181: 187–197.
Johnson, P. L. F., and M. Slatkin, 2006 Inference of populationgenetic parameters in metagenomics: a clean look at messydata Inference of population genetic parameters in metage-nomics: a clean look at messy data. Genome Res. 16: 1320–1327.
Jones, E. R., G. Gonzalez-Fortes, S. Connell, V. Siska, A. Erikssonet al., 2015 Upper palaeolithic genomes reveal deep roots ofmodern Eurasians. Nat. Comm. 6: 1–8
Jónsson, H., A. Ginolhac, M. Schubert, P. L. F. Johnson, and L.Orlando, 2013 mapDamage2.0: fast approximate Bayesian es-timates of ancient DNA damage parameters. Bioinformatics 29:1682–1684.
Karolchik, D., R. M. Kuhn, R. Baertsch, G. P. Barber, H. Clawsonet al., 2008 The UCSC genome browser database: 2008 update.Nucleic Acids Res. 36: D773–D779.
Korneliussen, T., 2014 ANGSD: analysis of next generation se-quencing data. BMC Bioinformatics 15: 1–13.
Li, H., 2011 A statistical framework for {SNP} calling, mutationdiscovery, association mapping and population genetical pa-rameter estimation from sequencing data. Bioinformatics 27:2987–2993.
Li, H., B. Handsaker, A. Wysoker, T. Fennell, J. Ruan et al.,2009 The sequence alignment/map format and SAMtools. Bi-oinformatics 25: 2078–2079.
Lunter, G., and M. Goodson, 2011 Stampy: a statistical algorithmfor sensitive and fast mapping of Illumina sequence reads. Ge-nome Res. 21: 936–939.
328 A. Kousathanas et al.
Lynch, M., 2008 Estimation of nucleotide diversity, disequilibriumcoefficients, and mutation rates from high-coverage genome-sequencing projects. Mol. Biol. Evol. 25: 2409–2419.
Maruki, T., and M. Lynch, 2015 Genotype-frequency estimationfrom high-throughput sequencing data. Genetics 201: 473–486.
McKenna, A., M. Hanna, E. Banks, A. Sivachenko, K. Cibulskis et al.,2010 The genome analysis toolkit: a MapReduce frameworkfor analyzing next-generation DNA sequencing data. GenomeRes. 20: 1297–1303.
Nielsen, R., T. Korneliussen, A. Albrechtsen, Y. Li, and J. Wang,2012 SNP calling, genotype calling, and sample allele fre-quency estimation from new-generation sequencing data. PLoSOne 7: e37558.
Pemberton, T., D. Absher, M. Feldman, R. Myers, N. Rosenberget al., 2012 Genomic patterns of homozygosity in worldwidehuman populations. Am. J. Hum. Genet. 91: 275–292.
Skoglund, P., B. H. Northoff, M. V. Shunkov, A. P. Derevianko, S.Pääbo et al., 2014 Separating endogenous ancient DNA frommodern day contamination in a Siberian Neandertal. Proc. Natl.Acad. Sci. USA 111: 2229–2234.
Utturkar, S. M., D. M. Klingeman, J. M. Bruno-Barcena, M. S. Chinnet al., 2015 Sequence data for Clostridium autoethanogenumusing three generations of sequencing technologies. Sci. Data 2:150014.
Communicating editor: J. Novembre
Heterozygosity of Ancient Genomes 329

Appendix
Emission Probabilities in the Presence of PMD
Following Lynch (2008) and commonly used approaches (e.g., Li 2011), we assume here that a sequencing read is equallylikely to cover any of the two alleles of an individual, and that sequencing errors may result in any of the alternative bases withequal probability, eij=3: In the absence of PMD, the probability of observing a base, dij, given the underlying genotype gi ¼ kl isthen given by
ℙ dij��gi ¼ kl; eij
� �¼
12 eij if k ¼ l ¼ dijeij
3if k 6¼ dij; l 6¼ dij
122
eij
3if k 6¼ l; k ¼ dij or l ¼ dij
;
8>>>>><>>>>>:
In ancient DNA, differences between the base observed within a read and the underlying alleles may also be the result of PMD.FollowingHofmanová et al. (2016), let us denote byDC/TðqijÞ andDG/AðqijÞ, the known probability that a C/T orG/A PMDoccurred at the position covering site i in read j, respectively. In the presence of PMD, the probability of observing a base, dij,given the underlying genotype gi ¼ kl is given by
ℙðdij��gi ¼ kl; eij; qijÞ ¼
½12DG/AðqijÞ�eij3
þ DG/AðqijÞð12 eijÞ if dij ¼ A; gi ¼ GG
½1þ DG/AðqijÞ�ð12 eijÞ2
þ ½12DG/AðqijÞ�eij6
if dij ¼ A; gi ¼ AG
DG/AðqijÞð12 eijÞ2
þ ½2DG/AðqijÞ�eij6
if dij ¼ A; gi ¼ CG;GT
½12DC/TðqijÞ�ð12 eijÞ þ DC/TðqijÞeij3
if dij ¼ C; gi ¼ CC
½12DC/TðqijÞ�ð12 eijÞ2
þ ½1þ DC/TðqijÞ�eij6
if dij ¼ C; gi ¼ AC;CG;CT
½12DG/AðqijÞ�ð12 eijÞ þ DG/AðqijÞeij3
if dij ¼ G; gi ¼ GG
½12DG/AðqijÞ�ð12 eijÞ2
þ ½1þ DG/AðqijÞ�eij6
if dij ¼ G; gi ¼ AG;CG;GT
½12DC/TðqijÞ�eij3
þ DC/TðqijÞð12 eijÞ if dij ¼ T; gi ¼ TT
DC/TðqijÞð12 eijÞ2
þ ½22DC/TðqijÞ�eij6
if dij ¼ T; gi ¼ AC;CG
½1þ DC/TðqijÞ�ð12 eijÞ2
þ ½12DC/TðqijÞ�eij6
if dij ¼ T; gi ¼ CT
12 eij if dij ¼ A; gi ¼ AA or dij ¼ T; gi ¼ TT
122 eij if dij ¼ A; gi ¼ AC;AT or dij ¼ T; gi ¼ AT;GT
e
3otherwise
:
8>>>>>>>>>>>>>>>>>>>>>>>>>>>>>>>>>>>>>>>>>>>>>>>>>>><>>>>>>>>>>>>>>>>>>>>>>>>>>>>>>>>>>>>>>>>>>>>>>>>>>>:
Newton-Raphson Algorithm to Infer PMD Patterns
Under the model proposed in Equation 10, the log likelihood of the data are given by
lða; d; gÞ ¼Xp
T CTplogðmþ de2apÞ þXp
T CCplogð12m2 de2apÞ;
the gradient vector Fða; d; gÞ by
330 A. Kousathanas et al.

Fða; d; gÞ ¼
24 FaFdFg
35 ¼
Xp
T CTp
aþ de2gp
24 1
e2gp
2pde2gp
35þ
Xp
T CCp
12a2 de2gp
24 212e2gp
pde2gp
35
and the Jacobian matrix Jða; d; gÞ by
Jða; d; gÞ ¼
24 Faa Fad FagFad Fdd FdgFag Fdg Fgg
35 ¼
Xp
npðaþ de2gpÞ2
J9p þXp
Np2 npð12a2de2gpÞ2
J$p ;
where
J9p ¼
24 21 2e2gp pde2gp
2e2gp 2e22gp 2pae2gp
pde2gp 2pae2gp p2ade2gp
35
and
J$p ¼
24 21 2e2gp pde2gp
2e2gp 2e22gp pð12aÞe2gp
pde2gp pð12aÞe2gp 2p2ð12aÞde2gp
35:
The Newton-Raphson iteration for u ¼ ða; d; gÞT is given by
unew ¼ uold2 J21ðuoldÞFðuoldÞ: (15)
EM Algorithm to Infer Base-Specific Error Rates
We propose an EM algorithm for this estimation that is similar to the one above, but assume here that the base frequencies pg;
g ¼ A;G;C;T are known, i.e., can be derived accurately from counting in the region. The complete data log-likelihood of ourmodel is given by
lcðbjd; gÞ ¼XIi¼1
�logℙðdijgi;bÞ þ logpgi
�:
From this, we get the expected complete data log-likelihood
Q�b;b9
¼ E
hlcðbjd; gÞjd;b9
i¼XIi¼1
Xg
�logℙðdijg;bÞ þ logpg
�ℙ�gjdi;b9
:
For the M-step, we need only to consider the first part of Qðb;b9Þ :
Q1
�b;b9
¼XIi¼1
Xg
ℙ�gjdi;b9
logℙðdijg;bÞ;
where
ℙ�gjdi;b9
¼
ℙ�dijg;b9
�pgP
hℙ�dijh;b9
�ph
Heterozygosity of Ancient Genomes 331

by Bayes’ formula. From (13), we get more explicitly
Q1
�b;b9
¼Xi;g;j
9log 12Dij þ Bijeij ;Þ�
where we used the abbreviations Bij ¼ ½ð4=3ÞDij 2 1� and
Xi;g;j
9 . . . ¼XIi¼1
Xg
ℙ�gjdi;b9
Xni
j¼1
. . .:
In order to maximize Q1 for b; we calculate the gradient vector FðbÞ ¼ =bQ1ðb;b9Þ with components
FmðbÞ ¼@
@bnQ1
�b;b9
¼Xi;g;j
9 Bij12Dij þ Bijeij
@eij@bm
; (16)
for m ¼ 0; . . . ; L: From (12), we obtain
@eij@bm
¼ eij 12 eij� � @hij
@bm:
Observe that @hij=@b0 ¼ 1 and @hij=@bm ¼ qijm for m ¼ 1; . . . ; L:We solve FðbÞ ¼ ð0Þ with the Newton-Ralphson method with the Jacobian matrix Jmn ¼ @Fm=@bn: From (16), we get
JmnðbÞ ¼Xi;g;k
9
"Bij
12Dij þ Bijeij
@2eij@bm@bn
2B2ij�
12Dij þ Bijeij�2 @eij
@bm
@eij@bn
#
where
@2eij@bm@bn
¼ eij 12 eij� �
12 2eij� � @hij
@bm
@hij
@bn:
Putting everything together we obtain
JmnðbÞ ¼Xi;g;k
9 Bijeij 12 eij� �
12Dij þ Bijeij� �2 �
12Dij�122eij� �
2Bije2ij� @hij
@bm
@hij
@bn:
The Newton-Ralphson iteration is
bnew ¼ bold 2 J21ðboldÞFðboldÞ:
332 A. Kousathanas et al.
T>
C r
ate
G>
A r
ate
Position
read length = # cyclesread length < # cycles
Figure S1: Post-mortem damage pattern pro�les of ancient samples. Plotted is the fre-quency of reads showing T at all sites where the reference is C (top panels) and the frequency ofreads showing A at all sites where the reference is G (bottom panels) as a function of the distancefrom the 5' and 3' end of the read, respectively, for each individual and read group. For singleend sequencing runs, damage patterns are further shown individually for reads that are shorter(<cycles) or as long (=cycles) as the number of sequencing cycles used.
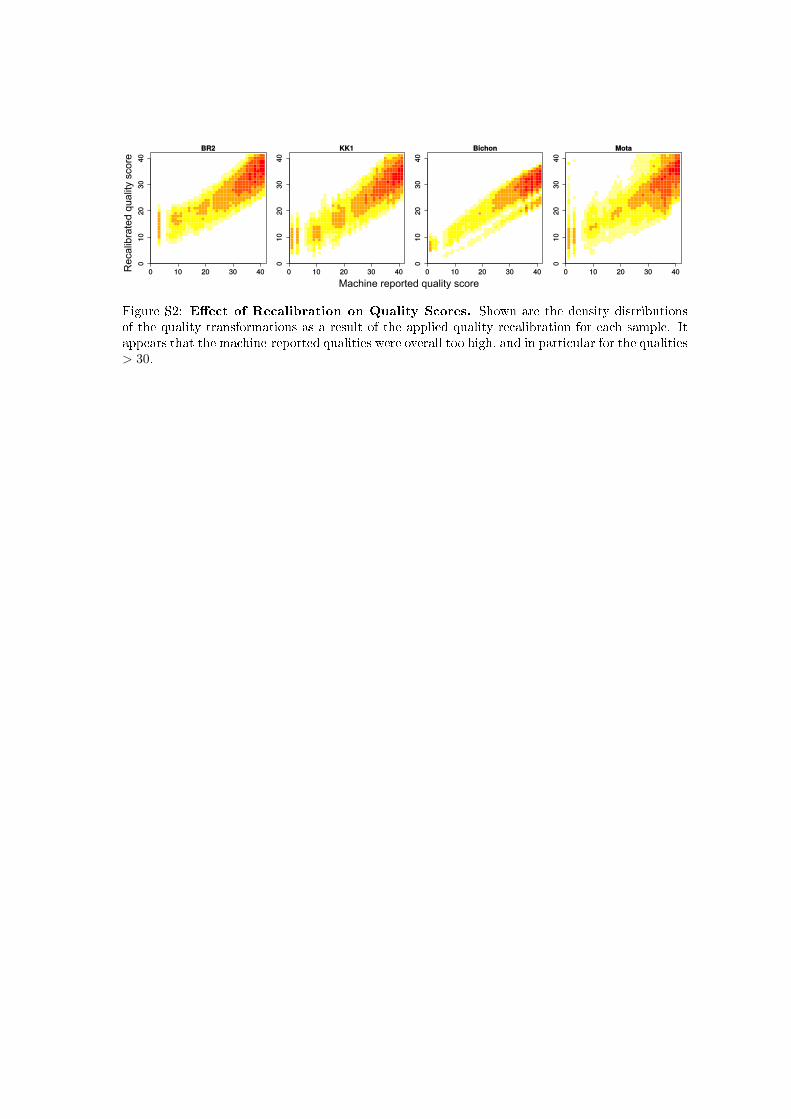
Machine reported quality score
Rec
alib
rate
d qu
alit
y sc
ore
Figure S2: E�ect of Recalibration on Quality Scores. Shown are the density distributionsof the quality transformations as a result of the applied quality recalibration for each sample. Itappears that the machine-reported qualities were overall too high, and in particular for the qualities> 30.