inference and intraday analysis of diversified world … · inference and intraday analysis of...
TRANSCRIPT

Inference and Intraday Analysis of Diversified World Stock Indices
by
Leah KELLY
Submitted to the University of Technology, Sydney
for the degree of Doctor of Philosophy.
Submitted February, 2004

Certificate
I certify that the work in this thesis has not previously been submitted for a
degree nor has it been submitted as part of the requirements for a degree except
as fully acknowledged within the text.
I also certify that the thesis has been written by me. Any help that I have
received in my research work and the preparation of the thesis itself has been
acknowledged in the thesis. In addition I certify that all information sources and
literature used are indicated in the thesis.
(Signed)~

Acknowledgements
I would like to thank my supervisor, Professor Eckhard Platen for his assistance,
guidance and support. I would also like to thank Dr David Heath, Dr Wolfgang
Breymann, Mrs Katrin Platen, Dr Mark Craddock and Shane Miller.
I would also like to acknowledge financial support from the Department of Math-
ematical Sciences and the Quantitative Finance Research Centre.
I would also like to extend my thanks to Michael Kelly, Jan Kelly and Kate
Kennedy for their constructive criticism and ongoing support. Finally, I wou!d
like to thank Justin den Hertog for his support, helpful comments and good
humour.
Chapter 3 is an extended version of a paper written with Professor Michael
S0rensen and Professor Platen. Chapter 5 is based on work undertaken with
Dr Wolfgang Breymann and Professor Eckhard Platen. The high- frequency data
used in Chapters 4, 5 and 6 was made available to me by Dr Breymann from
Olsen's Data. Daily data was made available from Thomson Financial. Long
term data was rnade available from Global Financial Data.
ii

Contents
Certificate
Acknowledgements
List of Tables
List of Figures
Abstract
1 Introduction
2 Parameter Estimation
2.1 Background and Notation
2.2 Approximate Maximum Likelihood Estimation .
2.2.1 Approximations through Simulation ...
2.2.2 Approximation using Solutions of the Kolmogorov Forward
i
ii
vi
vii
X
1
10
10
12
13
Equation . . . . . . . . . . . . . . . . . . . . . . . 14
2.2.3 Approximation using Non- parametric Techniques 15
2.2.4 Bayesian Analysis . 15
2.3 Contrast Functions .
2.4 Estimating Functions
2.4.1
2.4.2
2.4.3
Martingale Estimating Functions
Simple Estimating Functions ...
Asymptotics of Estimating Functions
iii
16
16
17
19
20
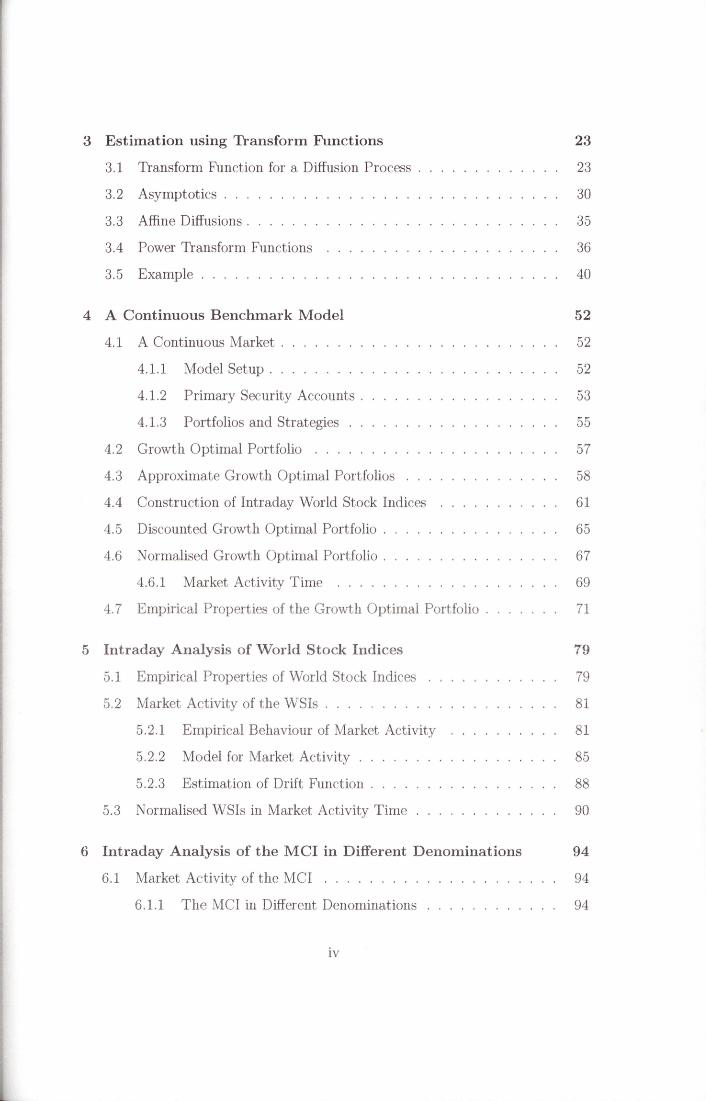
3 Estimation using Transform Functions 23
3.1 Transform Function for a Diffusion Process . 23
3.2 Asymptotics . . . 30
3.3 Affine Diffusions . 35
3.4 Power Transform Functions 36
3.5 Example ........... 40
4 A Continuous Benchmark Model 52
4.1 A Continuous Market . 52
4.1.1 Model Setup . . 52
4.1.2 Primary Security Accounts . 53
4.1.3 Portfolios and Strategies 55
4.2 Growth Optirnal Portfolio ... 57
4.3 Approximate Growth Optimal Portfolios 58
4.4 Construction of Intraday World Stock Indices 61
4.5 Discounted Growth Optimal Portfolio . 65
4.6 Normalised Growth Optimal Portfolio . 67
4.6.1 Market Activity Tilne ••• 0 • 69
4.7 Empirical Properties of the Growth Optimal Portfolio . 71
5 Intraday Analysis of World Stock Indices 79
5.1 Empirical Properties of World Stock Indices 79
5.2 Market Activity of the WSis . . . . . . . . . 81
5.2.1 Empirical Behaviour of Market Activity 81
5.2.2 Model for Market Activity . . 85
5.2.3 Estimation of Drift Function . 88
5.3 Normalised WSis in Market Activity Time 90
6 Intraday Analysis of the M CI in Different Denominations 94
6.1 Market A ·tivity of the MCI •• 0 • • 0 • 0 • 94
6.1.1 The MCI in Different Denominations 94
iv

6.1.2 Empirical Analysis of Market Activity
6 .1.3 Parametric Drift Estimation
6.1.4 Non- parametric Drift Estimation
6.2 Co- movements of Normalised WSis
6.3 Co- movements of Market Activity .
95
104
111
112
116
7 Conclusion 123
A Definitions 125
B Stock Market Indices included in the World Stock Indices 127
Bibliography 128
v
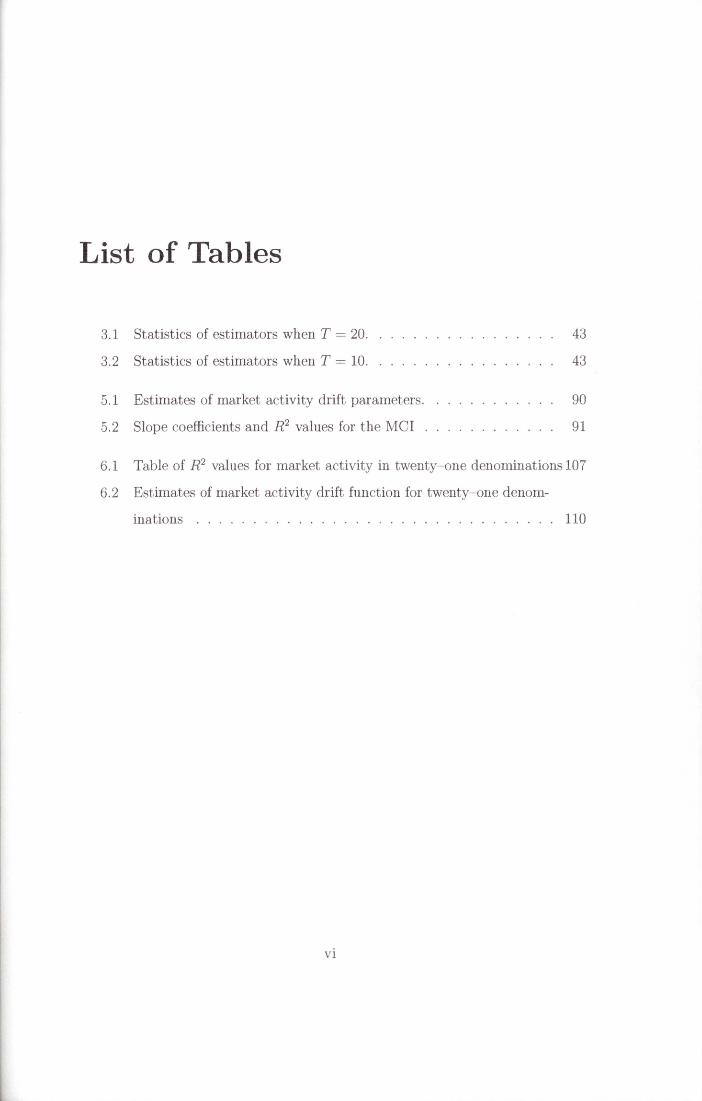
List of Tables
3.1 Statistics of estimators when T = 20.
3.2 Statistics of estimators when T = 10.
5.1 Estimates of market activity drift parameters.
5.2 Slope coefficients and R2 values for the MCI .
43
43
90
91
6.1 Table of R2 values for market activity in twenty- one denominations 107
6.2 Estimates of market activity drift function for twenty- one denom-
inations . . . . . . . . . . . . . . . . . . . . . . . . . . . . . . . . 110
vi

List of Figures
1.1 Long term dynamics of the logarithm of a discounted accumulated
world stock index. . . . . . . . . . . . . . . . . . . . . . . . . . . . 5
1. 2 Long term dynamics of a discounted normalised world stock index. 5
1.3 Long term dynamics of the volatility of the world stock index. 6
3.1 Simulated sample path of the affine diffusion 41
3.2 Estimates of the drift parameters J1 and J2 . 41
3.3 Estimates of the diffusion parameters J3 and J4 . 42
3.4 Gaussian quantile plot for J1 . 44
3.5 Gaussian quantile plot for J2 . 44
3.6 Gaussian quantile plot for J3 . 45
3.7 Gaussian quantile plot for J4 . 45
3.8 Simulated sample path of the affine diffusion when T = 1, 000. 46
3.9 Estimates of the drift parameters J1 and J2 when T = 1, 000. . 47
3.10 Estimates of the diffusion parameters J3 and J4 when T = 1, 000. 4 7
3.11 Gaussian quantile plot for J1 when T = 1, 000. 47
3.12 Gaussian quantile plot for J2 when T = 1, 000. 48
3.13 Simulated sample path of the affine diffusion when T = 1. 48
3.14 Estimates of the diffusion parameters J3 and J4 when T = 1. 50
3.15 Simulated sample path of the affine diffusion when T = 1, 000. 50
3.16 Estimates of the drift parameters J1 and J2 when T = 1, 000. . 51
4.1 Primary asset and primary security account
4.2 I\1arket capitalisation proportions
vii
53
63

4.3 World stock indices . . . . . . . . . . . . . . . . . . . . . . . . . . 64
4.4 Volatility process of the MCI for several weeks in April/May 1996. 67
4.5 Quadratic variation of t he square root of the discounted MCI . 68
4.6 Gaussian quantile plot for hourly log- returns of the MCI. 73
4. 7 Gaussian quantile plot for daily log- returns of the MCI. . 73
4.8 Gaussian quantile plot for weekly log- returns of the MCI. . 74
4.9 Sample autocorrelation function for hourly absolute returns of the
MC I. . . . . . . . . . . . . . . . . . . . . . . . . . . . . . . . . . . 75
4.10 Sample autocorrelation function for daily absolute returns of the
MCI. . . . . . . . . . . . . . . . . . . . . . . . . . . . . . . . . . . 75
5.1 Normalised world stock indices. 80
5.2 Comparison of hourly absolute returns for the normalised MCI. 81
5.3 The market activity time for the MCI. . . . . . . . . . . 82
5.4 Sample autocorrelation function of the normalised MCI. 82
5.5 Logarithm of market activity for the MCI. . . . . . . . 83
5.6 Quadratic variation of the logarith1n of market activity. 83
5. 7 Covariation of rnarket activity and normalised MCI 84
5.8 Expected market activity . . . 86
5.9 Activity volatility of the MCI 87
5.10 Quadratic variation of the logarithm of 1narket activity in activity
volatility tirne. . . . . . . . . . . . . . . . . . . . . . . . 88
5.11 Histogram and estimated probability density function. . 89
5.12 Normalised MCI in market activity time. . . . . . . . . 91
5.13 Sample autocorrelation function of the normalised MCI in market
activity time. . . . . . . . . . . . . . . . . . . .
6.1 Twenty-one currency denominations of the MCI
92
96
6.2 Covariation of the normalised MCI in twenty-one denominations . 99
6.3 Dimensions of the normalised WSI as a function of time. . 101
6.4 Market activity for twenty- one denominations of the MCI 102
viii

6.5 Quadratic variation of market activity in twenty- one denominations103
6.6 Expected market activity for twenty- one denominations . 105
6. 7 Activity volatility for twenty-one denominations . . . . .
6.8 Estimated probability density for different denominations
6.9 Non- parametric drift function estimates. . . . ..... .
6.10 Empirical covariation processes of the normalised WSis . .
106
109
113
115
6.11 Covariation coefficients for the square root of the normalised M C I. 117
6.12 Dendogram for the square root of the normalised WSis 117
6.13 Empirical covariation for logarithmic market activity. . 119
6.14 Empirical covariation for two weeks of logarithmic market activity. 120
6.15 Covariation coefficients for the logarithmic market activity. 121
6.16 Dendogram for logarithmic market activity. . . . . . . . . 122
ix

Abstract
The benchmark framework provides an alternative paradigm for financial market
modelling. Firstly, approaches to parameter estimation of discretely observed
diffusion processes are examined, with particular emphasis on estimating function
techniques. A new estimating function technique, called the transform function
method, is introduced and applied to a class of stochastic differential equations.
The advantage of the transforrn function method is that explicit information is
not required about conditional moments and the existence of stationary transition
densities. Despite the flexibility of the transform function technique, it suffers the
same drawbacks as existing estimation methods with respect to drift estimation
of financial data. The observation period required to estimate the drift function
is much greater than what is available in financial markets. Notwithstanding the
lack of available data for drift estimation, the diffusion function can be reliably
estimated by the transform function method from short periods of frequently
observed data. This thesis highlights that the benchmark approach of Platen
(2002), where only estimates for diffusion coefficients are required, resolves the
issue of drift estirnation from financial market data.
Secondly, we ~xtend the benchmark approach to incorporate modelling aspects
particular to intraday data. This requires the construction of high- frequency
diversified portfolios to approximate the growth optimal portfolio, the central
building block of the benchmark model. Three different high- frequency indices
are considered and it is demonstrated that an index with proportions based on
total world market capitalisation provides the best proxy for the growth optimal
portfolio. The benchmark model is then extended to intraday data through the
introduction of a market activity process. This process is shown to be readily
observable and as such, properties of market activity can be characterised. The
analysis includes the consideration of the high- frequency indices in US Dollars
and a further twenty currency denominations. As such, we reveal the pairwise co-
X

variation structures between the currency denominations considered. It is shown
that the intraday benchmark model, which has market activity as the main pa-
rameter of interest , provides a largely accurate intraday description of financial
markets.
xi