infant health and academic achievement in childhood · infant health and academic achievement in...
TRANSCRIPT

WP 13/24
Infant Health and Academic Achievement in Childhood
Kajal Lahiri
August 2013
york.ac.uk/res/herc/hedgwp

Infant Health and Academic Achievement in Childhood
Pinka Chatterji, Dohyung Kim, and Kajal Lahiri∗
May 30, 2013
Abstract
Research has shown that birth weight has a lasting impact on adult outcomes such
as education and earnings. This paper examines the role of nutritional intake in utero
on academic achievement in childhood, which may provide a link between birth weight
and adult outcomes, and further investigates its implication on the black-white test
score gap. Using the same PSID-CDS data source as was used in Johnson and Schoeni
(2011), we build on the literature by employing the fetal growth rate as a proxy for fetal
nutrition and proposing a nested error component two-stage least squares (NEC2SLS)
estimator that uses internal instruments in a way analogous to Hausman and Taylor
(1981) estimator. In particular, this alternative estimator allows us to exploit infor-
mation on the single observation within family, which comprises a third of our sample,
as well as obtain coeffi cient estimates for the time-invariant variables such as race and
maternal education. These would not be feasible with the usual fixed effects estimation.
We estimate positive and significant effects of fetal growth rate on math and reading
scores of children, those effects being concentrated over the low birth weight range.
However, they appear to contribute little to the black-white gap in test scores.
Keywords: birth weight, academic achievement, black-white test score gap
JEL classification: I12, I20
∗Chatterji: University at Albany and NBER; Kim: University at Albany; Lahiri: University at Albany.
1

1 Introduction
The extensive literature linking infant health to long-term outcomes shows that those born
heavier achieve higher educational attainment and earnings, and have lower health risk at
their adulthood. Studies using twin samples and natural experiments provide compelling
evidence on the causal role of fetal nutrition in determining adult outcomes (Almond and
Mazumder 2011, Behrman and Rosenzweig 2004, Black et al. 2007, Lindeboom et al. 2010,
Neelsen and Stratmann 2011, Royer 2009; van Ewijk 2011). However, much less is known
about the mechanism through which low birthweight translates into poor outcomes at adult-
hood.
The leading explanation for the association between birth weight and adult outcomes has
drawn on the Barker hypothesis1 which associates low birth weight with adult chronic diseases.
In this explanation, low birth weight has indirect consequences on adult productivity where
adult health plays a mediating role. There exists an alternative hypothesis that may help
to explain the association between birth weight and adult outcomes. Researchers in medical
science have long thought that the uterine malnutrition can impair the cognitive development
of children, which may persist into their adulthood (Morgane et al. 1993). This explanation
is consistent with the evidence that the effect of infant health appears to emerge before any
adult chronic condition can develop from fetal insult (Currie and Hyson 1999, Conley and
Bennett 2000, Hack et al. 2001, Oreopoulos et al. 2008).
Several studies examine the test score gap among the low-birthweight children and use
fixed effects estimation to address the omitted variable bias. However, the estimated effects
are often insignificant after controlling for the family fixed effects. These null findings may be
explained by inadequate statistical power as the size of siblings or twins sample is typically
small and the fixed effects estimation only exacerbates the problem by exploiting only the
variation within families. Moreover, when they use a sample of singletons, researchers often
1Barker (1995, 1998) claims that the uterine environment is crucial for adult health that fetal insults cancause adult chronic diseases such as the heart disease or the diabetes.
2
use birth weight only, failing to account for the gestational age that may have separate effects
on child academic achievement. In this case, it is diffi cult to interpret the estimated coeffi cient
for birth weight in the context of fetal nutrition argument because low birth weight can reflect
either a slow fetal growth rate (uterine malnutrition) or a preterm birth.
In this paper, we investigate the role of fetal nutritional intake in determining child aca-
demic achievement and its implication on the black-white test score gap. We use the same
PSID-CDS data source as is used in Johnson and Schoeni (2011), but add recent observations
and employ the extended model that contains unobserved child endowment in addition to
unobserved mother endowment. Based on this extended model, we propose the nested error
component two-stage least square (NEC2SLS) estimator which uses internal instruments for
endogenous covariates in a way analogous to Hausman and Taylor (1981) estimator. Unlike
the usual mother fixed effects (MFE) estimation, the alternative estimation method enables
us to exploit information on the single observation within family which comprises about 35%
of our sample as well as obtain consistent estimates under the identification assumptions
less strict than those required for GLS. Furthermore, we are able to estimate consistently
the coeffi cients for mother-specific and time-invariant covariates such as race and maternal
education, which would not be feasible with the usual fixed effects estimator.
Using the NEC2SLS estimator, we estimate positive and significant effects of fetal growth
rate, a proxy for nutritional intake in utero, on math and reading test scores of children.
We find that those effects are concentrated over the low birth weight range and modest in
magnitude. Overall, our results suggest that the cognitive deficiency of low-birthweight chil-
dren may be one mechanism through which fetal malnutrition generates poor adult outcomes.
However, the estimated racial gap in test scores changes little after controlling for fetal growth
rate. This suggests that the birth-weight effect contributes little to the black-white test score
gap.
The rest of the paper is organized as follows: In the next section, we provide a brief
overview on the related literature. In section 3 and 4, we describe the data set and develop
3

the nested error component model. In section 5, we provide evidence that the NECGLS
estimates are inconsistent and explain an alternative NEC2SLS estimator. In section 6, we
present the results and discuss. In the last section, we conclude.
2 Literature
The interest in the relation between birthweight and cognitive ability dates back at least a
century ago (Asher 1946). Observational studies generally find a positive association between
birth weight and IQ (Sorensen 1997, Breslau 2001, Hack 2002), but a spurious association
has been suspected since unobserved family backgrounds or a genetic composition may be
responsible for both infant health and child cognitive outcomes. For example, in a pioneering
study on the 1950-1954 British cohorts, Record, McKeown, and Edwards (1969) finds a strong
association between birthweight and verbal test scores, but little evidence of the association
within families.
Within-twin studies can provide compelling evidence on the causal role of fetal nutrition in
determining cognitive development of children, but the results are generally mixed. Boomsma
et al. (2001) report that the birthweight effect on child IQ can be found among dizygotic
twin pairs, but not among monozygotic twin pairs, suggesting that the genetic composition
may be a mediating factor while Petersen et al. (2009) find a significant effect of birth weight
among the Danish male twins regardless of zygosity, but not among the female twins. In a
study using a sample of Danish twins, Christensen et al. (2006) find significant effects of birth
weight on test scores although the magnitude is small. More recently, Figlio et al. (2013)
use a large registry data on twins in Florida and find the birth-weight effect on test scores,
which is remarkably stable across school grades as well as socio-economic backgrounds.
Several studies from economics use sibling samples of recent cohorts to address concern
for omitted variables. In a study that uses a Canadian registry data, Oreopoulos et al (2008)
find infant health has positive and significant effects on short-term health outcomes and
4

adult outcomes, but not for the language arts scores after controlling for the twin or sibling
fixed effects. Other within-sibling studies on U.S. cohorts also find the estimates become
insignificant when the MFE estimation is used. In a paper that examines comprehensive life-
cycle outcomes, Johnson and Schoeni (2011) use mother fixed effects and report a substantial
gap in test scores among the male siblings who are born at 1.5kg birth weight. However, their
estimates are statistically insignificant at the conventional level and the model contains birth
weight spline that allows a jump at the low birth weight cutoff, which may be implausible.
Fletcher (2011) also find some evidence of positive association between birth weight and
test scores, but the estimates for birth weight are found to be insignificant within families.
Moreover, since these studies do not control for gestational age in the birth weight regression,
it is diffi cult to interpret what the estimated effects of birth weight actually captures.
We build on the literature by addressing these limitations. First, we use the same PSID-
CDS data source as used in Johnson and Schoeni (2011) and present some evidence on a
potential misspecification in birth weight spline. Second, we employ the fetal growth rate as
a direct measure of the nutritional intake in utero. Third, we extend the model following
the literature and propose an alternative estimation method that exploits information more
effi ciently than the usual MFE estimation. Finally, we investigate the implication of birth-
weight effects on racial disparity in test scores, which would not be feasible when the MFE
estimation were used.
3 Data
We use the 1997, 2002/3, and 2009 waves of Child Development Supplement of the Panel
Study of Income Dynamics (PSID-CDS). The CDS provide reliable information on the assess-
ments of academic achievement of children who are born between 1984 and 1997 in the PSID
households. In 1997, the first wave of CDS interviewed 2, 394 families on 3, 563 children with
ages twelve or less and these children were reinterviewed in 2002/3 and 2009 if they were aged
5
eighteen or less at the time of interview. Hence, the data set includes multiple observations,
at most three, for each child.
We restrict our sample to children whose primary caregiver is the biological mother so
that the MFE estimates can provide estimates that are robust to the unobserved genetic
composition as well as the unobserved family background. To access information on maternal
and family characteristics, we further restrict our sample to the children whose mother is the
head or wife of a PSID household, whose information can be obtained from the PSID main
files. Table 1 gives the summary statistics on the variables used and the comparison between
the full CDS sample and the sibling sample. Notice that, by exploiting information in the
full sample, one can potentially increase the sample size by more than 50%. Otherwise, the
two samples are quite comparable.
3.1 Infant health
The PSID-CDS contains detailed information on infant health. In particular, the primary
caregiver, who is the biological mother in our sample, reports the birth weight of children along
with the gestational age in weeks. In the literature, alternative measures of fetal nutrition
have been used: Birth weight (or log of birth weight) and fetal growth rate.2 Conceptually,
birth weight is determined simultaneously by fetal growth rate and gestational age. Therefore,
if birth weight is used as a sole measure for infant health given a sample of singletons, it is
diffi cult to distinguish the effects of uterine nutrition from those of gestational age.3 For
this reason, the literature in medical science almost always controls for gestational age when
birth weight is the variable of interest. Nevertheless, this has not been recognized well in
within-sibling studies from economics, leading them to use birth weight as a sole measure of
infant health.2Fetal growth rate was considered in the related literature. For example, see Behrman and Rosenzweig
(2004).3As opposed to the literature studying birth weight, there is another strand of literature in medical science
that focuses on the consequences of preterm birth. Regarding to the cognitive outcomes, see Bhutta (2002),for example.
6

Our preferred measure of fetal nutritional intake will be fetal growth rate, which is defined
as birth weight divided by gestational age in weeks. However, we also use birth weight in
order to examine the nonlinear effects which have been documented in many studies.4 In
either case, we control for the indicator for preterm birth, which is defined as being unity
if the gestational age is less than 37 and zero otherwise, as a robustness check. Then, the
coeffi cient for birth weight can be interpreted as a proxy for fetal nutrition. In the next
section, we will discuss in detail about birth weight spline which will capture the nonlinear
effects of birth weight.
3.2 Academic Achievement
To measure the academic achievement of children, we use scores on the subtests of Woodcock-
Johnson Psycho-Educational Battery-Revised (WJ-R), each capturing a different cognitive
ability. Applied Problems measures the skills in solving practical problems in mathematics.
The subtest is administered to all children aged three and above. Passage Comprehension
measures the skills in reading comprehension and the amount of vocabulary. This subtest is
administered to older children (aged six and above) since it requires reading ability. Because
children took these tests at different ages, we use the standardized scores which are designed
to provide a normative score having the mean of 100 and the standard errors of 15. These
standardized scores are age-adjusted in reference to the national average of the monthly age
of the child.
3.3 Other covariates
One advantage of using CDS is that the rich and reliable information on family and maternal
characteristics can be obtained by matching the CDS to the PSIDmain files. In the regression,
4See Almond, Chay, and Lee (2005), Behrman and Rosenzweig (2004), Currie and Moretti (2007), Royer(2009) for nonlinear effects of birth weight on various outcomes. Among the studies that examine cognitiveabilities, Boardman et al. (2002) use a sample of U.S. children from the NLSY and find larger cognitivedeficits at the left-hand tail of birth-weight distribution. Similarly, Figlio et al. (2013) find nonliear effects ofbirth weight on test scores among the sample of U.S. twins born in Florida.
7

we include the demographic characteristics such as sex, race, and child age measured in
months (white and female as reference groups). The child age at the assessment is exogenous
by construction because we use the standard test scores that are aged-adjusted.
To control for the family characteristics that may affect birth weight as well as the acad-
emic achievement at childhood, we include log of permanent family income, which is measured
by six-year average of family incomes in terms of 2007-constant dollars. We also control for
the indicator for mother being single at child’s birth, and the indicators for maternal age at
child birth being less than 20 and over 35. We include in all regressions a set of indicators for
birth order, which has been shown to affect cognitive abilities of children (Black et al. 2005,
Sulloway 2007). Years of education of the mother and a measure for the home environment
that gives cognitive stimulation and emotional support, which have been shown to be most
important predictors of test scores in the literature, are included in the regressions.
4 Model
We begin with the model considered in Johnson and Schoeni (2011) where only a mother
endowment is included and a piecewise linear specification is used for birth weight. We focus
on the spline specification in the following subsection and extent the model to include a child
endowment in the next subsection.
4.1 Nonlinear Effects of Birth Weight
Prior studies often find nonlinearity in birth-weight effects, although the exact shape of
nonlinearity may depend on the outcomes examined. The specification they use can be
written as
yijt = α + δDij + γLDij(BWij − 1.5) + γN(1−Dij)(BWij − 1.5) + xijtβ +mi + eijt (1)
8
where yijt denotes a test score assess at the survey wave t of child j of mother i, Dij a binary
indicator of low birth weight (less than 2.5kg), BWij the birth weight, xijt the child and
family characteristics, mi the unobserved endowment of mother j, and uij the error terms.
The equation (1) serves two purposes. First, by allowing two different slopes for birth
weight (γL and γN), it can accommodate the potential nonlinearity in birthweight effects.
Second, δ will give the estimated test scores gap, which is incurred by potentially higher
penalty rate over the low birthweight range, evaluated at a particular point (1.5kg) in birth
weight distribution. One unintended consequence of this rather unusual specification is that
it allows a jump at the 2.5kg knot as is depicted in the Panel A in Figure 1.
This implicit modeling assumption can be tested by adding a binary indicator of low
birthweight in the usual continuous piecewise regression. The columns (1) and (5) in Table 2
provide some evidence that a jump may be implausible: The estimated jump is statistically
insignificant and the magnitude is implausibly large. Moreover, the estimated slopes of
birth weight spline for Passage Comprehension indicate that birth weight imposes penalty on
Passage Comprehension scores, which is counter-intuitive.
Other columns in Table 2 show our replication of Table 3 in Johnson and Schoeni (2011).
From column (2) to (4), we gradually add more observations to increase statistical power
on the continuous piecewise spline specification. We find positive and significant effects of
birth weight on Applied Problems, but not on Passage Comprehension. Before we employ an
alternative estimation strategy that will increase effi ciency, we extend Johnson and Schoeni
(2011)’s model to a two-way nested error component model.
4.2 Nested Error Component Model
We consider a two-fold nested error component model, which has been often used in the
education production literature (Todd and Wolpin 2003, Kim and Frees 2006) and in other
context (Baltagi et al. 2001). In particular, Boardman et al. (2002) estimate this model
using the Maximum Likelihood Estimator to find the test score gap among low-birthweight
9

and very-low-birthweight children. The model can be written as
yijt = xijtβ + wijγ + ziδ + uijt (2)
where test score y in survey year t of child j of mother i is a function of birth weight and
a set of child and family characteristics (xijt, wij, zi). xijt denote the vector of time-varying
child and family characteristics, wij the vector of time-constant child-specific characteristics
including birthweight, and zi are the vector of time-constant mother-specific characteristics.
We write the disturbance as
uijt = mi + cij + eijt (3)
where mi denotes the maternal endowment of mother i, cij denotes the child endowment of
child j nested in mother i, and eijt denotes the error term. Equation (3) corresponds naturally
to the nested grouping in our data set.
Note that equation (2) is more general than equation (1) in that the child endowment
is included in addition to the mother endowment. In this model, the mother fixed effects
estimation can be inconsistent if the child endowment is correlated with the explanatory
variables. In equation (2), we use a similar but different set of explanatory variables from
that of the previous model. 5
5The details on the set of covariates are discussed in the data section. The difference can be summarizedas the different measures of infant health rather than sole birth weight, permanent income instead of incomeat child’s birth, two indicators for mother’s age being less than 20 and more than 35 at child’s birth ratherthan continuous measure of maternal age at child’s birth.
10

5 Estimation
5.1 Nested Error Component GLS (NECGLS)
We discuss the NECGLS estimation which will serve as a building block for the NEC2SLS
estimator. Under the assumptions that
mi ∼ i.i.d(0, σ2m) (4)
cij ∼ i.i.d(0, σ2c) (5)
eijt ∼ i.i.d(0, σ2e), (6)
the NECGLS is consistent and effi cient. For the NECGLS estimation, we first transform the
equation (2) by Fuller and Battese (1973) transformation. The transformed equation can be
written as
yijt = xijtβ + wijγ + ziδ + uijt (7)
where tilda indicates that the variable is Fuller-Battese transformed (see Fuller and Battese
1973, Baltagi et al. 2001).6 Then we can obtain the NECGLS estimates by OLS regression
of the transformed equation (7).
Note that the NECGLS estimates will be inconsistent if the one of the assumptions (4)
and (5) is violated. The child fixed effects (CFE) estimation is robust to either the correlated
mother endowment mi or the child endowment cij, but it is not an option for our purpose
because only the estimates β can be obtained while the coeffi cient of interest lies in γ. The
MFE estimation has been widely used in the literature under the implicit assumption that
only the mother endowment mi might be correlated with the covariates. However, in our
model, even the MFE estimation can be inconsistent at the presence of correlated child
component cij.
6There are multiple ways of estimating the variance components. We estimate the variance componentsusing a method suggested in Fuller and Battese (1973).
11

In our context of two-way nested error component model, there can be three different
Hausman tests because there are potentially two different robust estimates: the CFE and
MFE (Hausman 1978, Kim and Frees 2006). Our focus should be on the general test con-
cerning with the CFE whose estimates are robust to either the correlated child or mother
endowment. However, we will also present the result from the Hausman test concerning the
MFE since it is the benchmark model in the literature, although the test can stand alone
provided that the child endowment is uncorrelated. In the next section, we will show that the
Hausman tests of the NECGLS estimates against the CFE estimates as well as the mother
fixed effects (MFE) estimates strongly indicate that some of the covariates are correlated
with either the child or mother component (or both).
5.2 Nested Error Component 2SLS (NEC2SLS)
Based on the Hausman tests that will be presented in the next section, we will assume that
some of the covariates are correlated, but the others are exogenous as has been done in
the Hausman and Taylor estimation (1981). Before proceeding to the consistent estimation
under those assumptions, we first note that a time-varying variable xijt can be decomposed
into three components. For convenience, we rewrite equation (7) in a simple form as
yijt = xijtβ + uijt
where all the variables are Fuller-Battese transformed. For any given xijt, it is easy to show
that
xijt = (xijt − xij.) + (xij. − xi..) + xi.. (8)
where xij. ≡∑T
t=1 xijt denotes the mean of xijt over time (or the child mean) and xi.. ≡∑Tt=1
∑Jj=1 xijt the mean of xijt over time and child (or the mother mean).
7 In matrix form,
7Analogously, if the variable does not vary over time, but varies across children, the decomposition willcontain two components where the decomposition will be zij = (zij − zi.) + zi..
12

we can write the decomposition (8) as
X = Q1X +Q2X + PX
where Q1X denotes the deviation from the child mean, Q2X denotes the child deviation
from the mother mean, and PX denotes the mother mean. Then, the GLS estimates can
be obtained from performing the 2SLS estimation where the list of instruments is A =
(Q1X,Q2X,PX). Now we partition X = (X1, X2) where X1 is uncorrelated with m and c,
but X2 is correlated with m and c. Under the assumption, the NEC2SLS estimator is the
2SLS estimator where the list of instruments is B = (X1, Q1X2). In the next section, we will
discuss how we partition X based on the Hausman tests.
The NEC2SLS estimator is consistent under the identification assumptions less strict
than those required for the GLS estimation since X1 is allowed to be correlated with either
the mother endowment mi or the child component cij. On the other hand, the NEC2SLS
estimator may require stricter identification assumptions than the MFE estimation. However,
by relaxing some of those assumptions, we can exploit information on the single observations
within families which comprise almost a half of the entire sample.8 Moreover, we can recover
estimates for the coeffi cients of the time-constant mother-specific covariates such as maternal
education and race, which is not feasible in the MFE estimation. This allows us to investigate
the implication of birthweight effects on racial disparity.
6 Result
We begin with presenting the NECGLS estimates along with evidence of inconsistency. Table
3 shows the NECGLS estimates on equation (2). The estimates suggest that fetal growth rate
8Even the MFE estimation may be inconsistent at the presence of correlated child component (Kimand Frees 2006). The NEC2SLS estimator can potentially address this problem. However, the particularNEC2SLS that is used in this paper requires the identification assumption under which the MFE estimatoris always consistent.
13
has positive and significant effects on test scores. However, the chi-square statistics strongly
indicate inconsistency of the NECGLS estimation. With a single exception, we can reject
the null hypothesis of uncorrelated child and mother endowment at the conventional level of
significance as can be seen at the bottom of Table 3. In particular, the t-statistics from the
Hausman tests suggest that the family income and home environment are the major source
of endogeneity regardless of the alternative hypothesis (either against CFE or MFE). The
detailed results of Hausman tests can be found in the Appendix Table 1 and 3.
Based on the diagnostic results above, we allow for the two explanatory variables, family
income and home environment to be correlated with the child or mother endowment, but
assume that the other covariates are exogenous. Under these assumptions, we estimate equa-
tion (2) using 2SLS where the child component of family income and home environment is
excluded from the list of instruments. In effect, all the components of the exogenous vari-
ables will serve as the internal instruments for the child means of family income and home
environment, which are the only endogenous components.
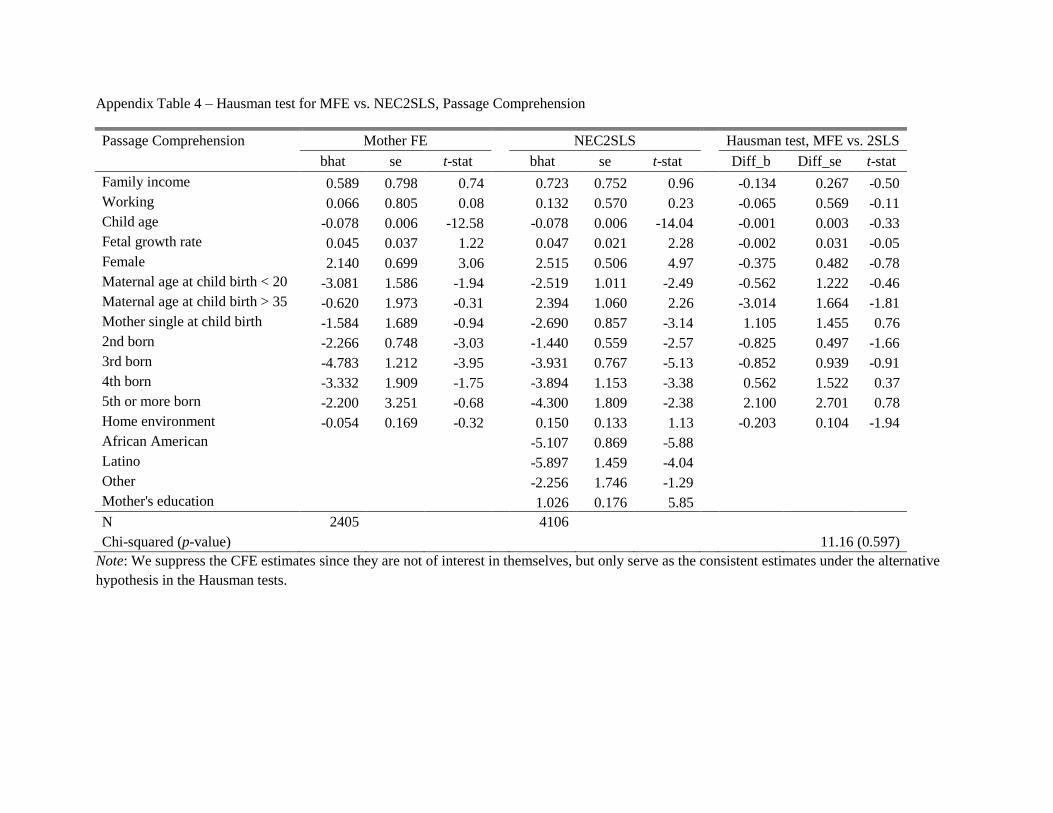
Table 4 presents the results from the NEC2SLS estimation described above. After ad-
dressing the endogeneity from the child means of family income and home scale, we find the
positive and significant effects of fetal growth rate on test scores. The magnitude is somewhat
larger for Applied Problems, but the estimated effects are highly significant for both tests.
Notice that the chi-square statistics for the Hausman tests become substantially smaller as
are shown at the bottom of Table 4. Hence, we cannot reject the null hypotheses either
against the CFE or the MFE at the conventional level of significance. The detailed results of
Hausman tests can be found in the Appendix Table 2 and 4.
Table 5 summarizes the results when the different measures of infant health are used.9 As
can be seen in the p-values from the Hausman tests reported at the bottom of each panel, in
no regression we can reject the null hypothesis that the NEC2SLS estimates are statistically
9We do not report the CFE and MFE estimates since the results are similar to those in Table 3 regardlessof specification. We cannot reject the null hypothesis that the NEC2SLS estimates are consistent at thepresence of the unobserved child or mother component. These results can be provided upon request.
14

different from the robust estimates. Panel A in Table 5 shows that the significant and
positive effect of fetal growth rate on test scores remains robust after controlling for preterm
birth. In particular, columns (3) and (6) of panel A suggest that the consequences of initial
health endowment may be more pronounced as the mothers are less educated. The estimated
coeffi cient of interactive term between fetal growth rate and maternal education shows the
cognitive penalty of fetal malnutrition gets larger as the primary caregiver has less years of
education. In Panel B of Table 5, we present results when birth-weight spline is used. In
columns (1) and (4) of Panel B, we find positive and significant effects of fetal nutritional
intake on test scores consistently over the low birth weight range. In contrast, the size of the
effects is much smaller and the estimates are often statistically insignificant over the normal
birth-weight range. Since the preterm birth is controlled for in columns (2) and (5), we can
interpret the coeffi cient for birth weight as a proxy for nutrition intake in utero. Overall,
the gain in test scores appears to be modest as increasing 1kg of birth weight within the low
birth weight range translates into one third standard deviation in test scores.
We further investigate the implication of fetal nutrition on racial disparity in test scores, by
comparing the estimated test score gap by race, before and after controlling for infant health
measure in the test score equation. From column (1) to (3) in Table 6, we add maternal
education in years and fetal growth rate to see how much of the racial gap can be explained
by those factors. The estimated black-white gap in test scores is remarkably robust after the
inclusion of maternal education and fetal growth rate while the estimated Latino-white gap
closes substantially after controlling for maternal education. Overall, the results in Table 6
suggest that fetal nutritional intake may not contribute much to the racial disparity in test
scores.
15

7 Conclusion
The literature that finds strong association between infant health and adult outcomes often
gives the interpretation that infant health has long lasting health consequences such as adult
chronic conditions, which may in turn affect adult productivity. However, medical literature
also long suggested that fetal malnutrition can impair the cognitive development of children,
which may persist into adulthood. While the former explanation emphasizes the role of infant
health in determining adult health, the latter explanation suggests a direct consequence of
infant health on child outcomes, which may persist and accumulate over time. Therefore,
finding the evidence that infant health affects child outcomes can constitute an alternative
mechanism through which infant health determines adult outcomes. Indeed, the cognitive
gap among those born with low birthweight has long been observed, but a spurious has been
suspected since, for example, unobserved family background may explain both infant health
and cognitive ability.
To control for omitted variables, several studies exploit variation within families, but they
often find insignificant effects of birth weight on test scores. However, these null findings may
be driven by a lack of statistical power arising from the limited size of twin/sibling sample
or the estimation method (family fixed effects estimation). Moreover, some of recent within-
sibling studies fail to account for the gestational age confounding the interpretation on the
estimated coeffi cient for birth weight.
To address concerns for endogeneity as well as effi ciency, we use the NEC2SLS estimator
which allows us to increase the sample size by 50 percent as well as use more information
from the variation between families than the MFE estimation, and still provide consistent
estimates under the identification assumptions less strict than those in the GLS estimation.
Furthermore, we can estimate the coeffi cient for maternal education and the racial disparity
in test scores using this estimator. We use the fetal growth rate as a direct measure of
nutritional intake in utero and find a positive and significant effect of fetal growth rate on
academic achievement of children. This suggests that cognitive gains in childhood from
16

better nutritional intake in utero may constitute an alternative pathway through which birth
weight determines adult outcomes such as education and earnings. Also, we investigate its
implication on black-white test score gap by adding measures of infant health to test score
equation and examining the change in the estimated racial disparity. We find that controlling
for infant health changes little of the estimated black-white test score gap. Therefore, infant
health appears to contribute little to the black-white test score gap.
References
[1] Almond, Douglas, Kenneth Y. Chay, and David S. Lee (2005), “The Costs of Low Birth
Weight,”Quarterly Journal of Economics 120(3), pp. 1031-83.
[2] Almond, Douglas, and Bhashkar Mazumder (2011), “Health Capital and the Prenatal
Environment: The Effect of Ramadan Observance During Pregnancy,”American Eco-
nomic Journal: Applied Economics 3, pp. 56-85.
[3] Asher, Cecile (1946), “The Prognosis of Immaturity,”British Medical Journal 1, pp.
793-6.
[4] Baltagi, Badi H., Seuck Heun Song, and Byoung Cheol Jung (2001), “The Unbalanced
Nested Error Component Regression Model,”Journal of Econometrics 101, pp. 357-81.
[5] Barker, D. J. P. (1995), “Fetal Origins of Coronary Heart Disease,” British Medical
Journal 311, pp. 171-4.
[6] Barker, D. J. P (1998), Mothers, Babies and Health in Later Life, Edinurgh: Churchill
Livingstone.
[7] Behrman, J. R. and M. R. Rosenzweig (2004), “Returns to Birthweight,” Review of
Economics and Statistics 86, pp. 586-601.
17

[8] Bhutta, Adnan T., Mario A. Cleves, Patrick H. Casey, Mary M. Cradock, K. J. S. Anand
(2002), “Cognitive and Behavioral Outcomes of School-Aged Children Who Were Born
Preterm,”JAMA 288(6), pp. 728-37.
[9] Black, Sandra E., Paul G. Devereux, and Kjell G. Salvanes (2005) “The More The
Merrier? The Effect of Family Size and Birth Order on Children’s Education,”Quarterly
Journal of Economics 120(2), pp. 669-700.
[10] Black, Sandra E., Paul J. Devereux, and Kjell G. Salvanes (2007), “From the Cradle to
the Labor Market? The Effect of Birth Weight on Adult Outcomes,”Quarterly Journal
of Economics 122(1), pp. 409-39.
[11] Boardman, Jason D., Daniel A. Powers, Yolanda C. Padilla, and Robert A. Hummer
(2002), “Low Birth Weight, Social Factors, and Developmental Outcomes Among Chil-
dren in the United States,”Demography 39(2), pp. 353-68.
[12] Boomsma, D. I., C. E. M. van Beijsterveldt, M. J. H. Rietveld, M. Bartels and G. C. M.
van Baal (2001), “Genetics Mediate Relation of Birth Weight to Childhood IQ,”British
Medical Journal 323(7326), pp. 1426-7.
[13] Breslau, N., E. O. Johnson, and V. C. Lucia (2001), “Academic Achievement of Low
Birthweight Children at Age 11: The Role of Cognitive Abilities at School Entry,”
Journal of Abnormal Child Psychology 29(4), pp. 273-9.
[14] Christensen, Kaare, Axel Skytthe, Anne M. Herskind, Matt McGue, and Paul Bingley,
“Comparison of Academic Performance of Twins and Singletons in Adolescence: Follow-
up Study,”British Medical Journal 333(7578), pp. 1095-7.
[15] Conley, Dalton and Neil G. Bennett (2000), “Is Biology Destiny? Birth Weight and Life
Chances,”American Sociological Review 65(3), pp. 458-67.
18

[16] Currie, Janet and Rosemary Hyson (1999), “Is the Impact of Health Shocks Cushioned
by Socioeconomic Status? The Case of Low Birthweight,”American Economic Review
89(2), pp. 245-50.
[17] Currie, Janet and Enrico Moretti (2007), “Biology as Destiny? Short- and Long-Run
Determinants of Intergenerational Transmission of Birth Weight,”Journal of Labor Eco-
nomics 25(2), pp. 231-63.
[18] Figlio, David N., Jonathan Guryan, Krzysztof Karbownik, and Jeffrey Roth (2013), “The
Effects of Poor Neonatal Health on Children’s Cognitive Development,”NBER Working
Paper No. 18846.
[19] Fletcher, Jason M. (2011), “The Medium Term Schooling and Health Effects of Low
Birth Weight: Evidence from Siblings,”Economics of Education Review 30, pp. 517-27.
[20] Fuller, Wayne A. and George E. Battese (1973), “Transformation for Estimation of Lin-
ear Models with Nested-Error Structure,”Journal of the American Statistical Association
68(343), pp. 626-32.
[21] Hack, Maureen, Daniel J. Flannery, Mark Schluchter, Lydia Cartar, Elaine Borawski,
and Nancy Klein (2002), “Outcomes in Young Adulthood For Very-Low-Birth-Weight
Infants,”The New England Journal of Medicine 346(3), pp. 149-57.
[22] Hausman, Jerry A (1978), “Specification Tests in Econometrics,”Econometrica 46(6),
pp. 1251-71.
[23] Hausman, Jerry A., and W. E. Taylor (1981), “Panel Data and Unobservable Individual
Effects,”Econometrica 49, pp. 1377-98.
[24] Johnson, Rucker C. and Robert F. Schoeni (2011), “The Influence of Early-Life Events
on Human Capital, Health Status, and Labor Market Outcomes Over the Life Course,”
The B. E. Journal of Economic Analysis & Policy 11(3), Article 3.
19

[25] Kim, Jee-Seon and Edward W. Frees (2006), “Omitted Variables in Multilevel Models,”
Psychometrika 71(4), pp. 659-90.
[26] Kim, Jee-Seon and Edward W. Frees (2007), “Multilevel Modeling With Correlated
Effects,”Psychometrika 72(4), pp. 505-533.
[27] Lindeboom, Maarten, France Portrait, and Gerard J. van den Berg (2010), “Long-run
Effects on Longevity of a Nutritional Shock Early in Life: The Dutch Potato Famine of
1846-1847,”Journal of Health Economics 29, pp. 617-29.
[28] Morgane, Peter J., Robert Austin-LaFrance, Joseph Bronzino, John Tonkiss, Sofia Diaz-
Cintra, L. Cintra, Tom Kemper, and Janina R. Galler (1993), “Prenatal Malnutrition
and Development of the Brain,”Neuroscience and Biobehavioral Reviews 17(1), pp. 91-
128.
[29] Neelsen, Sven and Thomas Stratmann (2011), “Effects of Prenatal and Early Life Malnu-
trition: Evidence from the Greek Famine,”Journal of Health Economics 30, pp. 479-88.
[30] Oreopoulos, Philip, Mark Stabile, Randy Walld, and Leslie L. Roos (2008), “Short-
, Medium-, and Long-Term Consequences of Poor Infant Health,” Journal of Human
Resources 43(1), pp. 88-138.
[31] Record, R. G., Thomas McKewon, and J. H. Edwards (1969), “The Relationship of
Measured Intelligence to Birth Weight and Duration of Gestation,”Annals of Human
Genetics 33, pp. 71-9.
[32] Royer, Heather (2009), “Separated at Girth: US Twin Estimates of the Effects of Birth
Weight,”American Economic Journal: Applied Economics 1(1), pp. 49-85.
[33] Sorensen, Hendrik T., Svend Sabroe, Jorn Olsen, Kenneth J. Rothman, Matthew W.
Gillman, and Peter Fischer (1997), “Birth Weight and Cognitive Function in Young
Adult Life: Historical Cohort Study,”British Medical Journal 315, pp. 401-3.
20

[34] Sulloway, Frank J. (2007), “Birth Order and Intelligence,”Science 317, pp. 1711-2.
[35] Todd, Petra, and Kenneth I. Wolpin (2003), “On the Specification and Estimation of the
Production Function for Cognitive Achievement,”Economic Journal 113(485), F3-33.
[36] van Ewijk, Reyn (2011), “Long-Term Health Effects on the Next Generation of Ramadan
Fasting During Pregnancy,”Journal of Health Economics 30, pp. 1246-60.
21
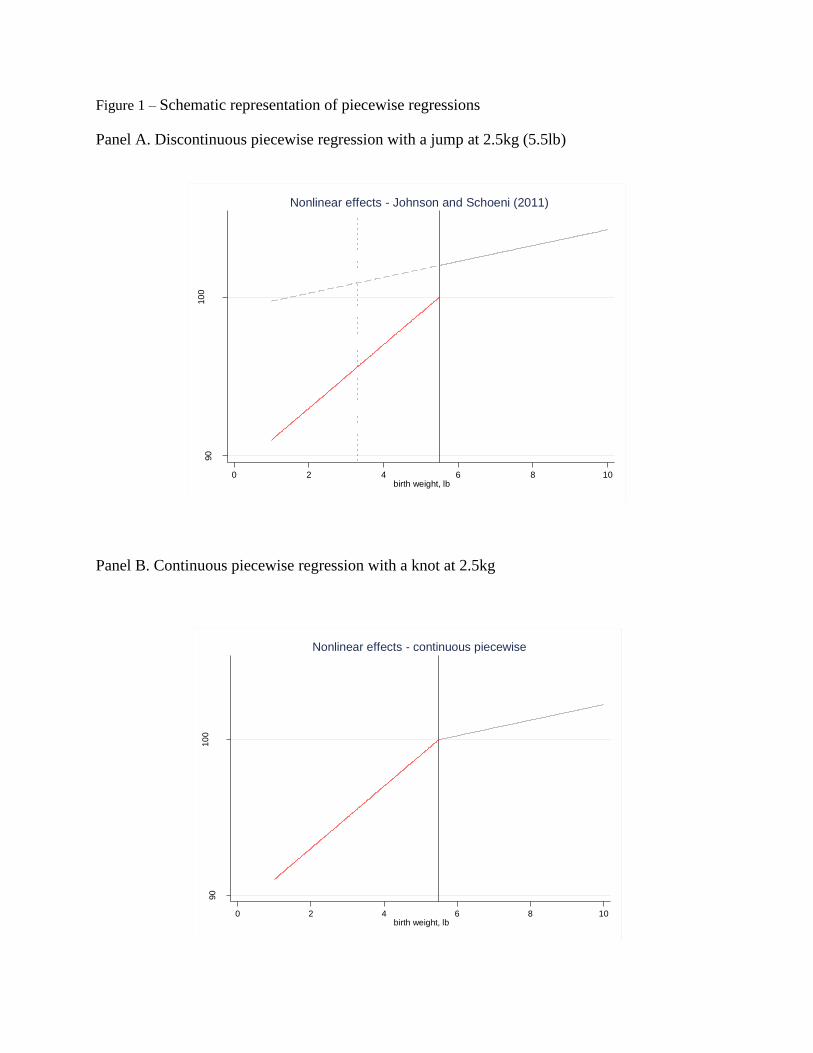
Figure 1 – Schematic representation of piecewise regressions
Panel A. Discontinuous piecewise regression with a jump at 2.5kg (5.5lb)
Panel B. Continuous piecewise regression with a knot at 2.5kg
90
10
0
test score
0 2 4 6 8 10birth weight, lb
Nonlinear effects - Johnson and Schoeni (2011)90
10
0
test score
0 2 4 6 8 10birth weight, lb
Nonlinear effects - continuous piecewise

Table 1 – Summary Statistics
Variables Full sample Sibling sample
N Mean SD N Mean SD
Test scores
Applied Problems 4,610 104.03 16.94
3,005 104.75 16.93
Passage Comprehension 4,107 102.67 16.63
2,665 102.75 16.77
Time-varying characteristics
Family income 5,734 54044.7 58274.7
3,711 56261.8 63061.8
Mother working 5,734 0.681 0.47
3,711 0.658 0.47
Child age in months 5,734 121.2 56.39
3,711 121.2 55.6
Time-invariant child characteristics
Birthweight (kg) 2,676 3.326 0.63
1,737 3.341 0.64
Low birthweight (< 2.5kg) 2,676 0.086 0.28
1,737 0.087 0.28
Gestational age in weeks 2,676 39.479 2.19
1,737 39.511 2.12
Female 2,676 0.487 0.50
1,737 0.491 0.50
Maternal age at child birth 2,676 27.195 5.56
1,737 26.922 5.42
Mother age at child birth < 20 2,676 0.089 0.28
1,737 0.090 0.29
Mother age at child birth > 35 2,676 0.065 0.25
1,737 0.054 0.23
Mother single at child birth 2,676 0.291 0.45
1,737 0.276 0.45
1st born 2,676 0.394 0.49
1,737 0.319 0.47
2nd born 2,676 0.352 0.48
1,737 0.405 0.49
3rd born 2,676 0.169 0.37
1,737 0.180 0.38
4th born 2,676 0.057 0.23
1,737 0.060 0.24
5th or more 2,676 0.028 0.17
1,737 0.035 0.18
Home environment 2,676 19.188 3.56
1,737 19.372 3.62
Time-invariant maternal characteristics
Nonlatino white 2,676 0.515 0.50
1,737 0.537 0.50
Nonlatino African American 2,676 0.377 0.48
1,737 0.351 0.48
Latino 2,676 0.062 0.24
1,737 0.069 0.25
Other race 2,676 0.046 0.21
1,737 0.044 0.20
Mother's education (years) 2,676 12.859 2.54 1,737 12.792 2.59

Table 2 – Test of Jump at the Knot (2.5kg)
Applied Problems Passage Comprehension
(1) (2) (3) (4) (5) (6) (7) (8)
A jump at 2.5kg -5.428
-11.420
(5.975)
(8.688)
Birth weight (<2.5kg) 5.115 6.766* 8.476** 7.109**
-10.185 5.632 5.960 5.226
(6.081) (3.674) (3.363) (2.824)
(19.446) (9.853) (7.513) (4.315)
Birth weight (>= 2.5kg) 1.706 1.843 2.678 -0.109
-0.844 0.777 1.447 0.316
(2.753) (2.673) (2.252) (1.249)
(2.780) (2.779) (2.052) (1.171)
Number of mothers 193 193 199 775
180 180 191 747
Number of children 361 361 375 1449
326 326 351 1371
Number of observations 536 536 661 2627 440 440 565 2273
F-statistic 0.27 0.96 1.82 4.92
0.24 0.19 0.29 1.10
p-value 0.60 0.33 0.18 0.03 0.63 0.66 0.59 0.29
Continuous spline? No Yes Yes Yes
No Yes Yes Yes
Wave 3 included? No No Yes Yes
No No Yes Yes
Male pairs only? Yes Yes Yes No
Yes Yes Yes No
Note:All regressions include mother fixed effects and the set of controls identical in Johnson and Schoeni (2011). The set of covariates includes
race, family income at child birth, maternal age at birth, a set of indicators for mother being single at birth, birth order, and child's year of birth.
Standard errors in parentheses are clustered at the mother level. * p<0.10, ** p<0.05, *** p<0.01.
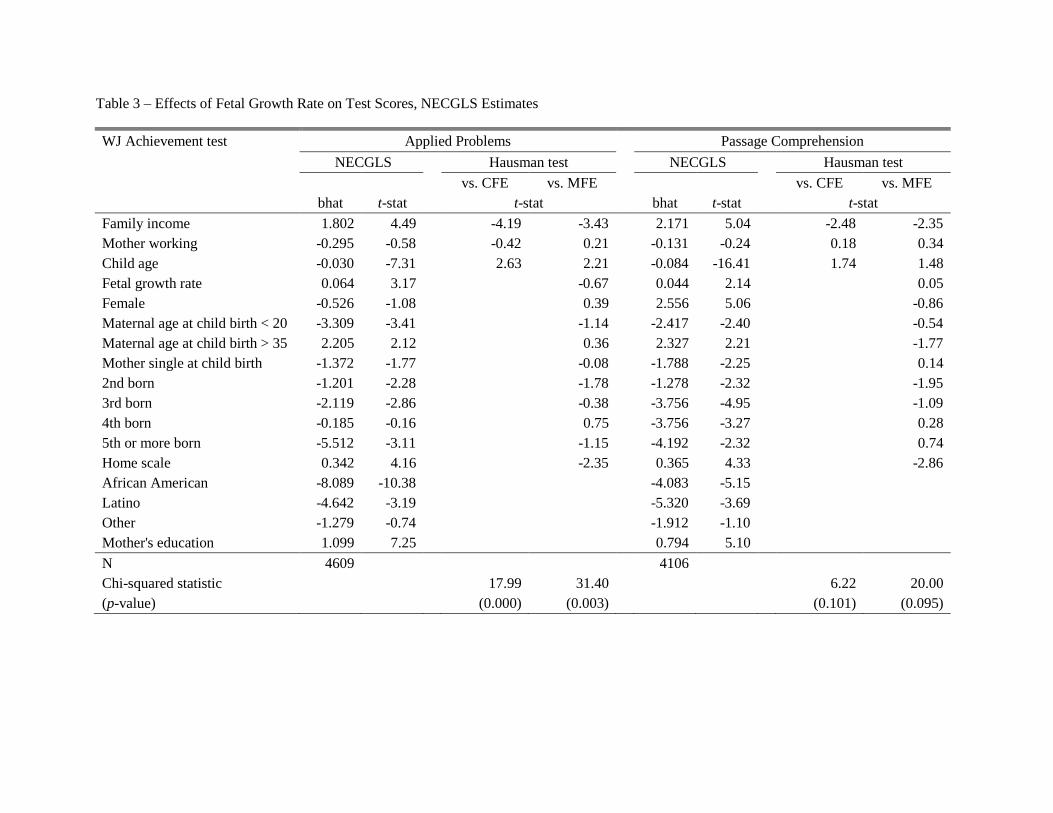
Table 3 – Effects of Fetal Growth Rate on Test Scores, NECGLS Estimates
WJ Achievement test Applied Problems Passage Comprehension
NECGLS
Hausman test
NECGLS
Hausman test
vs. CFE vs. MFE
vs. CFE vs. MFE
bhat t-stat t-stat bhat t-stat t-stat
Family income 1.802 4.49
-4.19 -3.43
2.171 5.04
-2.48 -2.35
Mother working -0.295 -0.58
-0.42 0.21
-0.131 -0.24
0.18 0.34
Child age -0.030 -7.31
2.63 2.21
-0.084 -16.41
1.74 1.48
Fetal growth rate 0.064 3.17
-0.67
0.044 2.14
0.05
Female -0.526 -1.08
0.39
2.556 5.06
-0.86
Maternal age at child birth < 20 -3.309 -3.41
-1.14
-2.417 -2.40
-0.54
Maternal age at child birth > 35 2.205 2.12
0.36
2.327 2.21
-1.77
Mother single at child birth -1.372 -1.77
-0.08
-1.788 -2.25
0.14
2nd born -1.201 -2.28
-1.78
-1.278 -2.32
-1.95
3rd born -2.119 -2.86
-0.38
-3.756 -4.95
-1.09
4th born -0.185 -0.16
0.75
-3.756 -3.27
0.28
5th or more born -5.512 -3.11
-1.15
-4.192 -2.32
0.74
Home scale 0.342 4.16
-2.35
0.365 4.33
-2.86
African American -8.089 -10.38
-4.083 -5.15
Latino -4.642 -3.19
-5.320 -3.69
Other -1.279 -0.74
-1.912 -1.10
Mother's education 1.099 7.25 0.794 5.10
N 4609
4106
Chi-squared statistic
17.99 31.40
6.22 20.00
(p-value) (0.000) (0.003) (0.101) (0.095)

Table 4 – Effects of Birthweight on Test Scores, NEC2SLS Estimates
Applied Problems Passage Comprehension
NEC2SLS
Hausman test
NEC2SLS
Hausman test
vs. CFE vs. MFE
vs. CFE vs. MFE
bhat t-stat t-stat bhat t-stat t-stat
Family income -0.083 -0.13
-2.23 -0.02
0.723 0.96
-0.85 -0.50
Working 0.023 0.04
-1.26 -0.47
0.132 0.23
-0.32 -0.11
Child age -0.023 -5.36
-0.22 0.05
-0.078 -14.04
-0.31 -0.33
Fetal growth rate 0.067 3.34
-0.80
0.047 2.28
-0.05
Female -0.557 -1.14
0.47
2.515 4.97
-0.78
Maternal age at child birth < 20 -3.411 -3.50
-1.05
-2.519 -2.49
-0.46
Maternal age at child birth > 35 2.329 2.23
0.28
2.394 2.26
-1.81
Mother single at child birth -2.474 -3.02
0.77
-2.690 -3.14
0.76
2nd born -1.393 -2.60
-1.38
-1.440 -2.57
-1.66
3rd born -2.338 -3.11
-0.12
-3.931 -5.13
-0.91
4th born -0.373 -0.33
0.89
-3.894 -3.38
0.37
5th or more born -5.669 -3.18
-1.09
-4.300 -2.38
0.78
Home scale 0.123 0.97
-0.99
0.150 1.13
-1.94
African American -9.325 -11.20
-5.107 -5.88
Latino -5.328 -3.62
-5.897 -4.04
Other -1.652 -0.96
-2.256 -1.29
Mother's education 1.377 8.33 1.026 5.85
N 4452
4106
Chi-squared statistic
2.06 18.47
2.48 11.16
(p-value) (0.560) (0.141) (0.479) (0.597)

Table 5 –Effects of Fetal Nutrition on Test Scores, NEC2SLS and MFE estimates
Applied Problems Passage Comprehension
(1) (2) (3) (4) (5) (6)
Panel A: Fetal nutrition
Fetal growth rate 0.067*** 0.059*** 0.289***
0.047** 0.036* 0.222**
(0.020) (0.021) (0.104)
(0.021) (0.022) (0.108)
Fetal growth rate * Maternal education
-0.018**
-0.015**
(0.008)
(0.008)
Preterm birth
-1.286 -1.200
-1.660* -1.588*
(1.040) (1.040)
(1.075) (1.076)
N 4609 4609 4609
4106 4106 4106
p-value (vs. CFE) 0.560 0.564 0.571
0.478 0.494 0.525
p-value (vs. MFE) 0.141 0.154 0.151 0.597 0.633 0.344
Panel B: Birth weight spline
Birth weight (<2.5kg) 5.357** 5.629*** N.A.
4.415** 4.186** N.A.
(1.517) (1.727)
(1.542) (1.766)
Birth weight (>=2.5kg) 0.714 0.810*
0.337 0.290
(0.554) (0.571)
(0.565) (0.582)
Preterm birth
0.324
-0.502
(1.189)
(1.235)
N 4609 4609
4106 4106
p-value (vs. CFE) 0.487 0.553
0.690 0.616
p-value (vs. MFE) 0.190 0.248 0.801 0.740
Note: Standard errors are in parentheses. All regressions include the same set of covariates as in Table 3. * p<0.10, ** p<0.05, *** p<0.01.

Table 6 – Role of Fetal Nutrition in Determining Racial Disparity in Test Scores, NEC2SLS estimates
Applied Problems Passage Comprehension
(1) (2) (3) (4) (5) (6)
African American -10.134*** -9.700*** -9.353***
-5.525*** -5.537*** -5.141***
(0.850) (0.831) (0.833)
(0.877) (0.866) (0.869)
Latino -9.152*** -5.373*** -5.345***
-8.665*** -5.924*** -5.923***
(1.469) (1.474) (1.470)
(1.443) (1.461) (1.459)
Other -1.628 -1.853 -1.682
-2.217* -2.409* -2.300*
(1.676) (1.733) (1.729)
(1.664) (1.746) (1.745)
Maternal education
1.383*** 1.375***
1.030*** 1.023***
(0.166) (0.165)
(0.176) (0.175)
Fetal growth rate
0.059***
0.036*
(0.021)
(0.022)
Preterm birth
-1.286
-1.660*
(1.040) (0.341)
N 4609 4452 4452 4106 4106 4106
Note: Standard errors are in parentheses. All regressions include the same set of covariates as in Table 3. * p<0.10, ** p<0.05, *** p<0.01.

Appendix Table 1 – Hausman test for MFE vs. NECGLS, Applied Problems
Applied Problems Mother FE NECGLS Hausman test, MFE vs. GLS
bhat se t-stat bhat se t-stat Diff_b Diff_se t-stat
Family income -0.089 0.682 -0.13 1.802 0.402 4.49
-1.891 0.551 -3.43
Working -0.197 0.699 -0.28
-0.295 0.510 -0.58
0.098 0.479 0.21
Child age -0.023 0.005 -4.60
-0.030 0.004 -7.31
0.007 0.003 2.21
Fetal growth rate 0.045 0.034 1.33
0.064 0.020 3.17
-0.018 0.028 -0.67
Female -0.364 0.639 -0.57
-0.526 0.488 -1.08
0.162 0.413 0.39
Maternal age at child birth < 20 -4.508 1.432 -3.15
-3.309 0.970 -3.41
-1.199 1.053 -1.14
Maternal age at child birth > 35 2.741 1.811 1.51
2.205 1.039 2.12
0.536 1.484 0.36
Mother single at child birth -1.481 1.524 -0.97
-1.372 0.775 -1.77
-0.108 1.312 -0.08
2nd born -1.986 0.687 -2.89
-1.201 0.527 -2.28
-0.785 0.441 -1.78
3rd born -2.441 1.130 -2.16
-2.119 0.742 -2.86
-0.321 0.852 -0.38
4th born 0.864 1.801 0.48
-0.185 1.133 -0.16
1.049 1.400 0.75
5th or more born -8.379 3.052 -2.75
-5.512 1.774 -3.11
-2.867 2.483 -1.15
Home environment 0.038 0.153 0.25
0.342 0.082 4.16
-0.304 0.129 -2.35
African American
-8.089 0.779 -10.38
Latino
-4.642 1.453 -3.19
Other
-1.279 1.721 -0.74
Mother's education 1.099 0.152 7.25
N 2852
4609
Chi-squared (p-value) 31.40 (0.003)
Note: We suppress the CFE estimates since they are not of interest in themselves, but only serve as the consistent estimates under the alternative
hypothesis in the Hausman tests.

Appendix Table 2 – Hausman test for MFE vs. NEC2SLS, Applied Problems
Applied Problems Mother FE NEC2SLS Hausman test, MFE vs. 2SLS
bhat se t-stat bhat se t-stat Diff_b Diff_se t-stat
Family income -0.089 0.682 -0.13 -0.083 0.628 -0.13 -0.007 0.265 -0.02
Working -0.197 0.699 -0.28
0.023 0.518 0.04
-0.220 0.469 -0.47
Child age -0.023 0.005 -4.60
-0.023 0.004 -5.36
0.000 0.003 0.05
Fetal growth rate 0.045 0.034 1.33
0.067 0.020 3.34
-0.022 0.028 -0.80
Female -0.364 0.639 -0.57
-0.557 0.490 -1.14
0.194 0.411 0.47
Maternal age at child birth < 20 -4.508 1.432 -3.15
-3.411 0.974 -3.50
-1.097 1.049 -1.05
Maternal age at child birth > 35 2.741 1.811 1.51
2.329 1.045 2.23
0.412 1.479 0.28
Mother single at child birth -1.481 1.524 -0.97
-2.474 0.819 -3.02
0.994 1.286 0.77
2nd born -1.986 0.687 -2.89
-1.393 0.536 -2.60
-0.593 0.430 -1.38
3rd born -2.441 1.130 -2.16
-2.338 0.752 -3.11
-0.103 0.844 -0.12
4th born 0.864 1.801 0.48
-0.373 1.139 -0.33
1.237 1.395 0.89
5th or more born -8.379 3.052 -2.75
-5.669 1.782 -3.18
-2.710 2.477 -1.09
Home environment 0.038 0.153 0.25
0.123 0.127 0.97
-0.085 0.086 -0.99
African American
-9.325 0.833 -11.20
Latino
-5.328 1.470 -3.62
Other
-1.652 1.730 -0.96
Mother's education 1.377 0.165 8.33
N 2852
4609
Chi-squared (p-value) 18.47 (0.141)
Note: We suppress the CFE estimates since they are not of interest in themselves, but only serve as the consistent estimates under the alternative
hypothesis in the Hausman tests.

Appendix Table 3 – Hausman test for MFE vs. NECGLS, Passage Comprehension
Passage Comprehension Mother FE NECGLS Hausman test, MFE vs. GLS
bhat se t-stat bhat se t-stat Diff_b Diff_se t-stat
Family income 0.589 0.798 0.74 2.171 0.430 5.04
-1.582 0.672 -2.35
Working 0.066 0.805 0.08
-0.131 0.556 -0.24
0.197 0.583 0.34
Child age -0.078 0.006 -12.58
-0.084 0.005 -16.41
0.005 0.004 1.48
Fetal growth rate 0.045 0.037 1.22
0.044 0.020 2.14
0.001 0.031 0.05
Female 2.140 0.699 3.06
2.556 0.505 5.06
-0.416 0.483 -0.86
Maternal age at child birth < 20 -3.081 1.586 -1.94
-2.417 1.007 -2.40
-0.664 1.225 -0.54
Maternal age at child birth > 35 -0.620 1.973 -0.31
2.327 1.054 2.21
-2.947 1.668 -1.77
Mother single at child birth -1.584 1.689 -0.94
-1.788 0.796 -2.25
0.204 1.489 0.14
2nd born -2.266 0.748 -3.03
-1.278 0.551 -2.32
-0.987 0.506 -1.95
3rd born -4.783 1.212 -3.95
-3.756 0.759 -4.95
-1.028 0.945 -1.09
4th born -3.332 1.909 -1.75
-3.756 1.149 -3.27
0.423 1.525 0.28
5th or more born -2.200 3.251 -0.68
-4.192 1.803 -2.32
1.992 2.705 0.74
Home environment -0.054 0.169 -0.32
0.365 0.084 4.33
-0.418 0.146 -2.86
African American
-4.083 0.792 -5.15
Latino
-5.320 1.442 -3.69
Other
-1.912 1.737 -1.10
Mother's education 0.794 0.156 5.10
N 2405
4106
Chi-squared (p-value) 20.00 (0.095)
Note: We suppress the CFE estimates since they are not of interest in themselves, but only serve as the consistent estimates under the alternative
hypothesis in the Hausman tests.
Appendix Table 4 – Hausman test for MFE vs. NEC2SLS, Passage Comprehension
Passage Comprehension Mother FE NEC2SLS Hausman test, MFE vs. 2SLS
bhat se t-stat bhat se t-stat Diff_b Diff_se t-stat
Family income 0.589 0.798 0.74 0.723 0.752 0.96
-0.134 0.267 -0.50
Working 0.066 0.805 0.08
0.132 0.570 0.23
-0.065 0.569 -0.11
Child age -0.078 0.006 -12.58
-0.078 0.006 -14.04
-0.001 0.003 -0.33
Fetal growth rate 0.045 0.037 1.22
0.047 0.021 2.28
-0.002 0.031 -0.05
Female 2.140 0.699 3.06
2.515 0.506 4.97
-0.375 0.482 -0.78
Maternal age at child birth < 20 -3.081 1.586 -1.94
-2.519 1.011 -2.49
-0.562 1.222 -0.46
Maternal age at child birth > 35 -0.620 1.973 -0.31
2.394 1.060 2.26
-3.014 1.664 -1.81
Mother single at child birth -1.584 1.689 -0.94
-2.690 0.857 -3.14
1.105 1.455 0.76
2nd born -2.266 0.748 -3.03
-1.440 0.559 -2.57
-0.825 0.497 -1.66
3rd born -4.783 1.212 -3.95
-3.931 0.767 -5.13
-0.852 0.939 -0.91
4th born -3.332 1.909 -1.75
-3.894 1.153 -3.38
0.562 1.522 0.37
5th or more born -2.200 3.251 -0.68
-4.300 1.809 -2.38
2.100 2.701 0.78
Home environment -0.054 0.169 -0.32
0.150 0.133 1.13
-0.203 0.104 -1.94
African American
-5.107 0.869 -5.88
Latino
-5.897 1.459 -4.04
Other
-2.256 1.746 -1.29
Mother's education 1.026 0.176 5.85
N 2405
4106
Chi-squared (p-value) 11.16 (0.597)
Note: We suppress the CFE estimates since they are not of interest in themselves, but only serve as the consistent estimates under the alternative
hypothesis in the Hausman tests.