inequality in reproductive, maternal and child...
TRANSCRIPT

SEA-NUR-466
Distribution: General
Inequality in Reproductive,
Maternal and Child Health
in Nepal
Measuring and Monitoring Health Inequalities:
A Post-Workshop Report
© World Health Organization 2016
All rights reserved.
Requests for publications, or for permission to reproduce or translate WHO
publications – whether for sale or for noncommercial distribution – can be obtained
from SEARO Library, World Health Organization, Regional Office for South-East
Asia, Indraprastha Estate, Mahatma Gandhi Marg, New Delhi 110 002, India (fax:
+91 11 23370197; e-mail: [email protected]).
The designations employed and the presentation of the material in this publication
do not imply the expression of any opinion whatsoever on the part of the World
Health Organization concerning the legal status of any country, territory, city or area
or of its authorities, or concerning the delimitation of its frontiers or boundaries.
Dotted lines on maps represent approximate border lines for which there may not
yet be full agreement.
The mention of specific companies or of certain manufacturers’ products does not
imply that they are endorsed or recommended by the World Health Organization in
preference to others of a similar nature that are not mentioned. Errors and omissions
excepted, the names of proprietary products are distinguished by initial capital
letters.
All reasonable precautions have been taken by the World Health Organization to
verify the information contained in this publication. However, the published material
is being distributed without warranty of any kind, either expressed or implied. The
responsibility for the interpretation and use of the material lies with the reader. In no
event shall the World Health Organization be liable for damages arising from its use.
This publication does not necessarily represent the decisions or policies of the World
Health Organization.
Printed in India
iii
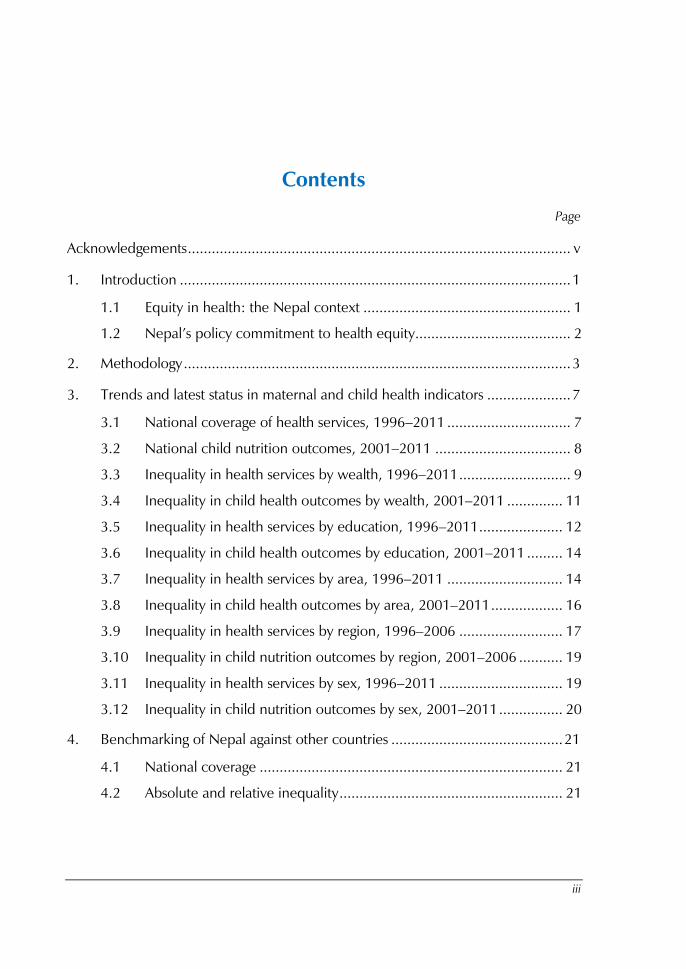
Contents
Page
Acknowledgements ................................................................................................ v
1. Introduction .................................................................................................. 1
1.1 Equity in health: the Nepal context .................................................... 1
1.2 Nepal’s policy commitment to health equity....................................... 2
2. Methodology ................................................................................................. 3
3. Trends and latest status in maternal and child health indicators ..................... 7
3.1 National coverage of health services, 1996–2011 ............................... 7
3.2 National child nutrition outcomes, 2001–2011 .................................. 8
3.3 Inequality in health services by wealth, 1996–2011 ............................ 9
3.4 Inequality in child health outcomes by wealth, 2001–2011 .............. 11
3.5 Inequality in health services by education, 1996–2011 ..................... 12
3.6 Inequality in child health outcomes by education, 2001–2011 ......... 14
3.7 Inequality in health services by area, 1996–2011 ............................. 14
3.8 Inequality in child health outcomes by area, 2001–2011 .................. 16
3.9 Inequality in health services by region, 1996–2006 .......................... 17
3.10 Inequality in child nutrition outcomes by region, 2001–2006 ........... 19
3.11 Inequality in health services by sex, 1996–2011 ............................... 19
3.12 Inequality in child nutrition outcomes by sex, 2001–2011 ................ 20
4. Benchmarking of Nepal against other countries ........................................... 21
4.1 National coverage ............................................................................ 21
4.2 Absolute and relative inequality ........................................................ 21
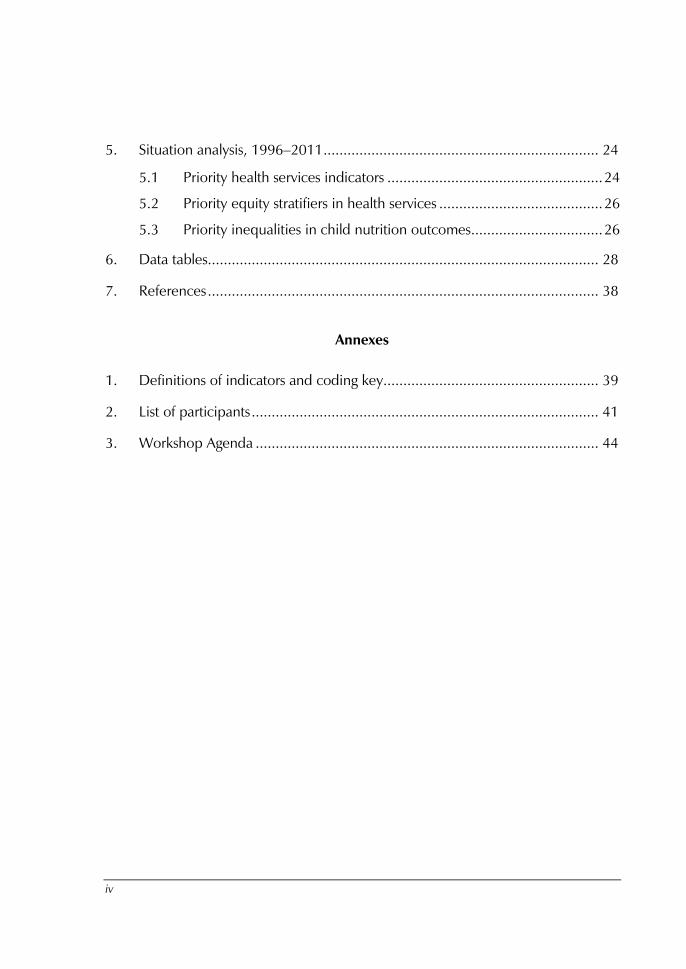
iv
5. Situation analysis, 1996–2011 ..................................................................... 24
5.1 Priority health services indicators ...................................................... 24
5.2 Priority equity stratifiers in health services ......................................... 26
5.3 Priority inequalities in child nutrition outcomes................................. 26
6. Data tables.................................................................................................. 28
7. References .................................................................................................. 38
Annexes
1. Definitions of indicators and coding key...................................................... 39
2. List of participants ....................................................................................... 41
3. Workshop Agenda ...................................................................................... 44
v
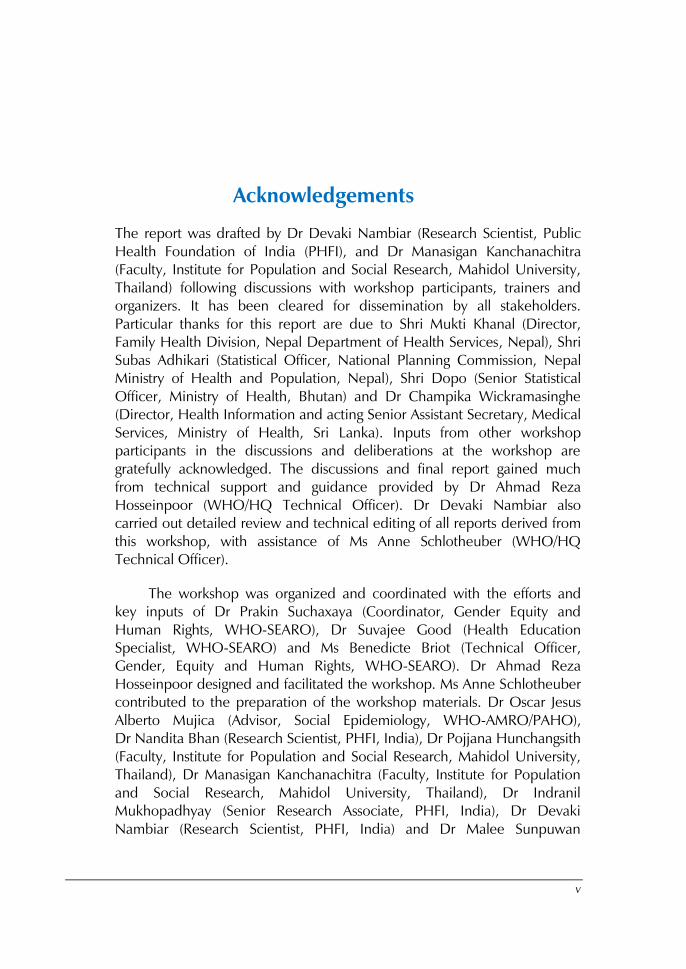
Acknowledgements
The report was drafted by Dr Devaki Nambiar (Research Scientist, Public
Health Foundation of India (PHFI), and Dr Manasigan Kanchanachitra
(Faculty, Institute for Population and Social Research, Mahidol University,
Thailand) following discussions with workshop participants, trainers and
organizers. It has been cleared for dissemination by all stakeholders.
Particular thanks for this report are due to Shri Mukti Khanal (Director,
Family Health Division, Nepal Department of Health Services, Nepal), Shri
Subas Adhikari (Statistical Officer, National Planning Commission, Nepal
Ministry of Health and Population, Nepal), Shri Dopo (Senior Statistical
Officer, Ministry of Health, Bhutan) and Dr Champika Wickramasinghe
(Director, Health Information and acting Senior Assistant Secretary, Medical
Services, Ministry of Health, Sri Lanka). Inputs from other workshop
participants in the discussions and deliberations at the workshop are
gratefully acknowledged. The discussions and final report gained much
from technical support and guidance provided by Dr Ahmad Reza
Hosseinpoor (WHO/HQ Technical Officer). Dr Devaki Nambiar also
carried out detailed review and technical editing of all reports derived from
this workshop, with assistance of Ms Anne Schlotheuber (WHO/HQ
Technical Officer).
The workshop was organized and coordinated with the efforts and
key inputs of Dr Prakin Suchaxaya (Coordinator, Gender Equity and
Human Rights, WHO-SEARO), Dr Suvajee Good (Health Education
Specialist, WHO-SEARO) and Ms Benedicte Briot (Technical Officer,
Gender, Equity and Human Rights, WHO-SEARO). Dr Ahmad Reza
Hosseinpoor designed and facilitated the workshop. Ms Anne Schlotheuber
contributed to the preparation of the workshop materials. Dr Oscar Jesus
Alberto Mujica (Advisor, Social Epidemiology, WHO-AMRO/PAHO),
Dr Nandita Bhan (Research Scientist, PHFI, India), Dr Pojjana Hunchangsith
(Faculty, Institute for Population and Social Research, Mahidol University,
Thailand), Dr Manasigan Kanchanachitra (Faculty, Institute for Population
and Social Research, Mahidol University, Thailand), Dr Indranil
Mukhopadhyay (Senior Research Associate, PHFI, India), Dr Devaki
Nambiar (Research Scientist, PHFI, India) and Dr Malee Sunpuwan
vi
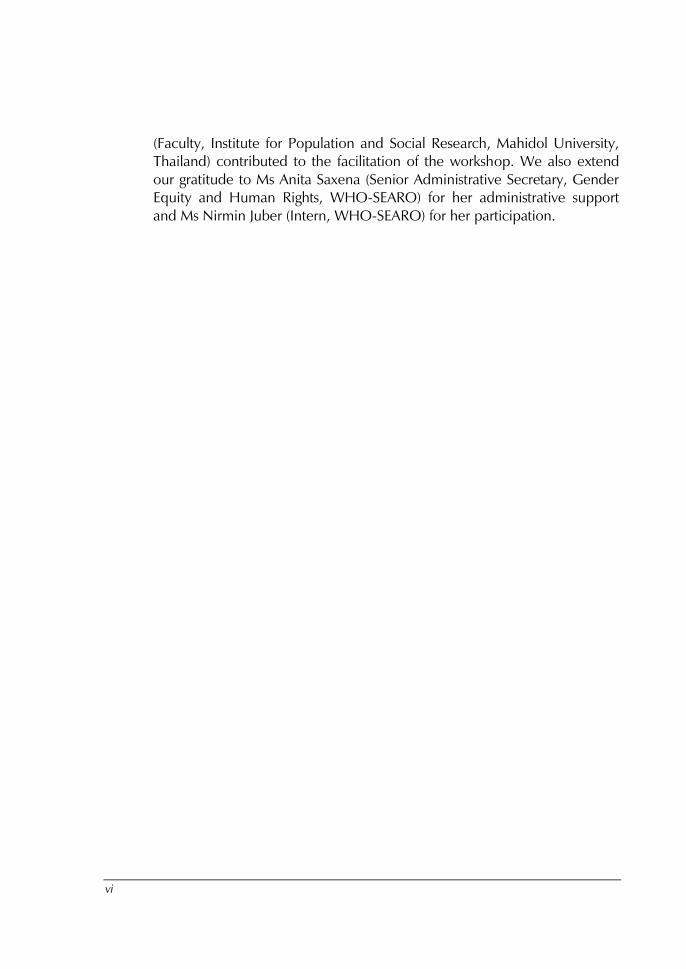
(Faculty, Institute for Population and Social Research, Mahidol University,
Thailand) contributed to the facilitation of the workshop. We also extend
our gratitude to Ms Anita Saxena (Senior Administrative Secretary, Gender
Equity and Human Rights, WHO-SEARO) for her administrative support
and Ms Nirmin Juber (Intern, WHO-SEARO) for her participation.
1
1. Introduction
1.1 Equity in health: the Nepal context
Amidst significant political instability and change, Nepal has made
significant progress in improving the health status of its people. Health
outcome indicators such as life expectancy, maternal mortality ratio, under-
5 mortality rate and infant mortality rate have all improved over the years.
Despite the overall improved health status of the people in Nepal,
inequality remains an issue of concern. Use of health services has
increased and has been associated with a reduction in inequality for many
services and for some health outcomes, but progress has been uneven and
severe inequalities remain. In some cases, there are improvements in equity
issues. Disparities between castes, ethnicities and wealth quintiles have
decreased in contraceptive use, childhood immunization, diarrhoeal
disease control and treatment for acute respiratory infection. Differences
between castes, ethnic groups and wealth quintiles in birth weight or size at
birth have also diminished. Differences in under-5 and infant mortality rates
between castes, ethnic groups and wealth quintiles have decreased.
However, despite the improvements in inequality, large gaps between
castes, ethnicities and wealth quintiles still remain in Nepal and must not be
overlooked.
Disparities in some areas, such as maternity care, have increased for
much of the period, although recent policy initiatives have begun to close
the gaps. The wealthiest women are still 12 times more likely to use a
trained health worker during delivery than the poorest. At the same time,
differences in neonatal mortality rates between Brahmins/Chhetris and
Dalits, and between Newars and Janajatis, have increased.
Measuring and Monitoring Health Disparities: A Post-Workshop Report
2
1.2 Nepal’s policy commitment to health equity
Equity in health was given significant policy thrust through Nepal’s National
Health Policy in 1991. The primary objective of the health policy was to
upgrade the health standards of the majority of the rural population by
extending basic primary health services up to the village level and to
provide the opportunity to the rural populations to access modern medical
facilities. The focus initially was on reducing urban-rural disparities. Equity
was further emphasized in the second long-term health plan from 1997 to
2017. This plan aims to improve access to assure that all people,
particularly those whose health needs are not often met, are able to use
services at rates that are proportional and appropriate to their need for
care. The most vulnerable groups identified are women and children, rural
populations, the poor and those otherwise disadvantaged and marginalized.
Equity received a major thrust as part of Nepal’s people movement in
2006. After this, the Interim Constitution of Nepal in 2007 promised health
as a fundamental right, stating that every citizen shall have the right to basic
free-of-cost health services from the state as provided by law. The Ministry
of Health and Population also endorsed a Health Sector Gender Equality
and Social Inclusion Strategy in 2009, with the aim to increase access and
use of essential health-care services by all citizens, especially by the
disadvantaged, marginalized and backward target groups specified by the
states. The ministry is also committed to improving the quality of health
services, ensuring equal and equitable treatment for all citizens. The notion
of equity as stated in the earlier policies, plan and strategy was reflected in
the Nepal Health Sector Programme II 2010-15, where one of its important
aims is to bring equity in the use of quality health services by all people of
Nepal.
At present, equity in health services is a central concern of every
health plan, strategy and programme. The current Health Management
Information System (HMIS) reports regular service delivery use and
estimates service coverage. However, the current system does not yet
undertake health inequality monitoring; policy and decision-makers need
additional information to make appropriate evidence-informed decisions to
address existing inequity in the health sector of Nepal. There is, therefore, a
strong rationale for inequality monitoring to be performed and introduced
into routine health systems monitoring across the country.

Inequality in Reproductive, Maternal and Child Health in Nepal
3
2. Methodology
Drawing from a larger inventory of reproductive, maternal and child health
indicators for the South-East Asia Region, for Nepal, eight health service
indicators related to reproductive, child and maternal health were
examined. These were: satisfaction with family planning needs; two
indicators of coverage of antenatal care over a 3-year period (at least one
visit by a skilled provider, and four or more visits); the presence of a skilled
birth attendant; early initiation of breastfeeding; DTP3 vaccination; care-
seeking for pneumonia; and access to oral rehydration therapy. These eight
indicators were chosen in the course of group work at the larger regional
meeting.
In addition to the eight health services indicators assessed, we also
looked at three child nutrition outcome indicators: stunting (height for age);
underweight (weight for age); and wasting (weight for height) in children
less than 5 years. Improving nutritional status of children and women has
been recognized as a top priority by the Nepali Government, as
malnutrition remains a major contributor to child health problems.
Although the situation of chronic malnutrition has improved since 2001,
Nepal remains one of the most malnourished countries in the world, with
concentration being in the mid- and far-west hill and mountainous regions,
and in the central Terai. Unfortunately, the national nutrition action plan,
prepared in 2007, was never finalized. The full definitions of all the
indicators assessed are presented in Annex 1.
Each health indicator selected was assessed across five different
dimensions of inequality: wealth, education, area, region and sex. These
dimensions were chosen as they have been previously used widely in the
literature. Notably, the specific indicator used to stratify individuals into
wealth quintiles was an asset-based index derived from information on
specific household asset ownership collected by Demographic and Health
Surveys (DHS). Asset-based indices derived through principal component
analyses had previously been shown to have a high correlation with other
indicators of socioeconomic positions, such as income and expenditure,
although they do have certain limitations, which have been explored in the
literature (Howe, Hargreaves and Huttly, 2008; Howe et al., 2012; Vyas
and Kumaranayake, 2006).
Measuring and Monitoring Health Disparities: A Post-Workshop Report
4
The estimates used for our assessment of inequalities in Nepal were
extracted from the Health Equity Monitor database of the WHO Global
Health Observatory (GHO).1
These estimates are derived from the re-
analysis of the publicly available DHS micro-data. Four rounds of DHS have
been conducted in Nepal – in 1996, 2001, 2006 and 2011 – allowing for
assessment of progress on these indicators across four different time points,
spanning over 15 years.
Calculations of summary measures of inequality (including range
difference, between-group variance and slope index of inequality to
measure absolute inequality and range ratio and Theil index to measure
relative inequality) for each indicator were conducted using HD*Calc, a
publicly available software program specifically designed for the purpose of
performing such calculations (see http://seer.cancer.gov/hdcalc/ for more
information). All visualizations were done using Microsoft Excel. The
calculations of simple summary measures were double-checked using
Excel.
For each indicator, three aspects were assessed: 1) the latest status
(from DHS 2011); 2) the time trend (going as far back as DHS 1996); and
3) benchmarking against other countries in the Asia-Pacific Region and
against national targets. We selected 13 neighbouring countries as
comparison in the benchmarking assessment. We restricted our assessment
to only the low- and middle-income countries in the Asia-Pacific Region (26
countries), of which only 13 countries, other than Nepal, had recent
publicly available international household health data on the selected
indicators (DHS or Multiple Indicator Cluster Survey (MICS) from 2005 to
2010). These countries included Bangladesh, Bhutan, Cambodia, India,
Indonesia, Lao People’s Democratic Republic, Maldives, Mongolia,
Philippines, Thailand, Timor-Leste, Vanuatu and Viet Nam. In cases where
recent data for a specific country were not available, that country was
dropped from the assessment.
1 Data were derived from the re-analysis of publicly available Demographic and Health Surveys (DHS) micro-data,
using the standard indicator definitions as published in DHS documentation. The analysis was carried out by the
International Center for Equity in Health, based in the Federal University of Pelotas, Brazil. In some cases there
may be slight differences between these results and those reported in DHS country reports due to differences in
the calculation of indicator numerators and/or denominators. Disaggregated data were extracted from the WHO
Health Equity Monitor database in December 2013, and subsequent updates are likely to have occurred.
(http://apps.who.int/gho/data/node.main.HE-1540?lang=en).
Inequality in Reproductive, Maternal and Child Health in Nepal
5
These countries, and the Asia-Pacific Region overall, are quite diverse.
Nonetheless, by comparing Nepal with these countries, we hoped to
expand our understanding of the broader context with which to interpret
information on health inequalities. Countries of the Asia-Pacific Region may
share many similar underlying causes of health inequalities, meaning that
inequalities in certain health indicators may be challenging across the
Region (AP-Health GAEN, 2011). Through a benchmarking comparison
with other countries in the Region, we can develop a greater understanding
of the context with which to assess priority areas where action is warranted
to reduce health inequalities in Nepal.
All assessments were conducted during a week-long workshop on
inequality monitoring from 8 to 11 April, 2014, in Jaipur, India (a full list of
participants is provided in Annex 2).
Participants from Nepal and Sri Lanka, assisted by trainers from
technical institutes in India and Thailand, discussed tables and graphs
demonstrating the values of indicators by each equity stratifier and
summary measures of inequality for Nepal. A template was filled with
notes, drawing from Excel chart views and discussion of summary measures
of inequality in HD*Calc. During the plenary session, the best and worst
performing indicators were presented and discussed.
Participants were asked to examine the national coverage, absolute
inequality and relative inequality for each indicator based on
benchmarking, time trend and latest status (Table 1, 2 and 3). Participants
scored each indicator in these subcategories on a scale of 1 to 3:
“1” (green) indicated that no action was needed;
“2” (yellow) indicated that action was needed; and
“3” (red) indicated urgent need for action.
During the final plenary, sample indicators showing key aspects of
health inequality analysis across benchmarking, trend and latest status
analytic approaches were identified and discussed.
It should be noted that there was some degree of subjectivity on the
part of workshop participants in assigning these scores. To make the process
more reflexive and objective, group members developed decision rules for
interpreting the data and prioritizing the need for action. These decision
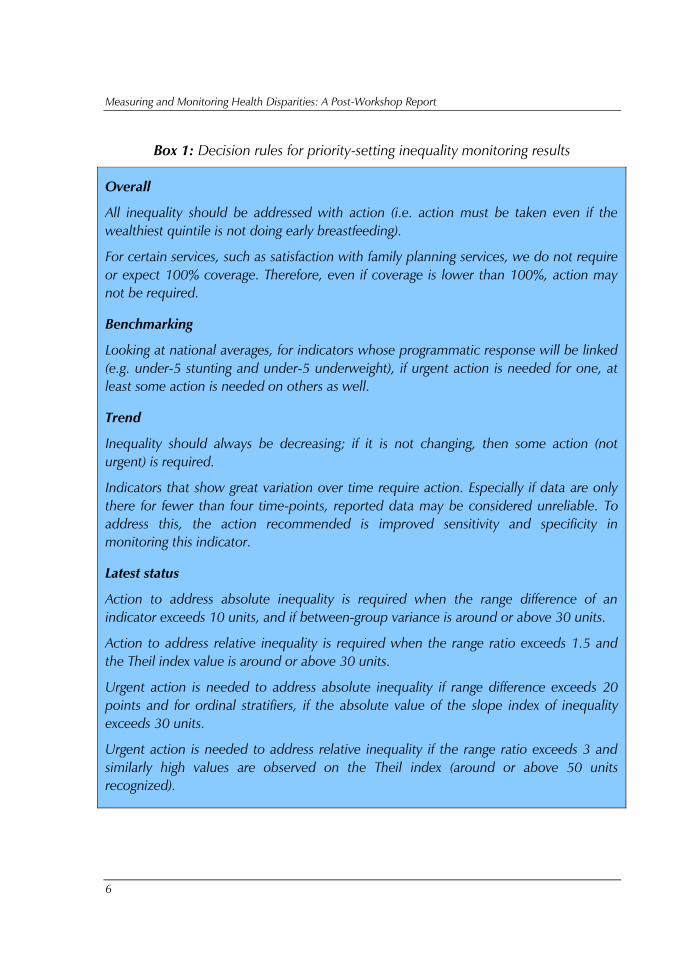
rules are summarized in Box 1.
Measuring and Monitoring Health Disparities: A Post-Workshop Report
6
Box 1: Decision rules for priority-setting inequality monitoring results
Overall
All inequality should be addressed with action (i.e. action must be taken even if the
wealthiest quintile is not doing early breastfeeding).
For certain services, such as satisfaction with family planning services, we do not require
or expect 100% coverage. Therefore, even if coverage is lower than 100%, action may
not be required.
Benchmarking
Looking at national averages, for indicators whose programmatic response will be linked
(e.g. under-5 stunting and under-5 underweight), if urgent action is needed for one, at
least some action is needed on others as well.
Trend
Inequality should always be decreasing; if it is not changing, then some action (not
urgent) is required.
Indicators that show great variation over time require action. Especially if data are only
there for fewer than four time-points, reported data may be considered unreliable. To
address this, the action recommended is improved sensitivity and specificity in
monitoring this indicator.
Latest status
Action to address absolute inequality is required when the range difference of an
indicator exceeds 10 units, and if between-group variance is around or above 30 units.
Action to address relative inequality is required when the range ratio exceeds 1.5 and
the Theil index value is around or above 30 units.
Urgent action is needed to address absolute inequality if range difference exceeds 20
points and for ordinal stratifiers, if the absolute value of the slope index of inequality
exceeds 30 units.
Urgent action is needed to address relative inequality if the range ratio exceeds 3 and
similarly high values are observed on the Theil index (around or above 50 units
recognized).
Inequality in Reproductive, Maternal and Child Health in Nepal
7
The situation analysis developed during the workshop was finalized by
a small subset of workshop participants with assistance from WHO. This
report is intended as a preliminary document demonstrating how maternal
and child health inequalities may be understood, reported and used for
priority-setting in Nepal. The activities described here should be
undertaken by a larger and wider range of stakeholders from government,
academia and civil society and be equipped with comprehensive
information about Nepal’s maternal and child health burdens and
programmes, involvement with the country’s health information
management systems as well as DHS processes, and a role in the use of
health systems monitoring for decision-making at the national level.
Certain terminology related to health inequality monitoring may not
be familiar to all audiences. The WHO handbook on health inequality
monitoring, which describes the terminology and additional considerations
for health inequality monitoring, can be reviewed for more information
(WHO, 2013).
3. Trends and latest status in maternal and child
health indicators
3.1 National coverage of health services, 1996–2011
Between 1996 and 2011, Nepal increased national coverage of all eight
indicators assessed. These indicators are as follows:
family planning needs satisfied;
antenatal care (one visit);
antenatal care (four or more visits);
presence of a skilled attendant at birth;
early breastfeeding;
DTP3 immunization;
care-seeking for pneumonia;
oral rehydration therapy for children.
Measuring and Monitoring Health Disparities: A Post-Workshop Report
8
The greatest increase in coverage between 1996 and 2011 took place
in antenatal care. The proportion of households reporting four or more
visits increased from 9% in DHS 1996 to 51.6% coverage in 2011, while
the proportion of households reporting one visit grew from 23.7% in DHS
1996 to 59.4% according to DHS 2011 (Table 4). DTP3 immunization also
showed a 38.3-point increase from 53.5% coverage in 1996 to 91.8% in
DHS 2011. The remaining indicators showed modest increases, ranging
from a 25-point to a 30-point increase. The one exception was a plateau
effect in the indicator for satisfaction of family planning needs, which grew
from 47.5% in DHS 1996 to 66.1% in DHS 2006, and was 65% in DHS
2011.
Latest status: These gains notwithstanding, only DTP3 immunization
(91.8%) and oral rehydration therapy for children with diarrhoea (46.7%)
are indicators that are close to or surpass national targets of 100% and 40%
respectively. Moderate coverage was seen for family planning, antenatal
care (one visit), which is above 50%. All other indicators were below 45%
and far from national targets: these include the presence of a skilled
attendant at birth (national coverage of 40.5% as against the national target
of 60%), early initiation of breastfeeding (at 44.9% as against a national
target of 60%) and care-seeking for pneumonia (43.2% national coverage).
3.2 National child nutrition outcomes 2001–2011
DHS data on child nutrition outcomes were examined for 2001, 2006 and
2011, as these data were not available for 1996. The greatest declines were
seen for stunting (height for age) in children under 5 years, reducing almost
17 points over a decade, from 57.2% in 2001 to 40.3% in DHS 2011.
Underweight (weight for age) in children under 5 years declined from 43%
in DHS 2001 to 28.5% in DHS 2011, close to a 14.5 point decadal
decrease. Wasting (weight for height) in children under 5 years actually
increased from 11.3% in DHS 2001 to 12.7% in DHS 2006, subsequently
declining in DHS 2011 to 10.9%.
Latest status: Nepal’s target for stunting was 28% of the population;
according to DHS 2011, the prevalence of stunting was 40.3%. The target
for prevalence of underweight in Nepal has been met: as per DHS 2011,
the prevalence of stunting was 28.5% as against the national target of 29%.
With regard to wasting, the national target of 5% is about half the
prevalence reported in DHS 2011 (10.9%).
Inequality in Reproductive, Maternal and Child Health in Nepal
9
3.3 Inequality in health services by wealth, 1996–2011
Of the eight health service indicators assessed, Nepal achieved decreases in
wealth-based inequality for two – between DHS 1996 and DHS 2011
(Table 5). The indicators that showed decreases in wealth-based inequality
include satisfaction in family planning and DTP3 vaccination. DTP3
vaccination, in particular, achieved an important reduction in inequality
during this 15-year span. The absolute inequality decreased from 41.1
percentage points in 1996 to 10.3 percentage points in 2011. Similarly in
relative inequality, the relative ratio decreased from 2.0 to 1.1 in the same
period. DTP3 vaccination coverage started out in 1996 with observable
wealth-based inequality.
However, coverage in the lower quintiles increased more rapidly than
the highest quintile (where it was already approaching 100% coverage),
which led to convergence among quintiles. There was also a significant
reduction in wealth-based inequality in satisfaction in family planning, with
the absolute gap between the wealthiest and poorest quintiles going from
35.1 percentage points in 1996 to 16.2 percentage points in 2011. The
relative ratio of family planning satisfaction also reduced significantly, from
2.1 to 1.3.
Wealth-based inequality increased, however, in five of the eight
health service indicators considered, particularly in terms of absolute
inequality. These indicators include:
antenatal care visit (four or more);
presence of a skilled birth attendant;
early breastfeeding;
care-seeking for pneumonia; and
oral rehydration therapy.
The presence of skilled birth attendant coverage had the highest level
of absolute gap between the wealthiest and poorest quintiles, increasing
from 30.8 percentage points in 1996 to 74.2 percentage points in 2011.
The gap widened rapidly primarily in the 5-year interval from 2006 to
2011. The level of coverage in the wealthiest quintile in 1996 was vastly
different from the rest of the population, and all lower quintiles improved
Measuring and Monitoring Health Disparities: A Post-Workshop Report
10
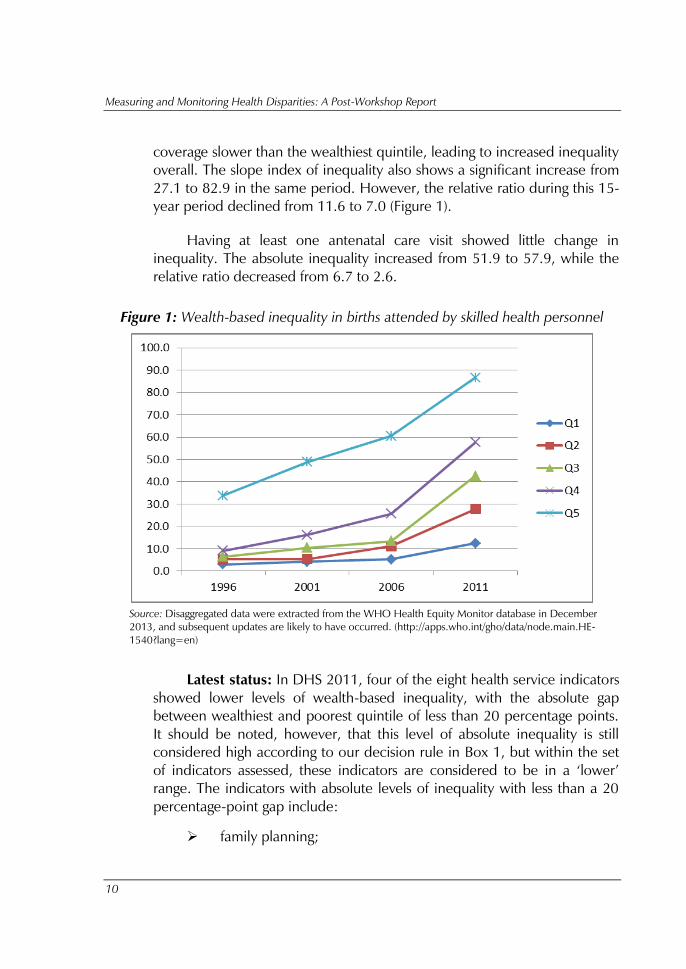
coverage slower than the wealthiest quintile, leading to increased inequality
overall. The slope index of inequality also shows a significant increase from
27.1 to 82.9 in the same period. However, the relative ratio during this 15-
year period declined from 11.6 to 7.0 (Figure 1).
Having at least one antenatal care visit showed little change in
inequality. The absolute inequality increased from 51.9 to 57.9, while the
relative ratio decreased from 6.7 to 2.6.
Figure 1: Wealth-based inequality in births attended by skilled health personnel
Source: Disaggregated data were extracted from the WHO Health Equity Monitor database in December
2013, and subsequent updates are likely to have occurred. (http://apps.who.int/gho/data/node.main.HE-
1540?lang=en)
Latest status: In DHS 2011, four of the eight health service indicators
showed lower levels of wealth-based inequality, with the absolute gap
between wealthiest and poorest quintile of less than 20 percentage points.
It should be noted, however, that this level of absolute inequality is still
considered high according to our decision rule in Box 1, but within the set
of indicators assessed, these indicators are considered to be in a ‘lower’
range. The indicators with absolute levels of inequality with less than a 20
percentage-point gap include:
family planning;
Inequality in Reproductive, Maternal and Child Health in Nepal
11
early breastfeeding;
DTP3 vaccination; and
oral rehydration therapy.
All of these indicators, on the one hand, had relative ratios of
inequality of less than 1.5. The lowest level of absolute and relative
inequality was in DTP3 vaccination coverage with a difference between
poorest and wealthiest of 10.3 percentage points and a relative ratio of 1.1.
On the other hand, four of the eight indicators had high levels of
wealth-based inequality in DHS 2011, with an absolute gap between
wealthiest and poorest quintiles of over 20 percentage points. These
indicators included:
one antenatal care visit;
antenatal care visit (four or more);
presence of a skilled birth attendant; and
care-seeking for pneumonia.
Three out of these four indicators had absolute gaps between 57
percentage points to 74 percentage points, with relative ratios ranging from
2.6 to 7.0. The indicator with the highest level of inequality was the
presence of a skilled birth attendant.
3.4 Inequality in child health outcomes by wealth 2001–2011
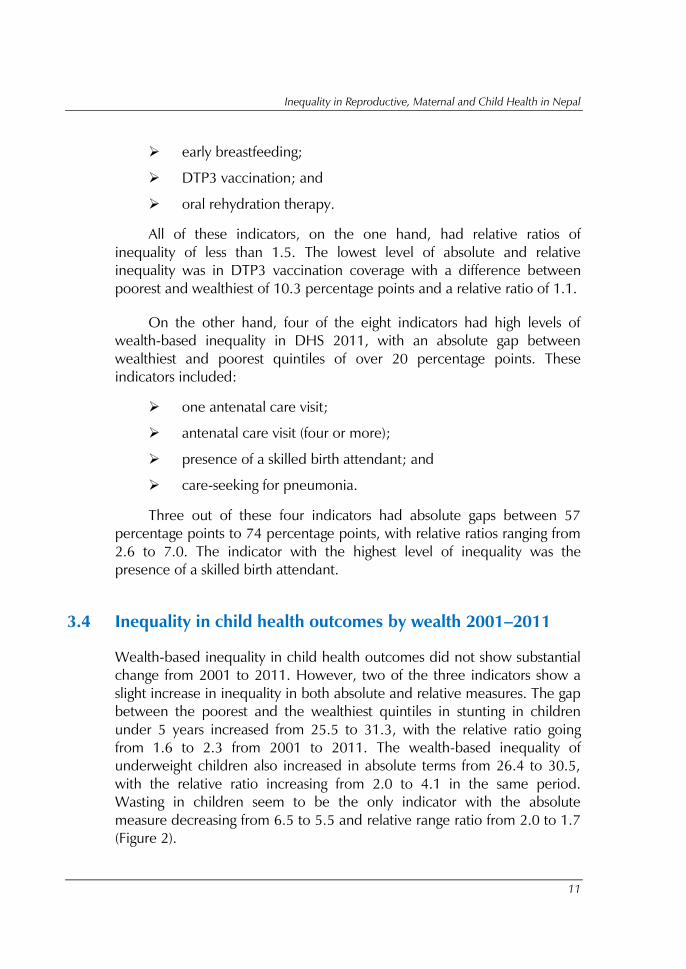
Wealth-based inequality in child health outcomes did not show substantial
change from 2001 to 2011. However, two of the three indicators show a
slight increase in inequality in both absolute and relative measures. The gap
between the poorest and the wealthiest quintiles in stunting in children
under 5 years increased from 25.5 to 31.3, with the relative ratio going
from 1.6 to 2.3 from 2001 to 2011. The wealth-based inequality of
underweight children also increased in absolute terms from 26.4 to 30.5,
with the relative ratio increasing from 2.0 to 4.1 in the same period.
Wasting in children seem to be the only indicator with the absolute
measure decreasing from 6.5 to 5.5 and relative range ratio from 2.0 to 1.7
(Figure 2).
Measuring and Monitoring Health Disparities: A Post-Workshop Report
12
Figure 2: Wealth-based inequality in wasting
Source: Disaggregated data were extracted from the WHO Health Equity Monitor database in
December 2013, and subsequent updates are likely to have occurred.
(http://apps.who.int/gho/data/node.main.HE-1540?lang=en)
Latest status: In DHS 2011, stunting and underweight of children
under 5 years still showed significant wealth-based inequality with the
absolute difference between the wealthiest and the poorest over 30
percentage points. The relative ratios of these two indicators were also
higher than 2. Wasting in children showed little wealth-based inequality
with the absolute difference of 5.5 percentage points and relative range
ratio of 1.7.
3.5 Inequality in health services by education, 1996–2011
Nepal achieved decreases in education-based inequality in three of the
eight health service indicators considered (Table 6). These three indicators
are as follow:
family planning needs satisfied;
antenatal care visit (one); and
DTP3 vaccination.
DTP3 vaccination is the health indicator that achieved the highest
level of inequality reduction in terms of absolute differences, from 32.9
Inequality in Reproductive, Maternal and Child Health in Nepal
13
percentage points in 1996 to 11.2 percentage points in 2011. The relative
ratio also reduced substantially, from 1.7 in 1996 to 1.1 in 2011. Having
one antenatal care visit also achieved great reduction in education-based
inequality during the 15-year period, particularly the relative ratio that
declined from 4.3 to 1.7, and absolute difference declined from 53.3
percentage points to 33.5 percentage points in 15 years.
On the contrary, having antenatal care of four or more visits had an
increase in education-based inequality in absolute terms. The absolute
difference between the higher educated and lower educated increased
from 35.2 percentage points to 45.8 percentage points, although the
relative ratio decreased significantly from 8.8 to 2.5, due to a faster increase
in coverage levels in the no education group.
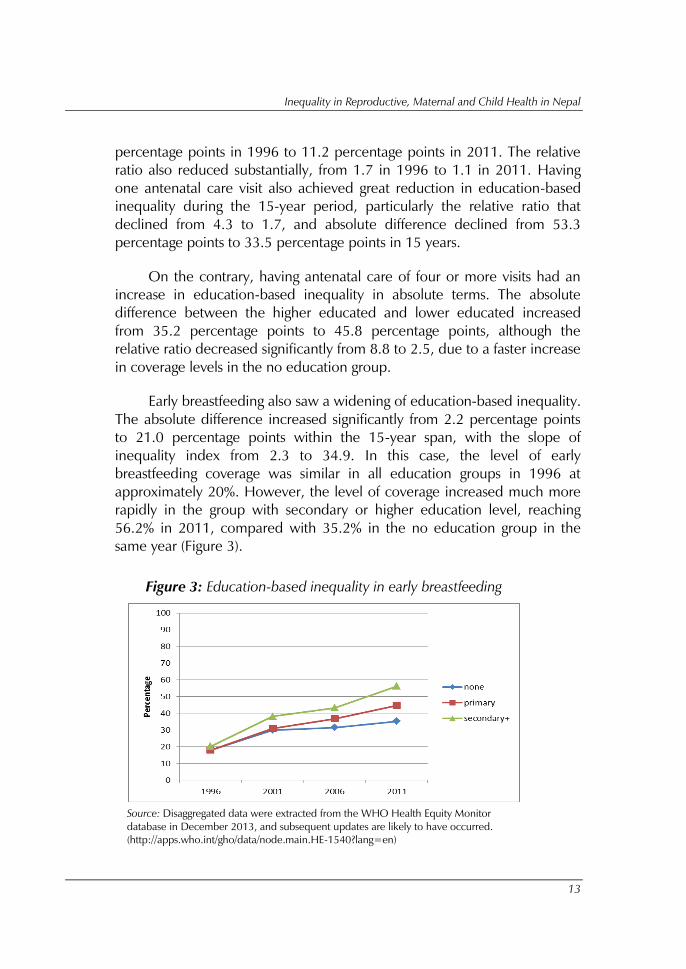
Early breastfeeding also saw a widening of education-based inequality.
The absolute difference increased significantly from 2.2 percentage points
to 21.0 percentage points within the 15-year span, with the slope of
inequality index from 2.3 to 34.9. In this case, the level of early
breastfeeding coverage was similar in all education groups in 1996 at
approximately 20%. However, the level of coverage increased much more
rapidly in the group with secondary or higher education level, reaching
56.2% in 2011, compared with 35.2% in the no education group in the
same year (Figure 3).
Figure 3: Education-based inequality in early breastfeeding
Source: Disaggregated data were extracted from the WHO Health Equity Monitor
database in December 2013, and subsequent updates are likely to have occurred.
(http://apps.who.int/gho/data/node.main.HE-1540?lang=en)
Measuring and Monitoring Health Disparities: A Post-Workshop Report
14
The presence of skilled birth attendant, care-seeking for pneumonia,
and oral rehydration therapy did not achieve any significant change in
education-based inequality. The change in absolute inequality during the
15-year period was smaller than 4 percentage points.
Latest status: In DHS 2011, four of the eight service indicators had an
absolute difference of education-based inequality of less than 15
percentage points. These four indicators are as follows:
family planning needs satisfied;
DTP3 vaccination;
care-seeking for pneumonia; and
oral rehydration therapy.
The relative ratios of these indicators also did not exceed 1.3. The
remaining four indicators had an absolute difference ranging from 21.0
percentage points to 40.9 percentage points with antenatal care of four or
more visits having the highest absolute inequality.
3.6 Inequality in child health outcomes by education 2001–2011
All three indicators of child health outcomes that were assessed achieved a
modest decrease in education-based inequality. All of these indicators saw
a reduction of approximately 3 percentage points. However, only wasting
of children under 5 years achieved a reduction in the relative range ratio
from 2.5 to 1.9.
Latest status: Underweight of children under 5 years had the highest
level of absolute and relative education-based inequality in DHS 2011, with
the absolute difference of 21.5 percentage points and relative range ratio of
2.3. Wasting in children under 5 years had the lowest absolute difference in
inequality at 6.3 percentage points.
3.7 Inequality in health services by area, 1996–2011
Nepal achieved important reductions in area-based inequality, particularly
in three of the eight health service indicators assessed (Table 7). These
Inequality in Reproductive, Maternal and Child Health in Nepal
15
indicators include satisfaction in family planning, one antenatal care visit
and DTP3 vaccination. All of these indicators were able to narrow the
absolute gap between rural and urban areas by more than 10 percentage
points from 1996 to 2011. DTP3 vaccination achieved the greatest
reduction in absolute inequality between rural and urban areas, where the
difference decreased from 25.4 percentage points in 1996 to 3.4
percentage points in 2011. The relative ratio for DTP3 vaccination also
declined from 1.5 to 1.0. Antenatal care of four or more visits also achieved
a reduction in area-based inequality, although the reduction was quite
modest, with the absolute inequality decreasing from 29.8 percentage
points to 24.4 percentage points.
However, there are three health service indicators that saw an
increase in area-based inequality. These indicators are early breastfeeding,
care-seeking for pneumonia and oral rehydration therapy. Early
breastfeeding and oral rehydration therapy had a low level of area-based
inequality in 1996 with an absolute inequality of 0.9 percentage point and
0 percentage point respectively. However, in 2011, the absolute inequality
of both indicators increased to 6.2 and 8.2 respectively. Interestingly, early
breastfeeding coverage started out to be slightly higher in the rural area in
1996, but the level of coverage increased rapidly in urban area leading to
an increased inequality.
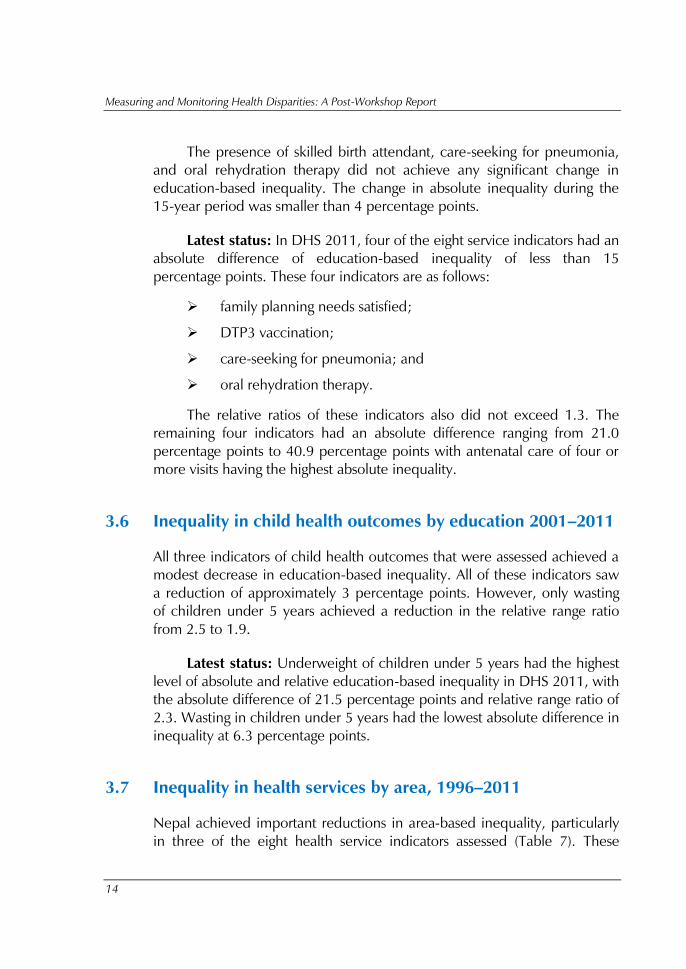
For presence of a skilled birth attendant, there was no significant
change in area-based inequality. The absolute difference between the two
areas slightly increased from 39.3 percentage points to 41.9 percentage
points. However, the relative ratio greatly reduced from 6.5 to 2.1 during
the 15-year period as the level of coverage in rural areas increased
relatively more rapidly than in urban areas (Figure 4).
Latest status: In DHS 2011, three of the eight health service
indicators had low area-based inequality of less than 10 percentage points.
DTP3 vaccination, in particular, had very low area-based inequality of 3.4
percentage points, and a relative ratio of 1.0. The other two indicators with
low area-based inequality are early breastfeeding (6.3 percentage points)
and oral rehydration therapy (8.2 percentage points). These two indicators
also had low relative ratio of 1.1 and 1.2 respectively.
Measuring and Monitoring Health Disparities: A Post-Workshop Report
16
Four health service indicators, however, still had area-based inequality
of more than 20 percentage points. The absolute difference ranged from
23.4 percentage points (care-seeking for pneumonia) to 41.9 percentage
points (presence of skilled birth attendant). The presence of skilled birth
attendant also had the highest relative ratio of 2.1.
Figure 4: Area-based inequality in presence of a skilled birth attendant
Source: Disaggregated data were extracted from the WHO Health Equity Monitor
database in December 2013, and subsequent updates are likely to have occurred.
(http://apps.who.int/gho/data/node.main.HE-1540?lang=en)
3.8 Inequality in child health outcomes by area 2001–2011
There was no significant change in the area-based inequality in any of the
child health outcomes indicators assessed. Underweight in children under 5
years had the highest change in area-based inequality, with the absolute
difference going from 16.1 percentage points to 13.6 percentage points.
Wasting in children under 5 years saw an increase in inequality in DHS
2006, where the absolute difference was 6.1.
Latest status: In DHS 2011, wasting in children under 5 years had
very low absolute area-based inequality of 2.7 percentage points. The level
of inequality in stunting and underweight of children are also considered to
be relatively low at 14.6 percentage points and 13.6 advantage points
respectively.
Inequality in Reproductive, Maternal and Child Health in Nepal
17
3.9 Inequality in health services by region 1996–20062
From DHS 1996 to DHS 2001, Nepal saw an increase in region-based
inequality, and a decline in inequality between DHS 2001 and 2006 for
the following indicators:
family planning needs satisfied;
antenatal care visit (four or more);
early breastfeeding;
oral rehydration therapy for children with diarrhoea.
For these four aforementioned indicators, relative region-based
inequality roughly followed the pattern of absolute inequality; that is, an
increase followed by a decline. However, the trends for individual regions
were inconsistent across indicators. For instance, it was observed that
between DHS 2001 and DHS 2006, coverage of early breastfeeding
dropped steeply in mid-western Nepal, while in the central region, it grew,
with the other three regions plateauing over a 5-year period. In contrast,
when looking at family planning satisfaction, we observed relative region-
based inequality declining over this period, albeit by a small margin. We
noted a steep increase in coverage of family planning services between
DHS 2001 and DHS 2006 in the far-western region.
A different trend was seen for a number of other indicators. From
DHS 1996 to DHS 2001, Nepal saw a slight decrease in region-based
inequality, followed by an increase in inequality between DHS 2001 and
2006 for the following indicators:
antenatal care visit (one);
care-seeking for pneumonia.
Relative inequality followed the trend of absolute inequality based on
region for these two indicators: inequality decreased slightly, and then
increased again in DHS 2006. We noted that the increase in inequality was
partly due to the steep increase in antenatal care (one visit) coverage in
2 To examine region-based inequality for health service indicators, we compared DHS 1996, DHS 2001 and DHS
2006 figures. We were unable to compare the five geographic regions in DHS 1996, DHS 2001 and DHS 2006
(eastern, central, western, mid-western and far-western) to the three topographical regions reported in DHS 2011
(mountain, hill and terai).
Measuring and Monitoring Health Disparities: A Post-Workshop Report
18
mid-western Nepal between DHS 2001 and DHS 2006, along with a
plateau in coverage across all other regions. Further, while pneumonia care
coverage increased in most regions, especially in the mid-western region,
coverage in the central region seemed to plateau between DHS 2001 and
DHS 2006.
A consistent trend of declining region-based inequality – in both
absolute and relative summary measures – from DHS 1996 to DHS 2006
was seen for DTP3 immunization. A different trend was observed for skilled
attendance at birth: absolute region-based inequality increased while
relative inequality decreased. In the case of this last indicator, it may be
noted that while coverage increased in central, western and mid-western
regions of Nepal between DHS 2001 and DHS 2006, it plateaued in the
other two regions, even declining slightly in eastern Nepal.
Latest status: Region-based inequality in absolute terms – range
differences over 10 and between-group variance at or surpassing 30 – was
observed in DHS 2006 for the following indicators:
family planning needs satisfied;
antenatal care visit (one);
skilled attendance at birth; and
care-seeking for pneumonia.
Absolute inequality by region was relatively less for the following
indicators:
antenatal care visit (four or more);
early breastfeeding;
DTP3 immunization; and
oral rehydration therapy for children with diarrhoea.
We observed high-range differences for three of the eight indicators
(antenatal care visit (one); skilled attendance at birth; and care-seeking for
pneumonia) thereby Theil index figures were not particularly high for any of
the eight, suggesting that when population sizes of each region are
considered, relative inequality by region is not high.
Inequality in Reproductive, Maternal and Child Health in Nepal
19
3.10 Inequality in child nutrition outcomes by region 2001–20063
From DHS 2001 to DHS 2006, Nepal saw a slight increase in absolute
region-based inequality, a considerable increase in absolute region-based
inequality, and a decline in absolute region-based inequality in wasting.
Latest status: The degree of both absolute and relative region-based
inequality in under-5 stunting was alarmingly high according to DHS 2006
(the range difference was 18.2, the between-group variance was 31.2, the
range ratio 1.5 and the Theil index score was 180.1). Underweight
prevalence had moderate region-based inequality – both absolute and
relative. Under-5 wasting in Nepal is characterized as having a high range
ratio (1.7), although the Theil index figure (0.02) suggests that region-based
relative inequality is not a major concern.
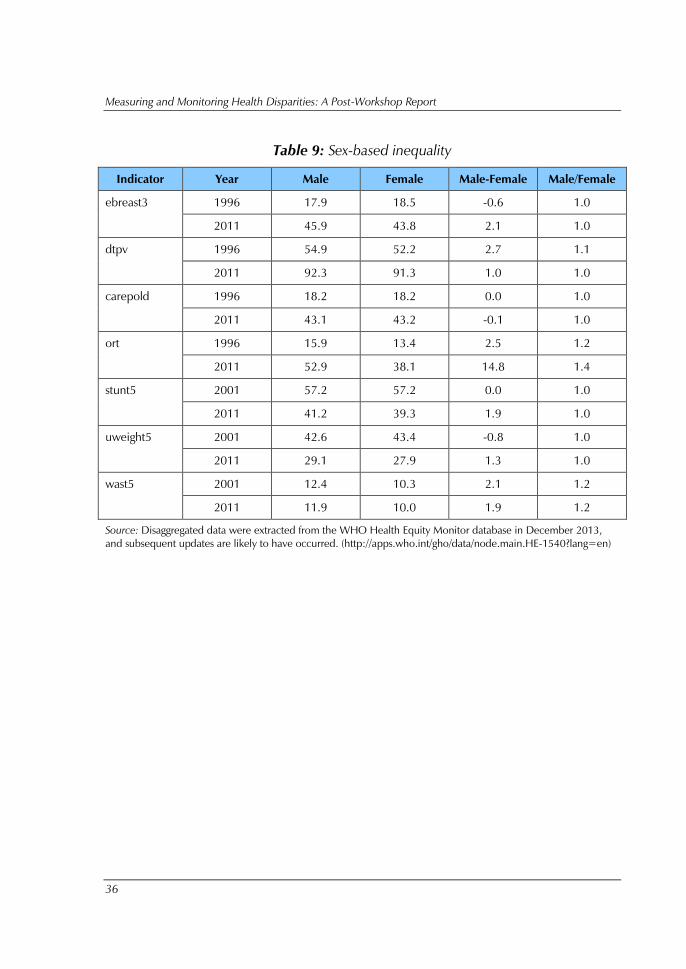
3.11 Inequality in health services by sex, 1996–2011
From DHS 1996 to DHS 2011, we found very little change in sex-based
inequality across the four measured indicators. In fact, the small inequalities
that existed in DHS 2001 and DHS 2006 between males and females
declined by DHS 2011 in two of them (DTP3 immunization and care-
seeking for pneumonia).
The one exception was oral rehydration therapy for children with
diarrhoea, where inequality appears to have increased (Figure 5). We found
that while in DHS 1996, coverage for males was slightly higher than that of
females (15.9% versus 13.4%) as coverage grew for both sexes, so did
inequality over the subsequent 15 years (52.9% coverage for males versus
38.1% coverage for females in DHS 2011).
3 To examine region-based inequality for child nutrition outcome indicators, we compared DHS 2001 and DHS
2006 figures. No regional figures for stunting, underweight and wasting were publicly available for DHS 1996.
Further, we were unable to compare the five geographic regions in DHS 2001 and DHS 2006 (eastern, central,
western, mid-western and far-western) to the three topographical regions reported in DHS 2011 (mountain, hill
and terai).
Measuring and Monitoring Health Disparities: A Post-Workshop Report
20
Figure 5: Sex-based inequality in ORT coverage
0
10
20
30
40
50
60
70
80
90
100
1996 2001 2006 2011
Pe
rce
nta
ge
female
male
Source: Disaggregated data were extracted from the WHO Health Equity Monitor database in December
2013, and subsequent updates are likely to have occurred. (http://apps.who.int/gho/data/node.main.HE-
1540?lang=en)
Latest status: In DHS 2011, virtually no absolute or relative sex-based
inequality was observed in three of the four indicators. In the case of oral
rehydration therapy, however, coverage for males was found to be higher
compared with females; the range difference between the two was 14.8
while the range ratio was 1.4.
3.12 Inequality in child nutrition outcomes by sex 2001–2011
Between DHS 2001 and DHS 2011, we found no sex-based absolute or
relative inequality in stunting, underweight or wasting.
Latest status: In DHS 2011, there was no absolute or relative
inequality by sex in any of the three indicators of child nutrition assessed.

Inequality in Reproductive, Maternal and Child Health in Nepal
21
4. Benchmarking of Nepal against other countries
4.1 National coverage
Nepal was benchmarked against 13 other low- and middle-income
countries in the Asia-Pacific Region. These countries include Bangladesh,
Bhutan, Cambodia, India, Indonesia, Lao People’s Democratic Republic,
Maldives, Mongolia, Philippines, Thailand, Timor-Leste, Vanuatu and Viet
Nam.
Nepal was very successful in achieving a high national coverage in
DTP3 vaccination. Compared with other countries in the Region, it has the
fifth highest level of coverage at 91.8%. This level of coverage is
comparable with four other countries with the highest coverage levels in the
Region (Bangladesh, Maldives, Mongolia and Thailand).
However, Nepal ranked on the lower end in seven of the eight health
service indicators assessed; it was in the bottom third or worse in these
seven indicators. For care-seeking for pneumonia, Nepal ranked better than
only one other country, Bangladesh. For antenatal care of one visit,
satisfaction in family planning and presence of skilled birth attendant, Nepal
ranked better than two other countries in terms of coverage; conversely,
antenatal care of four or more visits, early breastfeeding and oral
rehydration therapy ranked better than three other countries.
4.2 Absolute and relative inequality
When benchmarked against other similar countries in the Region in terms of
wealth-based inequality, Nepal ranked on the lower end in both absolute
and relative terms for most health service indicators, with the exception of
DTP3 vaccination, where Nepal was among the countries with the least
absolute and relative wealth-based inequality. Only Bangladesh, Maldives,
Mongolia and Thailand fared better in terms of inequality (Figure 6).
Measuring and Monitoring Health Disparities: A Post-Workshop Report
22
Figure 6: Benchmarking of DTP3 vaccination
Source: Data were derived from the re-analysis of publicly available Demographic and Health Surveys (DHS)
micro-data, using the standard indicator definitions as published in DHS documentation. The analysis was carried
out by the International Center for Equity in Health based in the Federal University of Pelotas, Brazil. Graphs were
created at World Health Organization headquarters and used during the workshop.
Nepal, however, ranked towards the bottom end in terms of wealth-
based inequality for other health service indicators including antenatal care
(both one and four visits), care-seeking for pneumonia, satisfaction in family
planning and presence of skilled birth attendant. Inequalities in early
breastfeeding and oral rehydration therapy were more difficult to
benchmark, since different countries had different inequality patterns
(Figures 7 and 8).
For Nepal, inequality arose since coverage was concentrated in the
higher quintile groups; for countries such as Maldives, however, services
were concentrated in the lower quintile groups. In Maldives and Viet Nam,
for example, both early breastfeeding and oral rehydration therapy had a
higher level of coverage among poorer quintiles than in the wealthier
quintiles; the opposite is true for Nepal. Regardless of where the
concentration lies, there exists inequality that must be addressed.

Inequality in Reproductive, Maternal and Child Health in Nepal
23
Figure 7: Benchmarking of early breastfeeding
Source: Data were derived from the re-analysis of publicly available Demographic and Health Surveys (DHS)
micro-data, using the standard indicator definitions as published in DHS documentation. The analysis was carried
out by the International Center for Equity in Health based in the Federal University of Pelotas, Brazil. Graphs were
created at World Health Organization headquarters and used during the workshop.
Figure 8: Benchmarking of oral rehydration therapy
Source: Data were derived from the re-analysis of publicly available Demographic and Health Surveys (DHS)
micro-data, using the standard indicator definitions as published in DHS documentation. The analysis was carried
out by the International Center for Equity in Health based in the Federal University of Pelotas, Brazil. Graphs were
created at World Health Organization headquarters and used during the workshop.
Measuring and Monitoring Health Disparities: A Post-Workshop Report
24
5. Situation analysis, 1996–2011
5.1 Priority health services indicators
The most inequitable health service indicator across all equity stratifiers was
skilled attendance at birth: wealth, education and region-related absolute
inequality were high. In fact, a 74.2 percentage-point difference in
coverage was found between poorest and wealthiest quintiles according to
DHS 2011 (Table 5). Adjusting for population size, this indicator remains
highly unequal: the slope index of inequality was high as well (82.9). The
range ratio of 7 was the highest across all service indicators as was the
relative concentration index of 0.3. We also observed a 40.9 and 41.9
percentage-point difference, respectively, for education and area-based
inequality for skilled attendance at birth (Tables 6 and 7).
When looking at trend data, we noted that absolute inequality was
increasing for skilled birth attendance across all relevant stratifiers: wealth,
education, area and region. Absolute inequality also seemed to be
increasing for antenatal care (at least four visits). For this indicator, the range
difference across the three education categories increased from 35.2 in
DHS 1996 to 45.8 in DHS 2011, while the slope index of inequality
increased from 45.5 in DHS 1996 to 76.5 in DHS 2011. While relative
inequality by wealth and education were also increasing in the 15-year
period studied, we found that area and region-based inequality declined
during the same period.
For early initiation of breastfeeding, wealth and education-based
absolute inequality increased between DHS 1996 and DHS 2011, in both
absolute and relative terms. Area-based inequality also registered an
increase reflected in a range difference between urban and rural of 0.9 in
DHS 1996 increasing to a range difference between urban and rural of 6.2
in DHS 2011; this was reflected in a minor increase in relative inequality
over the same period. Sex-based absolute inequality also increased by a
small margin; the difference between males and females went from 0.56 in
DHS 1996 to 2.1 in DHS 2011. For this indicator, however, absolute and
relative inequality by region declined between DHS 1996 and DHS 2006
(data for DHS 2011 were unavailable).
Inequality in Reproductive, Maternal and Child Health in Nepal
25
We also noted that over time, while wealth and education-related
inequality were not emerging as urgent priority areas for action to address
inequality, the same could not be said for pneumonia care-seeking or ORT
coverage indicator. For these indicators, we found that area and region
inequalities were apparent. For instance, the range difference in care-
seeking for pneumonia between urban and rural areas more than doubled
from DHS 1996 to DHS 2011, while between-group variance across
regions for this same indicator grew more than five-fold between DHS
1996 and DHS 2006.
DTP3 immunization showed declines in both absolute and relative
inequality from DHS 1996 onwards, suggesting that by DHS 2011, once
the threshold of 85% coverage was achieved, the absolute wealth-related
inequality reduced by one fourth over a 15-year period (from 41.1 in DHS
1996 to 10.3 in DHS 2011). The relative wealth-related inequality, as
measured by range ratio, also halved (from 2.0 in DHS 1996 to 1.1 in DHS
2011). A similar trend was seen across stratifiers. In DHS 1996, although
less than 50% of those with no maternal education had received DTP
immunization, the proportion grew to 86.1% in DHS 2011. Coverage was
above 95% for those with higher levels of education. In terms of inequality,
this translated into major reductions in absolute and relative inequality (as
indicated by a slope index of inequality reduction from 52.9 in DHS 1996
to 19.1 in DHS 2011 and a relative concentration index of 1 in DHS 1996
and nearing 0 in DHS 2011).
Other than this indicator, we also noted that inequality was reduced
for the indicator measuring satisfaction with family planning services, which
saw reductions in inequality in all stratifiers except for the Region, and a
ceiling effect of coverage among those with secondary or higher levels of
maternal education, such that the slope index of inequality as per DHS
2011, was 17.8.
When benchmarked on wealth-based inequality against other
countries in the Region, Nepal fared poorly on all indicators but DTP3
immunization. From this vantage, all seven health service indicators
appeared to require immediate action to address both absolute and relative
inequality.
Measuring and Monitoring Health Disparities: A Post-Workshop Report
26
5.2 Priority equity stratifiers in health services
When looking at latest status, absolute inequality across stratifiers tended to
trigger the greatest call for action (Table 1). More specifically, wealth- and
education-related absolute inequality were the highest prioritized on
average, for six of the eight indicators. Relative inequality was identified as
a medium priority for wealth, education and regional stratifiers.
Looking at trend data, education-related absolute inequality emerged
as the area in need for most urgent action, followed by wealth and region
(Table 2). For these stratifiers, we noted that at least two indicators required
urgent action, and six or more indicators required some action. Area-based
inequality emerged as a priority for action over time for only three
indicators, though it is noteworthy that these pertain to skilled birth
attendance, pneumonia health-seeking and access to ORT - all indicators
that require the presence of key infrastructure and health delivery
processes, particularly in rural areas.
Sex-related inequality was seen as less in need for action. In fact, apart
from access to oral rehydration therapy, range differences were never
higher than 3 percentage points for males compared with females and for
none of the eight indicators analysed did range ratios exceed 1.5,
considering both DHS 1996 and DHS 2011.
5.3 Priority inequalities in child nutrition outcomes
The prevalence of stunting, underweight and wasting among children under
5 years were assessed by wealth, education, sex, area and region. Wealth-
related inequality, in both absolute and relative terms, was highest across all
three indicators for Nepal, with slope indices of inequality above 30 points
for under 5 stunting and underweight and over 5 for wasting as per DHS
2011. Education-related absolute inequality was also of concern across
indicators, and further, area-based and regional inequality were also of
some concern, although this trend varied somewhat over time, and by
indicator.
A key observation from trend data was that wealth-related inequalities
in stunting appeared to be on the rise in the decade between DHS 2001
Inequality in Reproductive, Maternal and Child Health in Nepal
27
and DHS 2011, with a disparity between the richest and poorest quintiles
increasing from 25.5 percentage points in DHS 2001 to 31.2 percentage
points in DHS 2011. This was the highest margin of inequality seen in
nutrition indicators. Regional inequality for this indicator showed a similar
trend, although the reference points were DHS 2001 and DHS 2006:
between-group variance grew from 15.2 in DHS 2001 to 31.3 in DHS
2006, while the Theil index registered an increase from 0.002 in DHS 2001
to 0.01 in DHS 2006.
Underweight showed a decadal doubling of relative wealth-related
inequality (represented by a range ratio going from 2.0 in DHS 2001 to 4.1
in DHS 2011 and the relative concentration index increasing from -0.1 to -
0.2).
For no stratifier was wasting identified as needing immediate action,
although it was thought that wealth, education and area-based inequalities
in wasting do require policy attention. For instance, both absolute and
relative area-based inequality in wasting appear to be on the rise in Nepal,
evidenced by an urban-rural gap increasing from 2.2 percentage points in
DHS 2001 to 2.7 percentage points in DHS 2011 (the range ratio also
increased from 1.2 in DHS 2001 to 1.3 in DHS 2011).
As in the case of health service indicators, sex-based inequalities were
not of concern for any of the child nutrition indicators.
Measuring and Monitoring Health Disparities: A Post-Workshop Report
28
6. Data tables
Tab
le 1
: Situatio
n analy
sis
of la
test status
Source: P
artic
ipan
ts o
f W
HO
w
orksh
op
on
M
easu
rin
g and
M
on
ito
rin
g H
ealth
In
eq
ualitie
s, h
eld
in
Ap
ril 2
01
4 in
Jaip
ur, In
dia
.
In
dic
ato
r
Natio
nal
average
In
eq
uality
Average
ineq
uality s
co
re
Wealt
h
Ed
ucatio
n
Sex
Area
Regio
n
Absolute
Relative
Absolute
Relative
Absolute
Relative
Absolute
Relative
Absolute
Relative
Absolute
Relative
Fam
ily p
lannin
g n
eed
s s
atisfied
3
2
1
2
1
2
1
2
1
2.0
1
.0
Ante
nata
l care (at
least
one v
isit)
3
3
2
3
2
2
1
2
2
2.5
1
.8
Ante
nata
l care (at
least
fou
r v
isits)
3
3
2
3
2
2
1
1
1
2.3
1
.5
Bir
ths a
ttend
ed
by s
kille
d h
ealth
personnel
3
3
3
3
2
3
2
2
2
2.8
2
.3
Early
initia
tion o
f b
reastf
eed
ing
3
2
1
3
2
1
1
2
1
2
1
2.0
1
.2
DTP
3 im
muniz
ation
1
1
1
1
1
1
1
1
1
2
1
1.2
1
.0
Care-seekin
g f
or p
neu
monia
3
3
1
2
1
1
1
3
2
2
2
2.2
1
.4
Oral rehyd
ration t
herap
y f
or
child
ren w
ith d
iarrhoea
1
2
2
2
1
2
1
2
1
2
2
2.0
1
.4
RM
CH
inte
rventions
2.5
2
.4
1.6
2
.4
1.5
1
.3
1.0
2
.1
1.3
1
.9
1.5
Stu
nting (heig
ht
for a
ge) in
child
ren
und
er 5
years
3
3
2
2
2
1
1
2
2
2
2
2.0
1
.8
Und
erw
eig
ht
(weig
ht
for a
ge) in
child
ren u
nd
er 5
years
2
3
3
3
2
1
1
2
2
2
1
2.2
1
.8
Wasting (w
eig
ht
for h
eig
ht)
in
child
ren u
nd
er 5
years
3
1
2
2
2
1
1
1
1
2
2
1.4
1
.6
CH
ou
tcom
es
2.7
2
.3
2.3
2
.3
2.0
1
.0
1.0
1
.7
1.7
2
.0
1.7
Inequality in Reproductive, Maternal and Child Health in Nepal
29
Tab
le 2
: Situatio
n analy
sis
of tim
e trend
s
Source: P
artic
ipan
ts o
f W
HO
w
orksh
op
on
M
easu
rin
g and
M
on
ito
rin
g H
ealth
In
eq
ualitie
s, h
eld
in
Ap
ril 2
01
4 in
Jaip
ur, In
dia
.
In
dic
ato
r
Natio
nal
average
In
eq
uality
Wealt
h
Ed
ucatio
n
Sex
Area
Regio
n
Absolute
Relative
Absolute
Relative
Absolute
Relative
Absolute
Relative
Absolute
Relative
Fam
ily p
lannin
g n
eed
s s
atis
fied
1
1
1
3
1
1
1
2
2
Antenatal care (at least o
ne vis
it)
1
2
1
2
1
1
1
2
2
Antenatal care (at least f
ou
r v
isits)
1
3
1
3
1
1
1
1
1
Bir
ths a
ttend
ed
by s
kille
d health p
ersonnel
2
3
2
3
1
3
1
3
2
Early
initia
tio
n o
f b
reastfe
ed
ing
1
3
2
3
2
1
1
2
1
2
2
DTP
3 im
muniz
atio
n
1
1
1
1
1
1
1
1
1
1
1
Care-seekin
g f
or p
neu
monia
1
2
2
2
1
2
2
3
2
3
2
Oral rehyd
ratio
n t
herap
y fo
r c
hild
ren w
ith d
iarrhoea
2
2
1
1
1
2
2
3
2
2
1
RM
CH
interventio
ns
2
.1
1.4
2
.3
1.1
1
.5
1.5
1
.9
1.3
2
.0
1.6
Stu
ntin
g (heig
ht f
or a
ge) in c
hild
ren u
nd
er 5
years
1
3
3
1
1
1
1
2
2
3
3
Und
erw
eig
ht (
weig
ht f
or a
ge) in c
hild
ren u
nd
er 5
years
1
2
3
1
1
1
1
2
3
2
2
Wastin
g (w
eig
ht fo
r h
eig
ht)
in c
hild
ren u
nd
er 5
years
2
2
2
2
1
1
1
2
2
1
1
CH
ou
tcom
es
2
.3
2.7
1
.3
1.0
1
.0
1.0
2
.0
2.3
2
.0
2.0
Measuring and Monitoring Health Disparities: A Post-Workshop Report
30
Table 3: Situation analysis of benchmarking latest status
Indicator National
average
Inequality
Wealth
Absolute Relative
Family planning needs satisfied 3 3 3
Antenatal care (at least one visit) 3 3 3
Antenatal care (at least four visits) 3 3 3
Births attended by skilled health personnel 3 3 3
Early initiation of breastfeeding 3 3 3
DTP3 immunization 1 1 1
Care-seeking for pneumonia 3 3 3
Oral rehydration therapy for children with diarrhoea 1 3 3
RMCH interventions
3 3
Stunting (height for age) in children under 5 years 3 3 2
Underweight (weight for age) in children under 5 years 2 3 2
Wasting (weight for height) in children under 5 years 3 2 3
CH outcomes
2.7 2.3
Source: Participants of WHO workshop on Measuring and Monitoring Health Inequalities, held in April 2014 in
Jaipur, India.
Inequality in Reproductive, Maternal and Child Health in Nepal
31
Table 4: Nepal national coverage
Indicator Year Percent Coverage
fps 1996 47.6
2011 65.0
anc13 1996 23.7
2011 59.4
anc43 1996 9.0
2011 51.6
sba3 1996 9.6
2011 40.5
ebreast3 1996 18.2
2011 44.9
dtpv 1996 53.5
2011 91.8
carepold 1996 18.2
2011 43.2
ort 1996 14.7
2011 46.7
stunt5 2001 57.2
2011 40.3
uweight5 2001 43
2011 28.5
wast5 2001 11.3
2011 10.9
Source: Data were derived from the re-analysis of publicly available Demographic and Health Surveys (DHS)
micro-data, using the standard indicator definitions as published in DHS documentation. The analysis was carried
out by the International Center for Equity in Health based in the Federal University of Pelotas, Brazil.
Measuring and Monitoring Health Disparities: A Post-Workshop Report
32
Table 5: Wealth-based inequality
Indicator Year Q1 Q2 Q3 Q4 Q5 Q5-
Q1 Q5/Q1
Slope
index of
inequality
(SII)
Relative
concentration
index (RCI)
fps 1996 32.7 40.7 44.5 48.1 67.7 35.1 2.1 40.5 0.146
2011 57.0 62.5 63.3 66.5 73.2 16.2 1.3 18.0 0.048
anc13 1996 9.1 17.1 19.7 27.1 61.0 51.9 6.7 49.9 0.352
2011 35.2 47.3 60.8 77.8 93.1 57.9 2.6 70.3 0.199
anc43 1996 2.8 4.6 5.8 8.6 31.5 28.7 11.3 25.5 0.493
2011 29.9 42.0 49.3 66.2 87.5 57.6 2.9 65.2 0.208
sba3 1996 2.9 5.2 6.4 9.1 33.7 30.8 11.6 27.1 0.481
2011 12.4 27.7 42.6 57.6 86.6 74.2 7.0 82.9 0.332
ebreast3* 1996 21.0 17.5 16.7 15.5 19.8 -1.2 0.9 -3.8 -0.041
2011 38.4 40.7 44.6 52.4 53.2 14.8 1.4 20.1 0.072
dtpv 1996 40.5 46.7 51.8 61.1 81.6 41.1 2.0 43.0 0.133
2011 88.1 89.7 90.5 96.7 98.4 10.3 1.1 12.6 0.024
carepold * 1996 11.6 16.6 18.6 22.4 26.6 15 2.3 17.5 0.166
2011 30.2 35.1 54.6 45.6 50.1 19.9 1.7 25.3 0.092
ort* 1996 11.2 12.4 16.0 18.4 20.1 8.9 1.8 11.5 0.134
2011 46.5 45.6 38.0 56.4 54.1 7.6 1.2 9.2 0.043
stunt5 2001 67.7 61.1 54.1 53.3 42.2 -25.5 0.6 -28.3 -0.082
2011 56.2 45.3 35.0 30.0 24.9 -31.3 0.4 -39.6 -0.168
uweight5 2001 51.8 46.7 44.7 38.1 25.4 -26.4 0.5 -27.9 -0.105
2011 40.4 32.0 28.4 21.9 9.9 -30.5 0.2 -33.3 -0.197
wast5 2001 12.9 13.1 12.1 9.9 6.6 -6.3 0.5 -6.9 -0.095
2011 12.3 11.5 13.0 8.1 7.5 -4.8 0.6 -5.6 -0.090
Source: Disaggregated data were extracted from the WHO Health Equity Monitor database in December 2013,
and subsequent updates are likely to have occurred. (http://apps.who.int/gho/data/node.main.HE-1540?lang=en)
Inequality in Reproductive, Maternal and Child Health in Nepal
33
Table 6: Education-based inequality
Indicator Year None Primary Secondary+ Secondary-
None
Secondary/
None SII RCI
fps 1996 45.9 46.0 60.9 15 1.3 16.1 0.031
2011 70.3 61.1 60.0 -10.3 0.9 -17.8 -0.039
anc13 1996 16.1 39.6 69.4 53.3 4.3 76.8 0.269
2011 45.3 54.0 78.8 33.5 1.7 55.1 0.133
anc43 1996 4.5 14.7 39.7 35.2 8.8 45.5 0.424
2011 30.1 53.2 75.9 45.8 2.5 76.5 0.213
sba3 1996 5.1 14.9 42.7 37.6 8.4 46.8 0.403
2011 23.8 35.1 64.7 40.9 2.7 66.8 0.236
ebreast3 1996 18.0 18.0 20.2 2.2 1.1 2.3 0.010
2011 35.2 44.7 56.2 21 1.6 34.9 0.112
dtpv 1996 48.5 68.3 81.4 32.9 1.7 52.9 0.078
2011 86.1 95.3 97.3 11.2 1.1 19.1 0.030
ort 1996 12.8 22.0 25.1 12.3 2.0 20.7 0.108
2011 43.1 42.4 55.1 12 1.3 17.9 0.1054
stunt5 2001 61.4 50.5 39.8 -21.6 0.6 -32.9 -0.1057
2011 47.5 41.2 29.3 -18.2 0.6 -29.6 -0.104
uweight5 2001 47.8 34.5 23.9 -23.9 0.5 -37.4 -0.1086
2011 37.9 26.1 16.4 -21.5 0.4 -35.9 -0.2178
wast5 2001 12.8 9.3 5.1 -7.7 0.4 -11.2 -0.1099
2011 13.4 11.6 7.1 -6.3 0.5 -10.1 -0.131
Source: Disaggregated data were extracted from the WHO Health Equity Monitor database in December 2013,
and subsequent updates are likely to have occurred. (http://apps.who.int/gho/data/node.main.HE-1540?lang=en)
Measuring and Monitoring Health Disparities: A Post-Workshop Report
34
Table 7: Area-based inequality
Indicator Year Rural
Coverage
Urban
Coverage
Urban-
Rural Urban/Rural
fps 1996 45.1 69.8 24.7 1.5
2011 63.4 75.5 12.1 1.2
anc13 1996 20.7 67.3 46.6 3.3
2011 56.2 89.6 33.4 1.6
anc43 1996 7.0 36.8 29.8 5.3
2011 49.2 73.6 24.4 1.5
sba3 1996 7.1 46.5 39.4 6.5
2011 36.7 78.5 41.8 2.1
ebreast3 1996 18.2 17.4 -0.8 1
2011 44.3 50.5 6.2 1.1
dtpv 1996 52.0 77.4 25.4 1.5
2011 91.5 94.9 3.4 1
carepold 1996 17.6 28.5 10.9 1.6
2011 40.6 64.0 23.4 1.6
ort 1996 14.7 14.7 0 1
2011 45.9 54.1 8.2 1.2
stunt5 2001 58.3 42.7 -15.6 0.7
2011 41.6 26.9 -14.7 0.6
uweight5 2001 44.1 28.0 -16.1 0.6
2011 29.8 16.2 -13.6 0.5
wast5 2001 11.5 9.3 -2.2 0.8
2011 11.2 8.5 -2.7 0.8
Source: Disaggregated data were extracted from the WHO Health Equity Monitor database in December 2013,
and subsequent updates are likely to have occurred. (http://apps.who.int/gho/data/node.main.HE-1540?lang=en)
Inequality in Reproductive, Maternal and Child Health in Nepal
35
Tab
le 8
: Regio
n-based
in
equality
Source: D
ata w
ere d
eriv
ed
fro
m th
e r
e-an
aly
sis
of p
ublicly
availab
le D
em
ograph
ic and
H
ealth
Su
rveys (D
HS) m
icro
-d
ata, u
sin
g th
e stand
ard
in
dic
ato
r
defin
itio
ns as p
ub
lish
ed
in
DH
S d
ocu
men
tatio
n. Th
e an
aly
sis
w
as carrie
d o
ut b
y th
e In
tern
atio
nal C
en
ter fo
r Eq
uity in
H
ealth
based
in
the Fed
eral U
niv
ersity o
f
Pelo
tas, B
razil.
Tab
le 8
: Regio
n-based
in
equality
Measuring and Monitoring Health Disparities: A Post-Workshop Report
36
Table 9: Sex-based inequality
Indicator Year Male Female Male-Female Male/Female
ebreast3 1996 17.9 18.5 -0.6 1.0
2011 45.9 43.8 2.1 1.0
dtpv 1996 54.9 52.2 2.7 1.1
2011 92.3 91.3 1.0 1.0
carepold 1996 18.2 18.2 0.0 1.0
2011 43.1 43.2 -0.1 1.0
ort 1996 15.9 13.4 2.5 1.2
2011 52.9 38.1 14.8 1.4
stunt5 2001 57.2 57.2 0.0 1.0
2011 41.2 39.3 1.9 1.0
uweight5 2001 42.6 43.4 -0.8 1.0
2011 29.1 27.9 1.3 1.0
wast5 2001 12.4 10.3 2.1 1.2
2011 11.9 10.0 1.9 1.2
Source: Disaggregated data were extracted from the WHO Health Equity Monitor database in December 2013,
and subsequent updates are likely to have occurred. (http://apps.who.int/gho/data/node.main.HE-1540?lang=en)
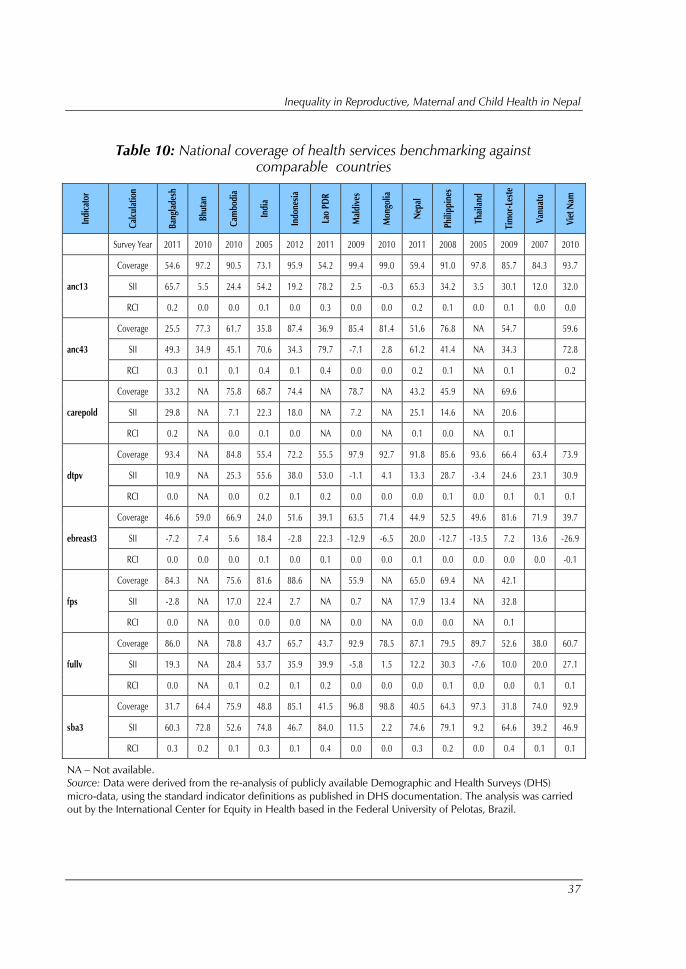
Inequality in Reproductive, Maternal and Child Health in Nepal
37
Table 10: National coverage of health services benchmarking against
comparable countries
Ind
icato
r
Calc
ula
tio
n
Ban
gla
desh
Bh
uta
n
Cam
bo
dia
Ind
ia
Ind
on
esia
Lao
PD
R
Mald
ives
Mo
ngo
lia
Nep
al
Ph
ilip
pin
es
Th
ail
an
d
Tim
or-Leste
Van
uatu
Vie
t N
am
Survey Year 2011 2010 2010 2005 2012 2011 2009 2010 2011 2008 2005 2009 2007 2010
anc13
Coverage 54.6 97.2 90.5 73.1 95.9 54.2 99.4 99.0 59.4 91.0 97.8 85.7 84.3 93.7
SII 65.7 5.5 24.4 54.2 19.2 78.2 2.5 -0.3 65.3 34.2 3.5 30.1 12.0 32.0
RCI 0.2 0.0 0.0 0.1 0.0 0.3 0.0 0.0 0.2 0.1 0.0 0.1 0.0 0.0
anc43
Coverage 25.5 77.3 61.7 35.8 87.4 36.9 85.4 81.4 51.6 76.8 NA 54.7
59.6
SII 49.3 34.9 45.1 70.6 34.3 79.7 -7.1 2.8 61.2 41.4 NA 34.3
72.8
RCI 0.3 0.1 0.1 0.4 0.1 0.4 0.0 0.0 0.2 0.1 NA 0.1
0.2
carepold
Coverage 33.2 NA 75.8 68.7 74.4 NA 78.7 NA 43.2 45.9 NA 69.6
SII 29.8 NA 7.1 22.3 18.0 NA 7.2 NA 25.1 14.6 NA 20.6
RCI 0.2 NA 0.0 0.1 0.0 NA 0.0 NA 0.1 0.0 NA 0.1
dtpv
Coverage 93.4 NA 84.8 55.4 72.2 55.5 97.9 92.7 91.8 85.6 93.6 66.4 63.4 73.9
SII 10.9 NA 25.3 55.6 38.0 53.0 -1.1 4.1 13.3 28.7 -3.4 24.6 23.1 30.9
RCI 0.0 NA 0.0 0.2 0.1 0.2 0.0 0.0 0.0 0.1 0.0 0.1 0.1 0.1
ebreast3
Coverage 46.6 59.0 66.9 24.0 51.6 39.1 63.5 71.4 44.9 52.5 49.6 81.6 71.9 39.7
SII -7.2 7.4 5.6 18.4 -2.8 22.3 -12.9 -6.5 20.0 -12.7 -13.5 7.2 13.6 -26.9
RCI 0.0 0.0 0.0 0.1 0.0 0.1 0.0 0.0 0.1 0.0 0.0 0.0 0.0 -0.1
fps
Coverage 84.3 NA 75.6 81.6 88.6 NA 55.9 NA 65.0 69.4 NA 42.1
SII -2.8 NA 17.0 22.4 2.7 NA 0.7 NA 17.9 13.4 NA 32.8
RCI 0.0 NA 0.0 0.0 0.0 NA 0.0 NA 0.0 0.0 NA 0.1
fullv
Coverage 86.0 NA 78.8 43.7 65.7 43.7 92.9 78.5 87.1 79.5 89.7 52.6 38.0 60.7
SII 19.3 NA 28.4 53.7 35.9 39.9 -5.8 1.5 12.2 30.3 -7.6 10.0 20.0 27.1
RCI 0.0 NA 0.1 0.2 0.1 0.2 0.0 0.0 0.0 0.1 0.0 0.0 0.1 0.1
sba3
Coverage 31.7 64.4 75.9 48.8 85.1 41.5 96.8 98.8 40.5 64.3 97.3 31.8 74.0 92.9
SII 60.3 72.8 52.6 74.8 46.7 84.0 11.5 2.2 74.6 79.1 9.2 64.6 39.2 46.9
RCI 0.3 0.2 0.1 0.3 0.1 0.4 0.0 0.0 0.3 0.2 0.0 0.4 0.1 0.1
NA – Not available.
Source: Data were derived from the re-analysis of publicly available Demographic and Health Surveys (DHS)
micro-data, using the standard indicator definitions as published in DHS documentation. The analysis was carried
out by the International Center for Equity in Health based in the Federal University of Pelotas, Brazil.
Measuring and Monitoring Health Disparities: A Post-Workshop Report
38
7. References
AP-HealthGAEN. An Asia Pacific spotlight on health inequity: Taking
action to address the social and environmental determinants of health
inequity in Asia Pacific. Report of the Asia Pacific hub of Global Action for
Health Equity Network. 2011.
Howe LD, Hargreaves JR, Huttly SR. Issues in the construction of wealth
indices for the measurement of socio-economic position in low-income
countries. Emerging Themes in Epidemiology. 2008;5:3.
doi:10.1186/1742-7622-5-3.
Howe LD, Galobardes B, Matijasevich A, et al. Measuring socio-economic
position for epidemiological studies in low- and middle-income countries:
a methods of measurement in epidemiology paper. International Journal
of Epidemiology. 2012;41(3):871-886. doi:10.1093/ije/dys037.
Vyas S, Kumaranayake L. Constructing socio-economic status indices: how
to use principal components analysis. Health Policy and Planning. 2006,
21(6):459-468. doi: 10.1093/heapol/czl029
World Health Organization. Handbook on health inequality monitoring:
with a special focus on low- and middle-income countries. Geneva:
World Health Organization; 2013
(http://apps.who.int/iris/bitstream/10665/85345/1/9789241548632_eng.p
df).
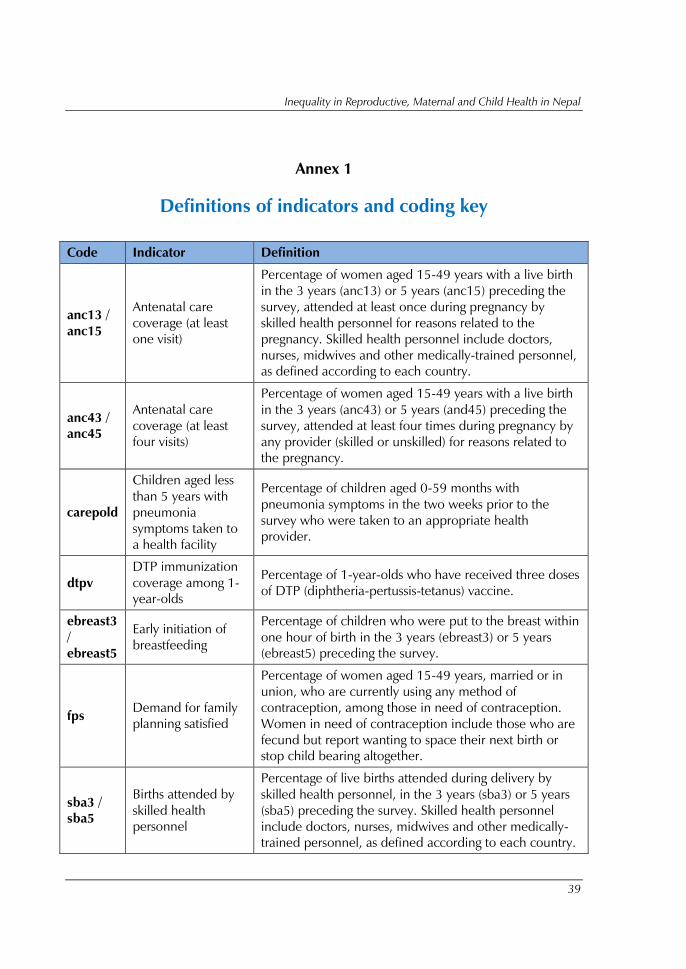
Inequality in Reproductive, Maternal and Child Health in Nepal
39
Annex 1
Definitions of indicators and coding key
Code Indicator Definition
anc13 /
anc15
Antenatal care
coverage (at least
one visit)
Percentage of women aged 15-49 years with a live birth
in the 3 years (anc13) or 5 years (anc15) preceding the
survey, attended at least once during pregnancy by
skilled health personnel for reasons related to the
pregnancy. Skilled health personnel include doctors,
nurses, midwives and other medically-trained personnel,
as defined according to each country.
anc43 /
anc45
Antenatal care
coverage (at least
four visits)
Percentage of women aged 15-49 years with a live birth
in the 3 years (anc43) or 5 years (and45) preceding the
survey, attended at least four times during pregnancy by
any provider (skilled or unskilled) for reasons related to
the pregnancy.
carepold
Children aged less
than 5 years with
pneumonia
symptoms taken to
a health facility
Percentage of children aged 0-59 months with
pneumonia symptoms in the two weeks prior to the
survey who were taken to an appropriate health
provider.
dtpv
DTP immunization
coverage among 1-
year-olds
Percentage of 1-year-olds who have received three doses
of DTP (diphtheria-pertussis-tetanus) vaccine.
ebreast3
/
ebreast5
Early initiation of
breastfeeding
Percentage of children who were put to the breast within
one hour of birth in the 3 years (ebreast3) or 5 years
(ebreast5) preceding the survey.
fps Demand for family
planning satisfied
Percentage of women aged 15-49 years, married or in
union, who are currently using any method of
contraception, among those in need of contraception.
Women in need of contraception include those who are
fecund but report wanting to space their next birth or
stop child bearing altogether.
sba3 /
sba5
Births attended by
skilled health
personnel
Percentage of live births attended during delivery by
skilled health personnel, in the 3 years (sba3) or 5 years
(sba5) preceding the survey. Skilled health personnel
include doctors, nurses, midwives and other medically-
trained personnel, as defined according to each country.

Measuring and Monitoring Health Disparities: A Post-Workshop Report
40
Code Indicator Definition
ort
Children aged less
than 5 years with
diarrhoea receiving
oral rehydration
therapy and
continued feeding
Percentage of children aged 0-59 months who had
diarrhoea in the two weeks prior to the survey and were
treated with oral rehydration therapy - oral rehydration
salts or an appropriate household solution - and
continued feeding.
stunt5
Stunting prevalence
in children aged <
5 years
Percentage of children aged 0-59 months who are
stunted (defined as more than two standard deviations
below the median height-for-age of the WHO Child
Growth Standards).
wast5
Underweight
prevalence in
children aged < 5
years
Percentage of children aged 0-59 months who are
underweight (defined as more than two standard
deviations below the median weight-for-age of the WHO
Child Growth Standards).
uweight
Wasting prevalence
in children aged <
5 years
Percentage of children 0-59 months who are wasted
(defined as more than two standard deviations below the
median weight-for-height of the WHO Child Growth
Standards).
For more-detailed definitions of health indicators, including the criteria used to calculate numerator and
denominator values, see the World Health Organization Indicator and Measurement Registry:
http://apps.who.int/gho/indicatorregistry/App_Main/indicator_registry.aspx.
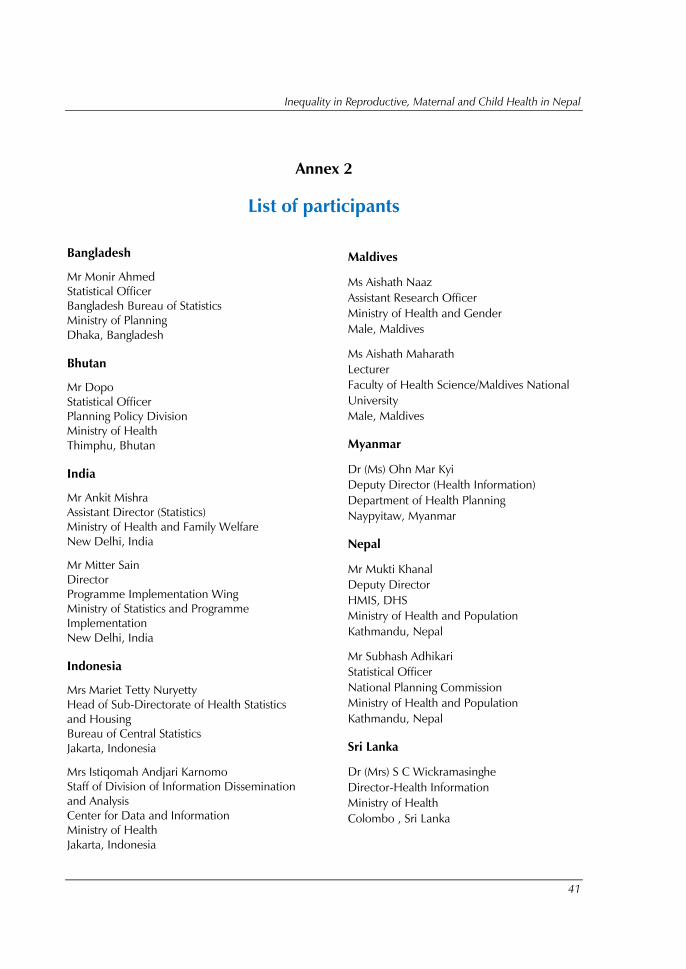
Inequality in Reproductive, Maternal and Child Health in Nepal
41
Annex 2
List of participants
Bangladesh
Mr Monir Ahmed
Statistical Officer
Bangladesh Bureau of Statistics
Ministry of Planning
Dhaka, Bangladesh
Bhutan
Mr Dopo
Statistical Officer
Planning Policy Division
Ministry of Health
Thimphu, Bhutan
India
Mr Ankit Mishra
Assistant Director (Statistics)
Ministry of Health and Family Welfare
New Delhi, India
Mr Mitter Sain
Director
Programme Implementation Wing
Ministry of Statistics and Programme
Implementation
New Delhi, India
Indonesia
Mrs Mariet Tetty Nuryetty
Head of Sub-Directorate of Health Statistics
and Housing
Bureau of Central Statistics
Jakarta, Indonesia
Mrs Istiqomah Andjari Karnomo
Staff of Division of Information Dissemination
and Analysis
Center for Data and Information
Ministry of Health
Jakarta, Indonesia
Maldives
Ms Aishath Naaz
Assistant Research Officer
Ministry of Health and Gender
Male, Maldives
Ms Aishath Maharath
Lecturer
Faculty of Health Science/Maldives National
University
Male, Maldives
Myanmar
Dr (Ms) Ohn Mar Kyi
Deputy Director (Health Information)
Department of Health Planning
Naypyitaw, Myanmar
Nepal
Mr Mukti Khanal
Deputy Director
HMIS, DHS
Ministry of Health and Population
Kathmandu, Nepal
Mr Subhash Adhikari
Statistical Officer
National Planning Commission
Ministry of Health and Population
Kathmandu, Nepal
Sri Lanka
Dr (Mrs) S C Wickramasinghe
Director-Health Information
Ministry of Health
Colombo , Sri Lanka
Measuring and Monitoring Health Disparities: A Post-Workshop Report
42
Thailand
Mrs Chujit Nacheeva
Statistician
Health Information Division
Bureau of Policy and Strategy
Office of the Permanent Secretary
Ministry of Public Health
Nonthaburi, Thailand
Timor-Leste
Mr Miguel Maria
Monitoring and Evaluation Officer
Planning and Monitoring Department
Ministry of Health
Dilli, Timor-Leste
Special Invitees
Dr Nandita Bhan
Research Scientist
Public Health Foundation of India
New Delhi, India
Dr Indranil Mukhopadhyay
Senior Research Associate
Public Health Foundation of India
New Delhi, India
Dr Devaki Nambiar
Research Scientist
Public Health Foundation of India
New Delhi, India
Dr Malee Sunpuwan
Institute for Population and Social Research
Mahidol University
Salaya, Phuthamonthon
Nakhonpathom, Thailand
Dr Pojjana Hunchangsith
Institute for Population and Social Research
Mahidol University
Salaya, Phuthamonthon
Nakhonpathom, Thailand
Dr Manasigan Kanchanachitra
Institute for Population and Social Research
Mahidol University
Salaya, Phuthamonthon
Nakhonpathom, Thailand
WHO Secretariat
WHO/HQ
Dr Ahmad Hosseinpoor
Technical Officer
World Health Organization
Geneva, Switzerland
Ms Theadora Swift Koller
Technical Officer, Equity
World Health Organization
Geneva, Switzerland
Country Offices
Ms Rustini Floranita
National Professional Officer
World Health Organization
Jakarta, Indonesia
Dr Paul Francis
Technical Officer
Maternal and Child Health
World Health Organization
New Delhi, India
Ms Anika Singh
Technical Officer
Gender, Equity and Human Rights
World Health Organization
New Delhi, India
Regional Office
Dr Oscar Jesus Alberto Mujica
Advisor, Social Epidemiology, AMOR
World Health Organization
Washington D.C., U.S.A.
Inequality in Reproductive, Maternal and Child Health in Nepal
43
Dr Prakin Suchaxaya
Coordinator
Gender, Equity and Human Rights
World Health Organization
New Delhi, India
Dr Suvajee Good
Health Education Specialist
World Health Organization
New Delhi, India
Ms Benedicte Briot
Technical Officer
Gender, Equity and Human Rights
World Health Organization
New Delhi, India
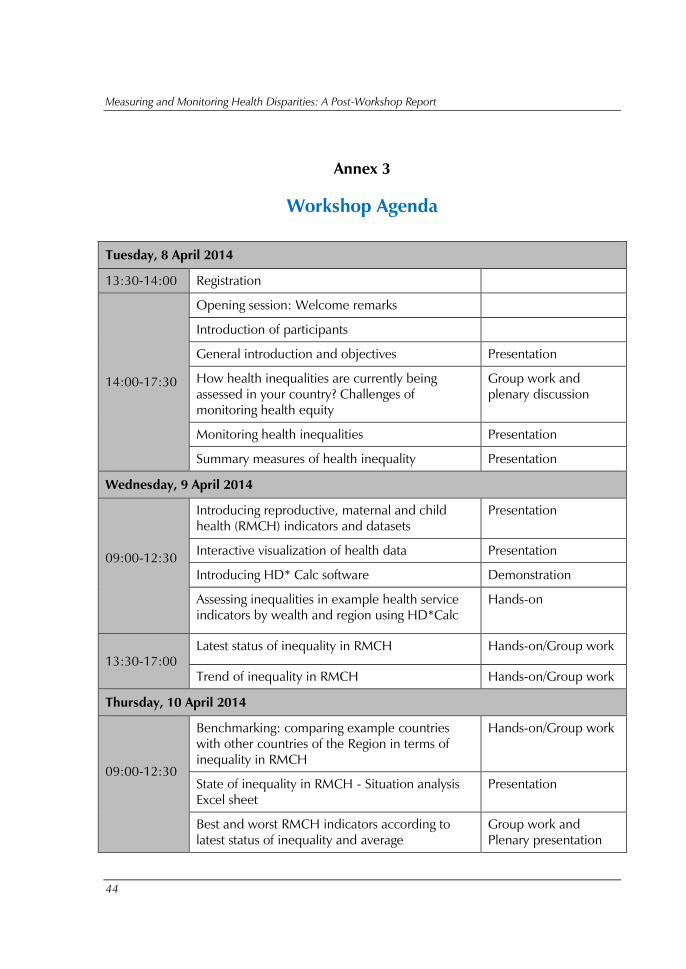
Measuring and Monitoring Health Disparities: A Post-Workshop Report
44
Annex 3
Workshop Agenda
Tuesday, 8 April 2014
13:30-14:00 Registration
14:00-17:30
Opening session: Welcome remarks
Introduction of participants
General introduction and objectives Presentation
How health inequalities are currently being
assessed in your country? Challenges of
monitoring health equity
Group work and
plenary discussion
Monitoring health inequalities Presentation
Summary measures of health inequality Presentation
Wednesday, 9 April 2014
09:00-12:30
Introducing reproductive, maternal and child
health (RMCH) indicators and datasets
Presentation
Interactive visualization of health data Presentation
Introducing HD* Calc software Demonstration
Assessing inequalities in example health service
indicators by wealth and region using HD*Calc
Hands-on
13:30-17:00
Latest status of inequality in RMCH Hands-on/Group work
Trend of inequality in RMCH Hands-on/Group work
Thursday, 10 April 2014
09:00-12:30
Benchmarking: comparing example countries
with other countries of the Region in terms of
inequality in RMCH
Hands-on/Group work
State of inequality in RMCH - Situation analysis
Excel sheet
Presentation
Best and worst RMCH indicators according to
latest status of inequality and average
Group work and
Plenary presentation
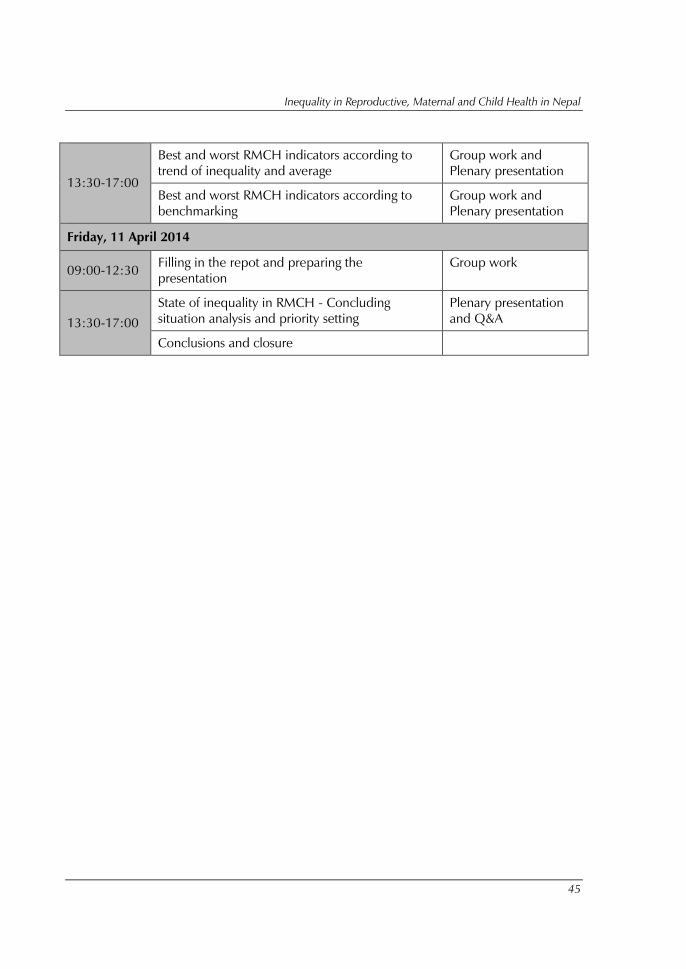
Inequality in Reproductive, Maternal and Child Health in Nepal
45
13:30-17:00
Best and worst RMCH indicators according to
trend of inequality and average
Group work and
Plenary presentation
Best and worst RMCH indicators according to
benchmarking
Group work and
Plenary presentation
Friday, 11 April 2014
09:00-12:30 Filling in the repot and preparing the
presentation
Group work
13:30-17:00
State of inequality in RMCH - Concluding
situation analysis and priority setting
Plenary presentation
and Q&A
Conclusions and closure