industry update │ february 2017 - harriswilliams.com · investmentbanking servicesare providedby...
TRANSCRIPT

www.harriswilliams.com
Investment banking services are provided by Harris Williams LLC, a registered broker-dealer and member of FINRA and SIPC, and Harris Williams & Co. Ltd, which is a private limited company incorporated under English law with its registered office at 5th Floor, 6 St. Andrew Street, London EC4A 3AE, UK, registered with the Registrar of Companies for England and Wales (registration number 7078852). Harris Williams & Co. Ltd is authorized and regulated by the Financial Conduct Authority. Harris Williams & Co. is a trade name under which Harris Williams LLC and Harris Williams & Co. Ltd conduct business.
HEALTHCARE & LIFE SCIENCES
INDUSTRY UPDATE │ FEBRUARY 2017
www.harriswilliams.com
PAGE |
www.harriswilliams.com
WHATWE’RE READING
1
CONTENTS
PUBLIC MARKETS OVERVIEW
EQUITY MARKETS OVERVIEW
M&A OVERVIEW
DEBT MARKETS OVERVIEW
HEALTHCARE & LIFE SCIENCESPUBLIC COMPARABLES
M&A TRANSACTIONS
CONTACTS
Turner BredrupManaging [email protected]+1 (804) 915-0110
James ClarkManaging [email protected]+1 (804) 915-0119
Andy DixonManaging [email protected]+1 (415) 217-3419
Cheairs PorterManaging [email protected]+1 (804) 915-0130
Geoff SmithManaging [email protected]+1 (804) 915-0195
Paul [email protected]+1 (804) 932-1326
Whit [email protected]+1 (804) 932-1321
Tyler BradshawVice [email protected]+1 (804) 887-6121
Jacques FuVice [email protected]+1 (804) 915-0185
Andy HewlettVice [email protected]+1 (415) 217-3427
Ricky NgVice [email protected]+1 (415) 217-3437
Nick OwensVice [email protected]+1 (804) 887-6027
INSURANCE | CIGNA SEEKS $14BN+ IN ANTHEM TERMINATION
Cigna ended its merger agreement with Anthem on February 14th, and is seeking$13 billion in damages from Anthem, on top of the $1.85 billion break-up feeoutlined in the deal. The $13 billion in damages is being sought to compensateCigna shareholders for Anthem “willfully” breaching the merger agreement in away that made approval unlikely, and represents returns that they did not obtainas a result of the merger falling through.
The $54 billion merger was formally blocked by a Federal District Court last weekon anti-competitive grounds. U.S. District Court Judge Amy Berman Jackson saidCigna officials were “actively warning against” the merger by presentingevidence and testimony that undermined the projections of future savings fromthe combination. Jackson said the rifts between the CEOs and the deepdisagreements in strategy could not be ignored.
Analysts expect that Anthem will not pay the break-up fee without a fight, andremains committed to closing the deal, as the insurer has already filed a notice toappeal the District Court’s ruling.
Also on February 14th, Aetna and Humana announced they had terminated their$37 billion merger following a U.S. District Court judge’s ruling against the deal.Aetna will not seek an appeal and instead will pay Humana $1 billion to terminatethe agreement.
A link to the article can be found here.
HEALTHCARE & LIFE SCIENCES
INDUSTRY UPDATE │ FEBRUARY 2017
MEDICAID | GOP RAMPS UP EFFORT TO TRANSFORM MEDICAID
Congressional Republicans are stepping up efforts to overhaul how Medicaid isfunded – which could reduce the funds that states receive, while simultaneouslygiving states more control on how they allocate the ~$500 billion in Federal dollars.
Last week, a House Energy and Commerce subcommittee hearing to discusspotential eligibility changes became a platform to debate the Republicans’ plansto turn the program into a block grant or other capped spending program.Congressional Democrats oppose these changes to the plan that providesassistance to more than 70 million Americans.
The Republican plan proposes transforming Medicaid from an open-endedentitlement program whose conditions are set by the Federal government to onein which states receive a fixed amount of funds that they control. This changewould be implemented as part of the overhaul of the ACA and would representthe biggest shift since Medicaid’s inception in 1965.
Moving to block grants has long been a goal of the GOP but sets up challengesfor states that may eventually have to make do with less, which could alsopotentially trigger adjustments to state Medicaid programs, and ultimately put theburden on states to fund any shortfall.
State governors are split on the potential change, with several saying theywelcome the expected flexibility, while others have raised concerns about a fixedfunding structure given economic fluctuations. Currently, the Federal governmentpays ~63% of Medicaid expenses, but this amount rises and falls, depending onneeds.
The lump sum formula for block grant funding has yet to be determined.
A link to the article can be found here.
PAGE |
Specialty Pharmacy
Acute-Care Hospitals
Behavioral Health / Management
Retail Pharmacy
Specialty Pharmacy Management
Long-Term Care
Assisted Living
Emergency Services
Dialysis Services
Information Services
Medical / Surgical / Dental Supplies & Distribution
Physician Practice Management
Dental Products
HW&Co. HCLS Composite Index
Healthcare Staffing
Diagnostic Imaging
S&P 500
Life Sciences Tools
Durable Medical Equipment
Specialty Managed Care
Contract Research Organizations
Surgicenters / Rehabilitation
Medical Devices and Products
Home Care, Hospice, and Home Infusion
HMO - Medical
Clinical Laboratories
Contract Pharma Manufacturing
Disease Management
(80.0%) (70.0%) (60.0%) (50.0%) (40.0%) (30.0%) (20.0%) (10.0%) 0.0% 10.0% 20.0% 30.0% 40.0% 50.0% 60.0% 70.0% 80.0%
PUBLICMARKETS OVERVIEW(1)
2
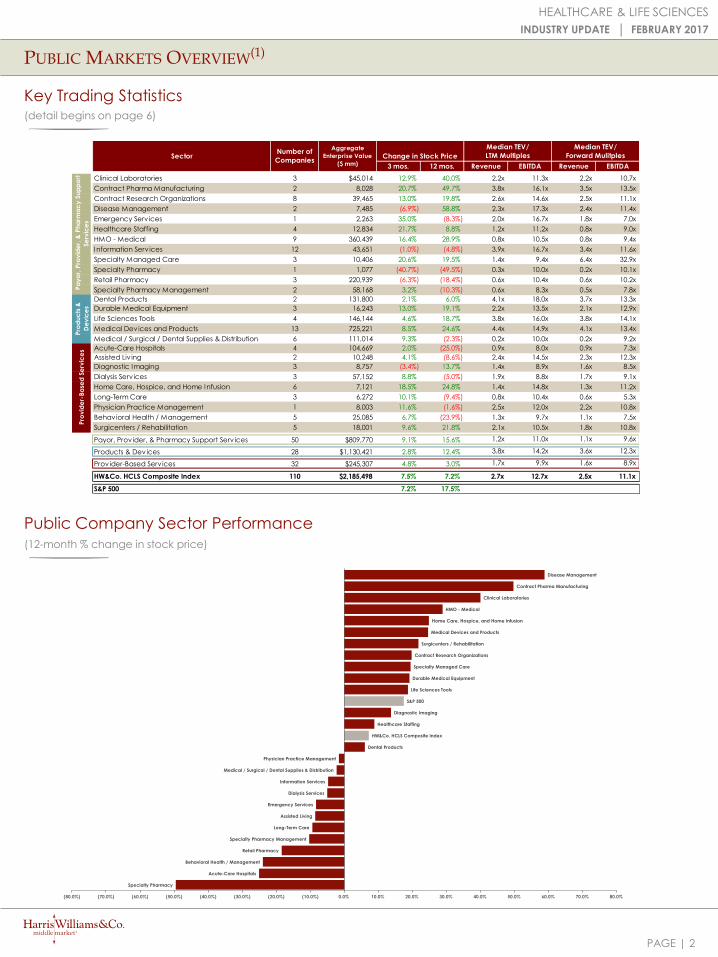
Key Trading Statistics (detail begins on page 6)
Public Company Sector Performance
(12-month % change in stock price)
HEALTHCARE & LIFE SCIENCES
INDUSTRY UPDATE │ FEBRUARY 2017
Change in Stock Price
3 mos. 12 mos. Revenue EBITDA Revenue EBITDA
Clinical Laboratories 3 $45,014 12.9% 40.0% 2.2x 11.3x 2.2x 10.7x
Contract Pharma Manufacturing 2 8,028 20.7% 49.7% 3.8x 16.1x 3.5x 13.5x
Contract Research Organizations 8 39,465 13.0% 19.8% 2.6x 14.6x 2.5x 11.1x
Disease Management 2 7,485 (6.9%) 58.8% 2.3x 17.3x 2.4x 11.4x
Emergency Serv ices 1 2,263 35.0% (8.3%) 2.0x 16.7x 1.8x 7.0x
Healthcare Staffing 4 12,834 21.7% 8.8% 1.2x 11.2x 0.8x 9.0x
HMO - Medical 9 360,439 16.4% 28.9% 0.8x 10.5x 0.8x 9.4x
Information Serv ices 12 43,651 (1.0%) (4.8%) 3.9x 16.7x 3.4x 11.6x
Specialty Managed Care 3 10,406 20.6% 19.5% 1.4x 9.4x 6.4x 32.9x
Specialty Pharmacy 1 1,077 (40.7%) (49.5%) 0.3x 10.0x 0.2x 10.1x
Retail Pharmacy 3 220,939 (6.3%) (18.4%) 0.6x 10.4x 0.6x 10.2x
Specialty Pharmacy Management 2 58,168 3.2% (10.3%) 0.6x 8.3x 0.5x 7.8x
Dental Products 2 131,800 2.1% 6.0% 4.1x 18.0x 3.7x 13.3x
Durable Medical Equipment 3 16,243 13.0% 19.1% 2.2x 13.5x 2.1x 12.9x
Life Sciences Tools 4 146,144 4.6% 18.7% 3.8x 16.0x 3.8x 14.1x
Medical Devices and Products 13 725,221 8.5% 24.6% 4.4x 14.9x 4.1x 13.4x
Medical / Surgical / Dental Supplies & Distribution 6 111,014 9.3% (2.3%) 0.2x 10.0x 0.2x 9.2x
Acute-Care Hospitals 4 104,669 2.0% (25.0%) 0.9x 8.0x 0.9x 7.3x
Assisted Liv ing 2 10,248 4.1% (8.6%) 2.4x 14.5x 2.3x 12.3x
Diagnostic Imaging 3 8,757 (3.4%) 13.7% 1.4x 8.9x 1.6x 8.5x
Dialysis Serv ices 3 57,152 8.8% (5.0%) 1.9x 8.8x 1.7x 9.1x
Home Care, Hospice, and Home Infusion 6 7,121 18.5% 24.8% 1.4x 14.8x 1.3x 11.2x
Long-Term Care 3 6,272 10.1% (9.4%) 0.8x 10.4x 0.6x 5.3x
Physician Practice Management 1 8,003 11.6% (1.6%) 2.5x 12.0x 2.2x 10.8x
Behavioral Health / Management 5 25,085 6.7% (23.9%) 1.3x 9.7x 1.1x 7.5x
Surgicenters / Rehabilitation 5 18,001 9.6% 21.8% 2.1x 10.5x 1.8x 10.8x
Payor, Provider, & Pharmacy Support Serv ices 50 $809,770 9.1% 15.6% 1.2x 11.0x 1.1x 9.6x
Products & Devices 28 $1,130,421 2.8% 12.4% 3.8x 14.2x 3.6x 12.3x
Provider-Based Serv ices 32 $245,307 4.8% 3.0% 1.7x 9.9x 1.6x 8.9x
HW&Co. HCLS Composite Index 110 $2,185,498 7.5% 7.2% 2.7x 12.7x 2.5x 11.1x
S&P 500 7.2% 17.5%
Pro
du
cts
&
De
vic
es
Pro
vid
er-
Ba
sed
Se
rvic
es
Median TEV/
Forward MulitplesSectorNumber of
Companies
Aggregate
Enterprise Value
($ mm)
Median TEV/
LTM Multiples
Pa
yo
r, P
rov
ide
r, &
Ph
arm
ac
y S
up
po
rt
Se
rvic
es
PAGE |
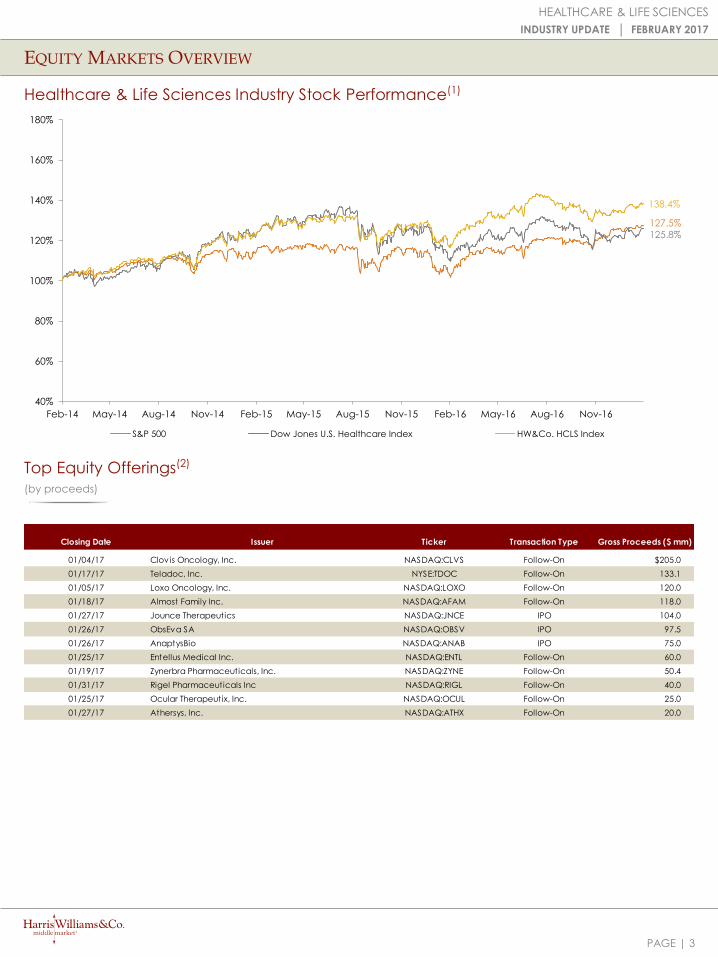
127.5%125.8%
138.4%
40%
60%
80%
100%
120%
140%
160%
180%
Feb-14 May-14 Aug-14 Nov-14 Feb-15 May-15 Aug-15 Nov-15 Feb-16 May-16 Aug-16 Nov-16
S&P 500 Dow Jones U.S. Healthcare Index HW&Co. HCLS Index
EQUITYMARKETS OVERVIEW
3
Healthcare & Life Sciences Industry Stock Performance(1)
Top Equity Offerings(2)
(by proceeds)
HEALTHCARE & LIFE SCIENCES
INDUSTRY UPDATE │ FEBRUARY 2017
Closing Date Issuer Ticker Transaction Type Gross Proceeds ($ mm)
01/04/17 Clovis Oncology, Inc. NASDAQ:CLVS Follow-On $205.0
01/17/17 Teladoc, Inc. NYSE:TDOC Follow-On 133.1
01/05/17 Loxo Oncology, Inc. NASDAQ:LOXO Follow-On 120.0
01/18/17 Almost Family Inc. NASDAQ:AFAM Follow-On 118.0
01/27/17 Jounce Therapeutics NASDAQ:JNCE IPO 104.0
01/26/17 ObsEva SA NASDAQ:OBSV IPO 97.5
01/26/17 AnaptysBio NASDAQ:ANAB IPO 75.0
01/25/17 Entellus Medical Inc. NASDAQ:ENTL Follow-On 60.0
01/19/17 Zynerbra Pharmaceuticals, Inc. NASDAQ:ZYNE Follow-On 50.4
01/31/17 Rigel Pharmaceuticals Inc NASDAQ:RIGL Follow-On 40.0
01/25/17 Ocular Therapeutix, Inc. NASDAQ:OCUL Follow-On 25.0
01/27/17 Athersys, Inc. NASDAQ:ATHX Follow-On 20.0
PAGE |
HC&LS Industry Number of
Segment Companies
Healthcare Facilities 42
Healthcare Serv ices 96
Healthcare Equipment 35
Pharmaceuticals 22
Healthcare Technology 12
Life Sciences Tools & Serv ices 4
Healthcare Supplies 8
Healthcare Distributors 5
Biotechnology 10
Managed Healthcare 4
M&A OVERVIEW(1)
4
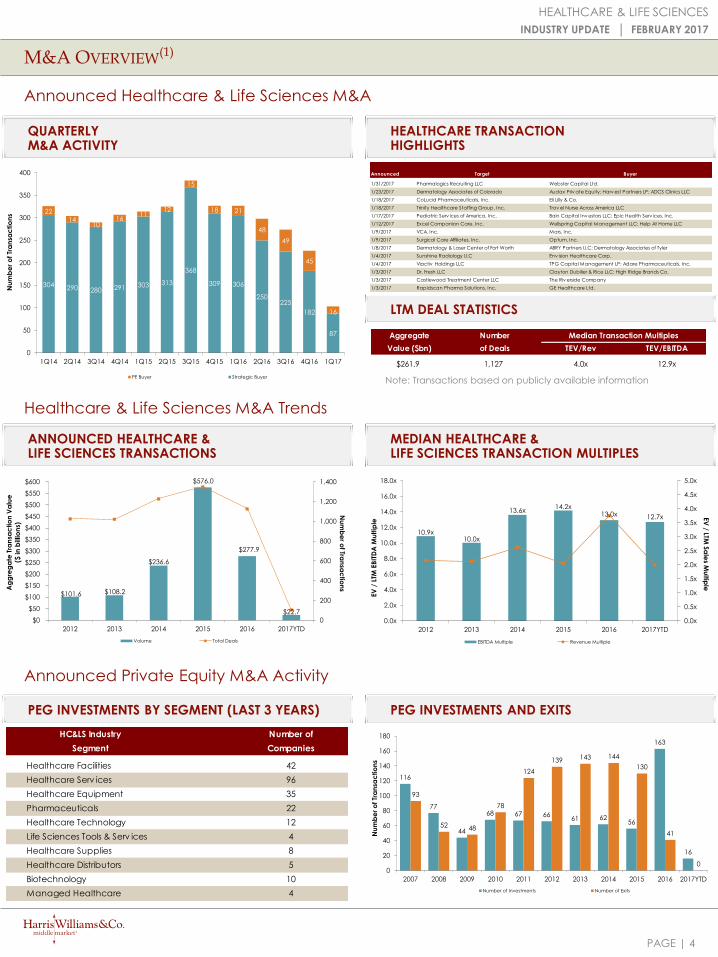
Announced Healthcare & Life Sciences M&A
Healthcare & Life Sciences M&A Trends
Announced Private Equity M&A Activity
QUARTERLY M&A ACTIVITY
HEALTHCARE TRANSACTION HIGHLIGHTS
ANNOUNCED HEALTHCARE & LIFE SCIENCES TRANSACTIONS
MEDIAN HEALTHCARE & LIFE SCIENCES TRANSACTION MULTIPLES
PEG INVESTMENTS BY SEGMENT (LAST 3 YEARS) PEG INVESTMENTS AND EXITS
Note: Transactions based on publicly available information
LTM DEAL STATISTICS
HEALTHCARE & LIFE SCIENCES
INDUSTRY UPDATE │ FEBRUARY 2017
$101.6 $108.2
$236.6
$576.0
$277.9
$22.7
0
200
400
600
800
1,000
1,200
1,400
$0
$50
$100
$150
$200
$250
$300
$350
$400
$450
$500
$550
$600
2012 2013 2014 2015 2016 2017YTD
Nu
mb
er o
f Tran
sac
tion
sAg
gre
ga
te T
ran
sac
tio
n V
alu
e
($ in
billio
ns)
Volume Total Deals
Aggregate Number Median Transaction Multiples
Value ($bn) of Deals TEV/Rev TEV/EBITDA
$261.9 1,127 4.0x 12.9x
10.9x 10.0x
13.6x 14.2x
13.0x 12.7x
0.0x
0.5x
1.0x
1.5x
2.0x
2.5x
3.0x
3.5x
4.0x
4.5x
5.0x
0.0x
2.0x
4.0x
6.0x
8.0x
10.0x
12.0x
14.0x
16.0x
18.0x
2012 2013 2014 2015 2016 2017YTD
EV
/ LTM S
ale
s Mu
ltiple
EV
/ L
TM E
BIT
DA
Mu
ltip
le
EBITDA Multiple Revenue Multiple
304 290 280 291 303 313
368
309 306
250225
182
87
2214
1016
1112
15
18 21
48
49
45
16
0
50
100
150
200
250
300
350
400
1Q14 2Q14 3Q14 4Q14 1Q15 2Q15 3Q15 4Q15 1Q16 2Q16 3Q16 4Q16 1Q17
Nu
mb
er
of Tr
an
sac
tio
ns
PE Buyer Strategic Buyer
116
77
44
68 67 6661 62
56
163
16
93
52 48
78
124
139 143 144
130
41
00
20
40
60
80
100
120
140
160
180
2007 2008 2009 2010 2011 2012 2013 2014 2015 2016 2017YTD
Nu
mb
er
of Tr
an
sac
tio
ns
Number of Investments Number of Exits
Announced Target Buyer
1/31/2017 Pharmalogics Recruiting LLC Webster Capital Ltd.
1/23/2017 Dermatology Associates of Colorado Audax Priv ate Equity; Harv est Partners LP; ADCS Clinics LLC
1/18/2017 CoLucid Pharmaceuticals, Inc. Eli Lilly & Co.
1/18/2017 Trinity Healthcare Staffing Group, Inc. Trav el Nurse Across America LLC
1/17/2017 Pediatric Serv ices of America, Inc. Bain Capital Inv estors LLC; Epic Health Serv ices, Inc.
1/12/2017 Excel Companion Care, Inc. Wellspring Capital Management LLC; Help At Home LLC
1/9/2017 VCA, Inc. Mars, Inc.
1/9/2017 Surgical Care Affiliates, Inc. Optum, Inc.
1/8/2017 Dermatology & Laser Center of Fort Worth ABRY Partners LLC; Dermatology Associates of Tyler
1/4/2017 Sunshine Radiology LLC Env ision Healthcare Corp.
1/4/2017 Viactiv Holdings LLC TPG Capital Management LP; Adare Pharmaceuticals, Inc.
1/3/2017 Dr. Fresh LLC Clayton Dubilier & Rice LLC; High Ridge Brands Co.
1/3/2017 Castlewood Treatment Center LLC The Riv erside Company
1/3/2017 Rapidscan Pharma Solutions, Inc. GE Healthcare Ltd.
PAGE |
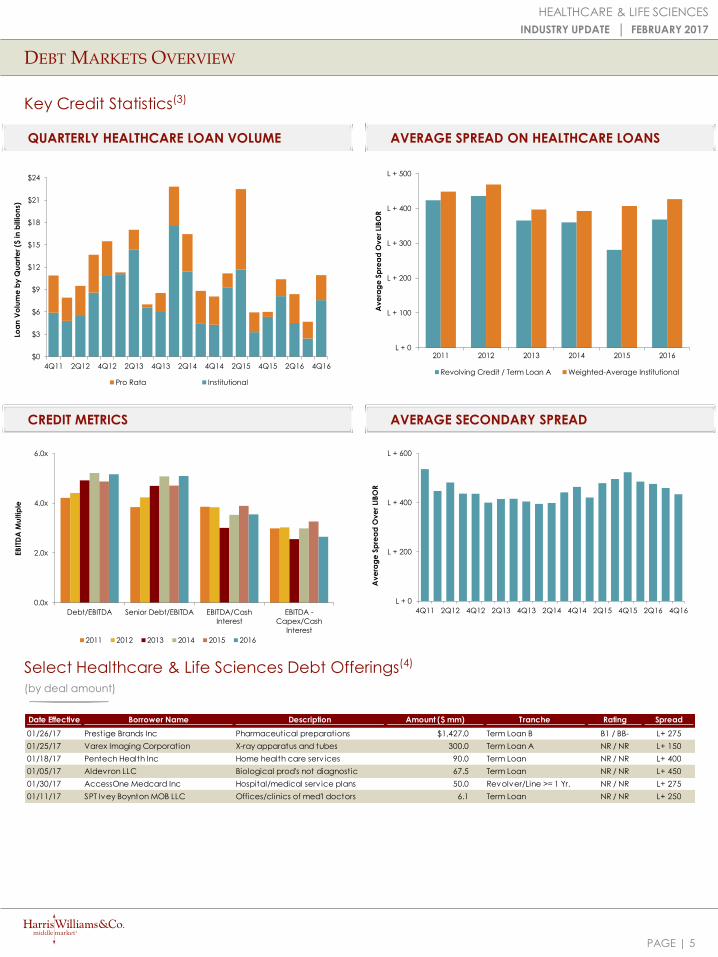
DEBTMARKETS OVERVIEW
Key Credit Statistics(3)
QUARTERLY HEALTHCARE LOAN VOLUME AVERAGE SPREAD ON HEALTHCARE LOANS
Select Healthcare & Life Sciences Debt Offerings(4)
(by deal amount)
CREDIT METRICS AVERAGE SECONDARY SPREAD
HEALTHCARE & LIFE SCIENCES
INDUSTRY UPDATE │ FEBRUARY 2017
$0
$3
$6
$9
$12
$15
$18
$21
$24
4Q11 2Q12 4Q12 2Q13 4Q13 2Q14 4Q14 2Q15 4Q15 2Q16 4Q16
Loa
n V
olu
me
by
Qu
art
er
($ in
billio
ns)
Pro Rata Institutional
L + 0
L + 100
L + 200
L + 300
L + 400
L + 500
2011 2012 2013 2014 2015 2016
Av
era
ge
Sp
rea
d O
ve
r LI
BO
RRevolving Credit / Term Loan A Weighted-Average Institutional
L + 0
L + 200
L + 400
L + 600
4Q11 2Q12 4Q12 2Q13 4Q13 2Q14 4Q14 2Q15 4Q15 2Q16 4Q16
Av
era
ge
Sp
rea
d O
ve
r LI
BO
R
0.0x
2.0x
4.0x
6.0x
Debt/EBITDA Senior Debt/EBITDA EBITDA/Cash
Interest
EBITDA -
Capex/Cash
Interest
EB
ITD
A M
ultip
le
2011 2012 2013 2014 2015 2016
Date Effective Borrower Name Description Amount ($ mm) Tranche Rating Spread
01/26/17 Prestige Brands Inc Pharmaceutical preparations $1,427.0 Term Loan B B1 / BB- L+ 275
01/25/17 Varex Imaging Corporation X-ray apparatus and tubes 300.0 Term Loan A NR / NR L+ 150
01/18/17 Pentech Health Inc Home health care serv ices 90.0 Term Loan NR / NR L+ 400
01/05/17 Aldevron LLC Biological prod's not diagnostic 67.5 Term Loan NR / NR L+ 450
01/30/17 AccessOne Medcard Inc Hospital/medical serv ice plans 50.0 Revolver/Line >= 1 Yr. NR / NR L+ 275
01/11/17 SPT Ivey Boynton MOB LLC Offices/clinics of med'l doctors 6.1 Term Loan NR / NR L+ 250
5
PAGE |
Stock Price
% Change 52 Week
1/31/2017 3 mos. 12 mos. High Low Revenue EBITDA EBIT Revenue EBITDA EBIT Revenue EBITDA Revenue EBITDA
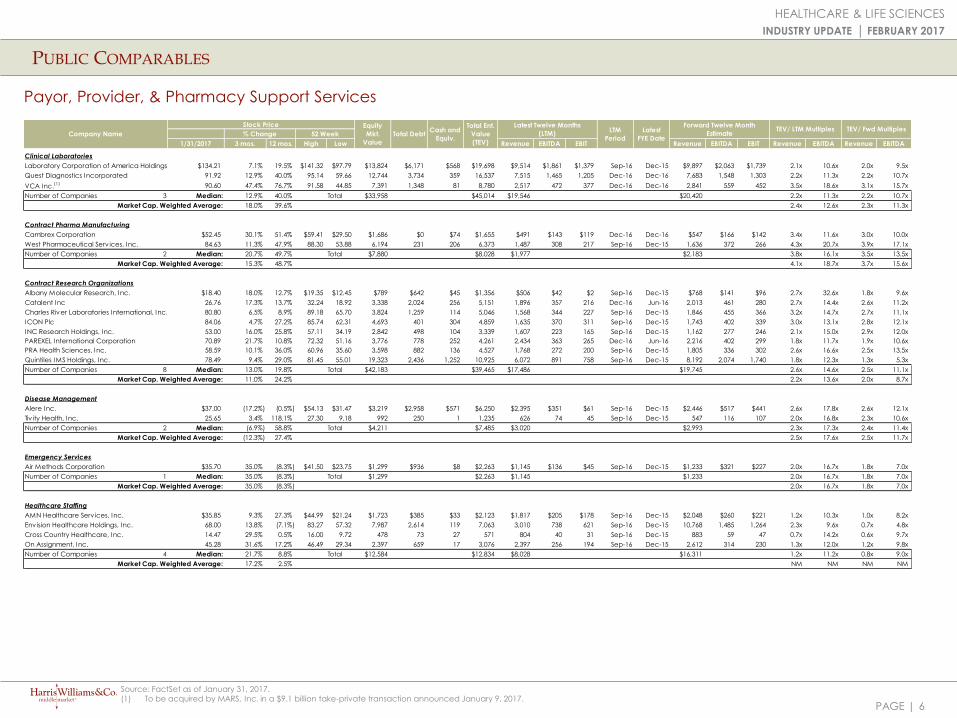
Clinical Laboratories
Laboratory Corporation of America Holdings $134.21 7.1% 19.5% $141.32 $97.79 $13,824 $6,171 $568 $19,698 $9,514 $1,861 $1,379 Sep-16 Dec-15 $9,897 $2,063 $1,739 2.1x 10.6x 2.0x 9.5x
Quest Diagnostics Incorporated 91.92 12.9% 40.0% 95.14 59.66 12,744 3,734 359 16,537 7,515 1,465 1,205 Dec-16 Dec-16 7,683 1,548 1,303 2.2x 11.3x 2.2x 10.7x
VCA Inc.(1) 90.60 47.4% 76.7% 91.58 44.85 7,391 1,348 81 8,780 2,517 472 377 Dec-16 Dec-16 2,841 559 452 3.5x 18.6x 3.1x 15.7x
Number of Companies 3 Median: 12.9% 40.0% Total $33,958 $45,014 $19,546 $20,420 2.2x 11.3x 2.2x 10.7x
Market Cap. Weighted Average: 18.0% 39.6% 2.4x 12.6x 2.3x 11.3x
Contract Pharma Manufacturing
Cambrex Corporation $52.45 30.1% 51.4% $59.41 $29.50 $1,686 $0 $74 $1,655 $491 $143 $119 Dec-16 Dec-16 $547 $166 $142 3.4x 11.6x 3.0x 10.0x
West Pharmaceutical Serv ices, Inc. 84.63 11.3% 47.9% 88.30 53.88 6,194 231 206 6,373 1,487 308 217 Sep-16 Dec-15 1,636 372 266 4.3x 20.7x 3.9x 17.1x
Number of Companies 2 Median: 20.7% 49.7% Total $7,880 $8,028 $1,977 $2,183 3.8x 16.1x 3.5x 13.5x
Market Cap. Weighted Average: 15.3% 48.7% 4.1x 18.7x 3.7x 15.6x
Contract Research Organizations
Albany Molecular Research, Inc. $18.40 18.0% 12.7% $19.35 $12.45 $789 $642 $45 $1,356 $506 $42 $2 Sep-16 Dec-15 $768 $141 $96 2.7x 32.6x 1.8x 9.6x
Catalent Inc 26.76 17.3% 13.7% 32.24 18.92 3,338 2,024 256 5,151 1,896 357 216 Dec-16 Jun-16 2,013 461 280 2.7x 14.4x 2.6x 11.2x
Charles River Laboratories International, Inc. 80.80 6.5% 8.9% 89.18 65.70 3,824 1,259 114 5,046 1,568 344 227 Sep-16 Dec-15 1,846 455 366 3.2x 14.7x 2.7x 11.1x
ICON Plc 84.06 4.7% 27.2% 85.74 62.31 4,693 401 304 4,859 1,635 370 311 Sep-16 Dec-15 1,743 402 339 3.0x 13.1x 2.8x 12.1x
INC Research Holdings, Inc. 53.00 16.0% 25.8% 57.11 34.19 2,842 498 104 3,339 1,607 223 165 Sep-16 Dec-15 1,162 277 246 2.1x 15.0x 2.9x 12.0x
PAREXEL International Corporation 70.89 21.7% 10.8% 72.32 51.16 3,776 778 252 4,261 2,434 363 265 Dec-16 Jun-16 2,216 402 299 1.8x 11.7x 1.9x 10.6x
PRA Health Sciences, Inc. 58.59 10.1% 36.0% 60.96 35.60 3,598 882 136 4,527 1,768 272 200 Sep-16 Dec-15 1,805 336 302 2.6x 16.6x 2.5x 13.5x
Quintiles IMS Holdings, Inc. 78.49 9.4% 29.0% 81.45 55.01 19,323 2,436 1,252 10,925 6,072 891 758 Sep-16 Dec-15 8,192 2,074 1,740 1.8x 12.3x 1.3x 5.3x
Number of Companies 8 Median: 13.0% 19.8% Total $42,183 $39,465 $17,486 $19,745 2.6x 14.6x 2.5x 11.1x
Market Cap. Weighted Average: 11.0% 24.2% 2.2x 13.6x 2.0x 8.7x
Disease Management
Alere Inc. $37.00 (17.2%) (0.5%) $54.13 $31.47 $3,219 $2,958 $571 $6,250 $2,395 $351 $61 Sep-16 Dec-15 $2,446 $517 $441 2.6x 17.8x 2.6x 12.1x
Tiv ity Health, Inc. 25.65 3.4% 118.1% 27.30 9.18 992 250 1 1,235 626 74 45 Sep-16 Dec-15 547 116 107 2.0x 16.8x 2.3x 10.6x
Number of Companies 2 Median: (6.9%) 58.8% Total $4,211 $7,485 $3,020 $2,993 2.3x 17.3x 2.4x 11.4x
Market Cap. Weighted Average: (12.3%) 27.4% 2.5x 17.6x 2.5x 11.7x
Emergency Services
Air Methods Corporation $35.70 35.0% (8.3%) $41.50 $23.75 $1,299 $936 $8 $2,263 $1,145 $136 $45 Sep-16 Dec-15 $1,233 $321 $227 2.0x 16.7x 1.8x 7.0x
Number of Companies 1 Median: 35.0% (8.3%) Total $1,299 $2,263 $1,145 $1,233 2.0x 16.7x 1.8x 7.0x
Market Cap. Weighted Average: 35.0% (8.3%) 2.0x 16.7x 1.8x 7.0x
Healthcare Staffing
AMN Healthcare Serv ices, Inc. $35.85 9.3% 27.3% $44.99 $21.24 $1,723 $385 $33 $2,123 $1,817 $205 $178 Sep-16 Dec-15 $2,048 $260 $221 1.2x 10.3x 1.0x 8.2x
Envision Healthcare Holdings, Inc. 68.00 13.8% (7.1%) 83.27 57.32 7,987 2,614 119 7,063 3,010 738 621 Sep-16 Dec-15 10,768 1,485 1,264 2.3x 9.6x 0.7x 4.8x
Cross Country Healthcare, Inc. 14.47 29.5% 0.5% 16.00 9.72 478 73 27 571 804 40 31 Sep-16 Dec-15 883 59 47 0.7x 14.2x 0.6x 9.7x
On Assignment, Inc. 45.28 31.6% 17.2% 46.49 29.34 2,397 659 17 3,076 2,397 256 194 Sep-16 Dec-15 2,612 314 230 1.3x 12.0x 1.2x 9.8x
Number of Companies 4 Median: 21.7% 8.8% Total $12,584 $12,834 $8,028 $16,311 1.2x 11.2x 0.8x 9.0x
Market Cap. Weighted Average: 17.2% 2.5% NM NM NM NM
TEV/ Fwd MultiplesForward Twelve Month
EstimateCompany NameLTM
Period
Latest
FYE Date
TEV/ LTM MultiplesEquity
Mkt.
Value
Total DebtCash and
Equiv.
Total Ent.
Value
(TEV)
Latest Twelve Months
(LTM)
PUBLIC COMPARABLES
6
Payor, Provider, & Pharmacy Support Services
HEALTHCARE & LIFE SCIENCES
INDUSTRY UPDATE │ FEBRUARY 2017
Source: FactSet as of January 31, 2017.
(1) To be acquired by MARS, Inc. in a $9.1 billion take-private transaction announced January 9, 2017.
PAGE |
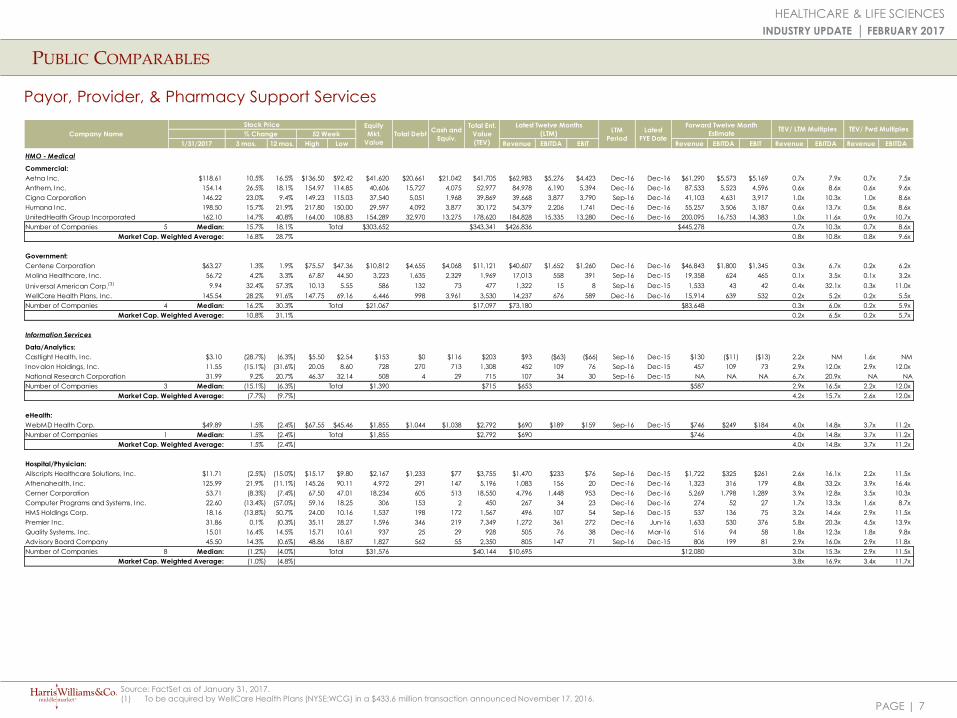
PUBLIC COMPARABLES
7
Payor, Provider, & Pharmacy Support Services
HEALTHCARE & LIFE SCIENCES
INDUSTRY UPDATE │ FEBRUARY 2017
Source: FactSet as of January 31, 2017.
(1) To be acquired by WellCare Health Plans (NYSE:WCG) in a $433.6 million transaction announced November 17, 2016.
Stock Price
% Change 52 Week
1/31/2017 3 mos. 12 mos. High Low Revenue EBITDA EBIT Revenue EBITDA EBIT Revenue EBITDA Revenue EBITDA
HMO - Medical
Commercial:
Aetna Inc. $118.61 10.5% 16.5% $136.50 $92.42 $41,620 $20,661 $21,042 $41,705 $62,983 $5,276 $4,423 Dec-16 Dec-16 $61,290 $5,573 $5,169 0.7x 7.9x 0.7x 7.5x
Anthem, Inc. 154.14 26.5% 18.1% 154.97 114.85 40,606 15,727 4,075 52,977 84,978 6,190 5,394 Dec-16 Dec-16 87,533 5,523 4,596 0.6x 8.6x 0.6x 9.6x
Cigna Corporation 146.22 23.0% 9.4% 149.23 115.03 37,540 5,051 1,968 39,869 39,668 3,877 3,790 Sep-16 Dec-16 41,103 4,631 3,917 1.0x 10.3x 1.0x 8.6x
Humana Inc. 198.50 15.7% 21.9% 217.80 150.00 29,597 4,092 3,877 30,172 54,379 2,206 1,741 Dec-16 Dec-16 55,257 3,506 3,187 0.6x 13.7x 0.5x 8.6x
UnitedHealth Group Incorporated 162.10 14.7% 40.8% 164.00 108.83 154,289 32,970 13,275 178,620 184,828 15,335 13,280 Dec-16 Dec-16 200,095 16,753 14,383 1.0x 11.6x 0.9x 10.7x
Number of Companies 5 Median: 15.7% 18.1% Total $303,652 $343,341 $426,836 $445,278 0.7x 10.3x 0.7x 8.6x
Market Cap. Weighted Average: 16.8% 28.7% 0.8x 10.8x 0.8x 9.6x
Government:
Centene Corporation $63.27 1.3% 1.9% $75.57 $47.36 $10,812 $4,655 $4,068 $11,121 $40,607 $1,652 $1,260 Dec-16 Dec-16 $46,843 $1,800 $1,345 0.3x 6.7x 0.2x 6.2x
Molina Healthcare, Inc. 56.72 4.2% 3.3% 67.87 44.50 3,223 1,635 2,329 1,969 17,013 558 391 Sep-16 Dec-15 19,358 624 465 0.1x 3.5x 0.1x 3.2x
Universal American Corp.(3) 9.94 32.4% 57.3% 10.13 5.55 586 132 73 477 1,322 15 8 Sep-16 Dec-15 1,533 43 42 0.4x 32.1x 0.3x 11.0x
WellCare Health Plans, Inc. 145.54 28.2% 91.6% 147.75 69.16 6,446 998 3,961 3,530 14,237 676 589 Dec-16 Dec-16 15,914 639 532 0.2x 5.2x 0.2x 5.5x
Number of Companies 4 Median: 16.2% 30.3% Total $21,067 $17,097 $73,180 $83,648 0.3x 6.0x 0.2x 5.9x
Market Cap. Weighted Average: 10.8% 31.1% 0.2x 6.5x 0.2x 5.7x
Information Services
Data/Analytics:
Castlight Health, Inc. $3.10 (28.7%) (6.3%) $5.50 $2.54 $153 $0 $116 $203 $93 ($63) ($66) Sep-16 Dec-15 $130 ($11) ($13) 2.2x NM 1.6x NM
Inovalon Holdings, Inc. 11.55 (15.1%) (31.6%) 20.05 8.60 728 270 713 1,308 452 109 76 Sep-16 Dec-15 457 109 73 2.9x 12.0x 2.9x 12.0x
National Research Corporation 31.99 9.2% 20.7% 46.37 32.14 508 4 29 715 107 34 30 Sep-16 Dec-15 NA NA NA 6.7x 20.9x NA NA
Number of Companies 3 Median: (15.1%) (6.3%) Total $1,390 $715 $653 $587 2.9x 16.5x 2.2x 12.0x
Market Cap. Weighted Average: (7.7%) (9.7%) 4.2x 15.7x 2.6x 12.0x
eHealth:
WebMD Health Corp. $49.89 1.5% (2.4%) $67.55 $45.46 $1,855 $1,044 $1,038 $2,792 $690 $189 $159 Sep-16 Dec-15 $746 $249 $184 4.0x 14.8x 3.7x 11.2x
Number of Companies 1 Median: 1.5% (2.4%) Total $1,855 $2,792 $690 $746 4.0x 14.8x 3.7x 11.2x
Market Cap. Weighted Average: 1.5% (2.4%) 4.0x 14.8x 3.7x 11.2x
Hospital/Physician:
Allscripts Healthcare Solutions, Inc. $11.71 (2.5%) (15.0%) $15.17 $9.80 $2,167 $1,233 $77 $3,755 $1,470 $233 $76 Sep-16 Dec-15 $1,722 $325 $261 2.6x 16.1x 2.2x 11.5x
Athenahealth, Inc. 125.99 21.9% (11.1%) 145.26 90.11 4,972 291 147 5,196 1,083 156 20 Dec-16 Dec-16 1,323 316 179 4.8x 33.2x 3.9x 16.4x
Cerner Corporation 53.71 (8.3%) (7.4%) 67.50 47.01 18,234 605 513 18,550 4,796 1,448 953 Dec-16 Dec-16 5,269 1,798 1,289 3.9x 12.8x 3.5x 10.3x
Computer Programs and Systems, Inc. 22.60 (13.4%) (57.0%) 59.16 18.25 306 153 2 450 267 34 23 Dec-16 Dec-16 274 52 27 1.7x 13.3x 1.6x 8.7x
HMS Holdings Corp. 18.16 (13.8%) 50.7% 24.00 10.16 1,537 198 172 1,567 496 107 54 Sep-16 Dec-15 537 136 75 3.2x 14.6x 2.9x 11.5x
Premier Inc. 31.86 0.1% (0.3%) 35.11 28.27 1,596 346 219 7,349 1,272 361 272 Dec-16 Jun-16 1,633 530 376 5.8x 20.3x 4.5x 13.9x
Quality Systems, Inc. 15.01 16.4% 14.5% 15.71 10.61 937 25 29 928 505 76 38 Dec-16 Mar-16 516 94 58 1.8x 12.3x 1.8x 9.8x
Advisory Board Company 45.50 14.3% (0.6%) 48.86 18.87 1,827 562 55 2,350 805 147 71 Sep-16 Dec-15 806 199 81 2.9x 16.0x 2.9x 11.8x
Number of Companies 8 Median: (1.2%) (4.0%) Total $31,576 $40,144 $10,695 $12,080 3.0x 15.3x 2.9x 11.5x
Market Cap. Weighted Average: (1.0%) (4.8%) 3.8x 16.9x 3.4x 11.7x
Total Ent.
Value
(TEV)
Latest Twelve Months
(LTM)LTM
Period
Latest
FYE DateCompany Name
Equity
Mkt.
Value
Total DebtCash and
Equiv.
Forward Twelve Month
EstimateTEV/ LTM Multiples TEV/ Fwd Multiples
PAGE |
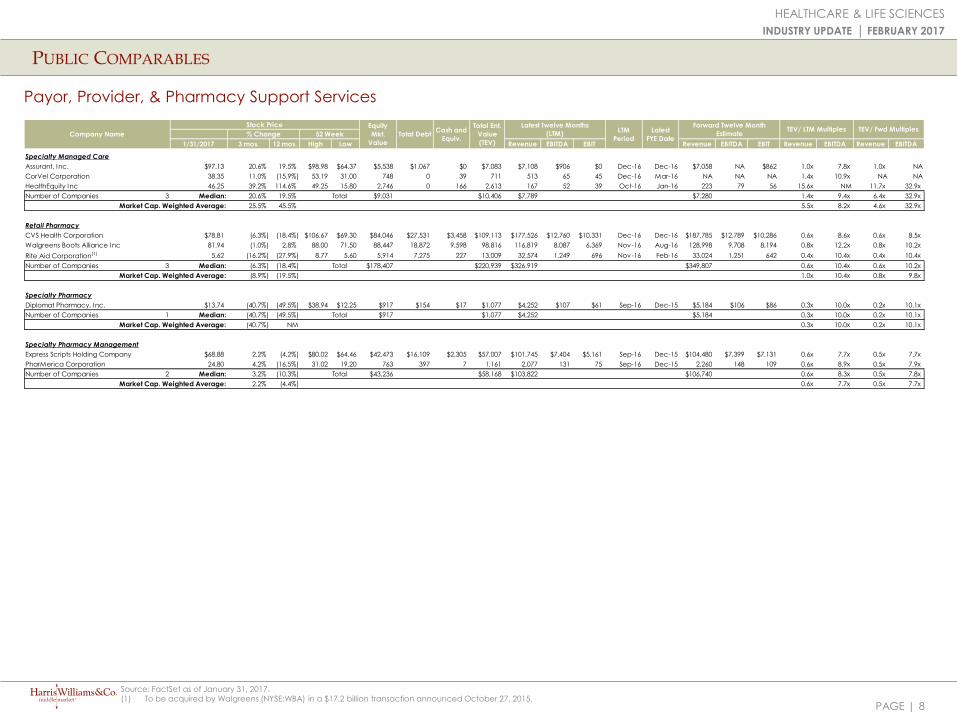
PUBLIC COMPARABLES
8
Payor, Provider, & Pharmacy Support Services
HEALTHCARE & LIFE SCIENCES
INDUSTRY UPDATE │ FEBRUARY 2017
Stock Price
% Change 52 Week
1/31/2017 3 mos. 12 mos. High Low Revenue EBITDA EBIT Revenue EBITDA EBIT Revenue EBITDA Revenue EBITDA
Specialty Managed Care
Assurant, Inc. $97.13 20.6% 19.5% $98.98 $64.37 $5,538 $1,067 $0 $7,083 $7,108 $906 $0 Dec-16 Dec-16 $7,058 NA $862 1.0x 7.8x 1.0x NA
CorVel Corporation 38.35 11.0% (15.9%) 53.19 31.00 748 0 39 711 513 65 45 Dec-16 Mar-16 NA NA NA 1.4x 10.9x NA NA
HealthEquity Inc 46.25 39.2% 114.6% 49.25 15.80 2,746 0 166 2,613 167 52 39 Oct-16 Jan-16 223 79 56 15.6x NM 11.7x 32.9x
Number of Companies 3 Median: 20.6% 19.5% Total $9,031 $10,406 $7,789 $7,280 1.4x 9.4x 6.4x 32.9x
Market Cap. Weighted Average: 25.5% 45.5% 5.5x 8.2x 4.6x 32.9x
Retail Pharmacy
CVS Health Corporation $78.81 (6.3%) (18.4%) $106.67 $69.30 $84,046 $27,531 $3,458 $109,113 $177,526 $12,760 $10,331 Dec-16 Dec-16 $187,785 $12,789 $10,286 0.6x 8.6x 0.6x 8.5x
Walgreens Boots Alliance Inc 81.94 (1.0%) 2.8% 88.00 71.50 88,447 18,872 9,598 98,816 116,819 8,087 6,369 Nov-16 Aug-16 128,998 9,708 8,194 0.8x 12.2x 0.8x 10.2x
Rite Aid Corporation(1) 5.62 (16.2%) (27.9%) 8.77 5.60 5,914 7,275 227 13,009 32,574 1,249 696 Nov-16 Feb-16 33,024 1,251 642 0.4x 10.4x 0.4x 10.4x
Number of Companies 3 Median: (6.3%) (18.4%) Total $178,407 $220,939 $326,919 $349,807 0.6x 10.4x 0.6x 10.2x
Market Cap. Weighted Average: (8.9%) (19.5%) 1.0x 10.4x 0.8x 9.8x
Specialty Pharmacy
Diplomat Pharmacy, Inc. $13.74 (40.7%) (49.5%) $38.94 $12.25 $917 $154 $17 $1,077 $4,252 $107 $61 Sep-16 Dec-15 $5,184 $106 $86 0.3x 10.0x 0.2x 10.1x
Number of Companies 1 Median: (40.7%) (49.5%) Total $917 $1,077 $4,252 $5,184 0.3x 10.0x 0.2x 10.1x
Market Cap. Weighted Average: (40.7%) NM 0.3x 10.0x 0.2x 10.1x
Specialty Pharmacy Management
Express Scripts Holding Company $68.88 2.2% (4.2%) $80.02 $64.46 $42,473 $16,109 $2,305 $57,007 $101,745 $7,404 $5,161 Sep-16 Dec-15 $104,480 $7,399 $7,131 0.6x 7.7x 0.5x 7.7x
PharMerica Corporation 24.80 4.2% (16.5%) 31.02 19.20 763 397 7 1,161 2,077 131 75 Sep-16 Dec-15 2,260 148 109 0.6x 8.9x 0.5x 7.9x
Number of Companies 2 Median: 3.2% (10.3%) Total $43,236 $58,168 $103,822 $106,740 0.6x 8.3x 0.5x 7.8x
Market Cap. Weighted Average: 2.2% (4.4%) 0.6x 7.7x 0.5x 7.7x
TEV/ LTM Multiples TEV/ Fwd MultiplesCompany Name
Equity
Mkt.
Value
Total DebtCash and
Equiv.
Total Ent.
Value
(TEV)
Latest Twelve Months
(LTM)LTM
Period
Latest
FYE Date
Forward Twelve Month
Estimate
Source: FactSet as of January 31, 2017.
(1) To be acquired by Walgreens (NYSE:WBA) in a $17.2 billion transaction announced October 27, 2015.
PAGE |
PUBLIC COMPARABLES
9
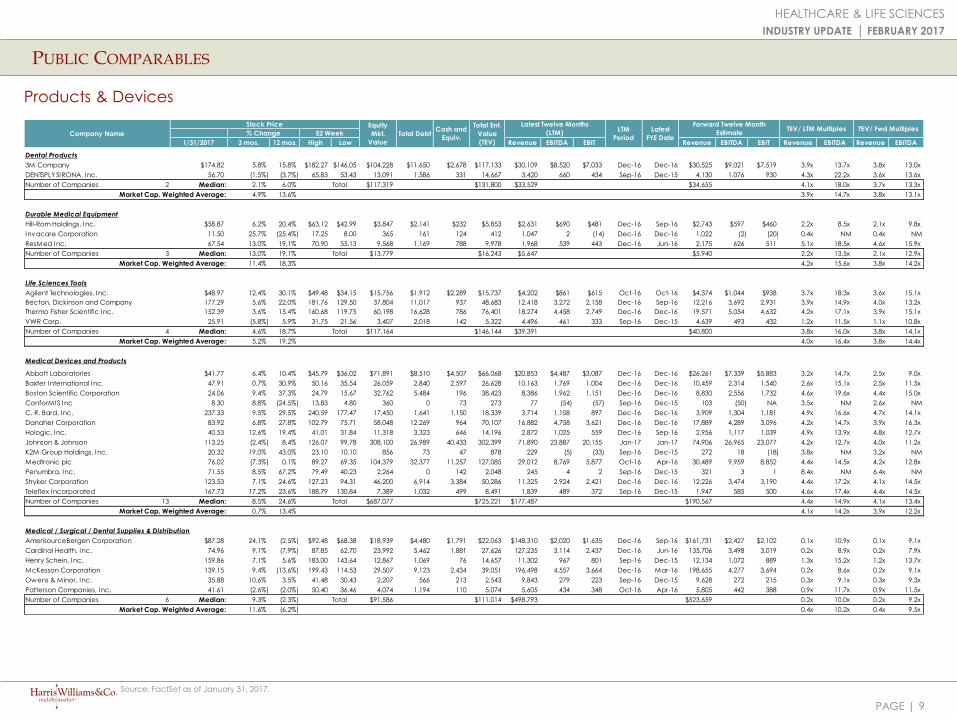
Products & Devices
HEALTHCARE & LIFE SCIENCES
INDUSTRY UPDATE │ FEBRUARY 2017
Source: FactSet as of January 31, 2017.
Stock Price
% Change 52 Week
1/31/2017 3 mos. 12 mos. High Low Revenue EBITDA EBIT Revenue EBITDA EBIT Revenue EBITDA Revenue EBITDA
Dental Products
3M Company $174.82 5.8% 15.8% $182.27 $146.05 $104,228 $11,650 $2,678 $117,133 $30,109 $8,520 $7,033 Dec-16 Dec-16 $30,525 $9,021 $7,519 3.9x 13.7x 3.8x 13.0x
DENTSPLY SIRONA, Inc. 56.70 (1.5%) (3.7%) 65.83 53.43 13,091 1,586 331 14,667 3,420 660 434 Sep-16 Dec-15 4,130 1,076 930 4.3x 22.2x 3.6x 13.6x
Number of Companies 2 Median: 2.1% 6.0% Total $117,319 $131,800 $33,529 $34,655 4.1x 18.0x 3.7x 13.3x
Market Cap. Weighted Average: 4.9% 13.6% 3.9x 14.7x 3.8x 13.1x
Durable Medical Equipment
Hill-Rom Holdings, Inc. $58.87 6.2% 20.4% $63.12 $42.99 $3,847 $2,141 $232 $5,853 $2,631 $690 $481 Dec-16 Sep-16 $2,743 $597 $460 2.2x 8.5x 2.1x 9.8x
Invacare Corporation 11.50 25.7% (25.4%) 17.25 8.00 365 161 124 412 1,047 2 (14) Dec-16 Dec-16 1,022 (2) (20) 0.4x NM 0.4x NM
ResMed Inc. 67.54 13.0% 19.1% 70.90 55.13 9,568 1,169 788 9,978 1,968 539 443 Dec-16 Jun-16 2,175 626 511 5.1x 18.5x 4.6x 15.9x
Number of Companies 3 Median: 13.0% 19.1% Total $13,779 $16,243 $5,647 $5,940 2.2x 13.5x 2.1x 12.9x
Market Cap. Weighted Average: 11.4% 18.3% 4.2x 15.6x 3.8x 14.2x
Life Sciences Tools
Agilent Technologies, Inc. $48.97 12.4% 30.1% $49.48 $34.15 $15,756 $1,912 $2,289 $15,737 $4,202 $861 $615 Oct-16 Oct-16 $4,374 $1,044 $938 3.7x 18.3x 3.6x 15.1x
Becton, Dickinson and Company 177.29 5.6% 22.0% 181.76 129.50 37,804 11,017 937 48,683 12,418 3,272 2,158 Dec-16 Sep-16 12,216 3,692 2,931 3.9x 14.9x 4.0x 13.2x
Thermo Fisher Scientific Inc. 152.39 3.6% 15.4% 160.68 119.75 60,198 16,628 786 76,401 18,274 4,458 2,749 Dec-16 Dec-16 19,571 5,054 4,632 4.2x 17.1x 3.9x 15.1x
VWR Corp. 25.91 (5.8%) 5.9% 31.75 21.56 3,407 2,018 142 5,322 4,496 461 333 Sep-16 Dec-15 4,639 493 432 1.2x 11.5x 1.1x 10.8x
Number of Companies 4 Median: 4.6% 18.7% Total $117,164 $146,144 $39,391 $40,800 3.8x 16.0x 3.8x 14.1x
Market Cap. Weighted Average: 5.2% 19.2% 4.0x 16.4x 3.8x 14.4x
Medical Devices and Products
Abbott Laboratories $41.77 6.4% 10.4% $45.79 $36.02 $71,891 $8,510 $4,507 $66,068 $20,853 $4,487 $3,087 Dec-16 Dec-16 $26,261 $7,339 $5,883 3.2x 14.7x 2.5x 9.0x
Baxter International Inc. 47.91 0.7% 30.9% 50.16 35.54 26,059 2,840 2,597 26,628 10,163 1,769 1,004 Dec-16 Dec-16 10,459 2,314 1,540 2.6x 15.1x 2.5x 11.5x
Boston Scientific Corporation 24.06 9.4% 37.3% 24.79 15.67 32,762 5,484 196 38,423 8,386 1,962 1,151 Dec-16 Dec-16 8,830 2,556 1,732 4.6x 19.6x 4.4x 15.0x
ConforMIS Inc 8.30 8.8% (24.5%) 13.83 4.80 360 0 73 273 77 (54) (57) Sep-16 Dec-15 103 (50) NA 3.5x NM 2.6x NM
C. R. Bard, Inc. 237.33 9.5% 29.5% 240.59 177.47 17,450 1,641 1,150 18,339 3,714 1,108 897 Dec-16 Dec-16 3,909 1,304 1,181 4.9x 16.6x 4.7x 14.1x
Danaher Corporation 83.92 6.8% 27.8% 102.79 75.71 58,048 12,269 964 70,107 16,882 4,758 3,621 Dec-16 Dec-16 17,889 4,289 3,096 4.2x 14.7x 3.9x 16.3x
Hologic, Inc. 40.53 12.6% 19.4% 41.01 31.84 11,318 3,323 646 14,196 2,872 1,025 559 Dec-16 Sep-16 2,956 1,117 1,039 4.9x 13.9x 4.8x 12.7x
Johnson & Johnson 113.25 (2.4%) 8.4% 126.07 99.78 308,100 26,989 40,433 302,399 71,890 23,887 20,155 Jan-17 Jan-17 74,906 26,965 23,077 4.2x 12.7x 4.0x 11.2x
K2M Group Holdings, Inc. 20.32 19.0% 43.0% 23.10 10.10 856 73 47 878 229 (5) (33) Sep-16 Dec-15 272 18 (18) 3.8x NM 3.2x NM
Medtronic plc 76.02 (7.3%) 0.1% 89.27 69.35 104,379 32,377 11,257 127,085 29,012 8,769 5,877 Oct-16 Apr-16 30,489 9,959 8,852 4.4x 14.5x 4.2x 12.8x
Penumbra, Inc. 71.55 8.5% 67.2% 79.49 40.23 2,264 0 142 2,048 245 4 2 Sep-16 Dec-15 321 3 1 8.4x NM 6.4x NM
Stryker Corporation 123.53 7.1% 24.6% 127.23 94.31 46,200 6,914 3,384 50,286 11,325 2,924 2,421 Dec-16 Dec-16 12,226 3,474 3,190 4.4x 17.2x 4.1x 14.5x
Teleflex Incorporated 167.73 17.2% 23.6% 188.79 130.84 7,389 1,032 499 8,491 1,839 489 372 Sep-16 Dec-15 1,947 585 500 4.6x 17.4x 4.4x 14.5x
Number of Companies 13 Median: 8.5% 24.6% Total $687,077 $725,221 $177,487 $190,567 4.4x 14.9x 4.1x 13.4x
Market Cap. Weighted Average: 0.7% 13.4% 4.1x 14.2x 3.9x 12.2x
Medical / Surgical / Dental Supplies & Distribution
AmerisourceBergen Corporation $87.28 24.1% (2.5%) $92.48 $68.38 $18,939 $4,480 $1,791 $22,063 $148,310 $2,020 $1,635 Dec-16 Sep-16 $161,731 $2,427 $2,102 0.1x 10.9x 0.1x 9.1x
Cardinal Health, Inc. 74.96 9.1% (7.9%) 87.85 62.70 23,992 5,462 1,881 27,626 127,235 3,114 2,437 Dec-16 Jun-16 135,706 3,498 3,019 0.2x 8.9x 0.2x 7.9x
Henry Schein, Inc. 159.86 7.1% 5.6% 183.00 143.64 12,867 1,069 76 14,657 11,302 967 801 Sep-16 Dec-15 12,134 1,072 889 1.3x 15.2x 1.2x 13.7x
McKesson Corporation 139.15 9.4% (13.6%) 199.43 114.53 29,507 9,123 2,434 39,051 196,498 4,557 3,664 Dec-16 Mar-16 198,655 4,277 3,694 0.2x 8.6x 0.2x 9.1x
Owens & Minor, Inc. 35.88 10.6% 3.5% 41.48 30.43 2,207 566 213 2,543 9,843 279 223 Sep-16 Dec-15 9,628 272 215 0.3x 9.1x 0.3x 9.3x
Patterson Companies, Inc. 41.61 (2.6%) (2.0%) 50.40 36.46 4,074 1,194 110 5,074 5,605 434 348 Oct-16 Apr-16 5,805 442 388 0.9x 11.7x 0.9x 11.5x
Number of Companies 6 Median: 9.3% (2.3%) Total $91,586 $111,014 $498,793 $523,659 0.2x 10.0x 0.2x 9.2x
Market Cap. Weighted Average: 11.6% (6.2%) 0.4x 10.2x 0.4x 9.5x
TEV/ LTM Multiples TEV/ Fwd MultiplesCash and
Equiv.Company Name
Equity
Mkt.
Value
Total Debt
Total Ent.
Value
(TEV)
Latest Twelve Months
(LTM)LTM
Period
Latest
FYE Date
Forward Twelve Month
Estimate
PAGE |
PUBLIC COMPARABLES
10
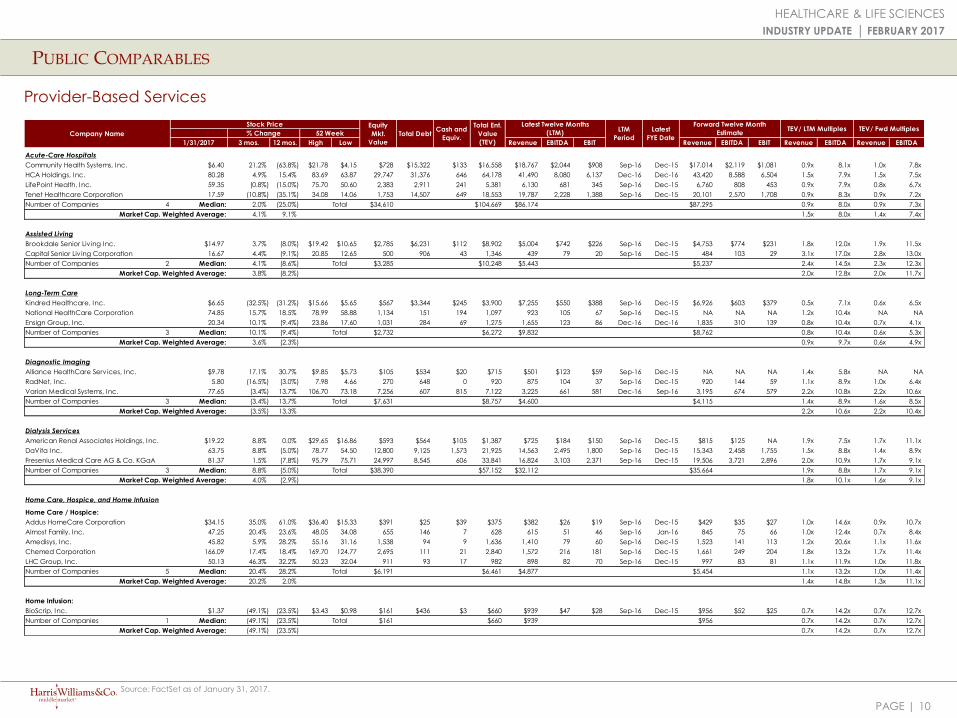
Provider-Based Services
HEALTHCARE & LIFE SCIENCES
INDUSTRY UPDATE │ FEBRUARY 2017
Stock Price
% Change 52 Week
1/31/2017 3 mos. 12 mos. High Low Revenue EBITDA EBIT Revenue EBITDA EBIT Revenue EBITDA Revenue EBITDA
Acute-Care Hospitals
Community Health Systems, Inc. $6.40 21.2% (63.8%) $21.78 $4.15 $728 $15,322 $133 $16,558 $18,767 $2,044 $908 Sep-16 Dec-15 $17,014 $2,119 $1,081 0.9x 8.1x 1.0x 7.8x
HCA Holdings, Inc. 80.28 4.9% 15.4% 83.69 63.87 29,747 31,376 646 64,178 41,490 8,080 6,137 Dec-16 Dec-16 43,420 8,588 6,504 1.5x 7.9x 1.5x 7.5x
LifePoint Health, Inc. 59.35 (0.8%) (15.0%) 75.70 50.60 2,383 2,911 241 5,381 6,130 681 345 Sep-16 Dec-15 6,760 808 453 0.9x 7.9x 0.8x 6.7x
Tenet Healthcare Corporation 17.59 (10.8%) (35.1%) 34.08 14.06 1,753 14,507 649 18,553 19,787 2,228 1,388 Sep-16 Dec-15 20,101 2,570 1,708 0.9x 8.3x 0.9x 7.2x
Number of Companies 4 Median: 2.0% (25.0%) Total $34,610 $104,669 $86,174 $87,295 0.9x 8.0x 0.9x 7.3x
Market Cap. Weighted Average: 4.1% 9.1% 1.5x 8.0x 1.4x 7.4x
Assisted Living
Brookdale Senior Liv ing Inc. $14.97 3.7% (8.0%) $19.42 $10.65 $2,785 $6,231 $112 $8,902 $5,004 $742 $226 Sep-16 Dec-15 $4,753 $774 $231 1.8x 12.0x 1.9x 11.5x
Capital Senior Liv ing Corporation 16.67 4.4% (9.1%) 20.85 12.65 500 906 43 1,346 439 79 20 Sep-16 Dec-15 484 103 29 3.1x 17.0x 2.8x 13.0x
Number of Companies 2 Median: 4.1% (8.6%) Total $3,285 $10,248 $5,443 $5,237 2.4x 14.5x 2.3x 12.3x
Market Cap. Weighted Average: 3.8% (8.2%) 2.0x 12.8x 2.0x 11.7x
Long-Term Care
Kindred Healthcare, Inc. $6.65 (32.5%) (31.2%) $15.66 $5.65 $567 $3,344 $245 $3,900 $7,255 $550 $388 Sep-16 Dec-15 $6,926 $603 $379 0.5x 7.1x 0.6x 6.5x
National HealthCare Corporation 74.85 15.7% 18.5% 78.99 58.88 1,134 151 194 1,097 923 105 67 Sep-16 Dec-15 NA NA NA 1.2x 10.4x NA NA
Ensign Group, Inc. 20.34 10.1% (9.4%) 23.86 17.60 1,031 284 69 1,275 1,655 123 86 Dec-16 Dec-16 1,835 310 139 0.8x 10.4x 0.7x 4.1x
Number of Companies 3 Median: 10.1% (9.4%) Total $2,732 $6,272 $9,832 $8,762 0.8x 10.4x 0.6x 5.3x
Market Cap. Weighted Average: 3.6% (2.3%) 0.9x 9.7x 0.6x 4.9x
Diagnostic Imaging
Alliance HealthCare Serv ices, Inc. $9.78 17.1% 30.7% $9.85 $5.73 $105 $534 $20 $715 $501 $123 $59 Sep-16 Dec-15 NA NA NA 1.4x 5.8x NA NA
RadNet, Inc. 5.80 (16.5%) (3.0%) 7.98 4.66 270 648 0 920 875 104 37 Sep-16 Dec-15 920 144 59 1.1x 8.9x 1.0x 6.4x
Varian Medical Systems, Inc. 77.65 (3.4%) 13.7% 106.70 73.18 7,256 607 815 7,122 3,225 661 581 Dec-16 Sep-16 3,195 674 579 2.2x 10.8x 2.2x 10.6x
Number of Companies 3 Median: (3.4%) 13.7% Total $7,631 $8,757 $4,600 $4,115 1.4x 8.9x 1.6x 8.5x
Market Cap. Weighted Average: (3.5%) 13.3% 2.2x 10.6x 2.2x 10.4x
Dialysis Services
American Renal Associates Holdings, Inc. $19.22 8.8% 0.0% $29.65 $16.86 $593 $564 $105 $1,387 $725 $184 $150 Sep-16 Dec-15 $815 $125 NA 1.9x 7.5x 1.7x 11.1x
DaVita Inc. 63.75 8.8% (5.0%) 78.77 54.50 12,800 9,125 1,573 21,925 14,563 2,495 1,800 Sep-16 Dec-15 15,343 2,458 1,755 1.5x 8.8x 1.4x 8.9x
Fresenius Medical Care AG & Co. KGaA 81.37 1.5% (7.8%) 95.79 75.71 24,997 8,545 606 33,841 16,824 3,103 2,371 Sep-16 Dec-15 19,506 3,721 2,896 2.0x 10.9x 1.7x 9.1x
Number of Companies 3 Median: 8.8% (5.0%) Total $38,390 $57,152 $32,112 $35,664 1.9x 8.8x 1.7x 9.1x
Market Cap. Weighted Average: 4.0% (2.9%) 1.8x 10.1x 1.6x 9.1x
Home Care, Hospice, and Home Infusion
Home Care / Hospice:
Addus HomeCare Corporation $34.15 35.0% 61.0% $36.40 $15.33 $391 $25 $39 $375 $382 $26 $19 Sep-16 Dec-15 $429 $35 $27 1.0x 14.6x 0.9x 10.7x
Almost Family, Inc. 47.25 20.4% 23.6% 48.05 34.08 655 146 7 628 615 51 46 Sep-16 Jan-16 845 75 66 1.0x 12.4x 0.7x 8.4x
Amedisys, Inc. 45.82 5.9% 28.2% 55.16 31.16 1,538 94 9 1,636 1,410 79 60 Sep-16 Dec-15 1,523 141 113 1.2x 20.6x 1.1x 11.6x
Chemed Corporation 166.09 17.4% 18.4% 169.70 124.77 2,695 111 21 2,840 1,572 216 181 Sep-16 Dec-15 1,661 249 204 1.8x 13.2x 1.7x 11.4x
LHC Group, Inc. 50.13 46.3% 32.2% 50.23 32.04 911 93 17 982 898 82 70 Sep-16 Dec-15 997 83 81 1.1x 11.9x 1.0x 11.8x
Number of Companies 5 Median: 20.4% 28.2% Total $6,191 $6,461 $4,877 $5,454 1.1x 13.2x 1.0x 11.4x
Market Cap. Weighted Average: 20.2% 2.0% 1.4x 14.8x 1.3x 11.1x
Home Infusion:
BioScrip, Inc. $1.37 (49.1%) (23.5%) $3.43 $0.98 $161 $436 $3 $660 $939 $47 $28 Sep-16 Dec-15 $956 $52 $25 0.7x 14.2x 0.7x 12.7x
Number of Companies 1 Median: (49.1%) (23.5%) Total $161 $660 $939 $956 0.7x 14.2x 0.7x 12.7x
Market Cap. Weighted Average: (49.1%) (23.5%) 0.7x 14.2x 0.7x 12.7x
TEV/ Fwd MultiplesTEV/ LTM MultiplesCompany Name
Equity
Mkt.
Value
Total DebtCash and
Equiv.
Total Ent.
Value
(TEV)
Latest Twelve Months
(LTM)LTM
Period
Latest
FYE Date
Forward Twelve Month
Estimate
Source: FactSet as of January 31, 2017.
PAGE |
Stock Price
% Change 52 Week
1/31/2017 3 mos. 12 mos. High Low Revenue EBITDA EBIT Revenue EBITDA EBIT Revenue EBITDA Revenue EBITDA
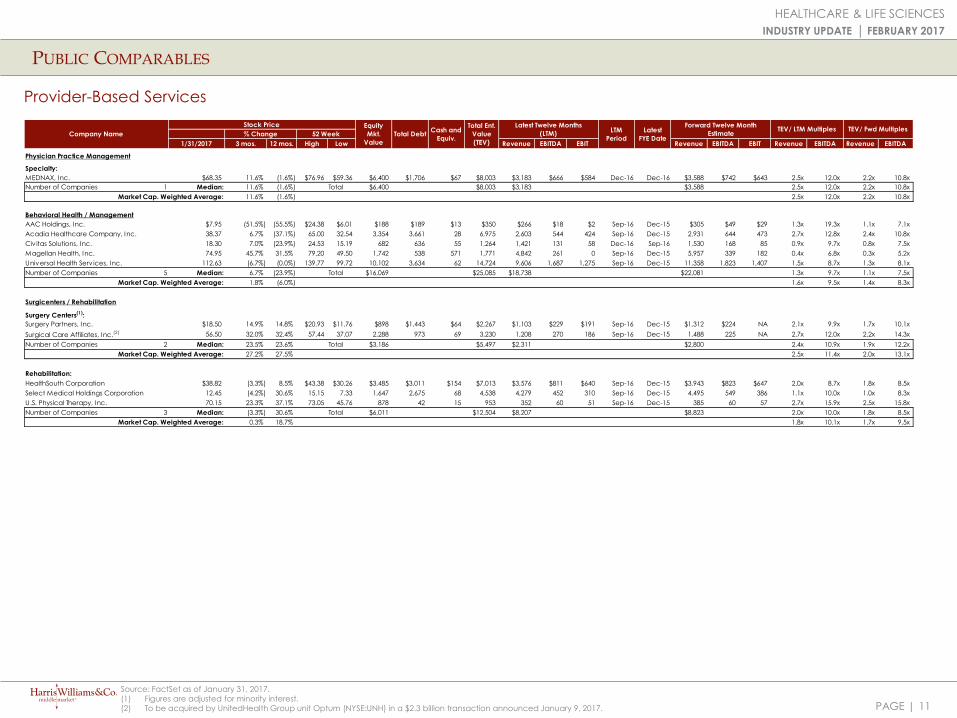
Physician Practice Management
Specialty:
MEDNAX, Inc. $68.35 11.6% (1.6%) $76.96 $59.36 $6,400 $1,706 $67 $8,003 $3,183 $666 $584 Dec-16 Dec-16 $3,588 $742 $643 2.5x 12.0x 2.2x 10.8x
Number of Companies 1 Median: 11.6% (1.6%) Total $6,400 $8,003 $3,183 $3,588 2.5x 12.0x 2.2x 10.8x
Market Cap. Weighted Average: 11.6% (1.6%) 2.5x 12.0x 2.2x 10.8x
Behavioral Health / Management
AAC Holdings, Inc. $7.95 (51.5%) (55.5%) $24.38 $6.01 $188 $189 $13 $350 $266 $18 $2 Sep-16 Dec-15 $305 $49 $29 1.3x 19.3x 1.1x 7.1x
Acadia Healthcare Company, Inc. 38.37 6.7% (37.1%) 65.00 32.54 3,354 3,661 28 6,975 2,603 544 424 Sep-16 Dec-15 2,931 644 473 2.7x 12.8x 2.4x 10.8x
Civ itas Solutions, Inc. 18.30 7.0% (23.9%) 24.53 15.19 682 636 55 1,264 1,421 131 58 Dec-16 Sep-16 1,530 168 85 0.9x 9.7x 0.8x 7.5x
Magellan Health, Inc. 74.95 45.7% 31.5% 79.20 49.50 1,742 538 571 1,771 4,842 261 0 Sep-16 Dec-15 5,957 339 182 0.4x 6.8x 0.3x 5.2x
Universal Health Serv ices, Inc. 112.63 (6.7%) (0.0%) 139.77 99.72 10,102 3,634 62 14,724 9,606 1,687 1,275 Sep-16 Dec-15 11,358 1,823 1,407 1.5x 8.7x 1.3x 8.1x
Number of Companies 5 Median: 6.7% (23.9%) Total $16,069 $25,085 $18,738 $22,081 1.3x 9.7x 1.1x 7.5x
Market Cap. Weighted Average: 1.8% (6.0%) 1.6x 9.5x 1.4x 8.3x
Surgicenters / Rehabilitation
Surgery Centers(1):
Surgery Partners, Inc. $18.50 14.9% 14.8% $20.93 $11.76 $898 $1,443 $64 $2,267 $1,103 $229 $191 Sep-16 Dec-15 $1,312 $224 NA 2.1x 9.9x 1.7x 10.1x
Surgical Care Affiliates, Inc.(2) 56.50 32.0% 32.4% 57.44 37.07 2,288 973 69 3,230 1,208 270 186 Sep-16 Dec-15 1,488 225 NA 2.7x 12.0x 2.2x 14.3x
Number of Companies 2 Median: 23.5% 23.6% Total $3,186 $5,497 $2,311 $2,800 2.4x 10.9x 1.9x 12.2x
Market Cap. Weighted Average: 27.2% 27.5% 2.5x 11.4x 2.0x 13.1x
Rehabilitation:
HealthSouth Corporation $38.82 (3.3%) 8.5% $43.38 $30.26 $3,485 $3,011 $154 $7,013 $3,576 $811 $640 Sep-16 Dec-15 $3,943 $823 $647 2.0x 8.7x 1.8x 8.5x
Select Medical Holdings Corporation 12.45 (4.2%) 30.6% 15.15 7.33 1,647 2,675 68 4,538 4,279 452 310 Sep-16 Dec-15 4,495 549 386 1.1x 10.0x 1.0x 8.3x
U.S. Physical Therapy, Inc. 70.15 23.3% 37.1% 73.05 45.76 878 42 15 953 352 60 51 Sep-16 Dec-15 385 60 57 2.7x 15.9x 2.5x 15.8x
Number of Companies 3 Median: (3.3%) 30.6% Total $6,011 $12,504 $8,207 $8,823 2.0x 10.0x 1.8x 8.5x
Market Cap. Weighted Average: 0.3% 18.7% 1.8x 10.1x 1.7x 9.5x
Company Name
Equity
Mkt.
Value
Total DebtCash and
Equiv.
Total Ent.
Value
(TEV)
Latest Twelve Months
(LTM)LTM
Period
Latest
FYE Date
Forward Twelve Month
EstimateTEV/ LTM Multiples TEV/ Fwd Multiples
PUBLIC COMPARABLES
11
HEALTHCARE & LIFE SCIENCES
INDUSTRY UPDATE │ FEBRUARY 2017
Provider-Based Services
Source: FactSet as of January 31, 2017.
(1) Figures are adjusted for minority interest.
(2) To be acquired by UnitedHealth Group unit Optum (NYSE:UNH) in a $2.3 billion transaction announced January 9, 2017.
PAGE |
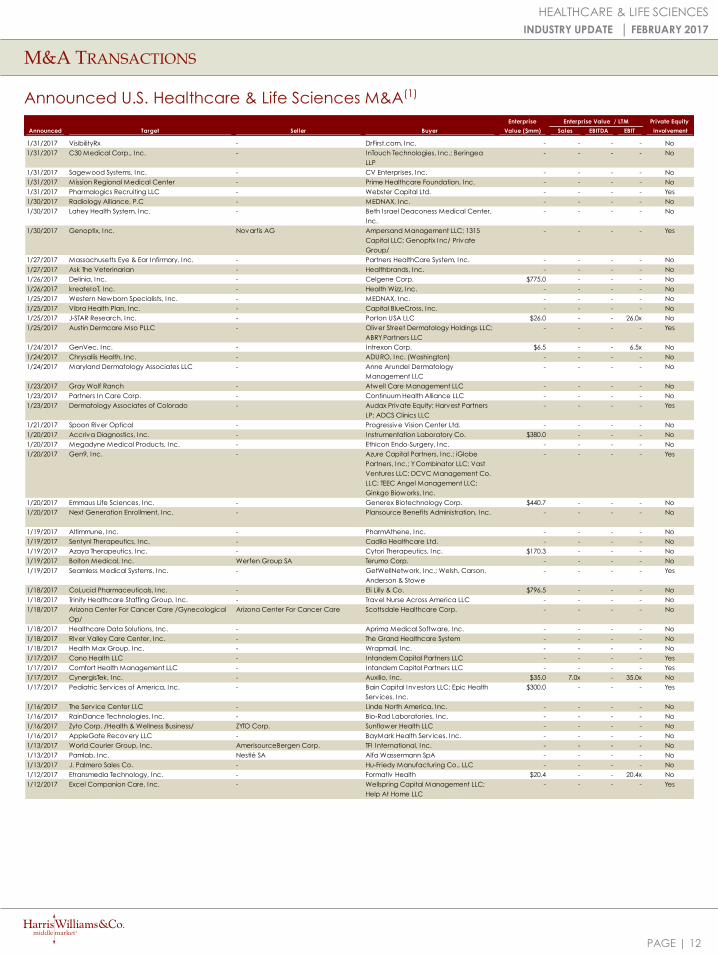
Enterprise Enterprise Value / LTM Private Equity
Announced Target Seller Buyer Value ($mm) Sales EBITDA EBIT Involvement
1/31/2017 VisibilityRx - DrFirst.com, Inc. - - - - No
1/31/2017 C30 Medical Corp., Inc. - InTouch Technologies, Inc.; Beringea
LLP
- - - - No
1/31/2017 Sagewood Systems, Inc. - CV Enterprises, Inc. - - - - No
1/31/2017 Mission Regional Medical Center - Prime Healthcare Foundation, Inc. - - - - No
1/31/2017 Pharmalogics Recruiting LLC - Webster Capital Ltd. - - - - Yes
1/30/2017 Radiology Alliance, P.C - MEDNAX, Inc. - - - - No
1/30/2017 Lahey Health System, Inc. - Beth I srael Deaconess Medical Center,
Inc.
- - - - No
1/30/2017 Genoptix, Inc. Novartis AG Ampersand Management LLC; 1315
Capital LLC; Genoptix Inc/ Private
Group/
- - - - Yes
1/27/2017 Massachusetts Eye & Ear Infirmary, Inc. - Partners HealthCare System, Inc. - - - - No
1/27/2017 Ask The Veterinarian - Healthbrands, Inc. - - - - No
1/26/2017 Delinia, Inc. - Celgene Corp. $775.0 - - - No
1/26/2017 kreateIoT, Inc. - Health Wizz, Inc. - - - - No
1/25/2017 Western Newborn Specialists, Inc. - MEDNAX, Inc. - - - - No
1/25/2017 Vibra Health Plan, Inc. - Capital BlueCross, Inc. - - - - No
1/25/2017 J-STAR Research, Inc. - Porton USA LLC $26.0 - - 26.0x No
1/25/2017 Austin Dermcare Mso PLLC - Oliver Street Dermatology Holdings LLC;
ABRY Partners LLC
- - - - Yes
1/24/2017 GenVec, Inc. - Intrexon Corp. $6.5 - - 6.5x No
1/24/2017 Chrysallis Health, Inc. - ADURO, Inc. (Washington) - - - - No
1/24/2017 Maryland Dermatology Associates LLC - Anne Arundel Dermatology
Management LLC
- - - - No
1/23/2017 Gray Wolf Ranch - Atwell Care Management LLC - - - - No
1/23/2017 Partners In Care Corp. - Continuum Health Alliance LLC - - - - No
1/23/2017 Dermatology Associates of Colorado - Audax Private Equity; Harvest Partners
LP; ADCS Clinics LLC
- - - - Yes
1/21/2017 Spoon River Optical - Progressive Vision Center Ltd. - - - - No
1/20/2017 Accriva Diagnostics, Inc. - Instrumentation Laboratory Co. $380.0 - - - No
1/20/2017 Megadyne Medical Products, Inc. - Ethicon Endo-Surgery, Inc. - - - - No
1/20/2017 Gen9, Inc. - Azure Capital Partners, Inc.; iGlobe
Partners, Inc.; Y Combinator LLC; Vast
Ventures LLC; DCVC Management Co.
LLC; TEEC Angel Management LLC;
Ginkgo Bioworks, Inc.
- - - - Yes
1/20/2017 Emmaus Life Sciences, Inc. - Generex Biotechnology Corp. $440.7 - - - No
1/20/2017 Next Generation Enrollment, Inc. - Plansource Benefits Administration, Inc. - - - - No
1/19/2017 Altimmune, Inc. - PharmAthene, Inc. - - - - No
1/19/2017 Sentynl Therapeutics, Inc. - Cadila Healthcare Ltd. - - - - No
1/19/2017 Azaya Therapeutics, Inc. - Cytori Therapeutics, Inc. $170.3 - - - No
1/19/2017 Bolton Medical, Inc. Werfen Group SA Terumo Corp. - - - - No
1/19/2017 Seamless Medical Systems, Inc. - GetWellNetwork, Inc.; Welsh, Carson,
Anderson & Stowe
- - - - Yes
1/18/2017 CoLucid Pharmaceuticals, Inc. - Eli Lilly & Co. $796.5 - - - No
1/18/2017 Trinity Healthcare Staffing Group, Inc. - Travel Nurse Across America LLC - - - - No
1/18/2017 Arizona Center For Cancer Care /Gynecological
Op/
Arizona Center For Cancer Care Scottsdale Healthcare Corp. - - - - No
1/18/2017 Healthcare Data Solutions, Inc. - Aprima Medical Software, Inc. - - - - No
1/18/2017 River Valley Care Center, Inc. - The Grand Healthcare System - - - - No
1/18/2017 Health Max Group, Inc. - Wrapmail, Inc. - - - - No
1/17/2017 Cano Health LLC - Intandem Capital Partners LLC - - - - Yes
1/17/2017 Comfort Health Management LLC - Intandem Capital Partners LLC - - - - Yes
1/17/2017 CynergisTek, Inc. - Auxilio, Inc. $35.0 7.0x - 35.0x No
1/17/2017 Pediatric Serv ices of America, Inc. - Bain Capital Investors LLC; Epic Health
Serv ices, Inc.
$300.0 - - - Yes
1/16/2017 The Serv ice Center LLC - Linde North America, Inc. - - - - No
1/16/2017 RainDance Technologies, Inc. - Bio-Rad Laboratories, Inc. - - - - No
1/16/2017 Zyto Corp. /Health & Wellness Business/ ZYTO Corp. Sunflower Health LLC - - - - No
1/16/2017 AppleGate Recovery LLC - BayMark Health Serv ices, Inc. - - - - No
1/13/2017 World Courier Group, Inc. AmerisourceBergen Corp. TFI International, Inc. - - - - No
1/13/2017 Pamlab, Inc. Nestlé SA Alfa Wassermann SpA - - - - No
1/13/2017 J. Palmero Sales Co. - Hu-Friedy Manufacturing Co., LLC - - - - No
1/12/2017 Etransmedia Technology, Inc. - Formativ Health $20.4 - - 20.4x No
1/12/2017 Excel Companion Care, Inc. - Wellspring Capital Management LLC;
Help At Home LLC
- - - - Yes
M&A TRANSACTIONS
12
Announced U.S. Healthcare & Life Sciences M&A(1)
HEALTHCARE & LIFE SCIENCES
INDUSTRY UPDATE │ FEBRUARY 2017
PAGE |
M&A TRANSACTIONS
13
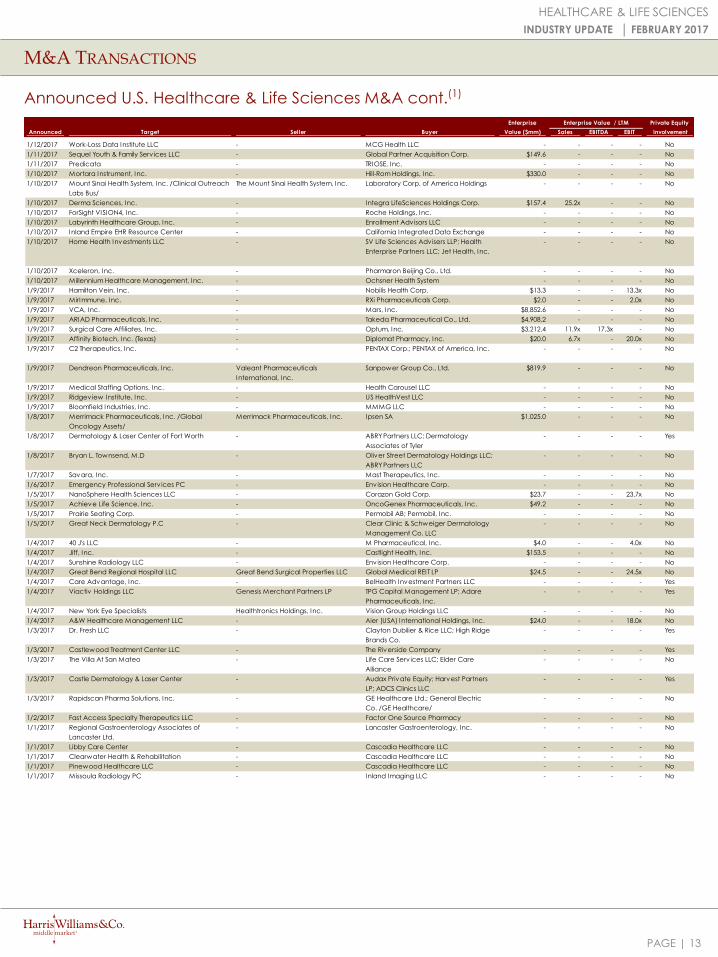
Announced U.S. Healthcare & Life Sciences M&A cont.(1)
HEALTHCARE & LIFE SCIENCES
INDUSTRY UPDATE │ FEBRUARY 2017
Enterprise Enterprise Value / LTM Private Equity
Announced Target Seller Buyer Value ($mm) Sales EBITDA EBIT Involvement
1/12/2017 Work-Loss Data Institute LLC - MCG Health LLC - - - - No
1/11/2017 Sequel Youth & Family Serv ices LLC - Global Partner Acquisition Corp. $149.6 - - - No
1/11/2017 Predicata - TRIOSE, Inc. - - - - No
1/10/2017 Mortara Instrument, Inc. - Hill-Rom Holdings, Inc. $330.0 - - - No
1/10/2017 Mount Sinai Health System, Inc. /Clinical Outreach
Labs Bus/
The Mount Sinai Health System, Inc. Laboratory Corp. of America Holdings - - - - No
1/10/2017 Derma Sciences, Inc. - Integra LifeSciences Holdings Corp. $157.4 25.2x - - No
1/10/2017 ForSight VISION4, Inc. - Roche Holdings, Inc. - - - - No
1/10/2017 Labyrinth Healthcare Group, Inc. - Enrollment Advisors LLC - - - - No
1/10/2017 Inland Empire EHR Resource Center - California Integrated Data Exchange - - - - No
1/10/2017 Home Health Investments LLC - SV Life Sciences Advisers LLP; Health
Enterprise Partners LLC; Jet Health, Inc.
- - - - No
1/10/2017 Xceleron, Inc. - Pharmaron Beijing Co., Ltd. - - - - No
1/10/2017 Millennium Healthcare Management, Inc. - Ochsner Health System - - - - No
1/9/2017 Hamilton Vein, Inc. - Nobilis Health Corp. $13.3 - - 13.3x No
1/9/2017 MirImmune, Inc. - RXi Pharmaceuticals Corp. $2.0 - - 2.0x No
1/9/2017 VCA, Inc. - Mars, Inc. $8,852.6 - - - No
1/9/2017 ARIAD Pharmaceuticals, Inc. - Takeda Pharmaceutical Co., Ltd. $4,908.2 - - - No
1/9/2017 Surgical Care Affiliates, Inc. - Optum, Inc. $3,212.4 11.9x 17.3x - No
1/9/2017 Affinity Biotech, Inc. (Texas) - Diplomat Pharmacy, Inc. $20.0 6.7x - 20.0x No
1/9/2017 C2 Therapeutics, Inc. - PENTAX Corp.; PENTAX of America, Inc. - - - - No
1/9/2017 Dendreon Pharmaceuticals, Inc. Valeant Pharmaceuticals
International, Inc.
Sanpower Group Co., Ltd. $819.9 - - - No
1/9/2017 Medical Staffing Options, Inc. - Health Carousel LLC - - - - No
1/9/2017 Ridgeview Institute, Inc. - US HealthVest LLC - - - - No
1/9/2017 Bloomfield Industries, Inc. - MMMG LLC - - - - No
1/8/2017 Merrimack Pharmaceuticals, Inc. /Global
Oncology Assets/
Merrimack Pharmaceuticals, Inc. Ipsen SA $1,025.0 - - - No
1/8/2017 Dermatology & Laser Center of Fort Worth - ABRY Partners LLC; Dermatology
Associates of Tyler
- - - - Yes
1/8/2017 Bryan L. Townsend, M.D - Oliver Street Dermatology Holdings LLC;
ABRY Partners LLC
- - - - No
1/7/2017 Savara, Inc. - Mast Therapeutics, Inc. - - - - No
1/6/2017 Emergency Professional Serv ices PC - Envision Healthcare Corp. - - - - No
1/5/2017 NanoSphere Health Sciences LLC - Corazon Gold Corp. $23.7 - - 23.7x No
1/5/2017 Achieve Life Science, Inc. - OncoGenex Pharmaceuticals, Inc. $49.2 - - - No
1/5/2017 Prairie Seating Corp. - Permobil AB; Permobil, Inc. - - - - No
1/5/2017 Great Neck Dermatology P.C - Clear Clinic & Schweiger Dermatology
Management Co. LLC
- - - - No
1/4/2017 40 J's LLC - M Pharmaceutical, Inc. $4.0 - - 4.0x No
1/4/2017 Jiff, Inc. - Castlight Health, Inc. $153.5 - - - No
1/4/2017 Sunshine Radiology LLC - Envision Healthcare Corp. - - - - No
1/4/2017 Great Bend Regional Hospital LLC Great Bend Surgical Properties LLC Global Medical REIT LP $24.5 - - 24.5x No
1/4/2017 Care Advantage, Inc. - BelHealth Investment Partners LLC - - - - Yes
1/4/2017 Viactiv Holdings LLC Genesis Merchant Partners LP TPG Capital Management LP; Adare
Pharmaceuticals, Inc.
- - - - Yes
1/4/2017 New York Eye Specialists Healthtronics Holdings, Inc. Vision Group Holdings LLC - - - - No
1/4/2017 A&W Healthcare Management LLC - Aier (USA) International Holdings, Inc. $24.0 - - 18.0x No
1/3/2017 Dr. Fresh LLC - Clayton Dubilier & Rice LLC; High Ridge
Brands Co.
- - - - Yes
1/3/2017 Castlewood Treatment Center LLC - The Riverside Company - - - - Yes
1/3/2017 The Villa At San Mateo - Life Care Serv ices LLC; Elder Care
Alliance
- - - - No
1/3/2017 Castle Dermatology & Laser Center - Audax Private Equity; Harvest Partners
LP; ADCS Clinics LLC
- - - - Yes
1/3/2017 Rapidscan Pharma Solutions, Inc. - GE Healthcare Ltd.; General Electric
Co. /GE Healthcare/
- - - - No
1/2/2017 Fast Access Specialty Therapeutics LLC - Factor One Source Pharmacy - - - - No
1/1/2017 Regional Gastroenterology Associates of
Lancaster Ltd.
- Lancaster Gastroenterology, Inc. - - - - No
1/1/2017 Libby Care Center - Cascadia Healthcare LLC - - - - No
1/1/2017 Clearwater Health & Rehabilitation - Cascadia Healthcare LLC - - - - No
1/1/2017 Pinewood Healthcare LLC - Cascadia Healthcare LLC - - - - No
1/1/2017 Missoula Radiology PC - Inland Imaging LLC - - - - No
Energy, Power & Infrastructure
IndustrialsHealthcare & Life Sciences
Transportation & Logistics
Aerospace, Defense & Government
Services
Business Services
Building Products & Materials
Technology, Media & Telecom
Specialty Distribution
Consumer
PAGE |
HARRIS WILLIAMS & CO. OFFICE LOCATIONS
UNITED STATES EUROPE
FrankfurtBockenheimer Landstrasse 33-3560325 Frankfurt, GermanyPhone: +49 069 3650638 00
London63 Brook StreetLondon W1K 4HS, EnglandPhone: +44 (0) 20 7518 8900
NETWORK OFFICES
Beijing
Hong Kong
Mumbai
New Delhi
Shanghai
Harris Williams & Co. has a broad range of industry expertise, which creates powerful opportunities.Our clients benefit from our deep-sector experience, integrated industry intelligence andcollaboration across the firm, and our commitment to learning what makes them unique. For moreinformation, visit our website.
Richmond (Headquarters)1001 Haxall Point9th FloorRichmond, Virginia 23219Phone: +1 (804) 648-0072
San Francisco575 Market Street31st FloorSan Francisco, California 94105Phone: +1 (415) 288-4260
Washington, D.C. 800 17th St. NW2nd FloorWashington, D.C. 20006Phone: +1 (202) 207-2300
BostonOne International PlaceSuite 2620Boston, Massachusetts 02110Phone: +1 (617) 482-7501
Cleveland1900 East 9th Street20th FloorCleveland, Ohio 44114Phone: +1 (216) 689-2400
Minneapolis222 South 9th StreetSuite 3350Minneapolis, Minnesota 55402Phone: +1 (612) 359-2700
Healthcare & Life Sciences
OUR FIRM
HEALTHCARE & LIFE SCIENCES
INDUSTRY UPDATE │ FEBRUARY 2017
14
PAGE |
HARRIS WILLIAMS & CO.
15
SOURCES
Harris Williams & Co. (www.harriswilliams.com) is a preeminent middle market investment bank focused on the advisory needs of clients worldwide. The firm has deep industry knowledge, global transaction expertise, and an unwavering commitment to excellence. Harris Williams & Co. provides sell-side and acquisition advisory, restructuring advisory, board advisory, private placements, and capital markets advisory services.
Investment banking services are provided by Harris Williams LLC, a registered broker-dealer and member of FINRA and SIPC, and Harris Williams & Co. Ltd, which is a private limited company incorporated under English law with its registered office at 5th Floor, 6 St. Andrew Street, London EC4A 3AE, UK, registered with the Registrar of Companies for England and Wales (registration number 7078852). Harris Williams & Co. Ltd is authorized and regulated by the Financial Conduct Authority. Harris Williams & Co. is a trade name under which Harris Williams LLC and Harris Williams & Co. Ltd conduct business.
THIS REPORT MAY CONTAIN REFERENCES TO REGISTERED TRADEMARKS, SERVICE MARKS AND COPYRIGHTS OWNED BY THIRD-PARTY INFORMATION PROVIDERS. NONE OF THE THIRD-PARTY INFORMATION PROVIDERS IS ENDORSING THE OFFERING OF, AND SHALL NOT IN ANY WAY BE DEEMED AN ISSUER OR UNDERWRITER OF, THE SECURITIES, FINANCIAL INSTRUMENTS OR OTHER INVESTMENTS DISCUSSED IN THIS REPORT, AND SHALL NOT HAVE ANY LIABILITY OR RESPONSIBILITY FOR ANY STATEMENTS MADE IN THE REPORT OR FOR ANY FINANCIAL STATEMENTS, FINANCIAL PROJECTIONS OR OTHER FINANCIAL INFORMATION CONTAINED OR ATTACHED AS AN EXHIBIT TO THE REPORT. FOR MORE INFORMATION ABOUT THE MATERIALS PROVIDED BY SUCH THIRD PARTIES, PLEASE CONTACT US.
The information and views contained in this report were prepared by Harris Williams & Co. (“Harris Williams”). It is not a research report, as such term is defined by applicable law and regulations, and is provided for informational purposes only. It is not to be construed as an offer to buy or sell or a solicitation of an offer to buy or sell any financial instruments or to participate in any particular trading strategy. The information contained herein is believed by Harris Williams to be reliable, but Harris Williams makes no representation as to the accuracy or completeness of such information. Harris Williams and/or its affiliates may be market makers or specialists in, act as advisers or lenders to, have positions in and effect transactions in securities of companies mentioned herein and also may provide, may have provided, or may seek to provide investment banking services for those companies. In addition, Harris Williams and/or its affiliates or their respective officers, directors and employees may hold long or short positions in the securities, options thereon or other related financial products of companies discussed herein. Opinions, estimates and projections in this report constitute Harris Williams’ judgment and are subject to change without notice. The financial instruments discussed in this report may not be suitable for all investors, and investors must make their own investment decisions using their own independent advisors as they believe necessary and based upon their specific financial situations and investment objectives. Also, past performance is not necessarily indicative of future results. No part of this material may be copied or duplicated in any form or by any means, or redistributed, without Harris Williams’ prior written consent.
Copyright© 2017 Harris Williams & Co., all rights reserved.
DISCLOSURES
HEALTHCARE & LIFE SCIENCES
INDUSTRY UPDATE │ FEBRUARY 2017
1. FactSet.
2. Company Filings.
3. S&P.
4. PNC Debt Capital Markets.
5. Thomson Financial.
6. Bloomberg.