industry spotlight vol-i - crif high mark
TRANSCRIPT

Industry Spotlight Vol-IIndian Drugs & Pharmaceutical Industry
September 2020

Analytical Contacts
Nikunj BhagatSenior Vice President, Head of [email protected]
Subhrangshu ChattopadhyaySenior Vice President, National Head – [email protected]
Rakesh RallapalliSenior Manager, Research & [email protected]
Saumya SahAnalyst, Research & [email protected]
Kailash Chander BhanooChief General Manager, Economic Research and Data Analysis [email protected]
R. PrabhavathiDeputy General Manager, Economic Researchand Data Analysis [email protected]
Soham NagManager, Economic Research and Data Analysis [email protected]

Foreword
SIDBI, in collaboration with CRIF, is pleased to introduce ‘Industry Spotlight’, a quarterly report based on Industry sectors/ clusters, with focus on MSMEs. Every quarter we would be coming out with such an analytical report on different sectors with Pharmaceutical being first in the series. The report attempts to provide insights to the policymakers, bankers and other stakeholders including MSMEs drawing upon analysis of granular cluster level data.
The initiative is part of SIDBI’s continuous endeavour to make MSMEs real-ize their inherent potential in the light of the latest industry and market trends as well as emerging opportunities. I hope that this report, over time, will emerge as an important reference point for the policy makers and practitioners in the MSME ecosystem.
I congratulate both SIDBI and CRIF High Mark teams for their collaboration in bringing out this report.
Shri Manoj MittalDeputy Managing DirectorSmall Industries DevelopmentBank of India
It is a proud moment for CRIF India to partner with Small Industries Development Bank of India (SIDBI) for the launch of ‘Industry Spotlight’, a quarterly report that will provide insights and trends on key industry sectors in each edition.
India has kickstarted its promising journey towards growth and is expect-ed to become one of the fastest-growing economies in the upcoming years. With the advent of government initiatives like ‘Make In India’, the vision doesn’t seem far from reality. When the voyage is so inspiring, it is vital to closely track its progress. To this effect, CRIF is proud to have part-nered with SIDBI and present a deep-dive analysis into the Drugs and Pharmaceutical Industry in the first edition of Industry Spotlight. Owing to the prowess contributed by this sector in manufacturing high quality, affordable medicines, we are looking at its promising future. It is now the perfect time to closely monitor this industry to tap the growth prospects.
CRIF High Mark, majority owned by CRIF, is India's first full-service credit bureau, licensed by RBI, operating in retail, commercial and microfinance sectors. We pioneered the setup of the first microfinance credit bureau in India. Today, we are partnered with over 5,800 financial institutions in the country and assist millions of credit related decisions every month.
We believe in providing the support and acceleration to every business and individual who relies on CRIF for their credit decisions. Through this initiative, we aim to provide deep-seated insights to exemplify the next steps for different industry sectors in each edition.
. Navin ChandaniMD & CEO, CRIF High Mark
Table ofCONTENTS
01 Indian Drugs and Pharmaceutical Industry | Executive Summary
03 Introduction & Current Market Scenario
04 Credit Landscape in Drugs and Pharmaceutical Industry
04 • Portfolio and NPA Trends
07 • Drugs and Pharmaceutical Industry – Borrower Landscape
10 • Borrowing and NPA trends in MSME borrower Segment
13 • Established and Emerging Drugs and Pharmaceutical Clusters in India
17 • Exports Credit Landscape
19Way forward for Drugs and Pharmaceutical Industry20Revised MSME Definition – Impact on Bureau Classification of MSMEs
23 Disclaimer
23 About CRIF India
23 About SIDBI

MSME sector plays a critical role in the economic growth of our nation. In India, more than 6 crore MSMEs contribute around 29.7% of the GDP and provide employment to more than 11 crore persons. The sector has also been a major export contributor, with 48.1% share in the total exports during FY 2018-19. During the recent years, the sector has undergone various structural changes on account of introduction of GST, formalization etc., which contributed significantly to the robustness of the sector.
MSME sector is a vibrant and dynamic sector and holds the promise of taking the GDP growth of the nation to next level. However, the sector has also been badly affected, at times, due to the global trade tensions and the slowdown in demand affecting the large corporates. Accordingly, it becomes critical for the policy makers to frame policies based on real time tracking of the data. Flow of credit has always been a good indicator for assessing the health of the industry sectors and their prospects.
In view of the above, SIDBI and CRIF High Mark have collaborated to present the “Industry Spotlight” report, which presents sectoral deep dive of a prospective export intensive industry sector in its each edition. The report analyses the credit landscape of the sector, major lenders, sectoral composition, borrower segments along with its risk analysis. The unique feature of the report is the analysis of credit flow at cluster level, with further slicing at the level of established v/s emerging clusters in the respective industry sector, while factoring the state of MSMEs in the respective cluster.
Clusters have been the mainstay of the Indian growth story and through this report, SIDBI and CRIF High Markaim to provide more granular cluster level data to the policymakers, to enable them to identify the pain areas in the industry sector. The quarterly report shall cover one industry sector in each edition and shall revisit the sectors after covering the major sectors in first round.
The credit profile in the report pertains to finance extended to drugs and pharmaceutical industry in India. The credit analysis presented in this report has been done purely on fund-based facilities i.e. considering Term Loans, Working Capital Loans, etc. and non fund-based facilities have been excluded from the analysis.
Borrower segments are segregated based on the overall credit exposure of enterprises, inclusive of funded and non-funded exposure i.e. Micro segment being <1 crore exposure, Small 1 crore - 10 crore, Medium 10 crore - 50 crore, Mid Corporates 50 crore – 100 crore and Large Corporates >100 crore exposure. The report is an amalgamation of insights from primary data reported to the bureau as of February 2020 and secondary data collated from publicly available domains.
Preamble
Note:The report is based on credit data up to February 2020 and the statements and projections do not account for the impact of COVID-19 on the sector.

Page: 01
Indian Drugs and Pharmaceutical Industry
Executive Summary
The Indian drugs and pharmaceutical industry has played an important role in driving better health outcomes across the world through its high quality, affordable and accessible medicines. The industry not only drives better public health outcomes, but also contributes to the economy in a significant way.
1 Annual Report 2019-20, Department of Pharmaceuticals, Government of India2 The Indian pharmaceutical industry – the way forward, June 2019, Indian Pharmaceutical Alliance3 Pharmexcil – Pharmaceuticals Export Promotion Council of India, Ministry of Commerce and Industry4 Annual Report 2019-20, Department of Pharmaceuticals, Government of India5 Figures in ‘K’ throughout this report refer to ‘thousands’6 Y-o-Y change throughout this report is based on observations between Mar 2019 and Feb 20207 Actual performance may vary due to COVID -19 impact which may be beneficial or detrimental to the sector
Growth in Drugs and Pharmaceutical Industry The industry has grown rapidly over the last decade, leading to increased penetration of generics globally. India is world’s third-largest pharmaceutical market in terms of volume. The annual turnover of the drugs and pharmaceutical industry stood at INR 2.5 lakh crore during the year 2018-191 and it provides direct and indirect employment to over 2.7 million people2.
Export Prowess The drugs and pharmaceutical industry contributes significantly to India’s exports. In 2019-20, the country’s exports stood at US$ 20.6 bn with a Y-o-Y growth of 7.8%3. India accounts for 20% of global exports in generic drugs4. Low cost of production and R&D, availability of large skilled labour pool boosts efficiency of Indian drugs and pharmaceutical companies, giving a fillip to exports.
Growth in Credit The overall amount of credit availed by the drugs and pharmaceutical industry stood at INR 78K crore5 (credit value) as of Feb 2020, at a Y-o-Y6 growth of nearly 9%. The quarterly growth in March 2019 stood high at 7.1% after which growth was muted in June 2019. As the industry witnessed a slowdown coming into June 2019, due to low volume sales, credit availed by the sector also saw muted growth of only 1.6% Q-o-Q. However, the industry has regained some momentum and simple projection based on past quarterly trends suggest that the industry portfolio is expected to grow by nearly 13% by Mar 20217.
Portfolio Health The drugs and pharmaceutical industry has largely witnessed a healthy portfolio in the recent past with NPAs declining every quarter in the last one year. As of Feb 2020, the NPAs of the industry stood at 9.5%, declining by over 3% in a span of one year and by 9 bps over the previous quarter.

Export Credit Growth Overall amount of export credit (value) to the sector witnessed 15% Y-o-Y growth as of Feb 2020. On a quarterly comparison, export credit to the industry has seen a continuous increase in the last year, with a significant growth in Mar 2019, standing at 14%. Thereafter as a slowdown in the industry ensued, export credit also witnessed muted growth.
76% of the overall number of loans to the sector is availed by micro, small and medium segment of the borrowersThe drugs and pharmaceutical industry in India comprises of many small and big players. 76% of the overall number of loans (credit volume) to the sector is concentrated in the MSME borrower segment. Micro borrower segment alone constitutes 43% of the credit volume as of Feb 2020 although their share has reduced by 3.2% over the previous year. Share of large corporates has increased by nearly 4% over the previous year.
86% of the overall credit amount to the sector is concentrated in the top 10 clusters Top 10 drugs and pharmaceutical clusters in India constitute 86% of the overall amount of credit (credit value) availed by the industry as of Feb 2020. Established clusters comprising Mumbai Cluster, Hyderabad Cluster, Ahmedabad, Delhi – NCR Cluster, Chennai Cluster and Vadodara Cluster together contribute to 73% of the overall sectoral credit. Some of the identified emerging clusters based on portfolio growth and performance are Solan, Pune, and Haridwar. The MSME credit to the top 10 clusters stood at INR 11.6K crore as of Feb 2020, constituting 17% of the credit portfolio in these top 10 clusters.
Page: 02

The Indian drugs and pharmaceutical industry has played a key role in driving better health outcomes across the world through its high quality, affordable and accessible medicines. The industry has grown rapidly over the last decade, leading to increased penetration of generics globally. Along with driving public health outcomes, the industry has contributed to India’s economic growth. Today, India is world’s third-largest pharmaceutical market in terms of volume.
The drugs and pharmaceutical industry in India produces a range of bulk drugs –key ingredients having medicinal properties that form basic raw materials for formulations. Bulk drugs account for roughly 20% of the industry output, while formulations form the rest. It has been observed that this sector has 25K credit active units as of Feb 2020. India has the second highest number of United States Food and Drug Administration (USFDA) approved facilities.
The annual turnover of the drugs and pharmaceutical industry stood at INR 2.5 lakh crore during the year 2018-198. The industry directly and indirectly provides employment to over 2.7 million people, in high-skill areaslike R&D and manufacturing9.
One of the key strengths of the drugs and pharmaceutical industry in India is its strong export potential, with Indian exports reaching over 200 countries including highly regulated markets of US, West Europe, Japan, andAustralia. The country exported pharmaceuticals to the tune of US$ 20.6 bn at a Y-o-Y growth of 7.8% in 2019-20 over the previous year, backed by the government’s thrust towards manufacturing under the ‘Make in India’ initiative. India is the largest supplier of cost-effective generic medicines to the world, accounting for 20% of global exports10.
Indian manufacturers also rely heavily on Active Pharmaceuticals Ingredients (APIs) from China to produce medicine formulations, procuring around 70% from China, the top global producer and exporter of APIs by volume. The recent Coronavirus (COVID -19) outbreak in China in Dec 2019 has disrupted imports from China. However, Indian drugs and pharmaceutical industry with a manufacturing prowess and with government’s support has been eyeing this as an opportunity to push manufacturing of bulk drugs to reduce dependency on China.
Experts believe that Indian drugs and pharmaceutical industry owing to its strong fundamentals, superior manufacturing capabilities, advanced technologies and the availability of a large labour pool can embrace these challenges and overcome this transient environment to strengthen its growth story and emerge as one of the top 5 pharmaceutical industries by value by 203011.
Page: 03
Introduction & Current Market Scenario
8 Annual Report 2019-20, Department of Pharmaceuticals, Government of India9 The Indian pharmaceutical industry – the way forward, June 2019, Indian Pharmaceutical Alliance 10 Annual Report 2019-20, Department of Pharmaceuticals, Government of India11 The Indian pharmaceutical industry – the way forward, June 2019, Indian Pharmaceutical Alliance

Credit Landscape in Drugs and Pharmaceutical IndustryPortfolio and NPA TrendsThe Indian drugs and pharmaceutical industry has positioned itself as a strong and potent industry with a large manufacturing base and a sizable number of diverse players leading to an increased need for fundingby various financiers such as Private and Public sector banks, NBFCs and Foreign Banks.
The industry has witnessed continuous growth in credit availed by value12, observed over the previous 12 quarters, standing at INR 78K crore as on Feb 2020, at a Y-o-Y growth of nearly 9%. The quarterly growth in March 2019 stood high at 7.1% after which growth was muted in June 2019. As the industry witnessed a slowdown coming into June 2019, due to low volume sales, credit availed by the sector also saw muted growth of only 1.6% Q-o-Q. In terms of volume13, the industry stood at 57K active loans as of Feb 2020.
The demand for credit in the drugs and pharmaceutical industry is observed to peak in Q3/Q4 of the financial years in the last 3 to 4 years with the peak volumes being as high as nearly 4.8K loans sanctioned in just one quarter. The average quarterly volume of loans disbursed is observed to be nearly 3.65K14.
12 Value, in the context of credit, refers to the Rupee value or amount of loans in Rupee crore, throughout this report13 Volume, in the context of credit, refers to the number of loans active/disbursed as applicable, throughout this report 14 The new loan disbursements data is available with the credit bureau with a lag of a quarter to two, which is also disrupted recently due to COVID-19 situation in India
Source: CRIF Bureau, India
51,8
31 C
rM
ar-1
7
Jun-
17
Sep-
17
Dec
-17
Mar
-18
Jun-
18
Sep-
18
Dec
-18
Mar
-19
Jun-
19
Sep-
19
Dec
-19
Feb-
20
52,2
80 C
r0.
87%
57,4
56 C
r9.
90%
60,0
25 C
r4.
47%
60,4
75 C
r0.
75%
62,3
66 C
r3.
13%
65,4
53 C
r4.
95%
67,0
36 C
r2.
42%
71,8
02 C
r7.
11% 72,9
39 C
r1.5
8%
75,3
99 C
r3.
37%
75,5
82 C
r0.
24%
78,0
75 C
r3.
30%
Chart 1: Drugs and Pharmaceutical Industry – Overall Credit Trends
Credit portfolio by value stands at INR 78K croreas of Feb 2020, with a Y-o-Y growth of nearly 9%
Page: 04

Observing the past quarterly trends and simple projections*,the credit to the sector is expected to be 13% higher by March2021 to nearly INR 87K crore
*Actual performance may vary due to COVID -19 impact which may be beneficial or detrimental to the sector
15.0
4%
Mar
-17
Jun-
17
Sep-
17
Dec
-17
Mar
-18
Jun-
18
Sep-
18
Dec
-18
Mar
-19
Jun-
19
Sep-
19
Dec
-19
Feb-
20
15.7
7%
14.3
7%
14.9
2%
15.0
0%
14.8
0%
13.3
1%
13.2
9%
12.5
1%
10.8
7%
10.3
0%
9.5
9%
9.5
0%
Chart 2: Drugs and Pharmaceutical Industry – Delinquency Trend
Source: CRIF Bureau, India
The drugs and pharmaceutical industry has largely seen a healthy portfolio with NPAs declining every quarter in the last one year. As of Feb 2020, the NPAs of the industry stood at 9.5%, declining by over 3% in a span of one year and by 9 bps over the previous quarter (Refer Chart 2).
Public sector banks are the largest contributors in providing finance to the drugs and pharmaceutical industry with a share of 36.8% in volume as of Feb 2020, followed by private banks (35.4%), NBFCs (16.5%), foreign banks (8.1%) and others (3.0%) (Refer Chart 3a). In terms of value however, private banks have the largest share at 37.2%, followed by foreign banks (25.9%), public sector banks come close at 21.6%, NBFCs (11.4%) and others (3.7%) as of Feb 2020. (Refer Chart 3b).
NPAs stand at 9.5% as of Feb 2020, declining byover 3% in a span of one year
Page: 05

As of Feb 2020, term loans credit offered by private banksstand at 17.6%. Corresponding NPAs stand at only 1%
Chart 3a: Drugs and Pharmaceutical Industry – Financing Pattern (Market Share by Volume)
Chart 3b: Drugs and Pharmaceutical Industry – Financing Pattern (Market Share by Value)
Others3.04%
NBFCs16.52%
Others3.75% NBFCs
11.45%
ForeignBanks8.13% Foreign
Banks25.91%
PrivateBanks
35.43%
PrivateBanks37.27%
78,075 Cr57K
Public Sector Banks36.87%
Public Sector Banks21.63%
Source: CRIF Bureau, India
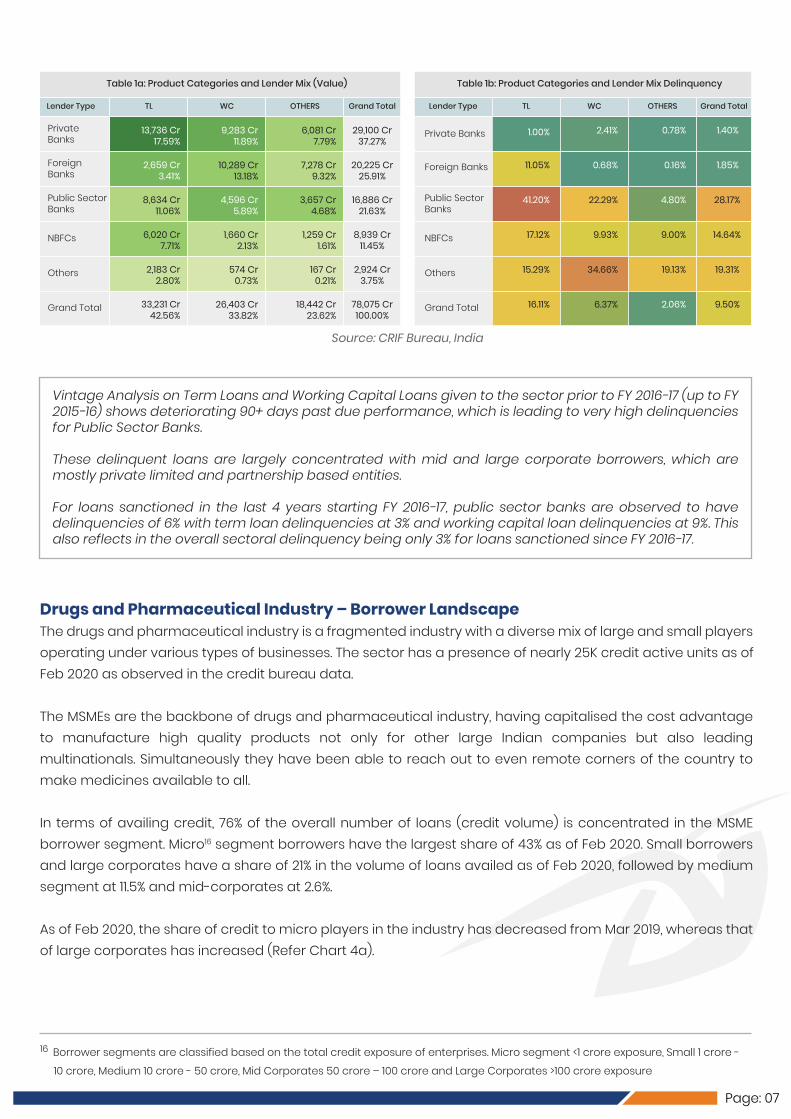
In terms of value, term loans account for 42.5% in overall credit availed by drugs and pharmaceutical industryas of Feb 2020 (Refer Table 1a), while the overall NPAs of term loans stand at 16.1% (Refer Table 1b). Working capital loans form 34% of the portfolio of drugs and pharmaceutical industry, with 6.3% delinquency, followedby other funded credit facilities at 24%15. Out of the total finance availed as of Feb 2020, term loans credit offered by private banks stand at 17.6%. Corresponding NPAs stand at 1%. Term loans credit offered by Public sector Banks has a share of 11% of the overall portfolio as of Feb 2020, while the corresponding NPAs stand at 41.2%. Working capital loans credit offered by foreign banks have the highest share (13.18%) of the overall credit availed, compared to other lenders, with delinquency at <1%, as of Feb 2020. Further, as of Feb 2020, out of the total term loans credit, 41% is availed from private banks while, out of the total working capital loans credit, 39% is availed from foreign banks.
Public Sector banks have the largest share in credit volume (36.8%), Private banks, the largest share in value (37.2%)
15 Other fund based credit facilities include credit data which is submitted to the bureau without a specific credit facility identified against the loan account.
Page: 06
Drugs and Pharmaceutical Industry – Borrower LandscapeThe drugs and pharmaceutical industry is a fragmented industry with a diverse mix of large and small players operating under various types of businesses. The sector has a presence of nearly 25K credit active units as ofFeb 2020 as observed in the credit bureau data.
The MSMEs are the backbone of drugs and pharmaceutical industry, having capitalised the cost advantage to manufacture high quality products not only for other large Indian companies but also leading multinationals. Simultaneously they have been able to reach out to even remote corners of the country to make medicines available to all.
In terms of availing credit, 76% of the overall number of loans (credit volume) is concentrated in the MSME borrower segment. Micro16 segment borrowers have the largest share of 43% as of Feb 2020. Small borrowers and large corporates have a share of 21% in the volume of loans availed as of Feb 2020, followed by medium segment at 11.5% and mid-corporates at 2.6%.
As of Feb 2020, the share of credit to micro players in the industry has decreased from Mar 2019, whereas that of large corporates has increased (Refer Chart 4a).
16 Borrower segments are classified based on the total credit exposure of enterprises. Micro segment <1 crore exposure, Small 1 crore - 10 crore, Medium 10 crore - 50 crore, Mid Corporates 50 crore – 100 crore and Large Corporates >100 crore exposure
Vintage Analysis on Term Loans and Working Capital Loans given to the sector prior to FY 2016-17 (up to FY 2015-16) shows deteriorating 90+ days past due performance, which is leading to very high delinquencies for Public Sector Banks.
These delinquent loans are largely concentrated with mid and large corporate borrowers, which are mostly private limited and partnership based entities.
For loans sanctioned in the last 4 years starting FY 2016-17, public sector banks are observed to have delinquencies of 6% with term loan delinquencies at 3% and working capital loan delinquencies at 9%. This also reflects in the overall sectoral delinquency being only 3% for loans sanctioned since FY 2016-17.
Lender Type TL WC
Table 1a: Product Categories and Lender Mix (Value)
OTHERS Grand Total
PrivateBanks
Others
Grand Total
NBFCs
Public SectorBanks
Foreign Banks
9,283 Cr11.89%
574 Cr0.73%
26,403 Cr33.82%
1,660 Cr2.13%
4,596 Cr5.89%
10,289 Cr13.18%
6,081 Cr7.79%
167 Cr0.21%
18,442 Cr23.62%
1,259 Cr1.61%
3,657 Cr4.68%
7,278 Cr9.32%
29,100 Cr37.27%
2,924 Cr3.75%
78,075 Cr100.00%
8,939 Cr11.45%
16,886 Cr21.63%
20,225 Cr25.91%
13,736 Cr17.59%
2,183 Cr2.80%
33,231 Cr42.56%
6,020 Cr7.71%
8,634 Cr11.06%
2,659 Cr3.41%
Lender Type TL WC
Table 1b: Product Categories and Lender Mix Delinquency
OTHERS Grand Total
Private Banks
Others
Grand Total
NBFCs
Public SectorBanks
Foreign Banks
2.41%
34.66%
6.37%
9.93%
22.29%
0.68%
0.78%
19.13%
2.06%
9.00%
4.80%
0.16%
1.40%
19.31%
9.50%
14.64%
28.17%
1.85%
1.00%
15.29%
16.11%
17.12%
41.20%
11.05%
Source: CRIF Bureau, India
Page: 07

17 Annual Report 2019-20-Department of Pharmaceuticals, Government of India
In terms of value, it is the large corporates who have availed of the maximum loan amount, observed over the last 3 years, standing at 68.5% as of Feb 2020 (Refer Chart 4b). Credit to MSME borrowers together constitutes 23% of the overall portfolio as of Feb 2020.
Owing to its huge potential for growth and contribution to health and economy, the drugs and pharmaceutical sector, considered a sunrise sector has been a strong focus of the government. According to the Union Budget 2020-21, the budget allocation to the Department of Pharmaceuticals, Government of India, has been US$ 44.47 Mn. Further, as per Economic Survey 2019-20, government expenditure (as a percentage of GDP) increased to 1.6 per cent in FY20 from 1.2 per cent in FY15 for health. The government has permitted FDI up to 100% in pharmaceutical sector through automatic route for greenfield investment and up to 74% for brownfield investment. Beyond 74%, FDI in pharmaceutical sector for Brownfield investment is permissible through Government approval route17.
Credit to MSME borrowers constitutes 23% of the overallportfolio by value as of Feb 2020
Page: 08
Chart 4a: Drugs and Pharmaceutical Industry – Market Share by Borrower Segments (Volume)
Chart 4b: Drugs and Pharmaceutical Industry –Market Share by Borrower Segments (Value)
Figure in K in chart 4a indicates the number of loans sanctioned. Figure in chart 4b indicates the amount sanctioned in INR Crore.Source: CRIF Bureau, India
76% of the overall credit by volume is concentrated in theMSME borrower segment. Micro segment borrowers havethe largest share of 43%
March 2018 March 2019 February 2020
28K
March 2018 March 2019 February 2020
Micro Medium Small Mid-Corporate Large Corporate
21.37%12K17.41%
11K11.24%6K
2.64%, 1K3.91%, 2K
2.96%, 1K
21.09%12K21.13%
13K18.49%
9K
11.58%7K10.99%
7K10.52%
5K
43.32%25K46.57%
28K56.79%
68.52%53,49966.98%
48,09262.18%37,601
8.45%6,5947.52%
5,4019.03%5,461
12.14%9,47912.69%
9,11514.34%8,671
8.37%, 6,5389.80%7,03410.66%
6,445
2.52%, 1,9663.01%, 2,1603.80%, 2,297

The government's thrust on universal healthcare through Ayushman Bharat which is the National Health Protection Scheme18, which will cover over 10.74 crore poor and vulnerable entitled families (approximately 50 crore beneficiaries) providing coverage of INR 5L per family per year for secondary and tertiary care hospitalization, is likely to bring more individuals under the ambit of formalised healthcare, in turn providing a fillip to the industry.
The government has also emphasised the importance of alternative medicine – AYUSH (Ayurveda, Yoga & Naturopathy, Unani, Siddha and Homoeopathy) for better health solutions and earmarked a budget of INR 1939.7 crore for 2019-202019. To encourage small and medium scale AYUSH units, the Department of Pharmaceuticals, Government of India proposes to extend the benefits of an interest subvention to at least 250 such AYUSH pharmaceutical units.
These measures have encouraged small and large players to set up manufacturing facilities in the country which has fuelled demand for credit.
An assessment of type of borrower with the type of business reveals that largest share of borrowers is the micro segment borrowers which are proprietorship entities by business. Nearly 13% of the credit volume is availed by small borrowers which are private limited entities. Another 10% is the micro segment borrowers in private limited entities. 15% of the credit by volume is availed by large corporates which are public limited entities.
18 Pradhan Mantri Jan Arogya Yojana, Government of India19 Ministry of AYUSH, Government of India, total budget allocation
Page: 09
21.27%
BorrowerSegment Proprietorship Partnership Private Limited Others Grand Total
Micro
Small
Medium
Mid -Corporate
LargeCorporate
10.01%
3.05% 12.55%
0.39% 7.82%
0.12% 1.40%
0.1%
6.06%
3.62%
0.77%
0.31%
0.16% 5.94%
Public Limited
0.84%
1.26%
2.43%
0.71%
15.04%
5.14%
0.60%
0.18%
0.09%
0.22%
43.32%
21.06%
11.58%
2.64%
21.37%
Grand Total 24.84% 10.92% 37.73% 20.28% 6.24% 100.0%
Table 2: Drugs and Pharmaceutical Industry – Borrower Landscape as of Feb 2020
Source: CRIF Bureau, India
One-fifth of the loans to the sector are availed byProprietorship based micro borrowers (21%). Overall,Private Limited entities have 37% of the total loans to the sector and micro entities enjoy 43% of the total loans to the sector
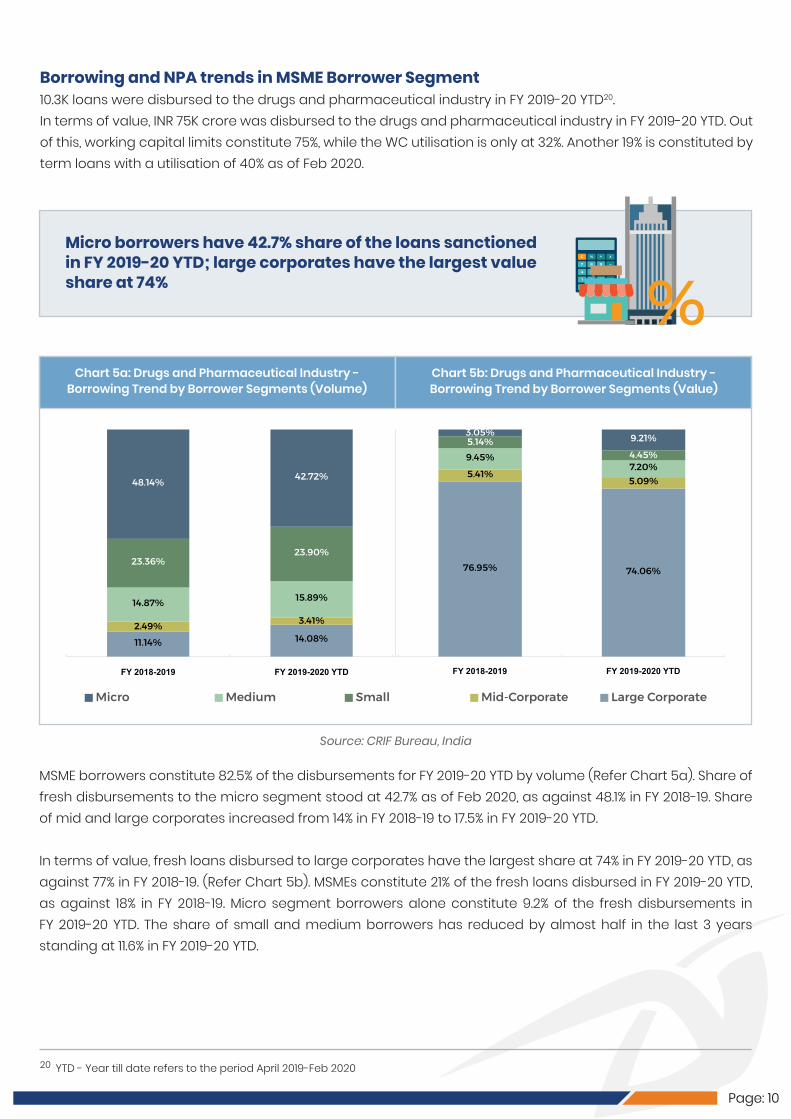
Borrowing and NPA trends in MSME Borrower Segment10.3K loans were disbursed to the drugs and pharmaceutical industry in FY 2019-20 YTD20.In terms of value, INR 75K crore was disbursed to the drugs and pharmaceutical industry in FY 2019-20 YTD. Out of this, working capital limits constitute 75%, while the WC utilisation is only at 32%. Another 19% is constituted by term loans with a utilisation of 40% as of Feb 2020.
20 YTD - Year till date refers to the period April 2019-Feb 2020
Page: 10
MSME borrowers constitute 82.5% of the disbursements for FY 2019-20 YTD by volume (Refer Chart 5a). Share of fresh disbursements to the micro segment stood at 42.7% as of Feb 2020, as against 48.1% in FY 2018-19. Share of mid and large corporates increased from 14% in FY 2018-19 to 17.5% in FY 2019-20 YTD.
In terms of value, fresh loans disbursed to large corporates have the largest share at 74% in FY 2019-20 YTD, as against 77% in FY 2018-19. (Refer Chart 5b). MSMEs constitute 21% of the fresh loans disbursed in FY 2019-20 YTD, as against 18% in FY 2018-19. Micro segment borrowers alone constitute 9.2% of the fresh disbursements in FY 2019-20 YTD. The share of small and medium borrowers has reduced by almost half in the last 3 years standing at 11.6% in FY 2019-20 YTD.
Micro borrowers have 42.7% share of the loans sanctionedin FY 2019-20 YTD; large corporates have the largest valueshare at 74%
Chart 5a: Drugs and Pharmaceutical Industry - Borrowing Trend by Borrower Segments (Volume)
Chart 5b: Drugs and Pharmaceutical Industry - Borrowing Trend by Borrower Segments (Value)
Source: CRIF Bureau, India
FY 2018-2019 FY 2019-2020 YTDFY 2018-2019 FY 2019-2020 YTD
Micro Medium Small Mid-Corporate Large Corporate
11.14%2.49%
14.87%
23.36%
48.14%
14.08%
3.41%
15.89%
23.90%
42.72%
76.95%
5.41%
9.45%5.14%3.05%
74.06%
5.09%7.20%4.45%
9.21%

Page: 11
FY 2
021 Q
3
FY 2
021 Q
4
65,220
67,881
8.06%
7.45%
Chart 7: Drugs and Pharmaceutical Industry – Portfolio and Delinquency Simple Projections by Borrower Segments
Source: CRIF Bureau, India
FY 2
017
Q4
4.10%
1,683 2,177 2,480 2,608 2,131 2,035 2,035 2,035
4.48% 4.37% 4.86%
6.95%
Micro SMEMid + Large Corporates
6.37%5.94% 5.94%
4.03% 3.82%4.29%
5.47% 5.31% 6.13% 5.94% 5.94%
9.64%
12,82014,708 15,414 16,149 16,564 16,638 17,653
12,62015,116 15,690 15,884 16,017 16,804
10.28%9.91%
9.23%8.40%
9.61%8.60%
9.33%8.49%
7.90%
8.43%8.12% 7.83%
7.44%
FY 2
018
Q1
FY 2
018
Q2
FY 2
018
Q3
FY 2
018
Q4
FY 2
019
Q1
FY 2
019
Q2
FY 2
019
Q3
FY 2
019
Q4
FY 2
020
Q1
FY 2
020
Q2
FY 2
020
Q3
FY 2
020
Q4
FY 2
021 Q
1
FY 2
021 Q
2
FY 2
021 Q
3
FY 2
021 Q
4
FY 2
017
Q4
FY 2
018
Q1
FY 2
018
Q2
FY 2
018
Q3
FY 2
018
Q4
FY 2
019
Q1
FY 2
019
Q2
FY 2
019
Q3
FY 2
019
Q4
FY 2
020
Q1
FY 2
020
Q2
FY 2
020
Q3
FY 2
020
Q4
FY 2
021 Q
1
FY 2
021 Q
2
FY 2
021 Q
3
FY 2
021 Q
4
FY 2
017
Q4
FY 2
018
Q1
FY 2
018
Q2
FY 2
018
Q3
FY 2
018
Q4
FY 2
019
Q1
FY 2
019
Q2
FY 2
019
Q3
FY 2
019
Q4
FY 2
020
Q1
FY 2
020
Q2
FY 2
020
Q3
FY 2
020
Q4
FY 2
021 Q
1
FY 2
021 Q
2
8.42% 8.19%
16.45%
37,528
37,71441,430
43,140
43,06244,558
47,282
47,677
53,49354,892
56,925
56,70460,092
60,948
64,167
18.16%
17.14%
17.38%17.29%
15.65%
15.38% 14.04%
11.39%
10.18%9.27%
11.00%
9.84%
8.67%
17.38%
2,297 2,160
Portfolio Outstanding (Cr)Delinquency
As of Feb 2020, delinquency for large corporates stands high at 10.07% (Refer Chart 6). Although in value terms, NPAs stood higher than in Mar 2019, the percentage has reduced from 14.2% to 10% in Feb 2020. NPAs for other segments also remained high as of Feb 2020, with micro segment at 6.13%, small at 8.23% and medium at 8%.
Y-o-Y NPA level for Medium, Mid and Large Corporateshas improved as of Feb 2020
Figure in Crore represents the portfolio outstanding of the segment. Percentage figure indicates the delinquency of the segment as of the observation period.Source: CRIF Bureau, India
BorrowerSegment March 2018
Micro
Small
Medium
Mid-Corporate
Large Corporate37,601 Cr
18.02%
5,461 Cr12.98%
8,671 Cr12.20%
6,445 Cr6.83%
2,297 Cr3.82%
March 2019
48,092 Cr14.28%
5,401 Cr11.90%
9,115 Cr9.56%
7,034 Cr6.90%
2,160 Cr5.47%
February 2020
53,499 Cr10.07%
6,594 Cr8.01%
9,479 Cr8.86%
6,538 Cr8.23%
1,966 Cr6.13%
Chart 6: Drugs and Pharmaceutical Industry – Delinquency Trends by Borrower Segments

An analysis of the past quarterly trends in growth of portfolio and NPAs for the drugs and pharmaceutical industry by borrower segments shows that the credit availed by the mid and large corporates which stood at INR 56.9K crore in Dec 2019 is likely to increase by 19% by Mar 2021* (Refer Chart 7). An increase of 6% is expected in the small and medium borrower segment by Mar 2021*.
NPAs for the mid and large corporates are projected to witness a steep decline to reach 7.45% by Mar 2021, while that for the SME borrower segment are likely to remain nearly same between Dec 2019 and Mar 2021*.
*Actual performance may vary due to COVID- 19 impact which may be beneficial or detrimental to the sector.
Page: 12
A cross analysis of NPAs for borrower segments and business type shows that for large corporates and small borrowers, the maximum delinquencies are for partnership and proprietorship-based firms, respectively. Further, for micro segment, public limited companies have the highest delinquency at 15.9%, and for medium borrower segment, private limited companies have the highest delinquency at 11.9% as of Feb 2020 (Refer Table 3).
Table 3: Drugs and Pharmaceutical Industry – Borrower Landscape Delinquency Trends as of Feb 2020
Note: Borrower Business Type as Others with 6.2% of the total credit by volume is excluded from this analysis.Source: CRIF Bureau, India
BorrowerSegment
Micro
Small
Medium
Mid -Corporate
LargeCorporate
Grand Total
Proprietorship
7.03%
11.15% 7.60% 7.30% 10.78% 8.23%
0.08% 3.40% 11.93% 3.13% 8.86%
0.54% 11.53% 10.11% 3.63% 8.01%
0.00% 21.93% 11.97% 4.61% 10.07%
7.59% 8.55% 11.21% 4.52% 9.50%
3.94% 5.34% 15.96% 6.13%
Partnership Private Limited Grand TotalPublic Limited
NPAs for large corporates which are partnership-basedentities stood the highest at 21.9% as of Feb 2020

Top 10 drugs and pharmaceutical clusters in Indiaconstitute 86% of the overall credit availed as of Feb 2020
21 Annual Report 2019-20, Department of Pharmaceuticals, Government of India
Page: 13
Emerging clusters performing well, backed by favourablegovernment measures
Established and Emerging Drugs and Pharmaceutical Clusters in IndiaThe drugs and pharmaceutical industry in India is spread far and wide across the country in small and large manufacturing facilities which operate out of geographically concentrated areas and are inter-connected by the flow of goods and services across these clusters. The government of India encourages such clusters by bringing them together under a ‘Cluster Development Scheme’ through which financial assistance is provided for creation of common facilities in any drugs and pharmaceutical clusters including Bulk Drug, Medical Device, Ayurvedic, Unani and Cosmetics Units21.

Number of Credit Active Units in Top 10 Clusters
Numberof Units >5000 3000-4000 1500-2000 4000-5000 1500-2000 1000-1500 2000-3000 1000-1500 1000-1500 <1000
Cluster MumbaiCluster
HyderabadCluster Ahmedabad Delhi-NCR
ClusterChennaiCluster
VadodaraCluster
Bangalore-MysoreCluster
SolanCluster Pune Haridwar
Page: 14
Chart 8: Drugs and Pharmaceutical Industry – Top Clusters
Source: CRIF Bureau, India
Mum
bai
Clu
ster
18,979 Cr
12,359 Cr 11,184 Cr
4,991 Cr 4,656 Cr 4,606 Cr 3,846 Cr 3,091 Cr 2,157 Cr 1,150 Cr
Hyde
raba
dC
lust
er
Ahm
edab
ad
Del
hi-N
CR
Clu
ster
Che
nnai
Clu
ster
Vado
dara
Clu
ster
Bang
alor
e-M
ysor
eC
lust
er
Sola
nC
lust
er
Pune
Harid
war
Vadodara cluster includes Vadodara and Bharuch (Ankleshwar) districts and Haridwar cluster includes Haridwar (Roorkee) and Dehradun districts.

Page: 15
Overall, the top 10 clusters account for 86% of the overall credit to the drugs and pharmaceutical Industry as of Feb 2020. The top 6 clusters by size of portfolio comprising Mumbai cluster, Hyderabad cluster, Ahmedabad, Delhi – NCR cluster, Chennai cluster and Vadodara together constitute the established clusters and contribute to 73% of the overall credit as of Feb 2020 (Refer table 4).
Among the top 10 clusters, Vadodara cluster and Ahmedabad recorded the highest Y-o-Y growth in credit availed, at 92.2% and 54.5% as of Feb 2020, respectively. Ahmedabad being largely driven by mid and large corporates segment while Vadodara receiving a strong push from the MSME borrower segment.
Pune with a relatively smaller portfolio of INR 2.1K crore has witnessed growth, driven by the MSME borrower segment at 16.5% Y-o-Y. Solan cluster (INR 3K crore) and Haridwar (INR 1.1K crore) have also shown relatively good performance over the last 2 quarters. While the MSME borrower segment has a stronger play in the Solan cluster, Haridwar is driven by mid and large corporates. These 3 clusters together are identified as emerging clusters in the drugs and pharmaceutical industry.
Overall delinquency as of Feb 2020 in these top 10 clusters stood at 9.7%. Among the established clusters, Chennai cluster saw the highest delinquency at 31.3%, followed by Delhi – NCR cluster at 16.6%, Mumbai cluster at 11.8% and Hyderabad cluster at 2.1%. Ahmedabad and Vadodara cluster had NPAs <1% as of Feb 2020.
These top 10 clusters also provide employment to a large number of people, with nearly 50% of the employment generated by the drugs and pharmaceutical industry in these clusters itself, as per government sources22. Among these clusters, Hyderabad (9%), Vododara Cluster (7%) and Ahmedabad (6%) have the largest share of employment in 2018-1923 (Refer Chart 9).
Source: Annual Survey of Industries (ASI) Frame FY 2018-19, Ministry of Statistics and Programme Implementation, Government of India
Chart 9: Top 10 Clusters - Share in Employment FY 2018-19
MumbaiCluster
0%
2%
4%4%
6%
8%
10% 9%
6%5% 5% 5%
7%
2%
HyderabadCluster Ahmedabad Delhi-NCR
ClusterChennaiCluster
VadodaraCluster
Bangalore-MysoreCluster
SolanCluster Pune Haridwar
3% 3%
22 Annual Survey of Industries (ASI) Frame FY 2018-19, Ministry of Statistics and Programme Implementation, Government of India23 Annual Survey of Industries (ASI) Frame FY 2018-19, Ministry of Statistics and Programme Implementation, Government of India
Mumbai cluster is the largest drugs and pharmaceutical cluster having an outstanding portfolio of INR 18.9K crore, and a share of 24% of the overall credit as of Feb 2020 (Refer Chart 8).

Table 4: Drugs and Pharmaceutical Industry – Comparison of Top Clusters
Source: CRIF Bureau, India
In terms of utilisation of funds, the overall industry wide utilisation of Working Capital loans (WC) stood at 43%, and at 60% for Term Loans (TL), which is the same as that for top 10 clusters. Term Loans utilisation refer to the ratio of outstanding balance by the total sanctioned loan amount, while Working Capital utilisation refers to the ratio of outstanding balance by the drawing power of the borrower.
Higher TL utilisation ratio indicates higher deployment of credit for capacity expansion needs, while higher WC utilisation ratio indicates higher deployment of credit for meeting operational needs of the business. Among the established clusters, Delhi – NCR cluster had the highest TL utilisation ratio, followed by Chennai cluster at 72% and Vadodara cluster at 70% as of Feb 2020. Solan and Pune – identified as emerging clusters have also had high TL utilisation ratios at 65% and 57%. Solan cluster and Haridwar have had high WC utilisation at 78% and 99% respectively.
Portfolio Outstanding(Cr) 18,979
MUM
BAI
CLU
STER
HYD
ERAB
ADC
LUST
ER
DEL
HI-N
CR
CLU
STER
CHE
NN
AIC
LUST
ER
VAD
OD
ARA
CLU
STER
BAN
GAL
ORE
-MYS
ORE
CLU
STER
SOLA
NC
LUST
ER
PUN
E
HARI
DW
AR
TOTA
L
AHM
EDAB
AD
12,359 11,184 4,991 4,656 4,606 3,846 3,091 2,157 1,150 67,018
Portfolio Outstanding(Cr)
Y-o-Y Change
Y-o-Y Change
Delinquency
Delinquency
WC Utilisation Ratio
WC Utilisation Ratio
TL Utilisation Ratio
TL Utilisation Ratio
Ove
rall
MSM
E
7.36%
11.84% 2.10% 0.40% 16.64% 31.34% 0.15% 1.86% 43.06% 11.28% 2.51% 9.73%
-2.42% 54.50% -3.57% -0.03% 92.25% -14.58% -19.83% 1.18% -4.26% 8.97%
34%
67%
3,295
-9.26%
11.65%
34%
50% 48% 19% 58% 56% 53% 32% 56% 65% 68% 44%
43% 40% 54% 49% 78% 33% 58% 43% 63% 45%
8.48% 2.93% 11.55% 6.65% 0.51% 1.75% 17.50% 11.22% 5.26% 8.33%
-8.39% 1.90% -3.80% -27.68% 76.22% -9.29% -2.20% 16.56% -21.22% -2.32%
1,663 1,066 1,742 756 1,342 705 443 528 86 11,625
57% 44% 81% 72% 70% 43% 65% 57% 30% 60%
33% 57% 63% 39% 67% 57% 78% 32% 99% 43%
February 2020
MSME borrower segment constitutes 17% of the creditportfolio in the top 10 clusters
Page: 16

Exports Credit LandscapeIndia boasts of a strong drug manufacturing infrastructure, with competitive land rates, skilled labour, low costs of resources like water and electricity, making India's cost of production approximately 33% lower than that of the US and almost half of that of Europe. Additionally, the industry’s focus on innovation, research and development (R&D) and product variety makes it one of the top rankers among developing countries. The ASEAN economies have a considerable generics production capacity, and it accounts for a large percentage of the region’s pharmaceutical revenues. However, only an extremely small percentage of manufacturers throughout Southeast Asia possess the capabilities to manufacture APIs. India enjoys comfortable position among the South Asian countries, with most markets depending on India and China for API imports.
Low cost of production and R&D boosts efficiency of Indian drugs and pharmaceutical companies, which in turn leads to competitive exports. Exports in the drugs and pharmaceutical industry have been growing steadily over the last several years (Refer Chart 10a), having reached US$ 20.6 bn in FY 19-20 at a 5 year CAGR of 6.7%24. North America is the largest export destination for India’s drugs and pharmaceutical industry (Refer Chart 10b).
Chart 10a: India's Drugs and Pharmaceutical Exports (USD Bn)
Chart 10b: India's Drugs and Pharmaceutical Exports by Region FY 2018-19
Source: Pharmexcil-Pharmaceuticals Export Promotion Council of India, Ministry of Commerce and Industry
24 Pharmexcil – Pharmaceuticals Export Promotion Council of India, Ministry of Commerce and Industry
FY 14
-15
14.9
0
5
10
15
20
25
16.9 16.8 17.319.1
20.6
FY 15
-16
FY 16
-17
FY 17
-18
FY 18
-19
FY 19
-20
Others,3%
CIS, 4%
South Asia, 4%
Middle East, 5%
LAC, 7%
ASEAN, 7%
Africa,18%
North America,32%
EuropeanUnion, 16%
Asia (excl.Middle East), 4%
With the government approving up to 100% FDI through automatic route for greenfield investments, established as well as emerging regions such as Vadodara, Ahmedabad, Surat and Bharuch – pharmaceutical clusters in Gujarat have displayed good growth and a healthy portfolio as of Feb 2020, along with high capacity expansion reflected through growth in term loans availed (30% in the last year), projected to be another 27% by the next year.
The MSME credit to the top 10 clusters stood at INR 11.6K crore as of Feb 2020, constituting 17% of the credit portfolio in the top 10 clusters. The overall utilisation ratio within MSME borrower segment of working capital credit stood at 45% and of term loans credit at 44% as of Feb 2020.
Page: 17

Page: 18
Owing to high costs and regulatory pressures in the developed economies to setup manufacturing units, India with favorable factors such as low cost of production and abundant availability of labour, is fast emerging as a preferred destination for many global pharmaceutical companies to switch to Contract Manufacturing and Research Services (CRAMS), and outsourcing of research and clinical trials to India.
India’s CRAM industry offers high value in terms of cost and quality benefits and are estimated to result in potential savings of about 30-40% compared to developed markets such as the US and Europe. It is globally recognized for its high-end research services and is one of the fastest growing segments of the country’s drugs and pharmaceutical industry.
Overall, on a year on year comparison, export credit to the sector witnessed 15% growth as of Feb 2020. On a quarterly basis (Refer Chart 11), export credit to the industry has seen a continuous increase in the last year, with a significant growth in Mar 2019, standing at 14%.
Chart 11: Drugs and Pharmaceutical Industry – Export Credit Trends
Source: CRIF Bureau, India
5,7
19 C
rM
ar-1
7
Jun-
17
Sep-
17
Dec
-17
Mar
-18
Jun-
18
Sep-
18
Dec
-18
Mar
-19
Jun-
19
Sep-
19
Dec
-19
Feb-
20
5,6
13 C
r-1
.86
% 6,8
25 C
r21
.60
%
6,2
71 C
r-8
.11%
5,12
5 C
r-1
8.2
8%
5,7
55
Cr
12.3
0% 7,0
82
Cr
23.0
5%
6,0
96
Cr
-13.
93%
6,9
49
Cr
13.9
9%
7,4
21 C
r6
.79
%
7,76
5 C
r4
.64
%
8,0
36 C
r3.
49
%
7,9
70 C
r-0
.82%
Export credit to the sector witnessed 15% Y-o-Ygrowth as of Feb 2020

Page: 19
Micro, Small and Medium enterprises as per the MSME Development Act 2006 are defined based on the investment in plant and machinery in manufacturing and services sector separately. This definition has been revised as below effective 1 July 2020:
The coverage by bureau classification as a ratio of the turnover based classification indicates that the use of overall credit exposure-based classification of enterprises by the bureau for MSMEs is a reliable methodology.
In May 2020, as an immediate relief for MSMEs impacted severely due to COVID-19 and the lockdown, the government as part of several other measures proposed a revision in the MSME definition to expand the MSME coverage to a larger number of enterprises. The Cabinet Committee on Economic Affairs approved the revision of definition to the current one, to be implemented effective 1 July 2020.
MSME borrowers are classified in the bureau based on the overall credit exposure of enterprises, inclusive of funded and non-funded exposure as below:Micro: < INR 1 crore Small: INR 1 crore – INR 10 crore Medium: INR 10 crore – INR 50 crore
To access the impact of the revised MSME definition, an analysis on random sample of 3375 borrowers available with the bureau was undertaken and the results are presented in Table 5 below.
Revised MSME Definition – Impact on Bureau Classification of MSMEs
Table 5: Comparison of Turnover v/s Credit Exposure of Enterprises by MSME Segments
Criteria
MSME Development Act 2006 Revised MSME Definitioneffective 1 July 2020
Investment Investment and Turnover
Investment: Up to INR 1 crore& Turnover: Up to INR 5 crore
Investment: Up to INR 10 crore& Turnover: Up to INR 50 crore
Investment: Up to INR 50 crore& Turnover: Up to INR 250 crore
BothManufacturing
Up toINR 25 Lakh
Up toINR 10 Lakh
INR 25 Lakhto INR 5 crore
INR 5 croreto INR 10 crore
INR 10 Lakhto INR 2 crore
INR 2 croreto INR 5 crore
ServicesType
Micro
Small
Medium
CategoryRevised MSMEDefinition basisTurnover (INR)
Average Turnover (INR crore)
Credit BureauClassification basisOverall CreditExposure (INR)
AverageCreditExposure(INR crore)
Coverage by Bureau Classification as a ratio of the Turnover Based Classification
Micro Up to 5 crore 2.52 0.29 95.65%
Small 5 crore - 50 crore
50 crore - 250 crore
1 crore - 10 crore
10 crore - 50 crore
27.46
Up to 1 crore
4.64 95.57%
Medium 91.54 25.05 96.85%
MSME
Up to 250 crore 60.24 Up to 50 crore 15.37 96.02%

Page: 20
Way forward for Drugs and Pharmaceutical Industry
25 World Population Prospects 2019, United Nations26 As per scope and coverage defined in Annual Survey of Industries FY 2013-14 to FY 2017-18, Ministry of Statistics and Programme Implementation, Government of India
The demand for drugs and pharmaceutical products is going to increase to meet the needs of a growing population. According to the United Nations, India’s population is set to touch 1.45 billion by 2028, making it the world’s most populous nation25. Rising incomes, greater health awareness, increased prevalence of lifestyle diseases and improved access to affordable healthcare will be instrumental in driving growth of the drugs and pharmaceutical industry in the country.
Owing to favourable policy interventions through continued efforts by the government and policy makers, the drugs and pharmaceutical industry in India, has been known for its manufacturing prowess, attracting investments and generating large scale employment opportunities for the country.
Supported by the government under its ‘Make in India’ initiative, India’s drugs and pharmaceutical industry is expected to continue its high growth trajectory in the years to come which in turn is expected to give a boost to credit demand in the industry.
Source: Annual Survey of Industries FY 2013-14 to FY 2017-18, Ministry of Statistics and Programme Implementation,Government of India
Chart 12: Investments and Employment (in Lakh)
FY 2013-14
6.2 6.1 6.56.8
FY 2014-15 FY 2015-16 FY 2016-17 FY 2017-18
7.4
125.9 132.9 155.7 166.2 179.4
Invested Capital (INR) Total Persons Engaged
Analysing past trends indicates that the sector has witnessed continuous expansion in the invested capital over the last several years. According to latest available government data26 between FY 2013-14 and FY 2017-18, the invested capital to the sector grew with a CAGR of 9.2% (Refer Chart 12).
• Projected growth in Credit Portfolio to the Industry 13% by Mar 2021• Industry NPA at 9.5% as of Feb 2020
• Projected growth of SME Credit to the Industry 6% by Mar 2021• NPAs for SME borrower segment likely to remain stable at around 8% between Dec 2019 and Mar 2021
• Projected growth of Credit to Mid and Large Corporates 19% by Mar 2021• Mid and large corporates NPA projected to improve by nearly 3% to reach 7.45% by Mar 2021

Page: 21
The sector boasts of a large supply of competent labour pool, providing the necessary enabling environment for labour force to grow and nurture. The sector witnessed a whopping 44% growth in employment in 2018-19, and a CAGR of 4.5% between FY 2013-14 and FY 2017-18 as per latest available government data27 .
In terms of the geographical spread, Gujarat, Maharashtra, Telangana, Karnataka and Andhra Pradesh are the top 5 states constituting as much as 65% of the employment generated by the sector in 2018-1928.
Himachal Pradesh, Uttrakhand, Tamil Nadu, Goa and Madhya Pradesh account for another 20% of the overall employment in the sector in 2018-1929.
In the recent times, the drugs and pharmaceutical industry has gained renewed global attention due to the crisis brought about by COVID-19, with Indian companies having joined the race to develop and mass-produce an effective vaccine to fight the novel Coronavirus. While, India has had a steady flow of FDI in this sector in the past, permission to invest 100% in greenfield projects has given further impetus to the many global players who are looking at moving operations out of China.
Moreover, in the wake of COVID-19 causing drug and personal protective equipment (PPE) shortages across the world, the recent USFDA approvals of several large companies in India for their manufacturing facilities in cities like Nagpur, Bangalore has given further boost to pharmaceutical and related manufacturing in India and attracting further investments in the sector.
However, the pandemic has also brought about challenges for the MSMEs in the drugs and pharmaceutical industry, hampering smooth functioning and increasing costs of operations for them. Based on a short survey of the enterprises, assisted by SIDBI, some of the most widely faced impediments are:
27 Annual Survey of Industries FY 2013-14 to FY 2017-18, and ASI Frame FY 2018-19, Ministry of Statistics and Programme Implementation, Government of India28 Annual Survey of Industries Frame FY 2018-19, Ministry of Statistics and Programme Implementation, Government of India29 Annual Survey of Industries Frame FY 2018-19, Ministry of Statistics and Programme Implementation, Government of India
Marketing Related
Marketing Representatives (MRs) are not able totravel to market the product due to lockdown
Launch of new products is getting hamperedas doctors are not attending their clinics
Supply Chain Related
Transport costs have increased resulting indistribution / transportation issues
Delay in export dispatch due to limited numberof operating flights, increasing costs further
Policy Related
Product approval policies and proceduresare complex and need to be made simpler
Finance Related
Increase in raw material costs
Shorter repayment cycles of credit for rawmaterialDelayed realization of receivables
Page: 22
According to industry body, IPA30, the next wave of growth could come from increasing exports to large and traditionally under penetrated markets such as Japan, China, Africa, Indonesia, and Latin America. At this juncture, there is need for stronger collaboration between drugs and pharmaceutical companies, the government and the regulatory agencies to achieve the aspiration of becoming one of the top 5 drugs and pharmaceutical industries by value, and the largest supplier by volume, in the world by 2030.
30 The Indian pharmaceutical industry – the way forward, June 2019, Indian Pharmaceutical Alliance
*Actual performance may vary due to COVID- 19 impact which may be beneficial or detrimental to the sector
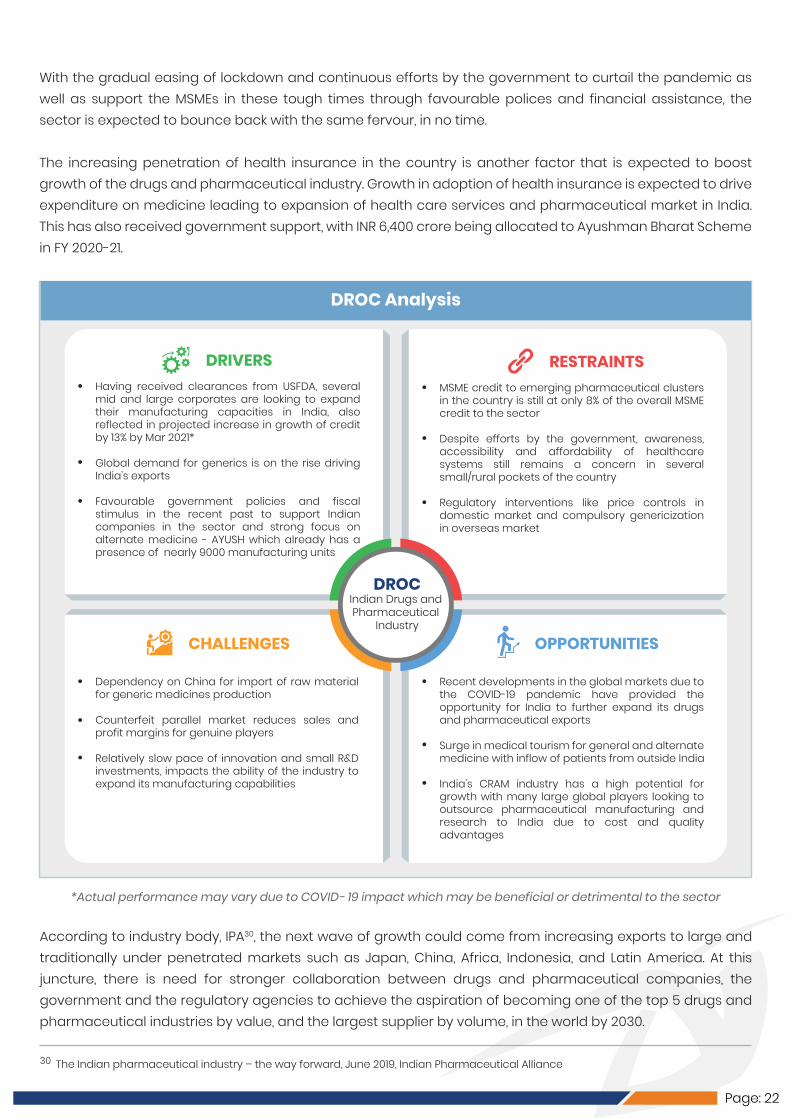
Having received clearances from USFDA, several mid and large corporates are looking to expand their manufacturing capacities in India, also reflected in projected increase in growth of credit by 13% by Mar 2021*
Global demand for generics is on the rise driving India’s exports
Favourable government policies and fiscal stimulus in the recent past to support Indian companies in the sector and strong focus on alternate medicine - AYUSH which already has a presence of nearly 9000 manufacturing units
MSME credit to emerging pharmaceutical clusters in the country is still at only 8% of the overall MSME credit to the sector
Despite efforts by the government, awareness, accessibility and affordability of healthcare systems still remains a concern in several small/rural pockets of the country Regulatory interventions like price controls in domestic market and compulsory genericization in overseas market
DROCIndian Drugs and Pharmaceutical
Industry
DRIVERS
Dependency on China for import of raw material for generic medicines production
Counterfeit parallel market reduces sales and profit margins for genuine players
Relatively slow pace of innovation and small R&D investments, impacts the ability of the industry to expand its manufacturing capabilities
CHALLENGES
Recent developments in the global markets due to the COVID-19 pandemic have provided the opportunity for India to further expand its drugs and pharmaceutical exports
Surge in medical tourism for general and alternate medicine with inflow of patients from outside India
India’s CRAM industry has a high potential for growth with many large global players looking to outsource pharmaceutical manufacturing and research to India due to cost and quality advantages
OPPORTUNITIES
RESTRAINTS
DROC Analysis
With the gradual easing of lockdown and continuous efforts by the government to curtail the pandemic as well as support the MSMEs in these tough times through favourable polices and financial assistance, the sector is expected to bounce back with the same fervour, in no time.
The increasing penetration of health insurance in the country is another factor that is expected to boost growth of the drugs and pharmaceutical industry. Growth in adoption of health insurance is expected to drive expenditure on medicine leading to expansion of health care services and pharmaceutical market in India. This has also received government support, with INR 6,400 crore being allocated to Ayushman Bharat Scheme in FY 2020-21.

Page: 23
CRIF in INDIA- partner for all your credit related requirements
CRIF in India, now offers products and services for Credit Information, Business Information, Analytics, Scoring, Credit Management and Decision solutions in India.
CRIF operates CRIF High Mark, India’s leading credit bureau, which has largest database of individual records and supports millions of lending decision every month. CRIF High Mark is India’s first full-service credit bureau covering all borrower segments – MSME/Commercial, Retail and Microfinance. CRIF High Mark works with all leading financial institutions in the country, providing them a comprehensive bureau coverage using its proprietary ‘Made in India for India Search Engine’, proven to work even with low quality data.
We bring our global expertise in Analytics, Scoring, Credit Management and Decision Solutions to India through our center of excellence at Pune. Our team of expert data scientist and statisticians bring together years of experience in developing bespoke scorecards for Origination, Marketing and Collections for Financial Services, Insurance or Telecom sectors.
We bring together best of both worlds – comprehensive data and sophisticated dedupe technology for India along with global best practices, expertise in scoring and top-rated credit management software solutions – to add most value to our clients.
This report contains only aggregate level information. It does not contain any Credit Information and shall not be construed as Credit Information Report or part thereof. The analysis in this report is based on Credit Information in CRIF High Mark’s database. The results are NOT to be construed or used as a "legal description". CRIF High Mark strives to keep its data accurate and up to date but does not guarantee its accuracy. CRIF High Mark does not assume any liability for any errors, omissions, or inaccuracies in the data provided regardless of the cause of such or for any decision made, action taken, or action not taken by the user in reliance upon any data provided herein. The contents of the report shall not be reproduced in part or whole without permission from CRIF High Mark Credit Information Services Pvt. Ltd. The opinions expressed herein are those of the author. Its contents, therefore, do not represent any commitment between CRIF High Mark and the recipient(s) and no liability or responsibility is accepted by CRIF High Mark for the content herein.
Small Industries Development Bank of India (SIDBI), is the Principal Financial Institution for the Promotion, Financing and Development of the MSME sector and for the coordination of the functions of the institutions engaged in similar activities. The operational domain of SIDBI consists of MSMEs, which contribute significantly to the national economy in terms of production, employment, and exports. SIDBI meets the financial and developmental needs of the MSME sector with a Credit+ approach to make it strong, vibrant, and globally competitive. For more information, visit www.sidbi.in.
Disclaimer
About CRIF India
About SIDBI
September 2020Copyright © CRIF High Markwww.crifhighmark.com
Reach us [email protected]