industrial development - delhi
TRANSCRIPT

94 ECONOMIC SURVEY OF DELHI, 2005-2006
CHAPTER-9
INDUSTRIAL DEVELOPMENT
1. The industrial sector plays a vital role in the economic development of the National Capital Territory
of Delhi. The manufacturing sector in Delhi contributes about 12% to the state income. The Industries
Department estimates indicate that in 2001 about 1.29 lakh industrial units were functioning in
Delhi, which provided employment to more than 14 lakh persons. The estimated investment and
production in these units was around Rs. 2,524 crore and Rs. 6,310 crore, respectively. (Table- 9.1)
INDUSTRIAL GROWTH
2. Delhi experienced a rapid growth of manufacturing activities. The Master Plan for Delhi rules out
setting up large and heavy industries. There is, however, scope to expand small-scale industries.
The availability of infrastructure, wholesale markets, trade and other commercial services have
promoted the expansion of small-scale industries in Delhi.
OVERALL GROWTH
3. There has been a phenomenal growth of small-scale industries (SSI) in Delhi in the last 2 -3 decades,
where a sharp increase in the number of units from 26000 in 1971 to 1.29 lakhs in 2001 has been
recorded. The number of Small Scale Industries (SSI) in Delhi since 1951 have shown a tremendous
increase as indicated below:-
Statement 9.1
GROWTH OF INDUSTRIAL SECTOR, 1951-2001
Year Number of Investment Production Employment
Industrial units (Rs. crore) (Rs. crore) (Number)
1951 8,160 18.13 35.35 95,137
1961 17,000 60.00 121.00 1,87,034
1971 26,000 190.00 388.00 2,91,585
1981 42,000 700.00 1,700.00 5,68,910
1991 85,050 1,659.00 4,462.00 7,30,951
2001 1,29,000 2,524.00 6,310.00 14,40,000
Source: Estimated by the Dte. of Industries, GNCTD.

ECONOMIC SURVEY OF DELHI, 2005-2006 95

96 ECONOMIC SURVEY OF DELHI, 2005-2006
4. The Industries Department is running a Tool Room & Training Centre with Danish collaboration at
Wazirpur Industrial Area with the objective of contributing towards the development of small scale
industries through supply of trained man-power and sophisticated tooling. The Production Wing of
the Centre is manufacturing tools, dies, moulds, jigs and fixtures, die casting dies, press tools etc.for
industries. The centre is providing 12.5% subsidy to small-scale units.
The Centre has been imparting training in the field of tool making tool design, computer
programming, CNC machine programming and operation, CAD/CAM etc. The trainees under
these courses are exposed to advanced methods of tools making and tool designing .The Centre
for information and technology in Tool Engineering and Computer Application (CAD/CAM)) has
been set up as a Sub Centre of TRTC at HTVTC Building at Okhla Industrial Area, New Delhi, wherein
various CAD/CAM course are being conducted.
The centre has started one year Condensed Course in tool and die making wherein 20 trainees
per year will be trained. The centre is conducting 2 year Post Diploma in Tool Design (Part time-
Evening Course) where in approx.20 trainees are trained. The Centre is conducting short-term
course in the field of various processes involving in tool making and tool designing. The Centre is
also to start additional short-term courses in the field of Engg. Drawing, Plastic mould, press tool
designing and manufacture, CNC milling, EDM wire cut etc.
Tool Room & Training Centre has taken up number of steps to increase their revenue by increasing
seats in various training courses. Some new short term courses are also being introduced. An amount
of Rs. 4 crore was provided in 2005-06 for purchase of new machines to up grade the technology
and to increase the production activities so that it may function on self-substained basis.
5. A Hi-Tech Vocational Training Centre has been set up with Italian collaboration at Okhla Industrial
Area for providing training on CNC machines and for providing machining facilities to small-scale
industries. This Centre has started a number of training programmes for different level of technical
personal to earn more revenue.
6. In order to make the National Capital Territory of Delhi a world class cyber state, the Delhi Government
has planned to set up state-of-the art 'Hi-tech City for Information Technology' on about 100 acres of
land with the best communication links, uninterrupted and clean power supply with back up power
generation and other advanced technical facilities. This project could not make headway so far
due to non-availability of suitable land. IT Park (6 hctr. land) has been set up at Shastri Park by DMRC
at a cost of Rs.174 crore. With a view to establish and develop Industry-University-R &D linkages.
"Bio-Technology Park" is being set up in collaboration with Delhi University which will help in the up
gradation of technology of existing industries and development of high-tech and non-polluting
industries in Delhi. Construction work is nearing completion and the Centre is likely to function shortly.
INDEX OF INDUSTRIAL PRODUCTION
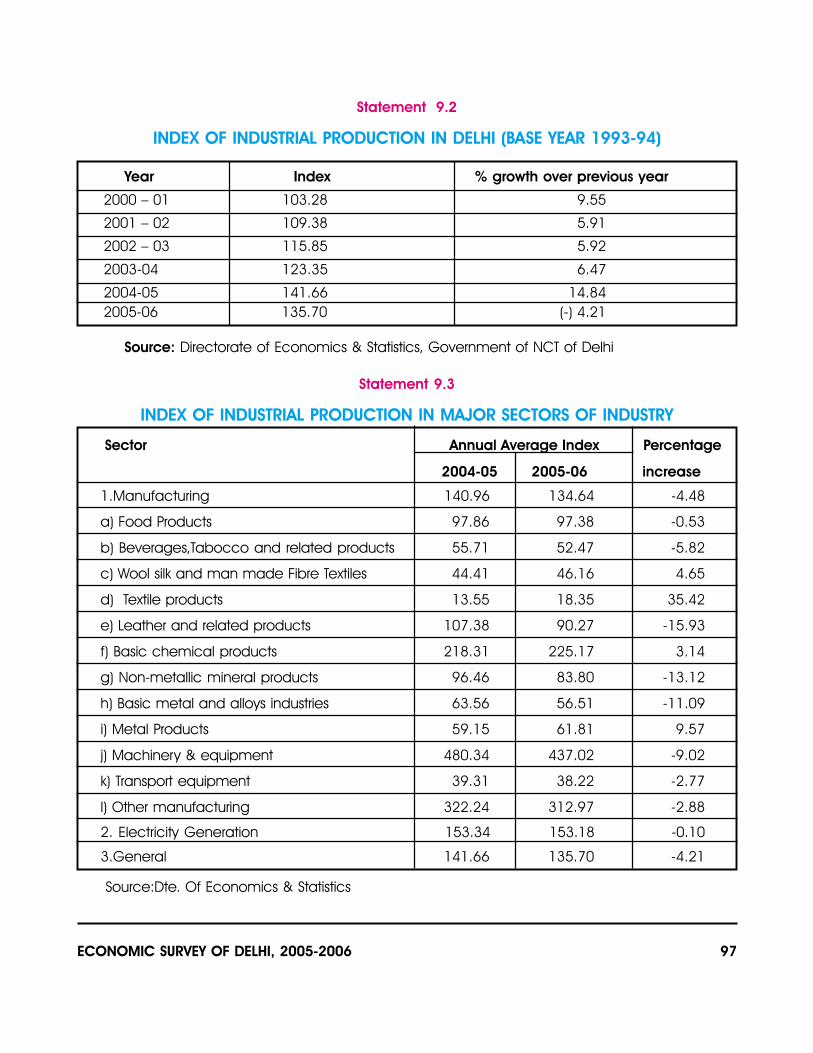
7. The index of industrial production (1993-94 base year) shows an increasing trend. The Time series
containing index of industrial production data in Delhi is given below:-
ECONOMIC SURVEY OF DELHI, 2005-2006 97
Statement 9.2
INDEX OF INDUSTRIAL PRODUCTION IN DELHI (BASE YEAR 1993-94)
Year Index % growth over previous year
2000 – 01 103.28 9.55
2001 – 02 109.38 5.91
2002 – 03 115.85 5.92
2003-04 123.35 6.47
2004-05 141.66 14.84
2005-06 135.70 (-) 4.21
Source: Directorate of Economics & Statistics, Government of NCT of Delhi
Statement 9.3
INDEX OF INDUSTRIAL PRODUCTION IN MAJOR SECTORS OF INDUSTRY
Sector Annual Average Index Percentage
2004-05 2005-06 increase
1.Manufacturing 140.96 134.64 -4.48
a) Food Products 97.86 97.38 -0.53
b) Beverages,Tabocco and related products 55.71 52.47 -5.82
c) Wool silk and man made Fibre Textiles 44.41 46.16 4.65
d) Textile products 13.55 18.35 35.42
e) Leather and related products 107.38 90.27 -15.93
f) Basic chemical products 218.31 225.17 3.14
g) Non-metallic mineral products 96.46 83.80 -13.12
h) Basic metal and alloys industries 63.56 56.51 -11.09
i) Metal Products 59.15 61.81 9.57
j) Machinery & equipment 480.34 437.02 -9.02
k) Transport equipment 39.31 38.22 -2.77
l) Other manufacturing 322.24 312.97 -2.88
2. Electricity Generation 153.34 153.18 -0.10
3.General 141.66 135.70 -4.21
Source:Dte. Of Economics & Statistics

98 ECONOMIC SURVEY OF DELHI, 2005-2006
8. MONTHLY COMPARABLE INDEX OF INDUSTRIAL PRODUCTION IN DELHI.
The average annual index of industrial production for 2005–06 has been estimated as 135.70
while it was 141.66 during 2004-05 with base year 1993 – 94 as 100. This shows 4.21% decrease
in IIP when compared with the previous year. It is clear from the table given below that only during
October, December 2005, there is an improvement of 8.97% and 20.73% while for remaining ten
months of the year there is a decline as compared to corresponding month of previous year.
Statement 9.4
MONTH-WISE INDEX OF INDUSTRIAL PRODUCTION (BASE:1993-94=100)
Month 2001- 2002- 2003- 2004- 2005- Increase/Decrease
02 03 04 05 06 during 2004 – 05 over
the previous year
(In percentage)
April 98.23 104.90 125.44 140.62 134.06 -4.67
May 114.70 122.20 133.16 139.70 137.68 -1.45
June 107.16 116.50 123.13 138.89 124.32 -10.49
July 128.17 123.81 132.85 165.90 149.73 -9.75
August 132.40 111.66 111.72 127.73 123.44 -3.36
September 110.13 124.17 119.29 145.13 144.71 -0.29
October 118.81 128.01 108.40 139.88 152.43 8.97
November 105.73 104.56 111.71 140.84 119.10 -15.44
December 107.46 104.24 126.44 135.84 164.00 20.73
January 93.90 116.31 126.52 133.48 131.11 -7.78
February 89.14 111.91 126.15 125.67 113.86 -9.40
March 106.70 121.89 135.42 166.29 133.95 -19.45
Annual 109.38 115.85 123.35 141.66 135.70 -4.21
Average
Source: Dte of Economics & Statistics GNCT Delhi
USE BASED INDEX OF INDUSTRIAL PRODUCTION
9. The consumer goods industry is predominent in industrial production of NCT of Delhi. During 2004-
05, it covered 63.62% of total production with a share of 12.31% for consumer durable goods and
51.31% for consumer non-durable goods. Share of basic goods industries, capital goods industries
and intermediate goods industries are 13.14%, 9.09% and 14.15% respectively when weights are
allocated on the basis of their production in the base year.

ECONOMIC SURVEY OF DELHI, 2005-2006 99
Statement 9.5
Index of Industrial Production : Use Based
Description Annual Average Percentage
2004-05 2005-06 variation
Basic Goods 150.94 131.90 -12.61
Capital Goods 554.77 598.29 7.84
Intermediate Goods 182.56 189.84 3.99
Consumer Goods 71.61 58.33 -18.54
Consumer Durable Goods 180.51 105.18 -41.73
Consumer Non-durable goods 45.48 47.09 3.54
General 141.66 135.70 -4.21
Source: Dte of Economics & Statistics, GNCTD
Box 9.1
INDEX OF INDUSTRIAL PRODUCTION
In order to measure growth of the industrial sector over a period of time, the index of Industrial
Production for the N.C.T of Delhi has been compiled by the Directorate of Economics and
Statistics since 1976.
The index covers the Census Sector Units employing 50 or more workers working with power
and 100 and more workers without power.
SELCTION OF ITEMS:
The item basket is based on the ASI 1993-94 Factory Sector results and the selection criterion
envisages capturing 80% of value of output of the state's manufacturing sector.
WEIGHTING DIAGRAM:
In the revised (1993-94) series, the weights have been allotted to the items on the basis of
'value of output' which hitherto was gross value added in the 1980-81 series as recommended
by Central Statistical Organization.
COVERAGE:
The revised series covers 98 items. Production data for these items is collected from 348
Industrial units in Delhi on quarterly basis.

100 ECONOMIC SURVEY OF DELHI, 2005-2006
METHODOLOGY FOR CALCULATION:
The production data so collected for each item is divided by its base year production , which
is multiplied with its weight to get production relative i.e. production index at industry level.
The production relatives are added up at major industry group. The two digits IIP multiplied
with its weight is further added up to get the index for the manufacturing sector. This index
shows the relative change that has taken place in the industrial spectrum with reference to
the base year.
10. The number of registered factories in Delhi is indicated below:-
Statement 9.6
REGISTERED FACTORIES IN DELHI, 1981-2005
Year Private Government U/s 85 of Factories Act, 1948 Total
1981 3298 102 2 3402
1991 4954 137 71 5162
2001 6693 144 18 6855
2002 6986 144 18 7148
2003 7291 154 19 7964
2004 8140 172 21 8333
2005 8482 189 21 8692
Source: Labour Department, Government of NCT of Delhi.
ORGANIZED INDUSTRIAL (FACTORY) SECTOR DURING ASI 2003-04
11. During 2003-04 total number of working factories covered in the survey were 3413. These factories
together had a total stock of fixed capital worth Rs. 2099 crores and invested capital Rs. 4658
crores. Further, these factories provided gainful employment to 128649 and distributed Rs. 983
crores as emoluments to employees, consumed inputs both industrial and non industrial in nature,
worth Rs. 13477 crores, and produced Rs. 15930 crores worth of goods and services at ex-factory
prices and contributed Rs. 2141 crores by way of value added by manufacture to the State Domestic
Product(Table 9.1).
12. During the reference period of ASI 2003-04, the larger number of factories were engaged in
manufacturing of wearing apparel dressing and dying of fur (17.71%) followed by manufacture of
machinery and equipment(8.49%), manufacture of fabricated material product except machinery
(8.55%), manufacture of publishing, printing and reproduction of recorded media (6.42%) and

ECONOMIC SURVEY OF DELHI, 2005-2006 101
manufacture of rubber and plastic product (6.66%). These five industries together have accounted
45.7 percent of the total working factories, provided employment to 58.24 percent of the total
employees and utilized 51.98 percent of fixed capital stock. Their share in the gross value of output
and net value added by manufacture were 37.33 and 44.84 percent respectively. (Table 9.2)
13. UNORGANISED MANUFACTURING ACTIVITIES IN DELHI
The following are the main highlights of the survey conducted during NSS 56th round between July
2000 and June 2001 (Table 9.3)
� The number of Unorganised Manufacturing enterprises were estimated as 190277 during
2000-2001. Out of them 26375 (13.86%) were in rural areas and 163902 (86.14%) in urban
areas of Delhi.
� Out of the total enterprises, manufacture of wearing apparels etc. account for 27.42%
ranked first followed by manufacture of fabricated metal products with 13.93% of share
and third position was occupied by manufacture of furniture having a share of 10.82% of
the total enterprises. These three groups taken together accounted for more than 50% of
the total enterprises in Delhi.
� The total employment generated by these enterprises was estimated at 7.94 lakhs.
� Out of the total employment,0.53 lakh persons (6.68%) were employed in rural enterprises
while 7.41 lakh persons (93.32%) in urban unorganized manufacturing enterprises.
� Out of the total persons employed in this sector about 0.92 lakh persons (11.54 % ) were
employed in household enterprises and about 7.02 lakh persons (88.46%) were gainfully
employed in establishments.
� Manufacturing of wearing apparels etc. accounted for 30.22% fabricated metal products
etc. 10.14% and manufacture of furniture etc. , 9.65% in the total employment and these
three groups taken together accounted for about 50% of the total employment in this
sector in Delhi.
� NCT of Delhi earned the distinction of having the best average employment per enterprise
in the country with 4.17 persons per enterprise.
� Gross Value Added per annum/enterprise was estimated as 1.78 lakh
� Annual Gross Value Added of Household enterprises (OAME) was estimated at Rs. 0.52 lakh
as against Rs. 2.35 lakhs earned by establishments.
� Tobacco products, chemicals & chemical products and recycling earned an estimated
annual GVA of more than Rs. 3.5 lakh per enterprise

102 ECONOMIC SURVEY OF DELHI, 2005-2006
� Value Added per worker in this sector was estimated as Rs. 42585 per year.
� Annual Value Added per worker of Household enterprise (OAME) was estimated at Rs. 33955
as against Rs. 43711 of establishments.
� Value added per worker in Chemical and Chemical Products (Rs. 72045), Tobacco Products
(Rs. 65972) and Basic Metal enterprises(Rs. 56275) was at the top among these enterprises.
� 29456 women working in unorganized manufacturing enterprises constituting 3.71% of the
total employment.
� Out of them 65.16% were working owners, 30.06% were Hired workers and remaining 4.78%
fall in others category.
� Of the total females, 27335(92.80%) were working on full time and 2121 (7.20%) on part
time basis.
� Among females working on full time, about 57% were employed in household enterprises
and about 43% in establishments while that of part time workers about 12% were employed
in household enterprises and 88% in establishments.
� The value of fixed capital was estimated as Rs. 2.75 lakh per enterprise.
� Out of the total enterprises, 70.025 operated from independent premises and 29.98% from
household premises itself.
� 89.58% were Proprietary, 10.41% Partnership and only 0.01% were other type of enterprises.
� Only 5.86% of these enterprises were registered under any acts/authority.
INDUSTRIAL POLICY
14. The Govt. of Delhi is placing special emphasis on promoting sophisticated skill based industries
which could achieve optimum levels of production with less space and power, and generate
employment avenues for skilled persons. In order to keep the environment clean, emphasis have
been placed on encouraging nonpolluting and non-hazardous units in Delhi. Keeping in view the
strain on infrastructure, the Govt. of Delhi has allowed setting up industries in the House-hold Sector.
In view of the recent events, the department is framing a new Industrial Policy for Delhi which
emphasises promotion of Computer Software, I.T.Enabling Services, Electronics and High Tech
Industries. The proposed Industrial Policy intends to give a thrust to exports and help the industry
face international competition by setting up marketing estates for different sectors of industries as
well as help set up “Single Window Information/Display Centers such as a World Trade Centre.
Institutional Support would be provided by setting up Common Facility Centers, R&D facilities &
testing laboratories etc.

ECONOMIC SURVEY OF DELHI, 2005-2006 103
INDUSTRIAL ESTATES
15. Delhi has 28 industrial estates / areas in Delhi occupying an area of 4647acres. Out of these 5
Estates were developed by the Industries Department, 2 by DSIDC, 7 by Cooperative Societies and
remaining 14 by DDA. These Estates were set up during the period 1954 to 1990. About 25000
industrial units are located in these Estates. Government has also acquired 1,300 acres of land of
which possession of 1065 acres at Bawana village and Holambi Kalan has been taken for developing
new industrial estates In addition, 800 acres of land has also been acquired and its possession
has been taken for development of new industrial areas.
The Govt. has decided to implement a scheme on Public Private Parternership basis to up keep
and maintain these industrial areas by providing funds with proportionate contribution in the ratio
of 80: 20 i.e. 80% by Government and 20% by the entrepreneurs of the respective Estates through
their Association. The Industries Department will release the funds to the respective government
agency on the basis of the proportionate funds received from the association.
DELHI FINANCIAL CORPORATION
16. The Delhi Financial Corporation (DFC) caters to the financial needs of industries located in the
National Capital Territory of Delhi and the Union Territory of Chandigarh. Financial assistance is
available to the industrial as well as service sectors units like medical & health care/diagnostic
centers, transport sector, hotels, restaurants. Tourism related facilities like amusement parks,
convention centers, software/hardware services relating to information technology,
telecommunication or electronics including satellite, linkage, Audio/Video/Visual communication,
Hi-tech Agro Industries, floriculture, Tissue culture, aqua pollutary farming, breeding hatcheries
etc. The upper limit for grant of loans in case of companies and co-operative Societies is Rs.5
crore while for proprietorship and partnership firms it is Rs.2 crore. The loans are available to new
industrial units as well as existing ones for shifting, expansion, modernization, diversification and
rehabilitation. Loans are also provided to the units for up gradation of technology resulting in less
consumption of power and increase in qualitative productivity as also pollution control equipment
etc. DFC is also providing loans to small road transport operators for commercial vehicles. In
order to make Delhi an environment friendly city, DFC facilitated the relocation process of industrial
units by providing loans on concessional terms. DFC has an authorized capital of Rs.50 crore and
share capital of Rs.25.70 crore. As on 31st March, 2005 DFC had Rs.33.43 crore as reserves and
surplus. DFC sanctioned loans worth Rs. 36.37 crore during 2005-06.
DELHI STATE INDUSTRIAL DEVELOPMENT CORPORATION
17. DSIDC, which was set up in 1971 assists, finances and promotes the interests of small-scale industries
in the NCT of Delhi. It has an authorized capital of Rs. 30 crore and paid up capital of Rs. 21.86

104 ECONOMIC SURVEY OF DELHI, 2005-2006
crore. The Corporation has achieved annual turn-over of Rs. 261.11 crore in 2004-05. DSIDC is
implementing the industry relocation project and also constructing Common Effluent Treatment
Plants (CETPS).
(a) RELOCATION OF INDUSTRIES
DSIDC has been entrusted with the onerous task of development of industrial estates in North-West
Delhi (Bawana and surrounding areas) under the Relocation Scheme. Approximately 1865 acres
of land has already been acquired. This is a self-financing scheme (costing approximately Rs.1000/
- crore), which has been taken up at the behest of the Hon’ble Supreme Court of India.
Out of the total of 51851 applicants who had applied for allotment of alternate industrial plots/flats
under the relocation scheme, about 27755 applicants have been found eligible for allotment of
industrial plots/flats.
Allotments of flatted factories and developed industrial plots have been made to 18360 applicants
by draw of lots in newly developed industrial area of Bawana and already developed areas at
Narela, Badli, Jhilmil and Patparganj. Water polluting industries were given allotments on priority
basis in Narela and Badli while units falling under ‘F’ category of Master Plan of Delhi were given
priority allotments in Bawana Indl Area. Details are given below: -
Name of No. of allotments Total No of Total No. of Total No of Total No. of
Complex Made allottees who possession allottees who allottees who
have made approved have taken have taken up
Prior to On 100% cost physical construction
20.10.05 20.10.05 of plot/flat possession over plot
at Site
Bawana 16234 4021 15121 11680 10948 1230
(I & II)
Jhilmil 96 0 96 94 94 78
Narela 1509 0 1347 1173 1133 400
Badli 87 0 86 83 82 67
Patparganj 76 0 76 75 75 64
Flatted 358 6 227 220 218 218
Factory
Bhoregarh 0 4027 0 0 0 0
Total 18360 8054 16953 13325 12550 2057
4617 allottees have taken refund whereas about 746 eligible applicants are still awaiting allotments.
DDA was requested to identify additional land for development of new industrial areas for relocating
the remaining eligible applicants. About 1931 acres of land has been identified by the DDA at
ECONOMIC SURVEY OF DELHI, 2005-2006 105
Rohini Phase-IV, Narela, and North of Rohtak Road near village Mundka. One pocket measuring
438 acres of land in Narela which is free from encroachments has been notified for acquisition by
Govt. of Delhi. Survey conducted by the DSIDC has revealed that there are heavy built up structures
at the remaining two sites at Rohini Phase-IV and village Mundka. Alternate land has been identified
in lieu of encroached land for which concurrence of DDA has been sought. Allotment to the
remaining eligible applicants can be made only after acquisition/development of additional land
being acquired.
(b) CONSTRUCTION OF CETP'S
DSIDC has been entrusted with the work of construction of 15 CETP's for 28 industrial areas of Delhi
in compliance of the orders of the Hon'ble Supreme Court of India. DSIDC is executing this project
in co-ordination with DPCC and NEERI. 10 CETPs are already functional, one CETP at final stage of
completion. Three CETPs could not be constructed due to various problems i.e. availability of
land, designing in accuracy etc. work of one CETP at Najafgarh has been resigned due to failure
of the contractor to finish the work. The progress is constantly being monitored by Supreme Court
and various committees/ authorities on regular basis. Five of the ten CEPTs have already handed
over to the respective societies for operation and management.
DELHI KHADI & VILLAGE INDUSTRIES BOARD
18. Delhi Khadi & Village Industries Board was constituted in the year 1983 under Himachal Pradesh
Khadi and Village Industries Board Act as extended to Delhi. At present the Board is implementing
Rural Employment Generation Programme (Margin Money) scheme in Delhi. The scheme is owned
by Khadi and Village Industries Commission, Govt. of India and implemented by this Board in the
rural areas of NCT of Delhi through the nationalized banks. The Banks sanction 90% of the project
cost in case of general category borrowers and 95% of the project cost in case of Weaker Sections
of beneficiaries/institutions. After sanction of credit facility by the Bank branch, eligible amount of
margin money i.e. 25% in case of general category & 30% in case of weaker sections of
beneficiaries is kept as term deposit for two years in the name of borrowers which will be credit to
the borrowers loan account after the period of two years from the date of first disbursement.
(A) Marketing Activities
The Board started limited marketing activities from the year 1999. The Board is procuring items
from the certified KVIC units only and selling them at its Sales Outlets. There are three sales outlets
at present namely shops at Canning Lane, and other at Delhi Secretariat and one mobile Sales
Van. The total Sale figures of last five years are as follows:

106 ECONOMIC SURVEY OF DELHI, 2005-2006
Year Total Sale (Rs in Lakh)
2000-01 36.06
2001-02 33.76
2002-03 10.36
2003-04 4.12
2004-05 1.87
The Board proposes to expand its marketing activities by opening more sales outlets at strategic
locations of Delhi.
Rajiv Gandhi Swavlamban Rojgar Yojana and Employment Scheme for Unemployed Youths have
also been transferred to DKVIB for implementation. The brief details of these Scheme are as under:
-
(B) Employment Scheme for Educated Unemployed Youths
Employment Scheme for Educated Unemployed Youths was started from the year 2004-05. Under
this scheme, projects up to Rs.1 lakh in case of individuals and Rs. 5 lakh in partnership are covered,
provided the share of each person in the project cost is Rs. 1 lakh or less. Entrepreneurs are required
to contribute 10% of the project cost, as margin money in cash and Govt. provide composite loan
to the extent of 90% of the project cost. Govt. provides subsidy at the rate of 15% of the project
cost subject to a ceiling of Rs. 7500 per entrepreneur.
(C) Rajiv Gandhi Swavlamban Rojgar Yojana
Rajiv Gandhi Swavlamban Rojgar Yojana was also started form the year 2004-05. Under this scheme,
loan assistance upto Rs. 2 lakh are given to unemployed young graduates both men and women
through DKVIB.
SOFTWARE INDUSTRY
19. The growth of the software industry in Delhi has been relatively slow compared to Bangalore and
Mumbai even though it has tremendous potential. Projections by NASSCOM (1998) indicate that
with a co-coordinated action plan by the government and industry, the software industry in Delhi
can grow at an accelerated pace to achieve an annual turnover of Rs. 47,500 crore (US$ 10
billion) by the year 2007-08 which would be as much as 12% of the projected turnover (US$ 87
billion) of the Indian software and services industry.

ECONOMIC SURVEY OF DELHI, 2005-2006 107
Software exports from Delhi, which were Rs. 55 crore in 1995-96, increased to Rs. 150 crore in
1997-98, which is 2.3% of the total software exports of Rs. 6,530 crore from the country. However,
the cumulative software exports from Delhi, Noida and Gurgaon were around Rs. 1,040 crore, i.e.,
almost 15% of India's software exports in 1997-98. According to NASSCOM Delhi's software export
potential could be Rs. 20,000 crore by 2007-08, which is 10% of India's projected exports by 2007-
08.
The domestic software market in Delhi during 1997-98 was estimated to be Rs. 860 crore amounting
to almost 22% of the domestic software market in India.
NASSCOM has also estimated that Delhi can easily provide jobs to 1 lakh people in the next three
years and about 3 lakh in the next 10 years in the area of IT enabling services.