indonesia food security report fin12march2010 · maternal mortality rate is 334/100,000 births at...
TRANSCRIPT

FINAL REPORT February 2010
Nutrition Security and Food Security in
Seven Districts in NTT Province, Indonesia:
Status, Causes and Recommendations for Response
FOREWORD AND ACKNOWLEDGEMENTS
This study is the product of a collaborative effort which stretches back to March 2008. In that month, three UN Agencies: FAO, UNICEF and WFP joined forces with the Food Security Agency of the Ministry of Agriculture, and the Food Security Office of NTT to begin planning for a Food Security and Nutrition Assessment in NTT province. The intent of the assessment was to produce an accurate picture of the current food security and nutrition security situation, to identify potential causes and to make recommendations on key interventions to improve the situation. After one multi-stakeholder consultative workshop in April 2008 and a further planning workshop in July 2008, the survey design was finalised and the decision was made to focus on seven high priority districts in NTT. The survey was conducted in January and February 2009 by the Centre for Community Nutrition at the SEAMEO TROPMED (Southeast Asian Ministers of Education Organization - Tropical Medicine and Public Health) Regional Centre for Community Nutrition at the University of Indonesia. Preliminary draft results were presented to a stakeholder workshop held in Kupang in August 2009. Following a series of further discussions and refinements, this final draft has been developed. FAO, UNICEF and WFP would like to acknowledge the guidance given in this process by Dr. Tjuk Eko Hari Basuki of the Food Security Agency of the Ministry of Agriculture, together with other members of the Survey Steering Committee: Ir. Frans Lebu Raya, Governor of NTT and Head of Food Security Council of NTT; and Dr. Ina, Director of Department of Community Nutrition, Ministry of Health. The three agencies would also like to acknowledge the leadership given by Mr. Petrus Langoday of the Food Security Office in NTT, and the hard work and dedication of Dr. Siti Muslimatun at the Centre for Community Nutrition, who led in the analysis and report writing. Also we would like to acknowledge the valuable inputs of Dr. Hartoyo and Dr. Hadi Riyadi of the Bogor Agriculture Institute – IPB who completed the Desk Review Report on Livelihoods-Based Food Security and Nutrition in NTT, and assisted in most of the workshops and meetings connected to the assessment. Finally, we would like to express our thanks for the financial support extended by AusAid and ECHO without whom it would have not been possible to conduct such a comprehensive survey. We very much hope that this survey will provide a key reference point for enhanced food security and nutrition interventions at district level and below in NTT, and we pledge to continue our support to improve food security and nutrition in the Province. Jakarta and Rome February 2010
TABLE OF CONTENTS
1. INTRODUCTION........................................................................................................................... 1
2. OBJECTIVES ................................................................................................................................. 3
3. METHODOLOGY ......................................................................................................................... 3
3.1 SAMPLING................................................................................................................................... 3 3.2 DATA COLLECTION ..................................................................................................................... 4
3.2.1 Process............................................................................................................................ 4 3.2.2 Methods of data collection.............................................................................................. 5
3.3 DATA ANALYSIS ......................................................................................................................... 6 3.4 ETHICS........................................................................................................................................ 6 3.5 PROBLEMS AND LIMITATIONS OF THE DATA................................................................................ 6
4. FOOD AND NUTRITION SECURITY FRAMEWORK ........................................................... 8
5. NUTRITION SECURITY: STATUS, IMMEDIATE AND UNDERLYING CAUSES.......... 10
5.1 NUTRITIONAL STATUS .............................................................................................................. 10 5.1.1 Nutritional status of children 0-59 months ................................................................... 11 5.1.2 Nutritional status of caregivers of children 0-59 months.............................................. 16 5.1.3 Associations between child’s and mother’s nutritional status ...................................... 19 5.1.4 Conclusions on nutritional status.................................................................................. 20
5.2 IMMEDIATE DETERMINANTS OF NUTRITION SECURITY .............................................................. 21 5.2.1 Food intake of children 12-59 mo................................................................................. 21 5.2.2 Food intake of mothers/caregivers................................................................................ 22 5.2.3 Health status of children 0-59 months .......................................................................... 23 5.2.4 Conclusion on food intake and health status................................................................. 26
5.3 UNDERLYING DETERMINANTS OF NUTRITION SECURITY ........................................................... 26 5.3.1 Care practices ............................................................................................................... 26 5.3.2 Access to a healthy environment (appropriate sanitation and safe water) ................... 29 5.3.3 Household food security................................................................................................ 32
5.3.3.1 Composite household food security indicator and Nutritional status indicators ...........33 5.3.3.2 Food Consumption, Food Access and Nutritional status Indicators..............................34
5.3.4 Conclusion on the relationship between the underlying determinants and
nutritional status........................................................................................................... 37
6. FOOD SECURITY: STATUS, IMMEDIATE AND UNDERLYING CAUSES..................... 38
6.1. ESTIMATING LEVELS OF HOUSEHOLD FOOD SECURITY IN THE SEVEN DISTRICTS ....................... 38 6.1.1 Food consumption score ............................................................................................... 38 6.1.2 Food access................................................................................................................... 41 6.1.3 Combining Food Consumption Groups with Food Access Groups .............................. 42 6.1.4 Conclusions on household food security situation in the seven districts....................... 43
6.2 FACTORS UNDERLYING HOUSEHOLD FOOD SECURITY LEVELS AND STATUS .............................. 43 6.2.1 Introduction................................................................................................................... 43 6.2.2 Description of household level production of crops and livestock................................ 47
6.2.2.1 Duration of staple food stocks ......................................................................................48 6.2.2.2 Livestock ......................................................................................................................50 6.2.2.3 Conclusion on food sources from crop and livestock production .................................50
6.2.3 Constraints to household food security from crop and livestock production................ 51 6.2.4 Analysis of constraints ................................................................................................. 52
6.2.4.1 Livestock diseases.........................................................................................................52 6.2.4.2 Crop pests and diseases.................................................................................................53
6.2.4.3 Water-related problems.................................................................................................54 6.2.4.4 Fertilizer........................................................................................................................55 6.2.4.5 Land size.......................................................................................................................56 6.2.4.6 Agricultural tools and machinery..................................................................................56
6.2.5 Incomes and livelihoods............................................................................................... 57 6.2.5.1 Levels of income...........................................................................................................57 6.2.5.2 Relating income levels to livelihood types....................................................................58
6.2.6 Expenditure ................................................................................................................... 62 6.2.7 Market Issues ................................................................................................................ 64 6.2.8 Conclusions on incomes, expenditures and prices........................................................ 65
6.3 BASIC FACTORS UNDERLYING HOUSEHOLD FOOD INSECURITY: LIVELIHOOD ASSETS ............... 66 6.3.1 Human capital............................................................................................................... 66 6.3.2 Natural capital .............................................................................................................. 68 6.3.3 Social capital ................................................................................................................ 68 6.3.4 Physical capital............................................................................................................. 70 6.3.5 Financial capital ........................................................................................................... 71 6.3.6 Conclusions on assets ................................................................................................... 71
6.4 VULNERABILITY CONTEXT ....................................................................................................... 72 6.4.1 Seasonality, shocks and natural disasters..................................................................... 72 6.4.2 Coping strategies ......................................................................................................... 75 6.4.3 Coping Strategies Index ................................................................................................ 78 6.4.4 Conclusion on shocks and vulnerability........................................................................ 79
7. DISTRICT, PROVINCIAL AND CENTRAL GOVERNMENT AND INGO POLICIES,
INTERVENTIONS AND CAPACITIES.................................................................................... 80
7.1 INTRODUCTION ......................................................................................................................... 80 7.2 GOVERNMENT RESPONSES ........................................................................................................ 80
7.2.1 Delivery structures........................................................................................................ 80 7.2.2 Programmes and funding.............................................................................................. 81 7.2.3 Key Programmes........................................................................................................... 85
7.2.3.1 Government safety nets: ..............................................................................................85 7.2.4 Other major programmes.............................................................................................. 86
7.2.4.1 Agriculture, fishery and livestock specific interventions .............................................86 7.2.4.2 Nutrition Support .........................................................................................................86 7.2.4.3 Food security and nutrition status monitoring..............................................................87 7.2.4.4 Multi-sectoral programmes ..........................................................................................87
7.2.5 Overall observations on Government support to food security and nutrition in NTT... 88
7.3 INGOS AND UN AGENCIES RESPONSE ..................................................................................... 89
8. CONCLUSIONS AND RECOMMENDATIONS ...................................................................... 91
8.1 CONCLUSIONS .......................................................................................................................... 91 8.1.1 Coverage and representativeness of the study .............................................................. 91 8.1.2 Levels of malnutrition in children and women.............................................................. 91 8.1.3 Causes of undernutrition............................................................................................... 92 8.1.4 Household Food Insecurity ........................................................................................... 93 8.1.5 Underlying causes of household food insecurity........................................................... 93 8.1.6 Basic causes of household food insecurity .................................................................... 94 8.1.7 Shocks and coping strategies ........................................................................................ 95 8.1.8 Interventions and capacities of government, NGOs and UN agencies ......................... 96
8.2 RECOMMENDATIONS ................................................................................................................ 97 8.2.1 Key interventions to address infant and maternal malnutrition.................................... 97
8.2.1.1 Prevention of malnutrition among infants and young children .....................................97 8.2.1.2 Treatment and prevention of acute malnutrition ...........................................................98 8.2.1.3 Accelerate selected health interventions .......................................................................98
8.2.1.4 Strengthen access to WASH .........................................................................................98 8.2.1.5 Improved knowledge of women/mothers and community about nutrition and health ..99 8.2.1.6 Re-double efforts to increase female enrolment and retention at school through
to the end of High school and scale-up female literacy programmes ............................99 8.2.2 Key interventions to address household food insecurity ............................................... 99
8.2.2.1 Increased and strengthen food production household and community levels ...............99 8.2.2.2 Diversify foods cultivated at household level .............................................................100 8.2.2.3 Improve levels and stability of rural incomes .............................................................100 8.2.2.4 Reduce disaster risk and severity of food security shocks ..........................................101 8.2.2.5 Continue to enhance evidence-based information on food access for early warning
and timely programming of appropriate responses .....................................................101 8.2.3 Institutional and funding issues ................................................................................. 102
8.2.3.1 Government institutions.............................................................................................102 8.2.3.2 UN Agencies and NGOs ............................................................................................102
REFERENCES................................................................................................................................... 103
ANNEXES .......................................................................................................................................... 107
ANNEX 1 - LIVELIHOOD ZONES OF NTT PROVINCE ............................................................................... 109 ANNEX 2 - THE VARIABLES – INDICATORS MATRIX FOR THE LIVELIHOOD-BASED FOOD SECURITY AND NUTRITION ASSESSMENT IN NTT PROVINCE ............................................................... 109 ANNEX 3 - LIST OF VILLAGES ............................................................................................................... 112
1
1. INTRODUCTION
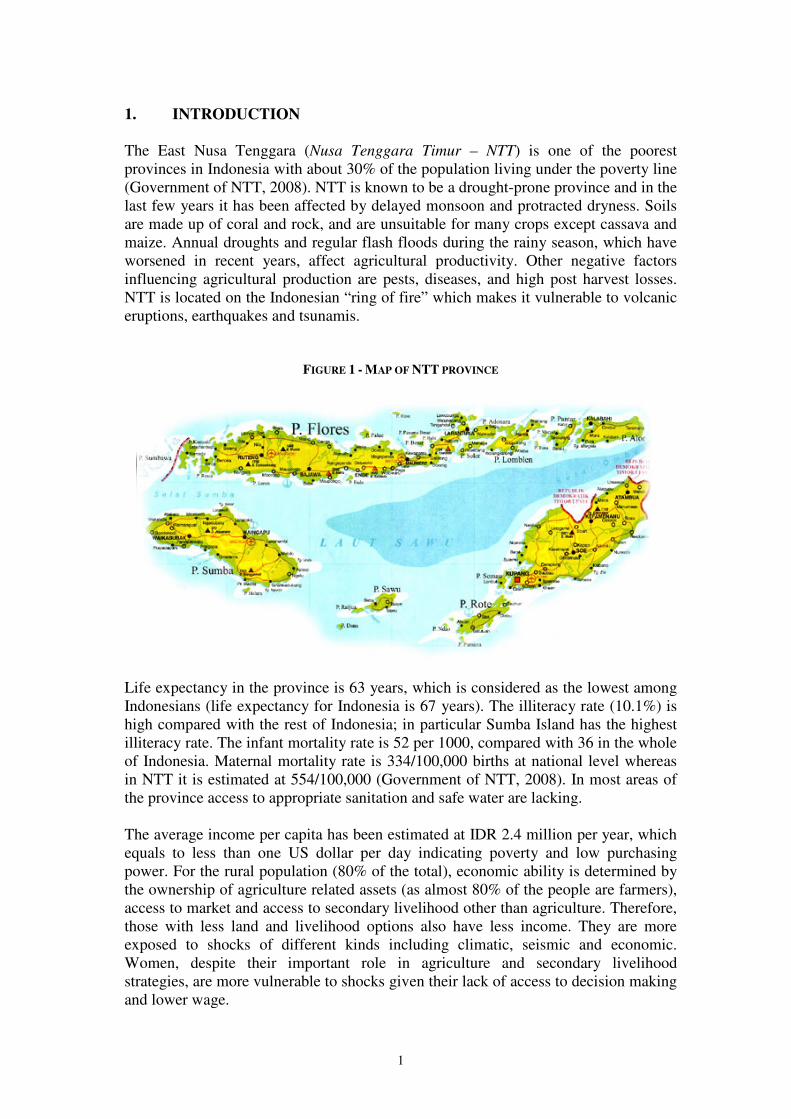
The East Nusa Tenggara (Nusa Tenggara Timur – NTT) is one of the poorest provinces in Indonesia with about 30% of the population living under the poverty line (Government of NTT, 2008). NTT is known to be a drought-prone province and in the last few years it has been affected by delayed monsoon and protracted dryness. Soils are made up of coral and rock, and are unsuitable for many crops except cassava and maize. Annual droughts and regular flash floods during the rainy season, which have worsened in recent years, affect agricultural productivity. Other negative factors influencing agricultural production are pests, diseases, and high post harvest losses. NTT is located on the Indonesian “ring of fire” which makes it vulnerable to volcanic eruptions, earthquakes and tsunamis.
FIGURE 1 - MAP OF NTT PROVINCE
Life expectancy in the province is 63 years, which is considered as the lowest among Indonesians (life expectancy for Indonesia is 67 years). The illiteracy rate (10.1%) is high compared with the rest of Indonesia; in particular Sumba Island has the highest illiteracy rate. The infant mortality rate is 52 per 1000, compared with 36 in the whole of Indonesia. Maternal mortality rate is 334/100,000 births at national level whereas in NTT it is estimated at 554/100,000 (Government of NTT, 2008). In most areas of the province access to appropriate sanitation and safe water are lacking. The average income per capita has been estimated at IDR 2.4 million per year, which equals to less than one US dollar per day indicating poverty and low purchasing power. For the rural population (80% of the total), economic ability is determined by the ownership of agriculture related assets (as almost 80% of the people are farmers), access to market and access to secondary livelihood other than agriculture. Therefore, those with less land and livelihood options also have less income. They are more exposed to shocks of different kinds including climatic, seismic and economic. Women, despite their important role in agriculture and secondary livelihood strategies, are more vulnerable to shocks given their lack of access to decision making and lower wage.
2
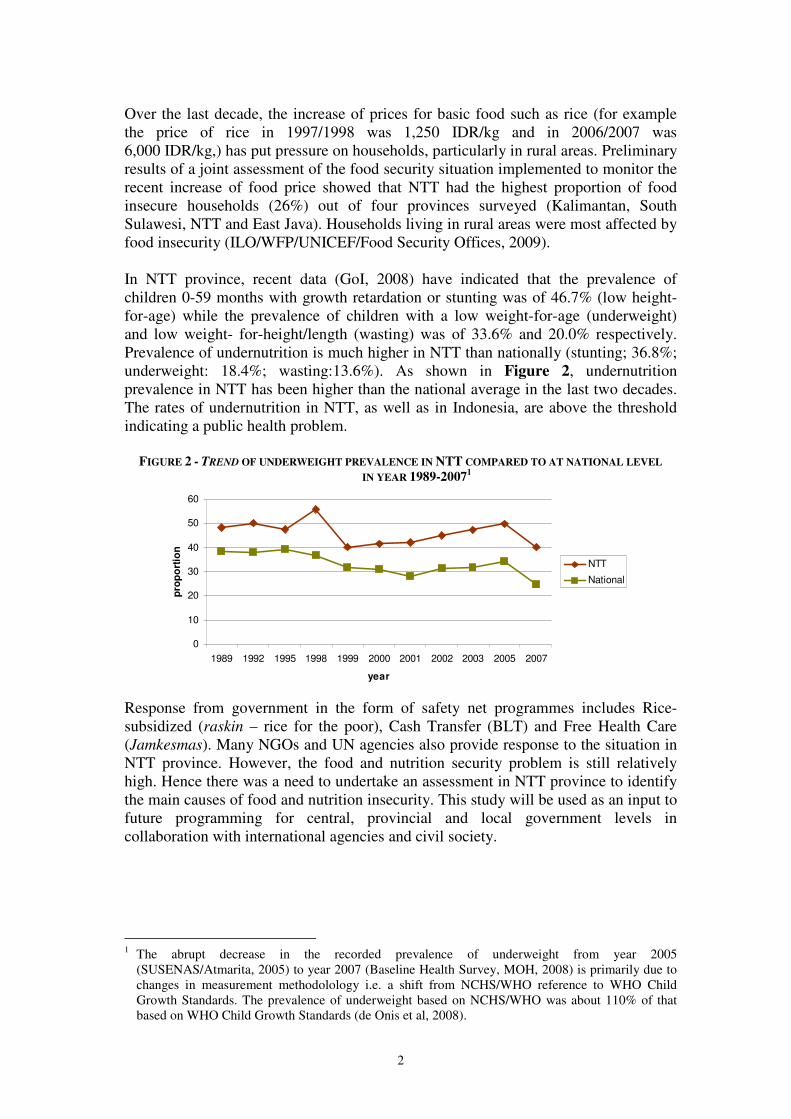
Over the last decade, the increase of prices for basic food such as rice (for example the price of rice in 1997/1998 was 1,250 IDR/kg and in 2006/2007 was 6,000 IDR/kg,) has put pressure on households, particularly in rural areas. Preliminary results of a joint assessment of the food security situation implemented to monitor the recent increase of food price showed that NTT had the highest proportion of food insecure households (26%) out of four provinces surveyed (Kalimantan, South Sulawesi, NTT and East Java). Households living in rural areas were most affected by food insecurity (ILO/WFP/UNICEF/Food Security Offices, 2009). In NTT province, recent data (GoI, 2008) have indicated that the prevalence of children 0-59 months with growth retardation or stunting was of 46.7% (low height-for-age) while the prevalence of children with a low weight-for-age (underweight) and low weight- for-height/length (wasting) was of 33.6% and 20.0% respectively. Prevalence of undernutrition is much higher in NTT than nationally (stunting; 36.8%; underweight: 18.4%; wasting:13.6%). As shown in Figure 2, undernutrition prevalence in NTT has been higher than the national average in the last two decades. The rates of undernutrition in NTT, as well as in Indonesia, are above the threshold indicating a public health problem.
FIGURE 2 - TREND OF UNDERWEIGHT PREVALENCE IN NTT COMPARED TO AT NATIONAL LEVEL
IN YEAR 1989-20071
0
10
20
30
40
50
60
1989 1992 1995 1998 1999 2000 2001 2002 2003 2005 2007
year
pro
po
rtio
n
NTT
National
Response from government in the form of safety net programmes includes Rice-subsidized (raskin – rice for the poor), Cash Transfer (BLT) and Free Health Care (Jamkesmas). Many NGOs and UN agencies also provide response to the situation in NTT province. However, the food and nutrition security problem is still relatively high. Hence there was a need to undertake an assessment in NTT province to identify the main causes of food and nutrition insecurity. This study will be used as an input to future programming for central, provincial and local government levels in collaboration with international agencies and civil society.
1 The abrupt decrease in the recorded prevalence of underweight from year 2005
(SUSENAS/Atmarita, 2005) to year 2007 (Baseline Health Survey, MOH, 2008) is primarily due to changes in measurement methodolology i.e. a shift from NCHS/WHO reference to WHO Child Growth Standards. The prevalence of underweight based on NCHS/WHO was about 110% of that based on WHO Child Growth Standards (de Onis et al, 2008).
3
2. OBJECTIVES
The objectives of the livelihood-based food security and nutrition assessment were:
1. To describe and analyse nutrition security and food security and the relationships between them; and
2. To provide a platform for development of food and nutrition security strategies which are linked to district provincial and national government budgeting processes.
3. METHODOLOGY
3.1 Sampling The assessment was conducted in seven (7) districts: Sumba Barat, Sumba Timur, Manggarai, TTS, Alor, Kupang and Rote Ndao. Each district is considered as a stratum; hence the total amount of strata is seven. The seven districts represent 10 different livelihood zones in NTT province. While the sampling was not intended to be representative for the livelihood zone, however all 7 districts included in the survey covered all types of livelihood zone of the NTT province. The description of the livelihood zones are presented in the Annex 1. The livelihood zoning was based on consensus of the workshop among relevant stakeholders prior to the assessment. The variables –indicators matrix for the assessment which explains the parameters to be measured, the indicators of the parameters, methods of assessment as well as means of verification is detailed in Annex 2. The standard cluster sampling method was applied to select 30 clusters (also referred to Primary sampling Units – PSUs or villages) in each district based on the most recent comprehensive list of all villages by using the Proportional-to-Population-Size (PPS) sampling technique. The procedure for selection of clusters in each district was as follows:
1. All villages/clusters with its population size were listed and the total number of the population was summed up.
2. The sampling interval was calculated by dividing the number of total population by the number of village/clusters.
3. The first cluster was determined by picking one number at random (using NutriSurvey for Emergency Assessment) between 1 and the sampling interval. The village which had the selected number was chosen as the first cluster.
4. The other clusters were then positioned in the cumulative list and a number of clusters per district derived.
Random sampling was used to select households in each cluster, using the most recent household list available for the village. Considering that the area of one village was quite wide and many areas were difficult to reach geographically, a number of sub-villages were selected from each village proportionate to the number of sub-villages per village. Almost all villages had 5 or more sub-villages and using a proportionate method, 3 sub-villages were selected in each village. The sub-village where the village office was located was chosen as the first sub-village and the second and third
4
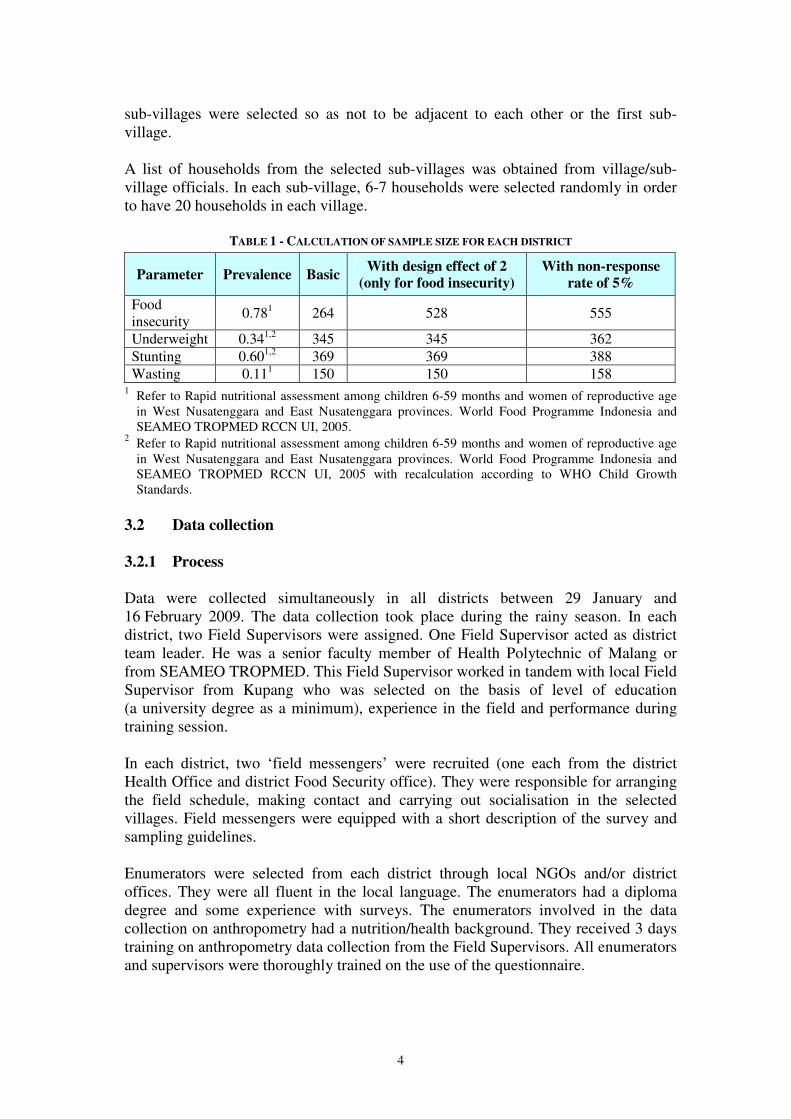
sub-villages were selected so as not to be adjacent to each other or the first sub-village. A list of households from the selected sub-villages was obtained from village/sub-village officials. In each sub-village, 6-7 households were selected randomly in order to have 20 households in each village.
TABLE 1 - CALCULATION OF SAMPLE SIZE FOR EACH DISTRICT
Parameter Prevalence Basic With design effect of 2
(only for food insecurity)
With non-response
rate of 5%
Food insecurity
0.781 264 528 555
Underweight 0.341,2 345 345 362 Stunting 0.601,2 369 369 388 Wasting 0.111 150 150 158
1 Refer to Rapid nutritional assessment among children 6-59 months and women of reproductive age in West Nusatenggara and East Nusatenggara provinces. World Food Programme Indonesia and SEAMEO TROPMED RCCN UI, 2005.
2 Refer to Rapid nutritional assessment among children 6-59 months and women of reproductive age in West Nusatenggara and East Nusatenggara provinces. World Food Programme Indonesia and SEAMEO TROPMED RCCN UI, 2005 with recalculation according to WHO Child Growth Standards.
3.2 Data collection 3.2.1 Process Data were collected simultaneously in all districts between 29 January and 16 February 2009. The data collection took place during the rainy season. In each district, two Field Supervisors were assigned. One Field Supervisor acted as district team leader. He was a senior faculty member of Health Polytechnic of Malang or from SEAMEO TROPMED. This Field Supervisor worked in tandem with local Field Supervisor from Kupang who was selected on the basis of level of education (a university degree as a minimum), experience in the field and performance during training session. In each district, two ‘field messengers’ were recruited (one each from the district Health Office and district Food Security office). They were responsible for arranging the field schedule, making contact and carrying out socialisation in the selected villages. Field messengers were equipped with a short description of the survey and sampling guidelines. Enumerators were selected from each district through local NGOs and/or district offices. They were all fluent in the local language. The enumerators had a diploma degree and some experience with surveys. The enumerators involved in the data collection on anthropometry had a nutrition/health background. They received 3 days training on anthropometry data collection from the Field Supervisors. All enumerators and supervisors were thoroughly trained on the use of the questionnaire.
5
In each district, the survey was carried out by a team of seven enumerators, under the supervision of the Field Supervisors; two enumerators were assigned for anthropometry assessment and five enumerators for household questionnaires. Interviews with traders, village level key informants (on social capital) and Focus Group Discussions (FGDs) with mothers were conducted by Field Supervisors. 3.2.2 Methods of data collection Household interviews were conducted with the head of the household and his spouse using a pre-tested questionnaire. Data on socio-demographics, health status of children under-five, food intake, household food security – including food production and income sources, access to safe water and appropriate sanitation as well as on access to care were collected. A market trader survey was conducted in main market centres that function as commodity bulking market places for national and regional markets. The sampling was purposive following the geographic distribution of dominant traders. In each district, 3 – 4 markets with 10 traders in each market were surveyed. The traders were selected on the basis of gender (men and women), scale of trade (small, medium, big) and commodities (staple foods, fuels, fresh produces, animals, etc). Focus Group Discussions (FGDs) were conducted at village level for mothers of children 0-24 months old. The objective of the FGD was to assess child care practices, such as care for women during pregnancy and lactation period, practice of breastfeeding, complementary feeding, and weaning, vitamin A supplementation, etc. Group interviews with village leaders on social capital were carried out to seek information on social networking/community participation, formal and informal support systems, availability and functionality of various infrastructures, quality of health service and education facilities and food and nutrition interventions. Due to time constraints, it was not possible to conduct group interviews in all villages. Capacity of local government to address food and nutrition insecurity was assessed through multi-sectoral workshops involving food security and nutrition related government offices in April – June 2009. Anthropometric measurements were carried out on all children 0-59 months of age and their caregivers. Weight was recorded with an electronic scale (SECA 890, Hamburg, Germany) and recorded to the nearest 0.1 kg. All measures were taken without shoes and with minimum clothing. The position of the children for length or height measurement was recorded either in supine or laying. Height was measured using microtoise and length was measured using locally made wooden measurement to the nearest 0.1 cm.
6
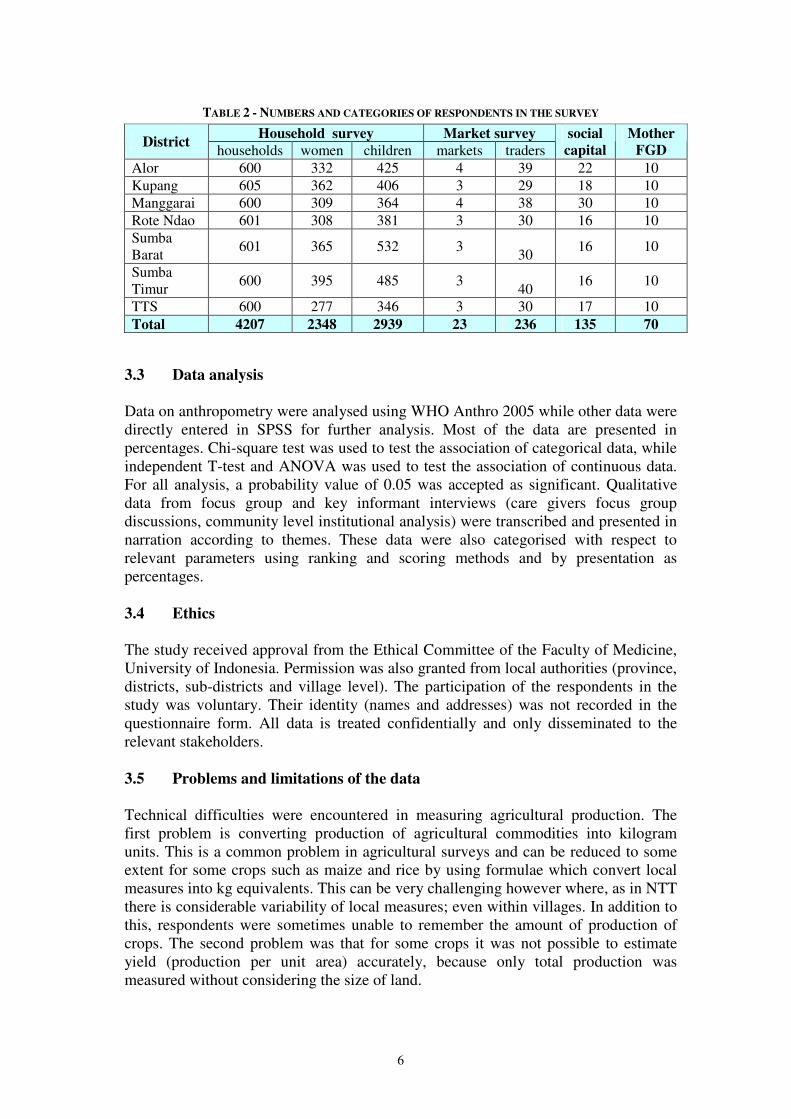
TABLE 2 - NUMBERS AND CATEGORIES OF RESPONDENTS IN THE SURVEY
Household survey Market survey District
households women children markets traders social
capital
Mother
FGD
Alor 600 332 425 4 39 22 10 Kupang 605 362 406 3 29 18 10 Manggarai 600 309 364 4 38 30 10 Rote Ndao 601 308 381 3 30 16 10 Sumba Barat
601 365 532 3 30
16 10
Sumba Timur
600 395 485 3 40
16 10
TTS 600 277 346 3 30 17 10 Total 4207 2348 2939 23 236 135 70
3.3 Data analysis
Data on anthropometry were analysed using WHO Anthro 2005 while other data were directly entered in SPSS for further analysis. Most of the data are presented in percentages. Chi-square test was used to test the association of categorical data, while independent T-test and ANOVA was used to test the association of continuous data. For all analysis, a probability value of 0.05 was accepted as significant. Qualitative data from focus group and key informant interviews (care givers focus group discussions, community level institutional analysis) were transcribed and presented in narration according to themes. These data were also categorised with respect to relevant parameters using ranking and scoring methods and by presentation as percentages.
3.4 Ethics The study received approval from the Ethical Committee of the Faculty of Medicine, University of Indonesia. Permission was also granted from local authorities (province, districts, sub-districts and village level). The participation of the respondents in the study was voluntary. Their identity (names and addresses) was not recorded in the questionnaire form. All data is treated confidentially and only disseminated to the relevant stakeholders. 3.5 Problems and limitations of the data Technical difficulties were encountered in measuring agricultural production. The first problem is converting production of agricultural commodities into kilogram units. This is a common problem in agricultural surveys and can be reduced to some extent for some crops such as maize and rice by using formulae which convert local measures into kg equivalents. This can be very challenging however where, as in NTT there is considerable variability of local measures; even within villages. In addition to this, respondents were sometimes unable to remember the amount of production of crops. The second problem was that for some crops it was not possible to estimate yield (production per unit area) accurately, because only total production was measured without considering the size of land.

7
There were two technical errors in data collection of trader and market survey. The first error was on the part of price of commodity, the writing of ‘maize’ was in blue colour and it was not copied during the photocopying process. Hence, we cannot obtain information about the price of maize. The second error was that page 4 of the questionnaire was missing in Alor district. In this respect, we could not get information about whether the traders used credit to buy their supply, source of credit, stocks, sales, and some commodity prices from Alor. Finally, there were some problems with data collected on wasting in under-5 children in Manggarai district, therefore the reported results for this district on this indicator should be treated with caution.

8
4. FOOD AND NUTRITION SECURITY FRAMEWORK
The design and analysis of the study was formed by two main conceptual frameworks (Figure 3 and Figure 4.). Both of which are rooted somewhat in the UNICEF conceptual framework of malnutrition (UNICEF, 1990). The conceptual framework for food and nutrition security (Gross et al 2000) is helpful in disaggregating the related concepts of food security and nutrition security at both household and individual levels.
• Household Food security: A household is food secure if it can reliably gain access to food in sufficient quantity and quality for all its household members to enjoy a healthy and active life. An individual is food secure when he/she can reliably gain access to enough food for an active and healthy life.
• Household nutrition security: A household achieves nutrition security when it has secure access to food coupled with a sanitary environment, adequate health services, and knowledgeable care to ensure a healthy life for all household members. Furthermore, an individual is nutrition secure when he/she has secure access to food coupled with a sanitary environment, adequate health services, and knowledgeable care to ensure a healthy life for all households (Benson, 2004).
The overlap between food and nutrition security is shown in Figure 3.
FIGURE 3 - CONCEPTUAL FRAMEWORK FOR FOOD AND NUTRITION SECURITY (GROSS ET AL 2000)
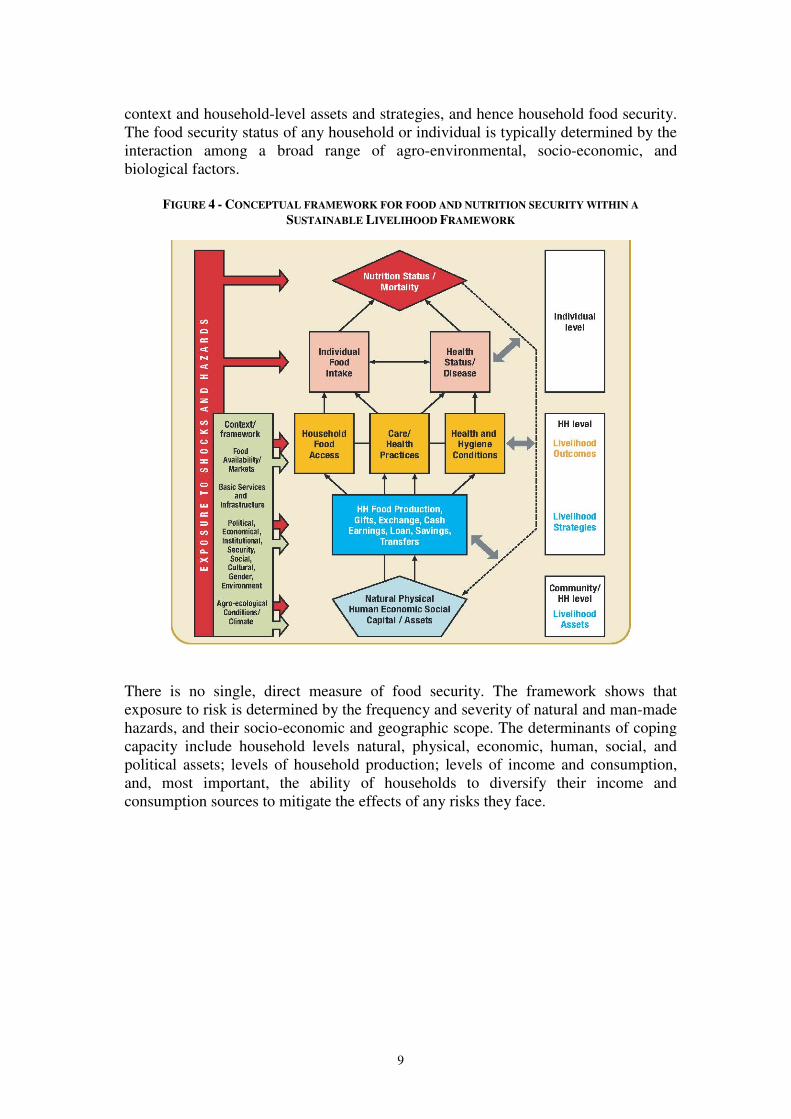
The second conceptual framework explains the relationship of food and nutrition security within a broader Sustainable Livelihoods Framework (SLF) as shown in Figure 4 (WFP, 2009a). In this framework, nutrition security and food security and the relations between them are influenced by the agro-ecological, political and institutional context; and the resulting livelihood strategies adopted by the people may lead to food security. Various hazards and more gradual changes affect the macro
9
context and household-level assets and strategies, and hence household food security. The food security status of any household or individual is typically determined by the interaction among a broad range of agro-environmental, socio-economic, and biological factors.
FIGURE 4 - CONCEPTUAL FRAMEWORK FOR FOOD AND NUTRITION SECURITY WITHIN A
SUSTAINABLE LIVELIHOOD FRAMEWORK
There is no single, direct measure of food security. The framework shows that exposure to risk is determined by the frequency and severity of natural and man-made hazards, and their socio-economic and geographic scope. The determinants of coping capacity include household levels natural, physical, economic, human, social, and political assets; levels of household production; levels of income and consumption, and, most important, the ability of households to diversify their income and consumption sources to mitigate the effects of any risks they face.
10
5. NUTRITION SECURITY: STATUS, IMMEDIATE AND
UNDERLYING CAUSES 5.1 Nutritional Status Anthropometry is the single most universally applicable inexpensive non-invasive method to assess nutritional status. In this study, for children under-five height-for-age (stunting), weight-for-height (wasting), weight-for-age (underweight) and body-mass-index-for-age was estimated with the WHO Anthro 2005 software (WHO, Geneva, Switzerland) which compares measurements to WHO growth standards2. Children with indices below -2 Z-score from the median reference values were considered undernourished while children with a body-mass-index-for-age above 2 Z-score were considered overweight3. In women, a body mass index (BMI) below 18.5 indicated underweight, 18.5 – 24,99 kg/ m2 was considered as normal while ≥ 25 kg/ m2 indicates overweight4. Weight for age reflects body mass relative to age. Low weight for age is described as ‘lightness’ and reflects a pathological process referred to as ‘underweight’. Weight for age also reflects both weight-for-height and height-for-age; hence it fails to distinguish tall, thin children from those who are short with adequate weight. Height/length-for-age reflects the achieved linear growth that can be used as index of past nutritional or health status. Low height-for-age or stunting is defined as ‘shortness’ and reflects either normal variation or a pathological process involving failure to reach linear growth potential. Weight-for-height/length measures body weight relative to height/length. Low weight-for-height/length in children is described as ‘thinness’ and reflects pathological process referred to as ‘wasting’. It rises from a failure to gain sufficient weight relative to height or from losing weight. High weight-for-height is termed ‘overweight’ and arises from gaining excess weight relative to height or insufficient height relative to weight (Gibson 2005). Body Mass Index-for-age measures the ratio of weight to height and it correlates with adiposity. It is an indicator that is especially useful for screening overweight and obesity. The use of BMI-for age is recommended as it correlates with the body fatness and several major risk factors for subsequent heart disease and other chronic diseases. The severity of nutritional problems for public health significance was determined according to the epidemiological evidence on the relationship with child mortality (WHO, 1995). The cut-offs to determine the presence and severity of public health problems are described in Table 3.
2 Multicentre growth reference study group. WHO Child growth standards based on length/height,
weight and age. In: De Onis M., Garza C., Onyango A.W., Martorell R., editors. Acta Paediatrica; 2006. p. 76-85.
3 World Health Organization (WHO). Physical status: The use and interpretation of anthropometry. Geneva, Switzerland: WHO; 1995. Technical report series, Report No. 854.
4 Same as above.
11
TABLE 3 - SEVERITY OF NUTRITIONAL PROBLEM INDICATING PUBLIC HEALTH PROBLEM (WHO, 1995)
Extent of public health problem
Low
Medium High Very high
Indicator*
% prevalence
Underweight <10 10.0-19.9 20.0 - 29.9 >= 30
Stunting <20 20.0 – 29.9 30.0 – 39.9 >= 40
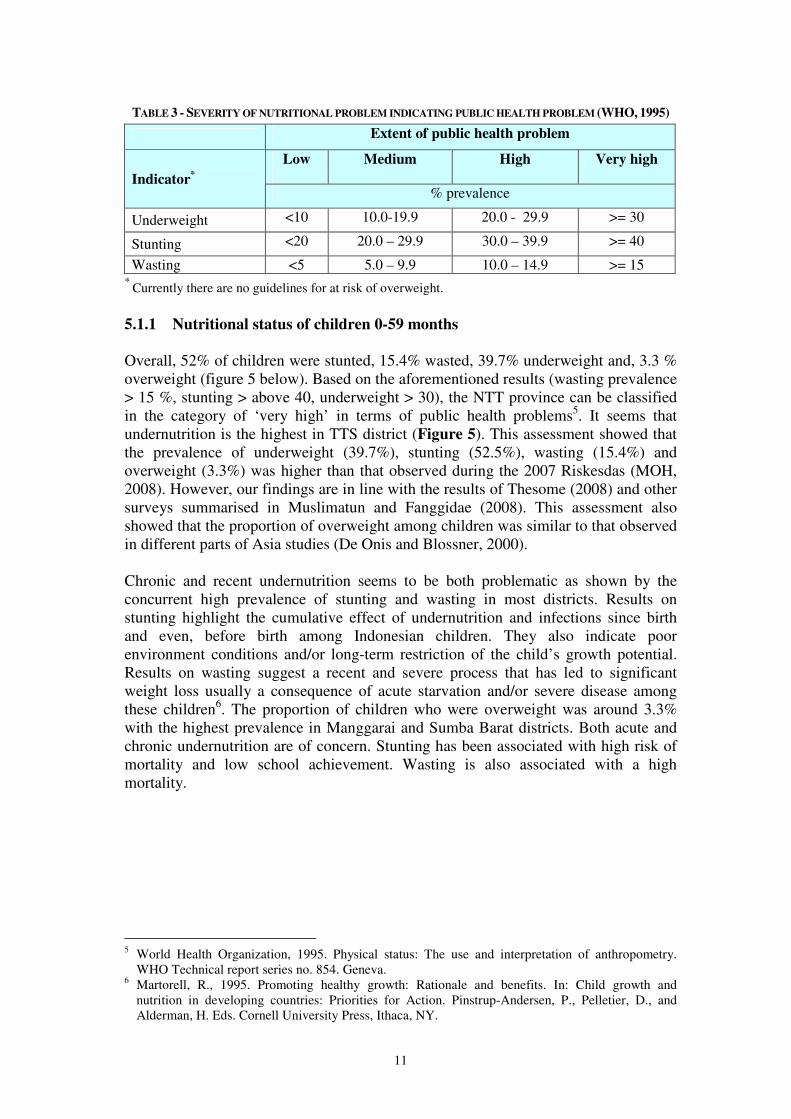
Wasting <5 5.0 – 9.9 10.0 – 14.9 >= 15 * Currently there are no guidelines for at risk of overweight. 5.1.1 Nutritional status of children 0-59 months Overall, 52% of children were stunted, 15.4% wasted, 39.7% underweight and, 3.3 % overweight (figure 5 below). Based on the aforementioned results (wasting prevalence > 15 %, stunting > above 40, underweight > 30), the NTT province can be classified in the category of ‘very high’ in terms of public health problems5. It seems that undernutrition is the highest in TTS district (Figure 5). This assessment showed that the prevalence of underweight (39.7%), stunting (52.5%), wasting (15.4%) and overweight (3.3%) was higher than that observed during the 2007 Riskesdas (MOH, 2008). However, our findings are in line with the results of Thesome (2008) and other surveys summarised in Muslimatun and Fanggidae (2008). This assessment also showed that the proportion of overweight among children was similar to that observed in different parts of Asia studies (De Onis and Blossner, 2000). Chronic and recent undernutrition seems to be both problematic as shown by the concurrent high prevalence of stunting and wasting in most districts. Results on stunting highlight the cumulative effect of undernutrition and infections since birth and even, before birth among Indonesian children. They also indicate poor environment conditions and/or long-term restriction of the child’s growth potential. Results on wasting suggest a recent and severe process that has led to significant weight loss usually a consequence of acute starvation and/or severe disease among these children6. The proportion of children who were overweight was around 3.3% with the highest prevalence in Manggarai and Sumba Barat districts. Both acute and chronic undernutrition are of concern. Stunting has been associated with high risk of mortality and low school achievement. Wasting is also associated with a high mortality.
5 World Health Organization, 1995. Physical status: The use and interpretation of anthropometry.
WHO Technical report series no. 854. Geneva. 6 Martorell, R., 1995. Promoting healthy growth: Rationale and benefits. In: Child growth and
nutrition in developing countries: Priorities for Action. Pinstrup-Andersen, P., Pelletier, D., and Alderman, H. Eds. Cornell University Press, Ithaca, NY.
12
FIGURE 5 - PREVALENCE (%) OF MALNUTRITION IN CHILDREN 0-59 MO BY DISTRICT
(*P<0.05, CHI-SQUARE TEST)
38.5
42.7
24.4
48.2
43.6
27.2
56
39.7
13.2
21.8
3.3
20.8
20.8
11.2
23.1
15.4
51.1
50.5
60.6
53.8
53.8
39.9
61
52.5
1.5
1.1
5.1
2
2
3.9
3.1
3.3
0 20 40 60 80
Alor
Kupang
Manggarai
Rote Ndao
Sumba Barat
Sumba Timur
TTS
Total
(%)
Overweight
Stunting
Wasting
Underweight
Underweight* Wasting* Stunting* Overweight* District
% n % n % n % n Alor 38.5 416 13.2 416 51.1 404 1.5 411 Kupang 42.7 379 21.8 371 50.5 375 1.1 363 Manggarai 24.4 339 3.37 335 60.6 350 5.1 335 Rote Ndao 48.2 365 20.8 346 53.8 339 2 346 Sumba Barat 43.6 498 20.8 471 53.8 472 2 466 Sumba Timur 27.2 460 11.2 438 39.9 458 3.9 433 TTS 56 327 23.1 325 61 332 3.1 324 Total 39.7 2784 15.4 2702 52.5 2755 3.3 2678
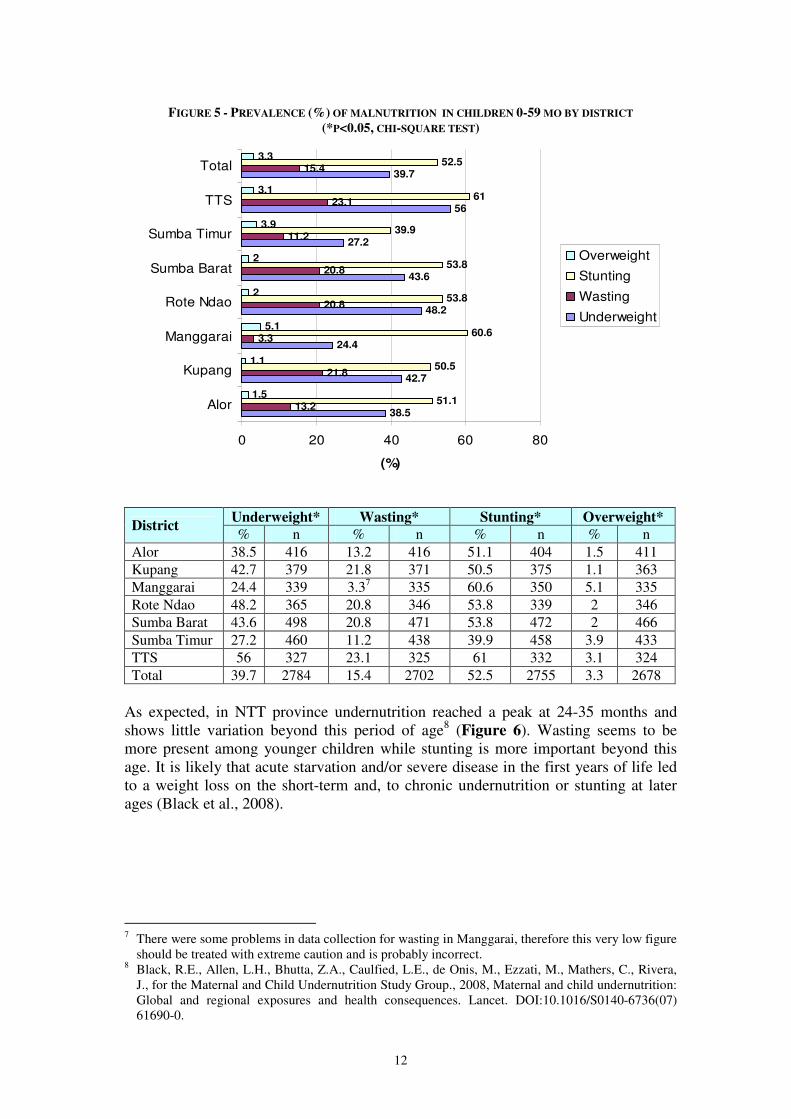
As expected, in NTT province undernutrition reached a peak at 24-35 months and shows little variation beyond this period of age8 (Figure 6). Wasting seems to be more present among younger children while stunting is more important beyond this age. It is likely that acute starvation and/or severe disease in the first years of life led to a weight loss on the short-term and, to chronic undernutrition or stunting at later ages (Black et al., 2008).
7 There were some problems in data collection for wasting in Manggarai, therefore this very low figure
should be treated with extreme caution and is probably incorrect. 8 Black, R.E., Allen, L.H., Bhutta, Z.A., Caulfied, L.E., de Onis, M., Ezzati, M., Mathers, C., Rivera,
J., for the Maternal and Child Undernutrition Study Group., 2008, Maternal and child undernutrition: Global and regional exposures and health consequences. Lancet. DOI:10.1016/S0140-6736(07) 61690-0.
13
FIGURE 6 - PREVALENCE (%) OF MALNUTRITION IN CHILDREN 0-59 MO BY AGE GROUP
(*P<0.05, CHI-SQUARE TEST)
12.9
27.3
40.2
47.9
46.3
51.1
18
19.1
19
12.8
12.3
12.1
13.9
24.8
53.7
67.8
64
65.6
4.8
3
3.9
3.3
2.8
2.5
0 20 40 60 80
<6 mo
6-11 mo
12-23 mo
24-35 mo
35-47 mo
38-59 mo
(%)
Overweight
Stunting
Wasting
Underweight
Underweight* Wasting* Stunting* Overweight* Age group
% n % n % n % n <6 mo 12.9 311 18 266 13.9 267 4.8 270 6-11 mo 27.3 377 19.1 361 24.8 371 3 361 12-23 mo 40.2 640 19 625 53.7 637 3.9 622 24-35 mo 47.9 530 12.8 515 67.8 534 3.3 515 35-47 mo 46.3 520 12.3 514 64 528 2.8 508 38-59 mo 51.1 401 12.1 397 65.6 413 2.5 397
14
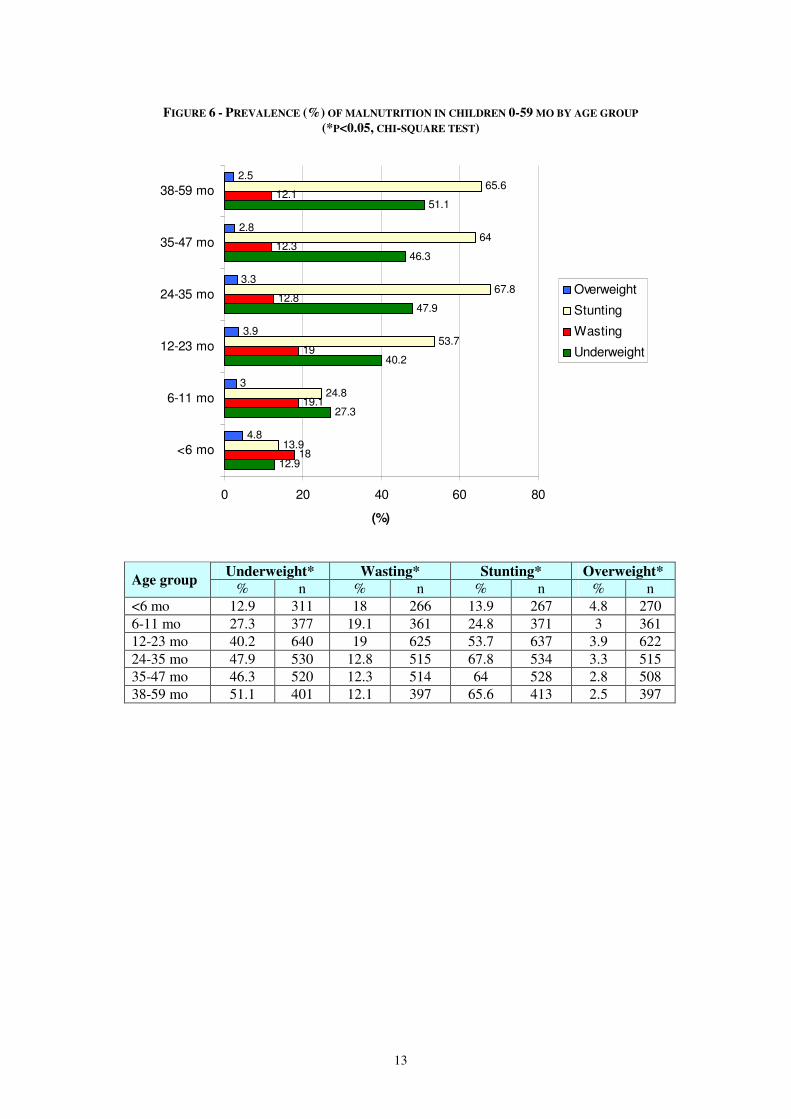
As shown in Figure 7, the proportion of stunted and underweight children was higher among boys than girls and, particularly, among the 0-23 months. Differences in nutritional status between boys and girls have been observed elsewhere. As observed by Caputo et al.9 and Svedberg et al.10, Wamami et al. (2007), the proportion of undernutrition was higher among boys than girls. Because girls represent an asset for the future of household farming activities, they might have been prioritized in terms of care practices.
FIGURE 7 - PREVALENCE OF MALNUTRITION (%) IN CHILDREN 0-59 MO BY GENDER
(*P<0.05, CHI-SQUARE TEST)
41.637.6
32.727.1
49.946.5
15.3 15.5 17.8 20.1
13.1 11.7
55.149.7
42.0
31.1
67.064.6
4 2.6 4.4 3.1 3.5 2.2
0
10
20
30
40
50
60
70
80
boys girls boys girls boys girls
all children 0-23 mo 24-59 mo
(%)
Underweight
Wasting
Stunting
Overweight
Underweight Wasting Stunting Overweight Age group sex
% n % n % n % n boys 41.6 1445 15.3 1402 55.1 1442 4 1387
0-59 mo girls 37.6* 1339 15.5 1300 49.7* 1333 2.6 1291
boys 32.7 712 17.8 674 42.0 681 4.4 675
0-23 mo girls 27.1* 616 20.1 578 31.1* 594 3.1 708
boys 49.9 729 13.1 716 67.0 737 3.5 578
24-59 mo girls 46.5 722 11.7 710 64.6 738 2.2 712
9 Caputo, A., Foraita, R., Klasen, S., Pigeot, I., 2003. Undernutrition in Benin – An analysis based on
graphical models. Soc. Sc. Med. 56(8): 1677. 10 Svedberg, P. 1996. Gender bias in Sub-Saharan Africa : Reply and further evidence. J. Dev. Studies.
32:933.
15
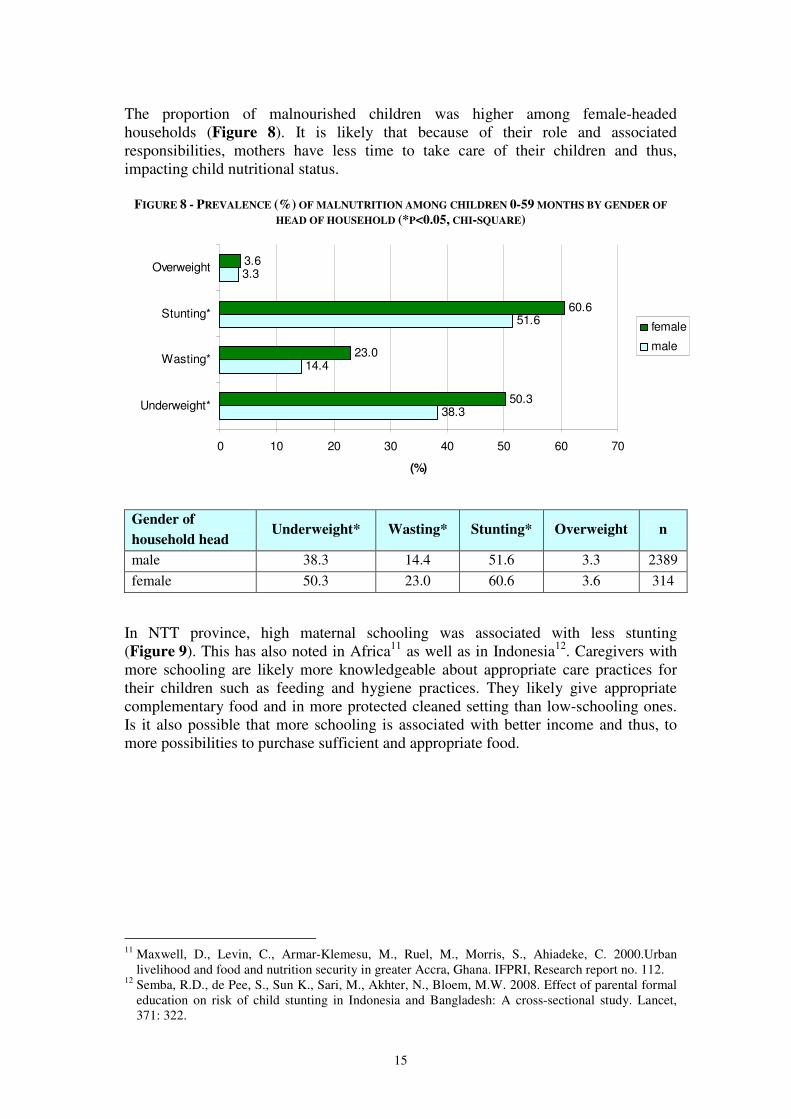
The proportion of malnourished children was higher among female-headed households (Figure 8). It is likely that because of their role and associated responsibilities, mothers have less time to take care of their children and thus, impacting child nutritional status.
FIGURE 8 - PREVALENCE (%) OF MALNUTRITION AMONG CHILDREN 0-59 MONTHS BY GENDER OF
HEAD OF HOUSEHOLD (*P<0.05, CHI-SQUARE)
38.3
14.4
51.6
3.3
50.3
23.0
60.6
3.6
0 10 20 30 40 50 60 70
Underweight*
Wasting*
Stunting*
Overweight
(%)
female
male
Gender of
household head Underweight* Wasting* Stunting* Overweight n
male 38.3 14.4 51.6 3.3 2389
female 50.3 23.0 60.6 3.6 314
In NTT province, high maternal schooling was associated with less stunting (Figure 9). This has also noted in Africa11 as well as in Indonesia12. Caregivers with more schooling are likely more knowledgeable about appropriate care practices for their children such as feeding and hygiene practices. They likely give appropriate complementary food and in more protected cleaned setting than low-schooling ones. Is it also possible that more schooling is associated with better income and thus, to more possibilities to purchase sufficient and appropriate food.
11 Maxwell, D., Levin, C., Armar-Klemesu, M., Ruel, M., Morris, S., Ahiadeke, C. 2000.Urban
livelihood and food and nutrition security in greater Accra, Ghana. IFPRI, Research report no. 112. 12 Semba, R.D., de Pee, S., Sun K., Sari, M., Akhter, N., Bloem, M.W. 2008. Effect of parental formal
education on risk of child stunting in Indonesia and Bangladesh: A cross-sectional study. Lancet, 371: 322.

16
FIGURE 9 - PREVALENCE (%) OF MALNUTRITION AMONG CHILDREN 0-59 MONTHS BY SCHOOLING
OF CAREGIVERS (*P<0.05, CHI-SQUARE)
41.6
53.5
14.7
3.8
40.5
55.3
16.5
2.5
37.3
52.4
15.1
4.1
36.4
45.0
14.4
3.7
0 10 20 30 40 50 60
underweight
stunting*
wasted
overweight
proportion (%)
high school/
university_graduated
junior high
school_graduated
primary
school_graduated
<primary school
Underweight Stunting* Wasting Overweight Education level
of mothers n % n % n % n %
<primary school 41.6 884 53.5 879 14.7 860 3.8 843 primary school graduated 40.5 1028 55.3 1029 16.5 1004 2.5 1001 junior high school graduated 37.3 405 52.4 399 15.1 392 4.1 390 High school/ university graduated 36.4 453 45.0 436 14.4 431 3.7 429
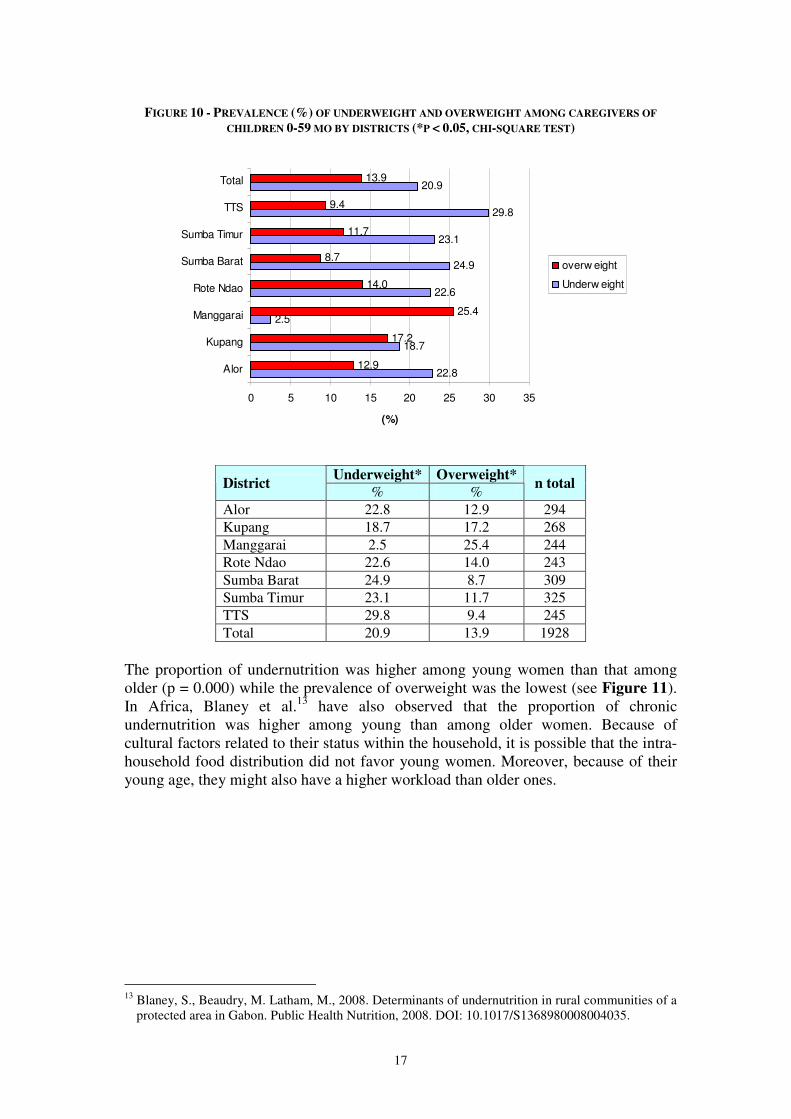
Differences were also observed between proportions of underweight children by category of age of head of household (results not shown). It seems that the proportion of underweight was lower among households with a household head above 30 years old (between 37.3 and 39.3 % for > 30 years old, n = 740 vs 42.8- 43.9% for ≤ 30 years old, n = 1968, p=0.000). Proportions of malnutrition among children did not vary by household size, age of the caregiver and schooling of head of household (results not shown). 5.1.2 Nutritional status of caregivers of children 0-59 months Overall, 21% of the caregivers were chronically undernourished; the highest prevalence was observed in TTS district and the lowest in Manggarai district (Figure 10). Moreover, 13% of the caregivers were overweight. The prevalence of overweight among women was similar to that of the Baseline Health Survey for NTT province (MOH, 2008). Moreover, the prevalence of undernutrition was similar to previous estimates (WFP/SEAMEO, 2005; CWS/HKI, 2007). In the Manggarai district, it is noteworthy that the prevalence of undernutrition is the lowest while that of overnutrition is the highest.
17
FIGURE 10 - PREVALENCE (%) OF UNDERWEIGHT AND OVERWEIGHT AMONG CAREGIVERS OF
CHILDREN 0-59 MO BY DISTRICTS (*P < 0.05, CHI-SQUARE TEST)
22.8
18.7
2.5
22.6
24.9
23.1
29.8
20.9
12.9
17.2
25.4
14.0
8.7
11.7
9.4
13.9
0 5 10 15 20 25 30 35
Alor
Kupang
Manggarai
Rote Ndao
Sumba Barat
Sumba Timur
TTS
Total
(%)
overw eight
Underw eight
Underweight* Overweight* District
% % n total
Alor 22.8 12.9 294 Kupang 18.7 17.2 268 Manggarai 2.5 25.4 244 Rote Ndao 22.6 14.0 243 Sumba Barat 24.9 8.7 309 Sumba Timur 23.1 11.7 325 TTS 29.8 9.4 245 Total 20.9 13.9 1928
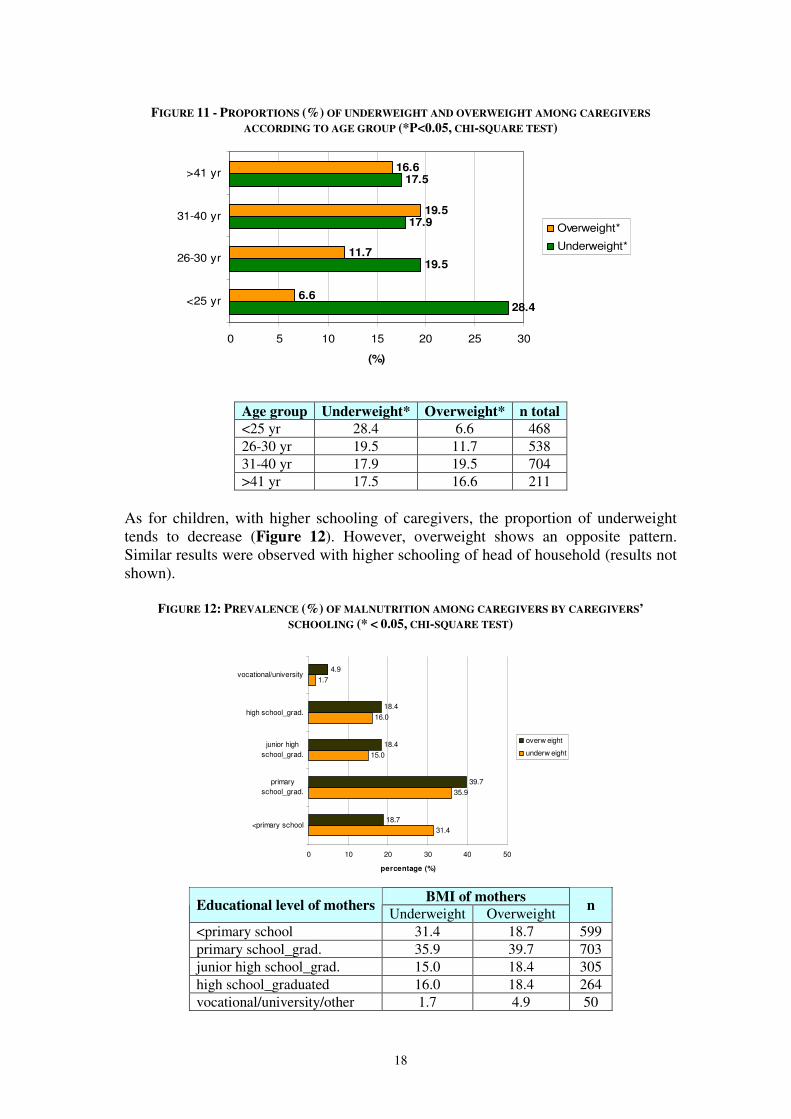
The proportion of undernutrition was higher among young women than that among older (p = 0.000) while the prevalence of overweight was the lowest (see Figure 11). In Africa, Blaney et al.13 have also observed that the proportion of chronic undernutrition was higher among young than among older women. Because of cultural factors related to their status within the household, it is possible that the intra-household food distribution did not favor young women. Moreover, because of their young age, they might also have a higher workload than older ones.
13 Blaney, S., Beaudry, M. Latham, M., 2008. Determinants of undernutrition in rural communities of a
protected area in Gabon. Public Health Nutrition, 2008. DOI: 10.1017/S1368980008004035.
18
FIGURE 11 - PROPORTIONS (%) OF UNDERWEIGHT AND OVERWEIGHT AMONG CAREGIVERS
ACCORDING TO AGE GROUP (*P<0.05, CHI-SQUARE TEST)
28.4
19.5
17.9
17.5
6.6
11.7
19.5
16.6
0 5 10 15 20 25 30
<25 yr
26-30 yr
31-40 yr
>41 yr
(%)
Overweight*
Underweight*
Age group Underweight* Overweight* n total
<25 yr 28.4 6.6 468 26-30 yr 19.5 11.7 538 31-40 yr 17.9 19.5 704 >41 yr 17.5 16.6 211
As for children, with higher schooling of caregivers, the proportion of underweight tends to decrease (Figure 12). However, overweight shows an opposite pattern. Similar results were observed with higher schooling of head of household (results not shown).
FIGURE 12: PREVALENCE (%) OF MALNUTRITION AMONG CAREGIVERS BY CAREGIVERS’
SCHOOLING (* < 0.05, CHI-SQUARE TEST)
31.4
35.9
15.0
16.0
1.7
18.7
39.7
18.4
18.4
4.9
0 10 20 30 40 50
<primary school
primary
school_grad.
junior high
school_grad.
high school_grad.
vocational/university
percentage (%)
overw eight
underw eight
BMI of mothers
Educational level of mothers Underweight Overweight
n
<primary school 31.4 18.7 599 primary school_grad. 35.9 39.7 703 junior high school_grad. 15.0 18.4 305 high school_graduated 16.0 18.4 264 vocational/university/other 1.7 4.9 50
19
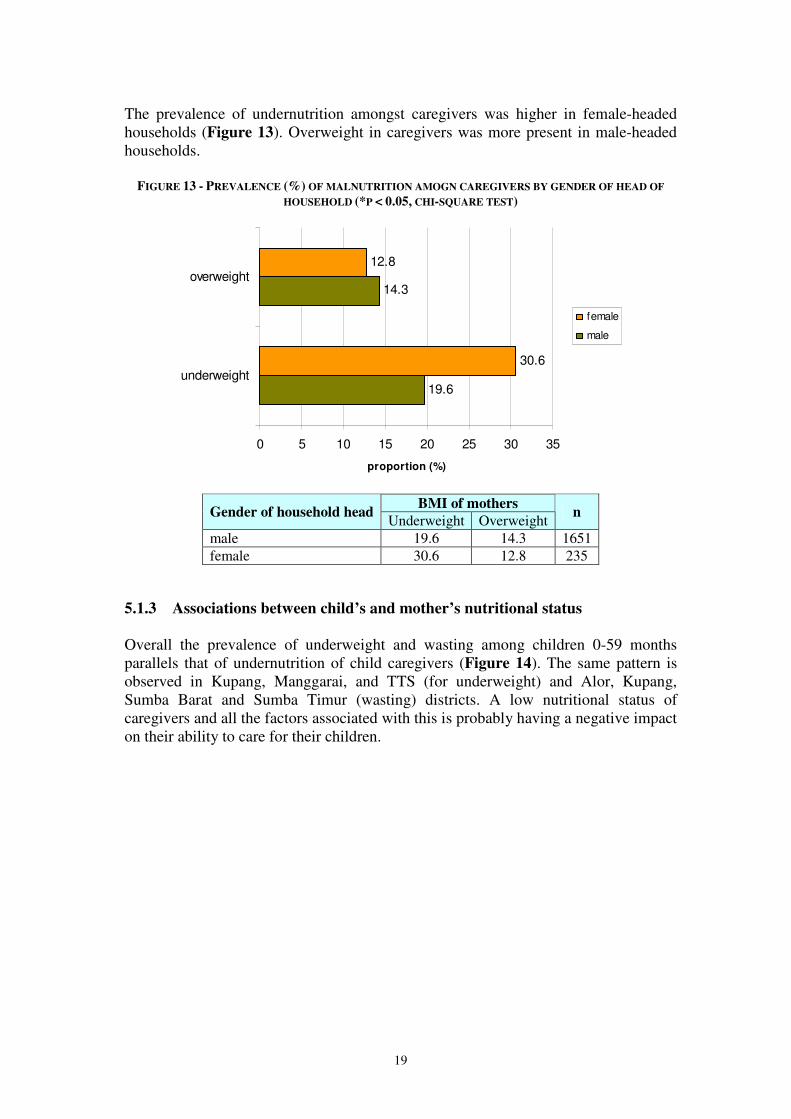
The prevalence of undernutrition amongst caregivers was higher in female-headed households (Figure 13). Overweight in caregivers was more present in male-headed households.
FIGURE 13 - PREVALENCE (%) OF MALNUTRITION AMOGN CAREGIVERS BY GENDER OF HEAD OF
HOUSEHOLD (*P < 0.05, CHI-SQUARE TEST)
19.6
14.3
30.6
12.8
0 5 10 15 20 25 30 35
underweight
overweight
proportion (%)
female
male
BMI of mothers
Gender of household head Underweight Overweight
n
male 19.6 14.3 1651 female 30.6 12.8 235
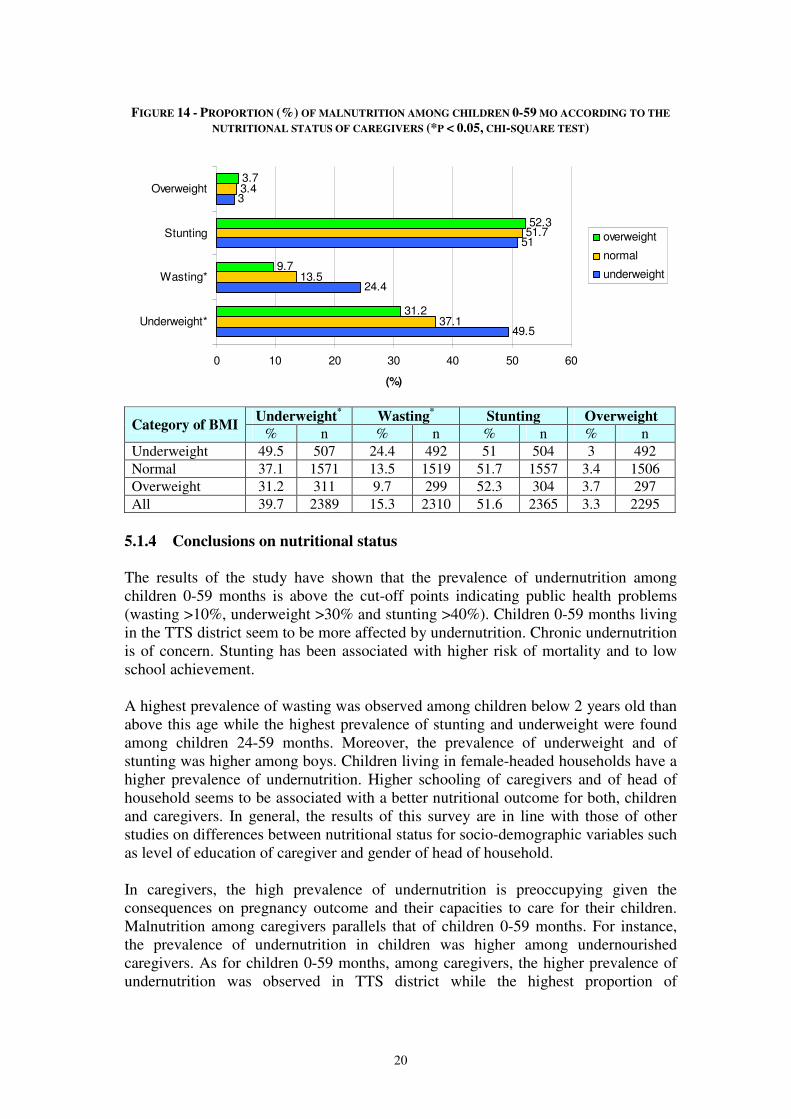
5.1.3 Associations between child’s and mother’s nutritional status Overall the prevalence of underweight and wasting among children 0-59 months parallels that of undernutrition of child caregivers (Figure 14). The same pattern is observed in Kupang, Manggarai, and TTS (for underweight) and Alor, Kupang, Sumba Barat and Sumba Timur (wasting) districts. A low nutritional status of caregivers and all the factors associated with this is probably having a negative impact on their ability to care for their children.
20
FIGURE 14 - PROPORTION (%) OF MALNUTRITION AMONG CHILDREN 0-59 MO ACCORDING TO THE
NUTRITIONAL STATUS OF CAREGIVERS (*P < 0.05, CHI-SQUARE TEST)
49.5
24.4
51
3
37.1
13.5
51.7
3.4
31.2
9.7
52.3
3.7
0 10 20 30 40 50 60
Underweight*
Wasting*
Stunting
Overweight
(%)
overweight
normal
underweight
Underweight
* Wasting
* Stunting Overweight
Category of BMI % n % n % n % n
Underweight 49.5 507 24.4 492 51 504 3 492 Normal 37.1 1571 13.5 1519 51.7 1557 3.4 1506 Overweight 31.2 311 9.7 299 52.3 304 3.7 297 All 39.7 2389 15.3 2310 51.6 2365 3.3 2295
5.1.4 Conclusions on nutritional status
The results of the study have shown that the prevalence of undernutrition among children 0-59 months is above the cut-off points indicating public health problems (wasting >10%, underweight >30% and stunting >40%). Children 0-59 months living in the TTS district seem to be more affected by undernutrition. Chronic undernutrition is of concern. Stunting has been associated with higher risk of mortality and to low school achievement. A highest prevalence of wasting was observed among children below 2 years old than above this age while the highest prevalence of stunting and underweight were found among children 24-59 months. Moreover, the prevalence of underweight and of stunting was higher among boys. Children living in female-headed households have a higher prevalence of undernutrition. Higher schooling of caregivers and of head of household seems to be associated with a better nutritional outcome for both, children and caregivers. In general, the results of this survey are in line with those of other studies on differences between nutritional status for socio-demographic variables such as level of education of caregiver and gender of head of household. In caregivers, the high prevalence of undernutrition is preoccupying given the consequences on pregnancy outcome and their capacities to care for their children. Malnutrition among caregivers parallels that of children 0-59 months. For instance, the prevalence of undernutrition in children was higher among undernourished caregivers. As for children 0-59 months, among caregivers, the higher prevalence of undernutrition was observed in TTS district while the highest proportion of

21
overweight women was found in Manggarai district. Caregiver’s schooling was also associated with better nutrition outcome. The association between the nutritional status of women and children underscores the importance understanding the causes of maternal malnutrition to improve child nutrition. To enhance the nutrition situation in all districts, the determinants of poor nutritional status of children and women, need to be further investigated and this is the subject
of the remaining part of Section 5.
5.2 Immediate determinants of nutrition security In this survey individual dietary intake has not been assessed; the only information collected on food intake relates to the number of meals for children ≥12 months old and women. 5.2.1 Food intake of children 12-59 mo The results show that overall about 73% of children had three meals in the previous 24 hours – ranging from 57% (in Rote Ndao) to 87% (in Alor).
FIGURE 15 - FREQUENCY (%) OF MEALS AMONG CHILDREN 12-59 MONTHS THE PREVIOUS DAY
BY DISTRICTS (*P < 0.05, CHI-SQUARE TEST)
4.7
11.8
9.7
37.2
10.4
12.8
10.8
13.8
95.3
88.2
90.3
62.8
89.6
87.2
89.2
86.2
0 10 20 30 40 50 60 70 80 90 100
Alor
Kupang
Manggarai
Rote Ndao
Sumba Barat
Sumba Timur
TTS
Total
(%)
≥3 times
1-2 times
1-2 times ≥3 times
District % %
n
Alor 4.7 95.3 298 Kupang 11.8 88.2 288 Manggarai 9.7 90.3 236 Rote Ndao 37.2 62.8 285 Sumba Barat 10.4 89.6 405 Sumba Timur 12.8 87.2 345 TTS 10.8 89.2 250 Total 13.8 86.2 2107

22
Among children 12-59 months old, the proportion of underweight was lower among children who had meal ≥ 3 times (45.2%) than those who had meal 1-2 times (51.8%) the previous day (Table 4.)
TABLE 4 - FREQUENCY (%) OF MEALS THE PREVIOUS DAY AND NUTRITIONAL STATUS
OF CHILDREN 12-59 MONTHS
Underweight* Wasting Stunting Overweight Frequency of meals
on the previous day % n % n % n % n 1-2 times/day 51.8 272 17.1 275 64.8 284 1.1 273 ≥3 times/day 45.2 1747 14.1 1705 62.1 1755 3.5 1698
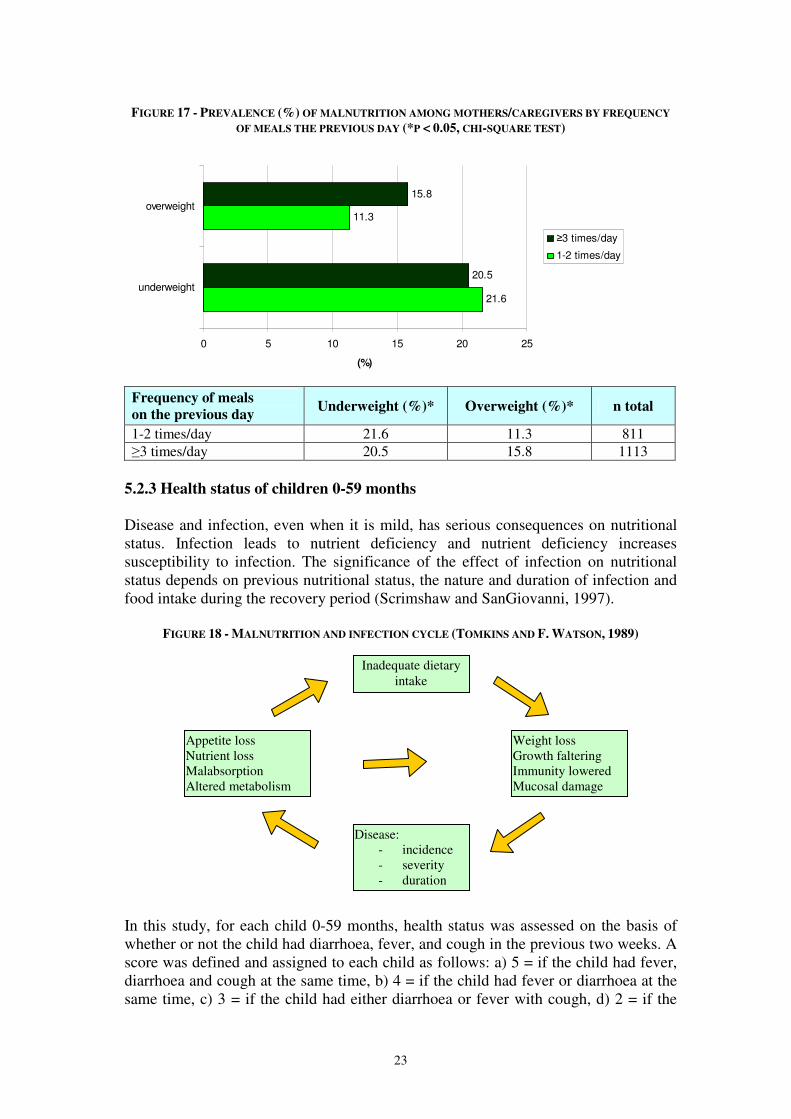
5.2.2 Food intake of mothers/caregivers Around 58% of caregivers consumed ≥3 meals/day the previous day; the highest was Alor, Manggarai and TTS while the lowest was Rote Ndao, Sumba Barat and Sumba Timur. Overall, the prevalence of undernutrition was slightly higher among women who had 1-2 meals the day before the survey while the prevalence of overweight was more elevated among women who had consumed ≥ 3 meals/day. It should be noted that frequency of eating is just a very rough assessment of food intake as it does not measure the quality and quantity of food eaten.
FIGURE 16 - FREQUENCY (%) OF MEALS AMONG MOTHERS/CAREGIVERS THE PREVIOUS DAY
BY DISTRICTS (*P < 0.05, CHI-SQUARE TEST)
10.2
37.3
14.1
71.668.4
64.9
18.9
42.3
89.8
62.7
85.9
28.431.6
35.1
81.1
57.7
0
10
20
30
40
50
60
70
80
90
100
Alor
(n=332)
Kupang
(n=336)
Manggarai
(n=304)
Rote Ndao
(n=303)
Sumba
Barat
(n=364)
Sumba
Timur
(n=396)
TTS (n=275) Total
(n=2336)
(%) <=2 times/day
>=3 times/day
23
FIGURE 17 - PREVALENCE (%) OF MALNUTRITION AMONG MOTHERS/CAREGIVERS BY FREQUENCY
OF MEALS THE PREVIOUS DAY (*P < 0.05, CHI-SQUARE TEST)
21.6
11.3
20.5
15.8
0 5 10 15 20 25
underweight
overweight
(%)
≥3 times/day
1-2 times/day
Frequency of meals
on the previous day Underweight (%)* Overweight (%)* n total
1-2 times/day 21.6 11.3 811 ≥3 times/day 20.5 15.8 1113
5.2.3 Health status of children 0-59 months
Disease and infection, even when it is mild, has serious consequences on nutritional status. Infection leads to nutrient deficiency and nutrient deficiency increases susceptibility to infection. The significance of the effect of infection on nutritional status depends on previous nutritional status, the nature and duration of infection and food intake during the recovery period (Scrimshaw and SanGiovanni, 1997).
FIGURE 18 - MALNUTRITION AND INFECTION CYCLE (TOMKINS AND F. WATSON, 1989)
In this study, for each child 0-59 months, health status was assessed on the basis of whether or not the child had diarrhoea, fever, and cough in the previous two weeks. A score was defined and assigned to each child as follows: a) 5 = if the child had fever, diarrhoea and cough at the same time, b) 4 = if the child had fever or diarrhoea at the same time, c) 3 = if the child had either diarrhoea or fever with cough, d) 2 = if the
Inadequate dietary intake
Disease: - incidence - severity - duration
Weight loss Growth faltering Immunity lowered Mucosal damage
Appetite loss Nutrient loss Malabsorption Altered metabolism
24
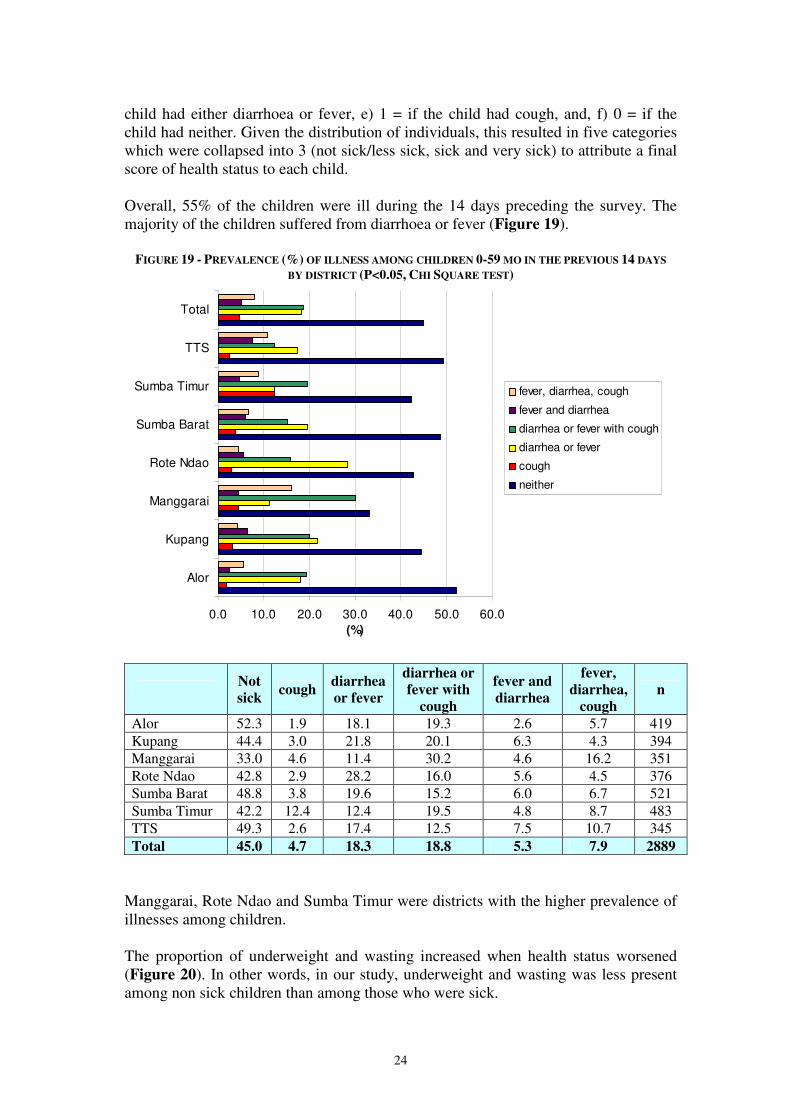
child had either diarrhoea or fever, e) 1 = if the child had cough, and, f) 0 = if the child had neither. Given the distribution of individuals, this resulted in five categories which were collapsed into 3 (not sick/less sick, sick and very sick) to attribute a final score of health status to each child. Overall, 55% of the children were ill during the 14 days preceding the survey. The majority of the children suffered from diarrhoea or fever (Figure 19).
FIGURE 19 - PREVALENCE (%) OF ILLNESS AMONG CHILDREN 0-59 MO IN THE PREVIOUS 14 DAYS
BY DISTRICT (P<0.05, CHI SQUARE TEST)
0.0 10.0 20.0 30.0 40.0 50.0 60.0
Alor
Kupang
Manggarai
Rote Ndao
Sumba Barat
Sumba Timur
TTS
Total
(%)
fever, diarrhea, cough
fever and diarrhea
diarrhea or fever with cough
diarrhea or fever
cough
neither
Not
sick cough
diarrhea
or fever
diarrhea or
fever with
cough
fever and
diarrhea
fever,
diarrhea,
cough
n
Alor 52.3 1.9 18.1 19.3 2.6 5.7 419 Kupang 44.4 3.0 21.8 20.1 6.3 4.3 394 Manggarai 33.0 4.6 11.4 30.2 4.6 16.2 351 Rote Ndao 42.8 2.9 28.2 16.0 5.6 4.5 376 Sumba Barat 48.8 3.8 19.6 15.2 6.0 6.7 521 Sumba Timur 42.2 12.4 12.4 19.5 4.8 8.7 483 TTS 49.3 2.6 17.4 12.5 7.5 10.7 345 Total 45.0 4.7 18.3 18.8 5.3 7.9 2889
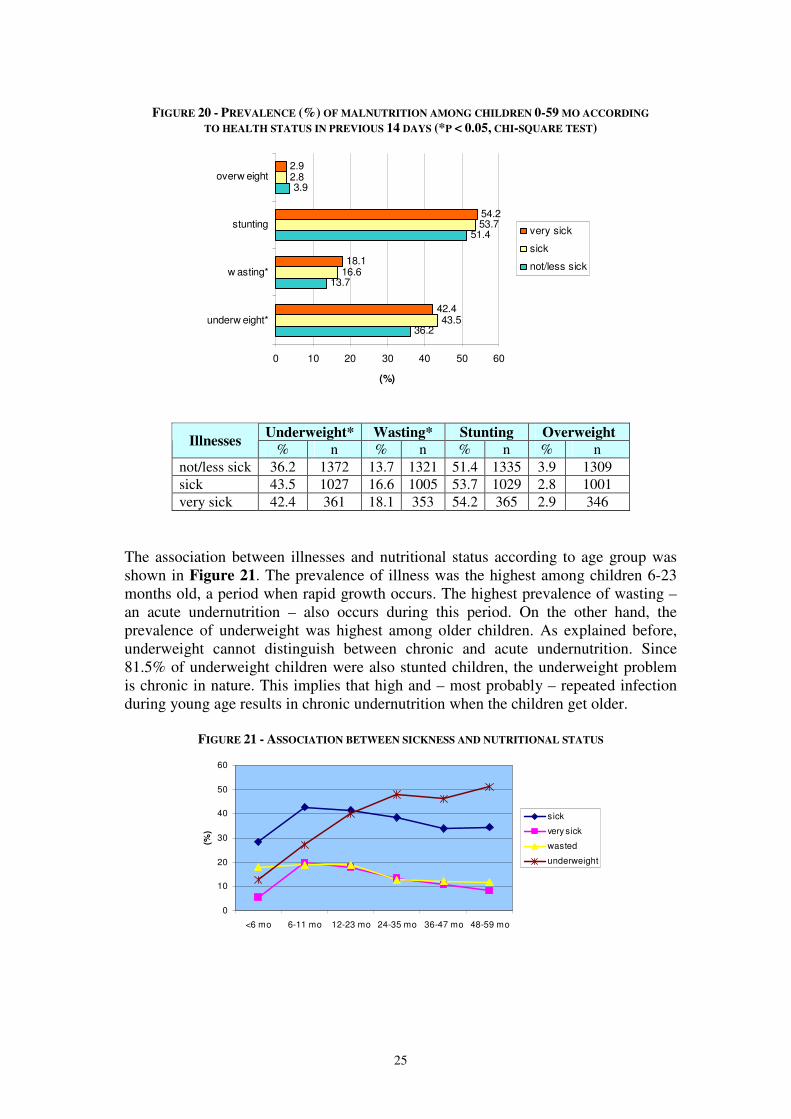
Manggarai, Rote Ndao and Sumba Timur were districts with the higher prevalence of illnesses among children. The proportion of underweight and wasting increased when health status worsened (Figure 20). In other words, in our study, underweight and wasting was less present among non sick children than among those who were sick.
25
FIGURE 20 - PREVALENCE (%) OF MALNUTRITION AMONG CHILDREN 0-59 MO ACCORDING
TO HEALTH STATUS IN PREVIOUS 14 DAYS (*P < 0.05, CHI-SQUARE TEST)
36.2
13.7
51.4
3.9
43.5
16.6
53.7
2.8
42.4
18.1
54.2
2.9
0 10 20 30 40 50 60
underw eight*
w asting*
stunting
overw eight
(%)
very sick
sick
not/less sick
Underweight* Wasting* Stunting Overweight Illnesses
% n % n % n % n not/less sick 36.2 1372 13.7 1321 51.4 1335 3.9 1309 sick 43.5 1027 16.6 1005 53.7 1029 2.8 1001 very sick 42.4 361 18.1 353 54.2 365 2.9 346
The association between illnesses and nutritional status according to age group was shown in Figure 21. The prevalence of illness was the highest among children 6-23 months old, a period when rapid growth occurs. The highest prevalence of wasting – an acute undernutrition – also occurs during this period. On the other hand, the prevalence of underweight was highest among older children. As explained before, underweight cannot distinguish between chronic and acute undernutrition. Since 81.5% of underweight children were also stunted children, the underweight problem is chronic in nature. This implies that high and – most probably – repeated infection during young age results in chronic undernutrition when the children get older.
FIGURE 21 - ASSOCIATION BETWEEN SICKNESS AND NUTRITIONAL STATUS
0
10
20
30
40
50
60
<6 mo 6-11 mo 12-23 mo 24-35 mo 36-47 mo 48-59 mo
(%)
sick
very sick
wasted
underweight
26
5.2.4 Conclusion on food intake and health status
A meal frequency of ≥3 meals per day was associated with a lower prevalence of underweight among children and higher prevalence of overweight among mothers. Rote Ndao had the highest proportion of women and children with less than three meals per day. Illness in previous 14 days was associated with underweight and wasting. The prevalence of illnesses was high particularly among children 0-23 months. 5.3 Underlying determinants of nutrition security
5.3.1 Care practices There are six sets of child care practices namely feeding practices, hygiene practices, health practices, care for women, psycho-social care and food preparation (Engle P., The Care Initiative: Assessment, Analysis and Action to Improve Care for Nutrition.
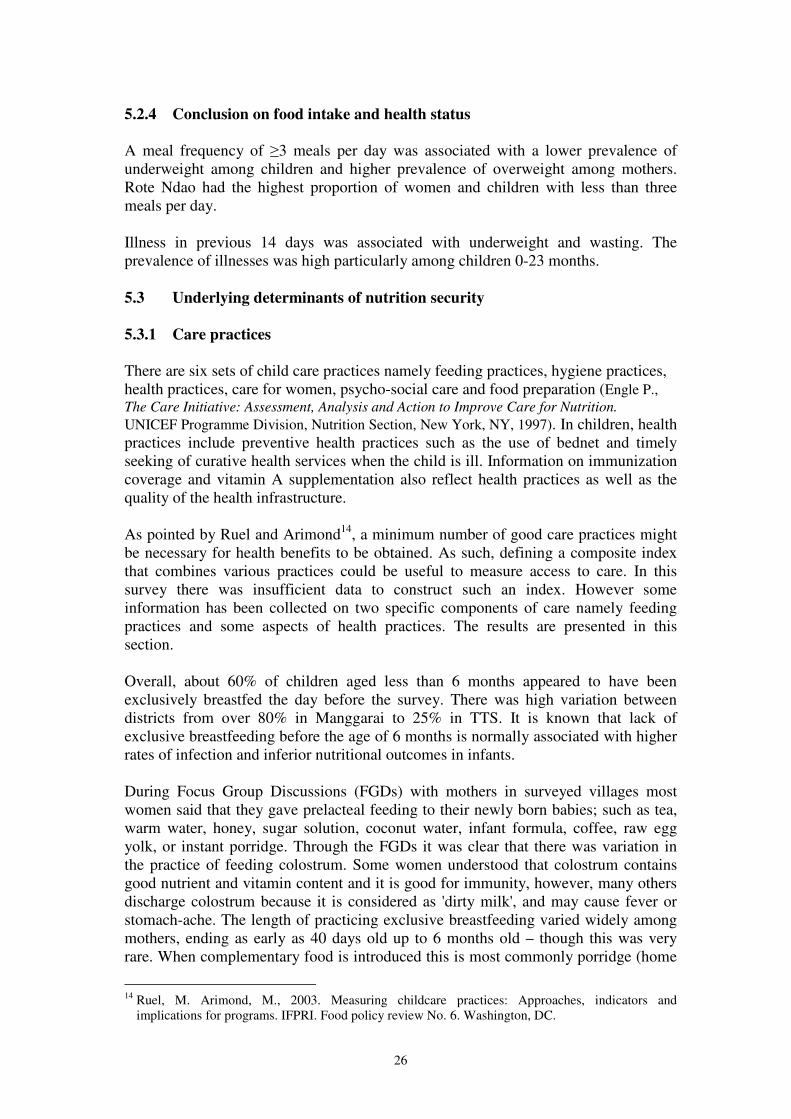
UNICEF Programme Division, Nutrition Section, New York, NY, 1997). In children, health practices include preventive health practices such as the use of bednet and timely seeking of curative health services when the child is ill. Information on immunization coverage and vitamin A supplementation also reflect health practices as well as the quality of the health infrastructure. As pointed by Ruel and Arimond14, a minimum number of good care practices might be necessary for health benefits to be obtained. As such, defining a composite index that combines various practices could be useful to measure access to care. In this survey there was insufficient data to construct such an index. However some information has been collected on two specific components of care namely feeding practices and some aspects of health practices. The results are presented in this section. Overall, about 60% of children aged less than 6 months appeared to have been exclusively breastfed the day before the survey. There was high variation between districts from over 80% in Manggarai to 25% in TTS. It is known that lack of exclusive breastfeeding before the age of 6 months is normally associated with higher rates of infection and inferior nutritional outcomes in infants. During Focus Group Discussions (FGDs) with mothers in surveyed villages most women said that they gave prelacteal feeding to their newly born babies; such as tea, warm water, honey, sugar solution, coconut water, infant formula, coffee, raw egg yolk, or instant porridge. Through the FGDs it was clear that there was variation in the practice of feeding colostrum. Some women understood that colostrum contains good nutrient and vitamin content and it is good for immunity, however, many others discharge colostrum because it is considered as 'dirty milk', and may cause fever or stomach-ache. The length of practicing exclusive breastfeeding varied widely among mothers, ending as early as 40 days old up to 6 months old – though this was very rare. When complementary food is introduced this is most commonly porridge (home
14 Ruel, M. Arimond, M., 2003. Measuring childcare practices: Approaches, indicators and
implications for programs. IFPRI. Food policy review No. 6. Washington, DC.
27
prepared, rice, corn, filtered or not). In addition babies were fed vegetables, banana, biscuits. Almost all FGD participants said that they still breastfeed the child during illness because the babies still need breastmilk and are not able to eat other foods.
FIGURE 22 - FOOD PATTERN AMONG CHILDREN 0 – 23 MONTHS OLD ON THE DAY BEFORE
THE SURVEY
62.5
4.8 1.1
51.0
5.6 1.3
82.4
25.6
7.6
57.9
12.22.9
64.5
21.3
2.7
78.4
15.8
1.0
25.0
2.5 2.3
61.9
12.42.6
27.1
79.0
58.9
38.8
72.2
52.0
8.8
67.4
74.7
36.8
69.4
37.7
30.6
70.2
35.7
13.7
71.1
48.5
60.7
80.0
36.0
29.7
72.8
48.5
0.0
0.0
23.3
4.1
3.7
18.7
0.02.3
10.1
5.3
4.1
44.9
0.02.1
49.1
2.0
1.3
41.2
7.1
2.5
50.0
2.3
2.2
34.9
10.416.1 16.7
6.1
18.528.0
8.84.7 7.6
0.0
14.3 14.54.8 6.4
12.55.9
11.8 9.3 7.115.0 11.6
6.112.7 14.0
0%
20%
40%
60%
80%
100%
<6
mo
6-
11
mo
12-
23
mo
<6
mo
6-
11
mo
12-
23
mo
<6
mo
6-
11
mo
12-
23
mo
<6
mo
6-
11
mo
12-
23
mo
<6
mo
6-
11
mo
12-
23
mo
<6
mo
6-
11
mo
12-
23
mo
<6
mo
6-
11
mo
12-
23
mo
<6
mo
6-
11
mo
12-
23
mo
Alor Kupang Manggarai Rote Ndao Sumba Barat Sumba Timur TTS Total
breastmilk only breastmilk & solid food solid food formula & solid food
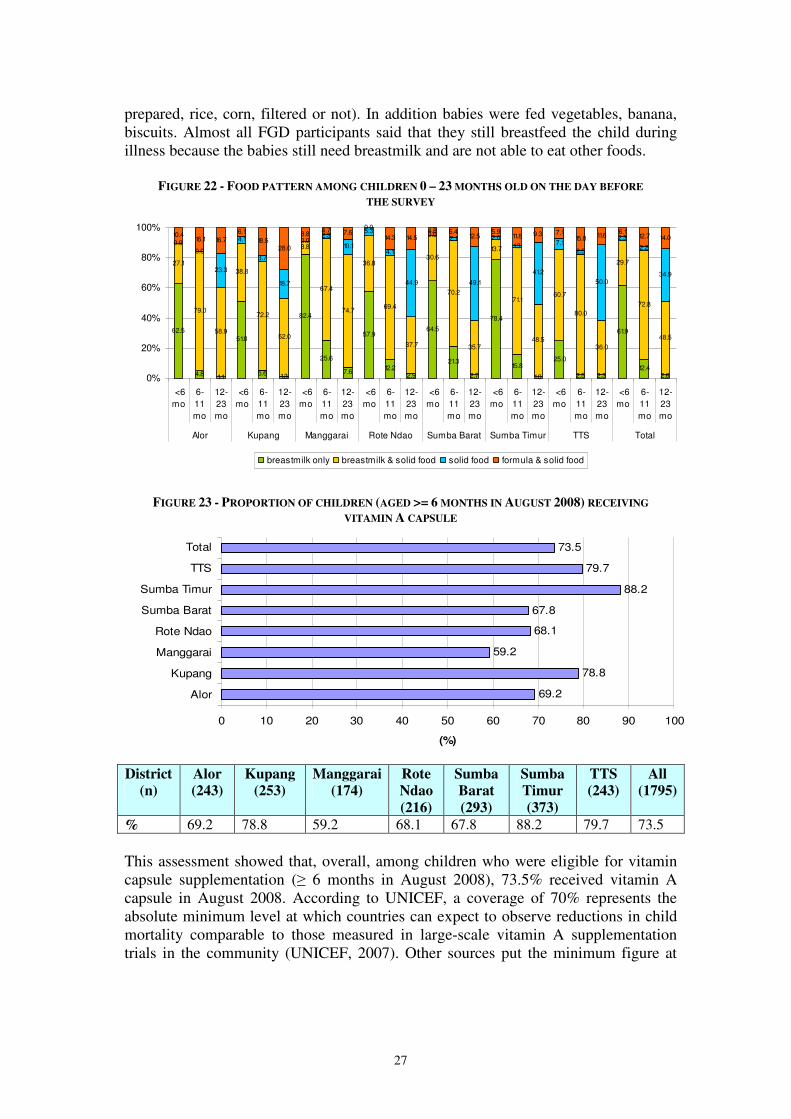
FIGURE 23 - PROPORTION OF CHILDREN (AGED >= 6 MONTHS IN AUGUST 2008) RECEIVING
VITAMIN A CAPSULE
69.2
78.8
59.2
68.1
67.8
88.2
79.7
73.5
0 10 20 30 40 50 60 70 80 90 100
Alor
Kupang
Manggarai
Rote Ndao
Sumba Barat
Sumba Timur
TTS
Total
(%)
District
(n)
Alor
(243)
Kupang
(253)
Manggarai
(174)
Rote
Ndao
(216)
Sumba
Barat
(293)
Sumba
Timur
(373)
TTS
(243)
All
(1795)
% 69.2 78.8 59.2 68.1 67.8 88.2 79.7 73.5 This assessment showed that, overall, among children who were eligible for vitamin capsule supplementation (≥ 6 months in August 2008), 73.5% received vitamin A capsule in August 2008. According to UNICEF, a coverage of 70% represents the absolute minimum level at which countries can expect to observe reductions in child mortality comparable to those measured in large-scale vitamin A supplementation trials in the community (UNICEF, 2007). Other sources put the minimum figure at
28
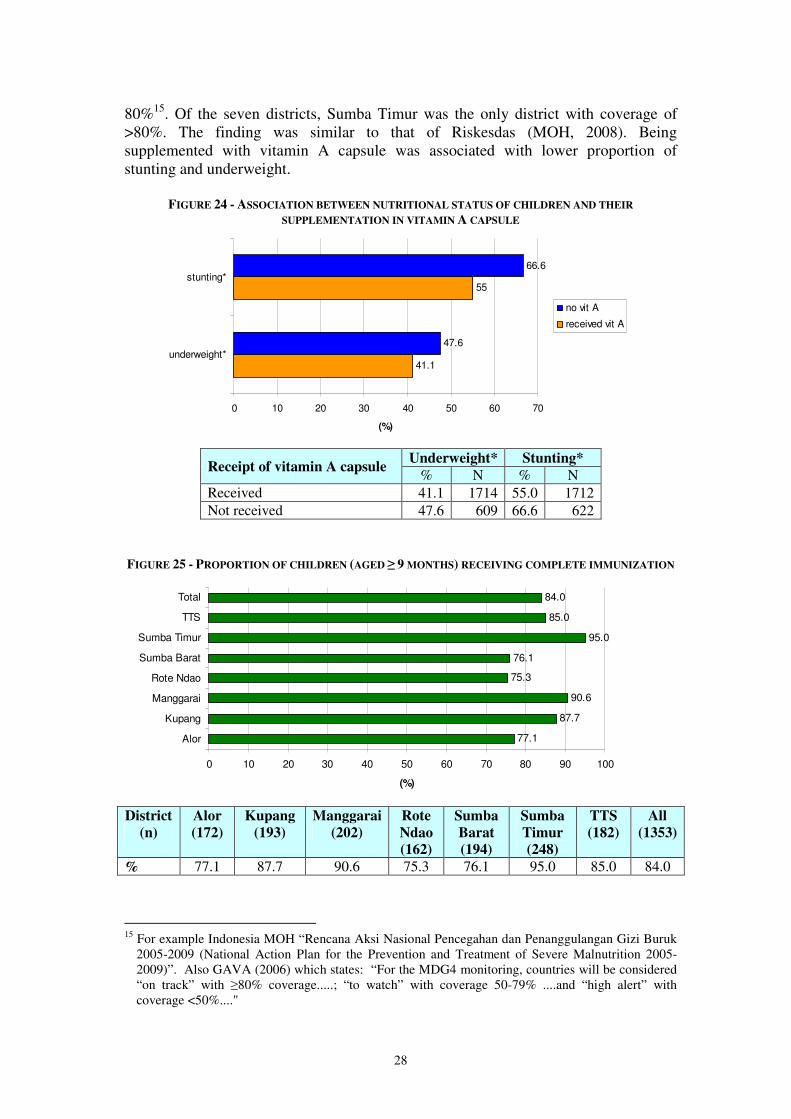
80%15. Of the seven districts, Sumba Timur was the only district with coverage of >80%. The finding was similar to that of Riskesdas (MOH, 2008). Being supplemented with vitamin A capsule was associated with lower proportion of stunting and underweight.
FIGURE 24 - ASSOCIATION BETWEEN NUTRITIONAL STATUS OF CHILDREN AND THEIR
SUPPLEMENTATION IN VITAMIN A CAPSULE
41.1
55
47.6
66.6
0 10 20 30 40 50 60 70
underweight*
stunting*
(%)
no vit A
received vit A
Underweight* Stunting*
Receipt of vitamin A capsule % N % N
Received 41.1 1714 55.0 1712 Not received 47.6 609 66.6 622
FIGURE 25 - PROPORTION OF CHILDREN (AGED ≥ 9 MONTHS) RECEIVING COMPLETE IMMUNIZATION
77.1
87.7
90.6
75.3
76.1
95.0
85.0
84.0
0 10 20 30 40 50 60 70 80 90 100
Alor
Kupang
Manggarai
Rote Ndao
Sumba Barat
Sumba Timur
TTS
Total
(%)
District
(n)
Alor
(172)
Kupang
(193)
Manggarai
(202)
Rote
Ndao
(162)
Sumba
Barat
(194)
Sumba
Timur
(248)
TTS
(182)
All
(1353)
% 77.1 87.7 90.6 75.3 76.1 95.0 85.0 84.0
15 For example Indonesia MOH “Rencana Aksi Nasional Pencegahan dan Penanggulangan Gizi Buruk
2005-2009 (National Action Plan for the Prevention and Treatment of Severe Malnutrition 2005-2009)”. Also GAVA (2006) which states: “For the MDG4 monitoring, countries will be considered “on track” with ≥80% coverage.....; “to watch” with coverage 50-79% ....and “high alert” with coverage <50%...."
29
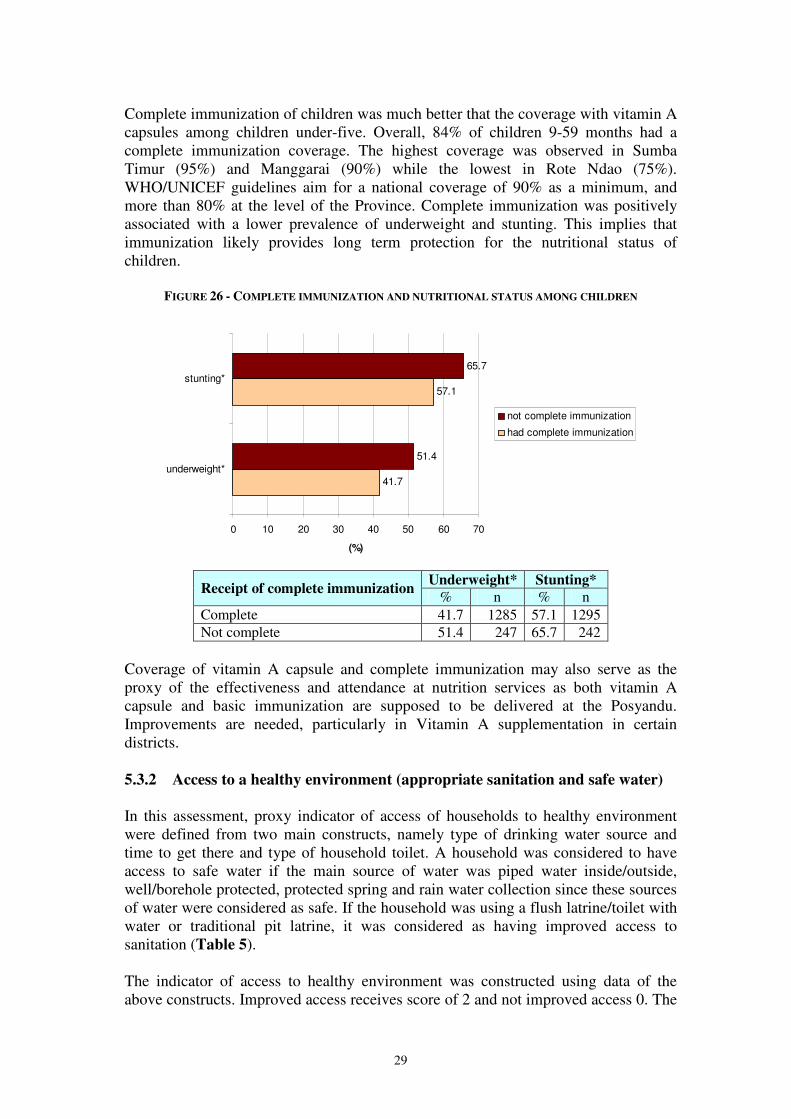
Complete immunization of children was much better that the coverage with vitamin A capsules among children under-five. Overall, 84% of children 9-59 months had a complete immunization coverage. The highest coverage was observed in Sumba Timur (95%) and Manggarai (90%) while the lowest in Rote Ndao (75%). WHO/UNICEF guidelines aim for a national coverage of 90% as a minimum, and more than 80% at the level of the Province. Complete immunization was positively associated with a lower prevalence of underweight and stunting. This implies that immunization likely provides long term protection for the nutritional status of children.
FIGURE 26 - COMPLETE IMMUNIZATION AND NUTRITIONAL STATUS AMONG CHILDREN
41.7
57.1
51.4
65.7
0 10 20 30 40 50 60 70
underweight*
stunting*
(%)
not complete immunization
had complete immunization
Underweight* Stunting*
Receipt of complete immunization % n % n
Complete 41.7 1285 57.1 1295 Not complete 51.4 247 65.7 242
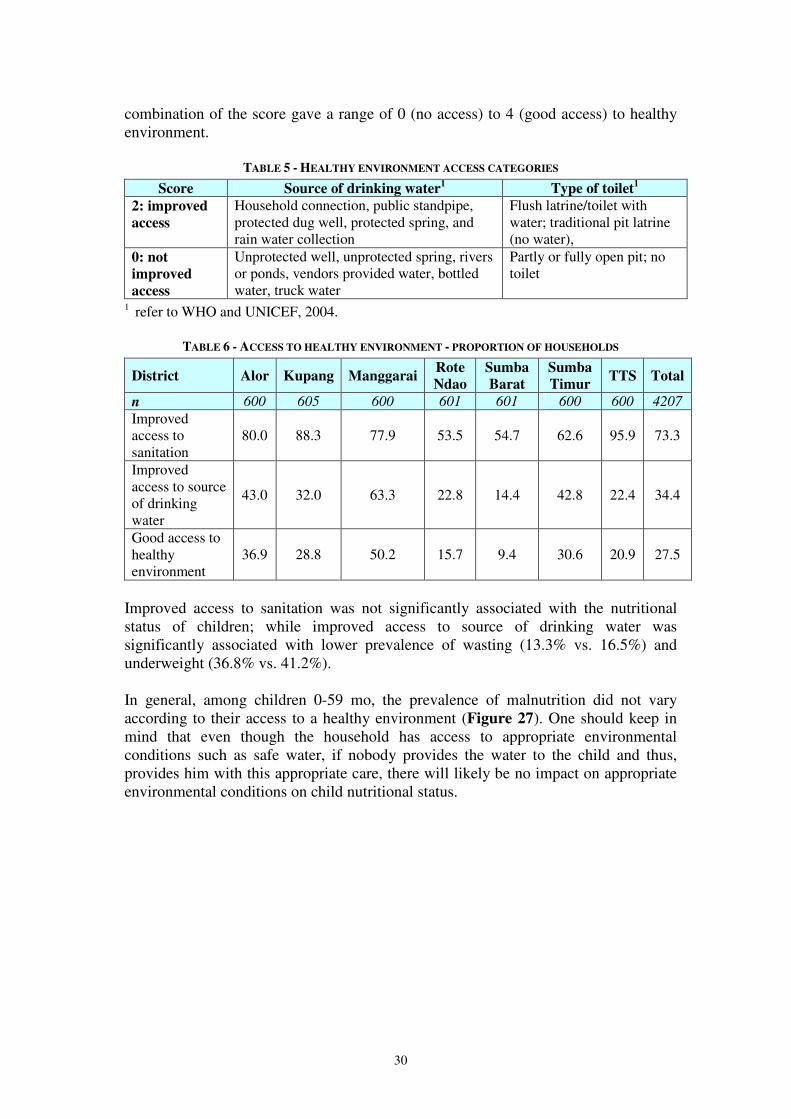
Coverage of vitamin A capsule and complete immunization may also serve as the proxy of the effectiveness and attendance at nutrition services as both vitamin A capsule and basic immunization are supposed to be delivered at the Posyandu. Improvements are needed, particularly in Vitamin A supplementation in certain districts. 5.3.2 Access to a healthy environment (appropriate sanitation and safe water) In this assessment, proxy indicator of access of households to healthy environment were defined from two main constructs, namely type of drinking water source and time to get there and type of household toilet. A household was considered to have access to safe water if the main source of water was piped water inside/outside, well/borehole protected, protected spring and rain water collection since these sources of water were considered as safe. If the household was using a flush latrine/toilet with water or traditional pit latrine, it was considered as having improved access to sanitation (Table 5). The indicator of access to healthy environment was constructed using data of the above constructs. Improved access receives score of 2 and not improved access 0. The
30
combination of the score gave a range of 0 (no access) to 4 (good access) to healthy environment.
TABLE 5 - HEALTHY ENVIRONMENT ACCESS CATEGORIES
Score Source of drinking water1 Type of toilet
1
2: improved
access
Household connection, public standpipe, protected dug well, protected spring, and rain water collection
Flush latrine/toilet with water; traditional pit latrine (no water),
0: not
improved
access
Unprotected well, unprotected spring, rivers or ponds, vendors provided water, bottled water, truck water
Partly or fully open pit; no toilet
1 refer to WHO and UNICEF, 2004.
TABLE 6 - ACCESS TO HEALTHY ENVIRONMENT - PROPORTION OF HOUSEHOLDS
District Alor Kupang Manggarai Rote
Ndao
Sumba
Barat
Sumba
Timur TTS Total
n 600 605 600 601 601 600 600 4207
Improved access to sanitation
80.0 88.3 77.9 53.5 54.7 62.6 95.9 73.3
Improved access to source of drinking water
43.0 32.0 63.3 22.8 14.4 42.8 22.4 34.4
Good access to healthy environment
36.9 28.8 50.2 15.7 9.4 30.6 20.9 27.5
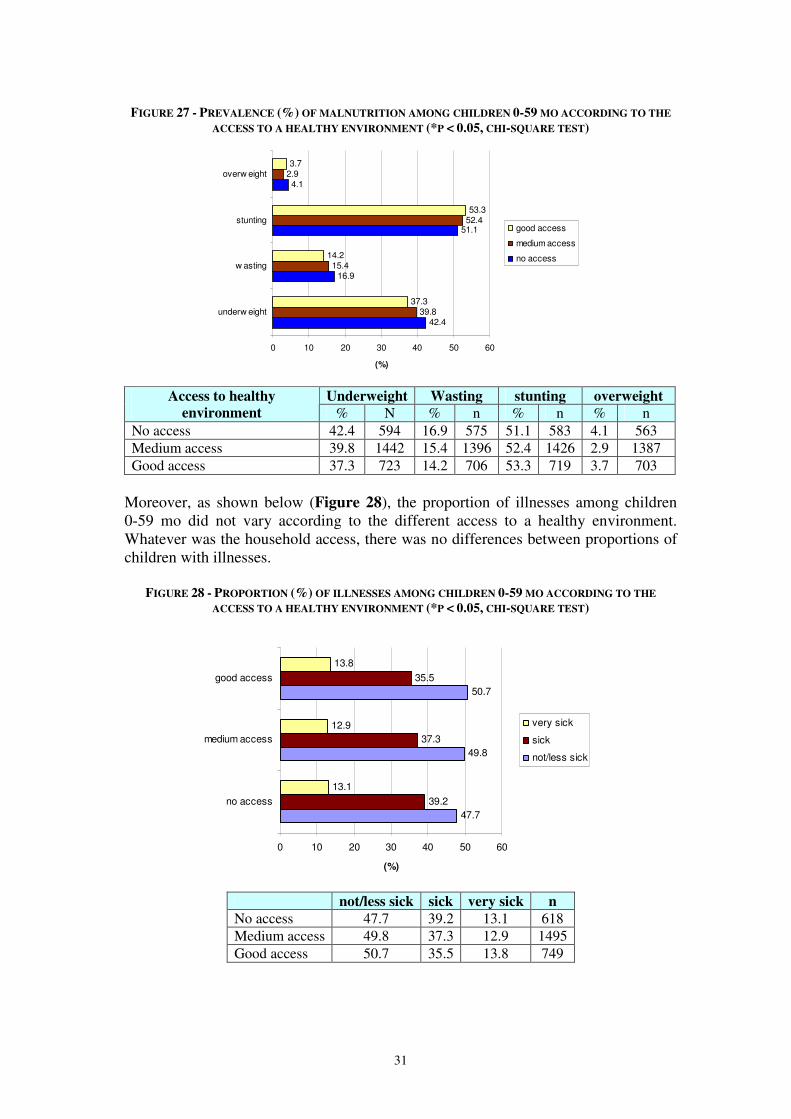
Improved access to sanitation was not significantly associated with the nutritional status of children; while improved access to source of drinking water was significantly associated with lower prevalence of wasting (13.3% vs. 16.5%) and underweight (36.8% vs. 41.2%). In general, among children 0-59 mo, the prevalence of malnutrition did not vary according to their access to a healthy environment (Figure 27). One should keep in mind that even though the household has access to appropriate environmental conditions such as safe water, if nobody provides the water to the child and thus, provides him with this appropriate care, there will likely be no impact on appropriate environmental conditions on child nutritional status.
31
FIGURE 27 - PREVALENCE (%) OF MALNUTRITION AMONG CHILDREN 0-59 MO ACCORDING TO THE
ACCESS TO A HEALTHY ENVIRONMENT (*P < 0.05, CHI-SQUARE TEST)
42.4
16.9
51.1
4.1
39.8
15.4
52.4
2.9
37.3
14.2
53.3
3.7
0 10 20 30 40 50 60
underw eight
w asting
stunting
overw eight
(%)
good access
medium access
no access
Underweight Wasting stunting overweight Access to healthy
environment % N % n % n % n No access 42.4 594 16.9 575 51.1 583 4.1 563 Medium access 39.8 1442 15.4 1396 52.4 1426 2.9 1387 Good access 37.3 723 14.2 706 53.3 719 3.7 703
Moreover, as shown below (Figure 28), the proportion of illnesses among children 0-59 mo did not vary according to the different access to a healthy environment. Whatever was the household access, there was no differences between proportions of children with illnesses.
FIGURE 28 - PROPORTION (%) OF ILLNESSES AMONG CHILDREN 0-59 MO ACCORDING TO THE
ACCESS TO A HEALTHY ENVIRONMENT (*P < 0.05, CHI-SQUARE TEST)
47.7
49.8
50.7
39.2
37.3
35.5
13.1
12.9
13.8
0 10 20 30 40 50 60
no access
medium access
good access
(%)
very sick
sick
not/less sick
not/less sick sick very sick n
No access 47.7 39.2 13.1 618 Medium access 49.8 37.3 12.9 1495 Good access 50.7 35.5 13.8 749

32
Figure 29 shows that a better access to a healthy environment was significantly associated with a better nutritional outcome among caregivers. FIGURE 29 - PREVALENCE (%) OF MALNUTRITION AMONG CAREGIVERS ACCORDING TO THE ACCESS
TO A HEALTHY ENVIRONMENT (*P < 0.05, CHI-SQUARE TEST)
24.9
6.6
20.4
13.8
16.9
19.7
0 5 10 15 20 25 30
underw eight
overw eight
(%)
good access
medium access
no access
underweight overweight n
No access 24.9 6.6 393 Medium access 20.4 13.8 988 Good access 16.9 19.7 503
Proximity to source of drinking water appears to have positive association with nutritional status of children. Short distance to source of drinking water was significantly associated (P < 0.05) with lower prevalence of stunting (50.9% vs. 56%), wasting (13.9% vs. 18.9%) and underweight (35.9% vs. 47.7%). A household was considered as having short distance to drinking water source if the time to get to the site was less than 30 minutes back and forth. Overall, about two third of the households had short distance to source of drinking water source; the lowest was in Sumba Barat and the highest Sumba Timur.
TABLE 7 - IMPROVED DISTANCE TO SOURCE OF DRINKING WATER - PROPORTION OF HOUSEHOLDS
District Alor Kupang Manggarai Rote
Ndao
Sumba
Barat
Sumba
Timur TTS Total
n 600 605 600 601 601 600 600 4207
Short distance to drinking water source
75.4 78.0 82.7 62.0 42.8 84.6 45.7 67.4
5.3.3 Household food security The relationship between household food security and nutritional status was measured by comparing anthropometric indices for children and mothers against the following household food security indicators:
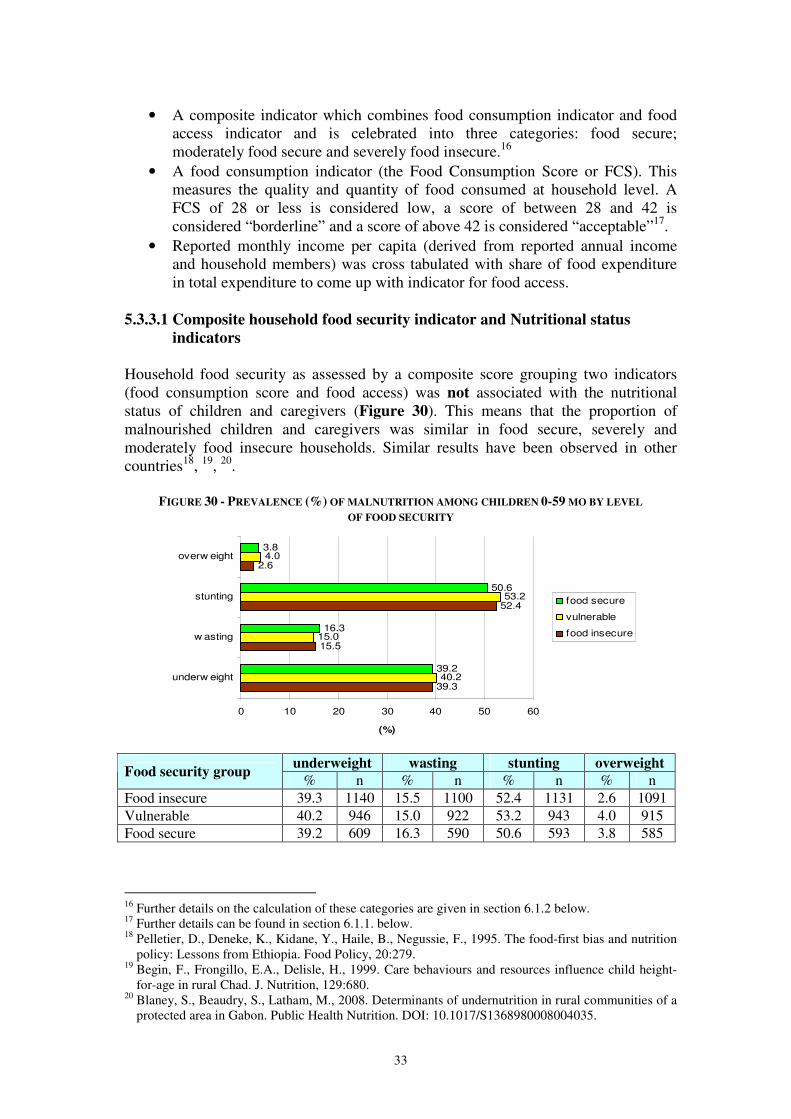
33
• A composite indicator which combines food consumption indicator and food access indicator and is celebrated into three categories: food secure; moderately food secure and severely food insecure.16
• A food consumption indicator (the Food Consumption Score or FCS). This measures the quality and quantity of food consumed at household level. A FCS of 28 or less is considered low, a score of between 28 and 42 is considered “borderline” and a score of above 42 is considered “acceptable”17.
• Reported monthly income per capita (derived from reported annual income and household members) was cross tabulated with share of food expenditure in total expenditure to come up with indicator for food access.
5.3.3.1 Composite household food security indicator and Nutritional status
indicators Household food security as assessed by a composite score grouping two indicators (food consumption score and food access) was not associated with the nutritional status of children and caregivers (Figure 30). This means that the proportion of malnourished children and caregivers was similar in food secure, severely and moderately food insecure households. Similar results have been observed in other countries18, 19, 20.
FIGURE 30 - PREVALENCE (%) OF MALNUTRITION AMONG CHILDREN 0-59 MO BY LEVEL
OF FOOD SECURITY
39.3
15.5
52.4
2.6
40.2
15.0
53.2
4.0
39.2
16.3
50.6
3.8
0 10 20 30 40 50 60
underw eight
w asting
stunting
overw eight
(%)
food secure
vulnerable
food insecure
underweight wasting stunting overweight
Food security group % n % n % n % n
Food insecure 39.3 1140 15.5 1100 52.4 1131 2.6 1091 Vulnerable 40.2 946 15.0 922 53.2 943 4.0 915 Food secure 39.2 609 16.3 590 50.6 593 3.8 585
16 Further details on the calculation of these categories are given in section 6.1.2 below. 17 Further details can be found in section 6.1.1. below. 18 Pelletier, D., Deneke, K., Kidane, Y., Haile, B., Negussie, F., 1995. The food-first bias and nutrition
policy: Lessons from Ethiopia. Food Policy, 20:279. 19 Begin, F., Frongillo, E.A., Delisle, H., 1999. Care behaviours and resources influence child height-
for-age in rural Chad. J. Nutrition, 129:680. 20 Blaney, S., Beaudry, S., Latham, M., 2008. Determinants of undernutrition in rural communities of a
protected area in Gabon. Public Health Nutrition. DOI: 10.1017/S1368980008004035.
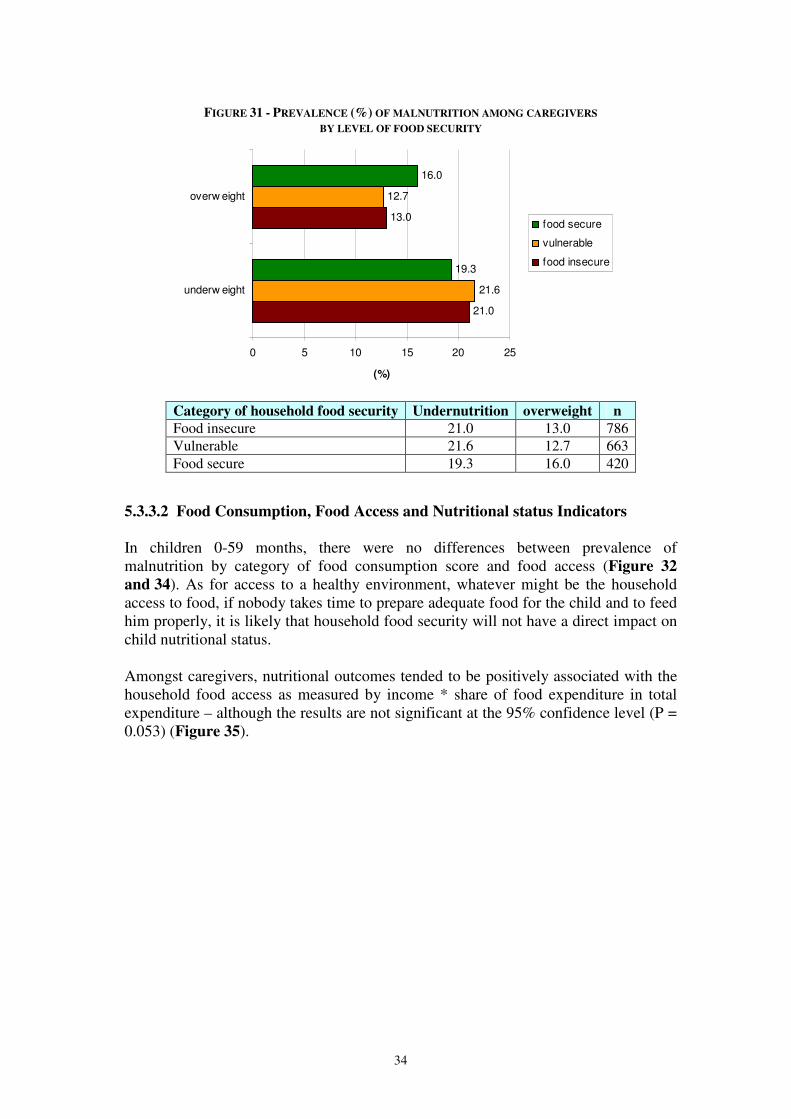
34
FIGURE 31 - PREVALENCE (%) OF MALNUTRITION AMONG CAREGIVERS
BY LEVEL OF FOOD SECURITY
21.0
13.0
21.6
12.7
19.3
16.0
0 5 10 15 20 25
underw eight
overw eight
(%)
food secure
vulnerable
food insecure
Category of household food security Undernutrition overweight n
Food insecure 21.0 13.0 786 Vulnerable 21.6 12.7 663 Food secure 19.3 16.0 420
5.3.3.2 Food Consumption, Food Access and Nutritional status Indicators In children 0-59 months, there were no differences between prevalence of malnutrition by category of food consumption score and food access (Figure 32
and 34). As for access to a healthy environment, whatever might be the household access to food, if nobody takes time to prepare adequate food for the child and to feed him properly, it is likely that household food security will not have a direct impact on child nutritional status. Amongst caregivers, nutritional outcomes tended to be positively associated with the household food access as measured by income * share of food expenditure in total expenditure – although the results are not significant at the 95% confidence level (P = 0.053) (Figure 35).
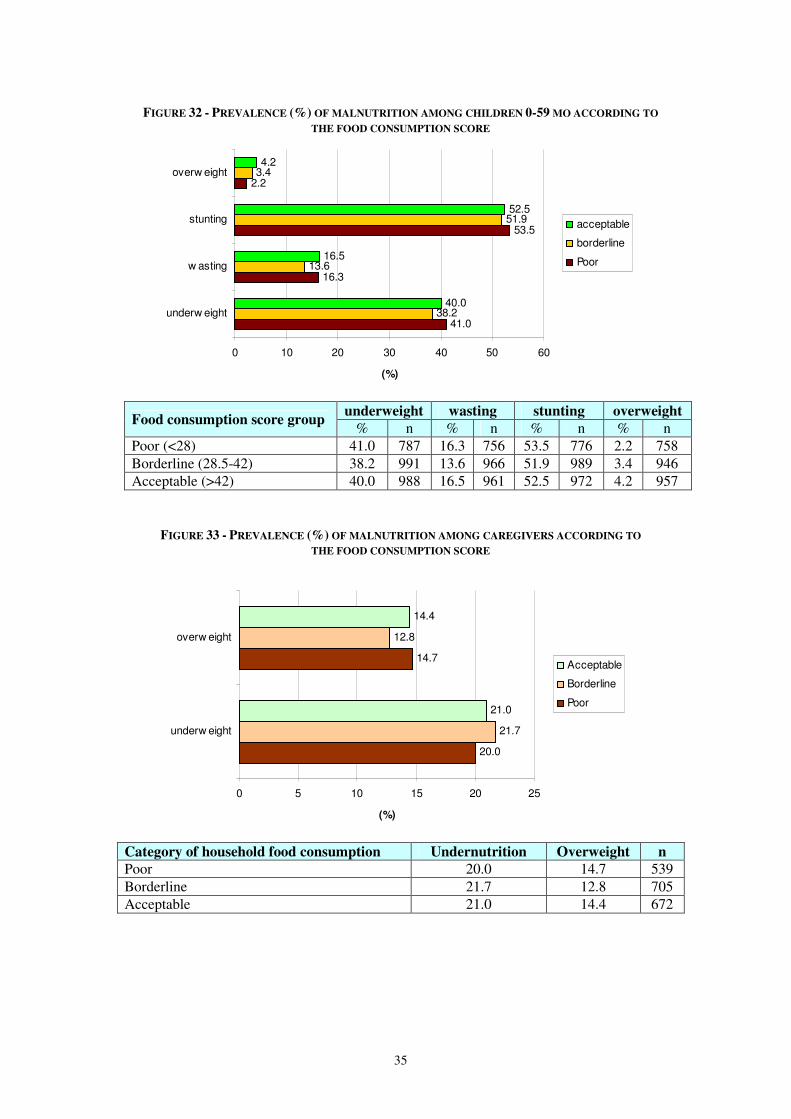
35
FIGURE 32 - PREVALENCE (%) OF MALNUTRITION AMONG CHILDREN 0-59 MO ACCORDING TO
THE FOOD CONSUMPTION SCORE
41.0
16.3
53.5
2.2
38.2
13.6
51.9
3.4
40.0
16.5
52.5
4.2
0 10 20 30 40 50 60
underw eight
w asting
stunting
overw eight
(%)
acceptable
borderline
Poor
underweight wasting stunting overweight
Food consumption score group % n % n % n % n
Poor (<28) 41.0 787 16.3 756 53.5 776 2.2 758 Borderline (28.5-42) 38.2 991 13.6 966 51.9 989 3.4 946 Acceptable (>42) 40.0 988 16.5 961 52.5 972 4.2 957
FIGURE 33 - PREVALENCE (%) OF MALNUTRITION AMONG CAREGIVERS ACCORDING TO
THE FOOD CONSUMPTION SCORE
20.0
14.7
21.7
12.8
21.0
14.4
0 5 10 15 20 25
underw eight
overw eight
(%)
Acceptable
Borderline
Poor
Category of household food consumption Undernutrition Overweight n
Poor 20.0 14.7 539 Borderline 21.7 12.8 705 Acceptable 21.0 14.4 672
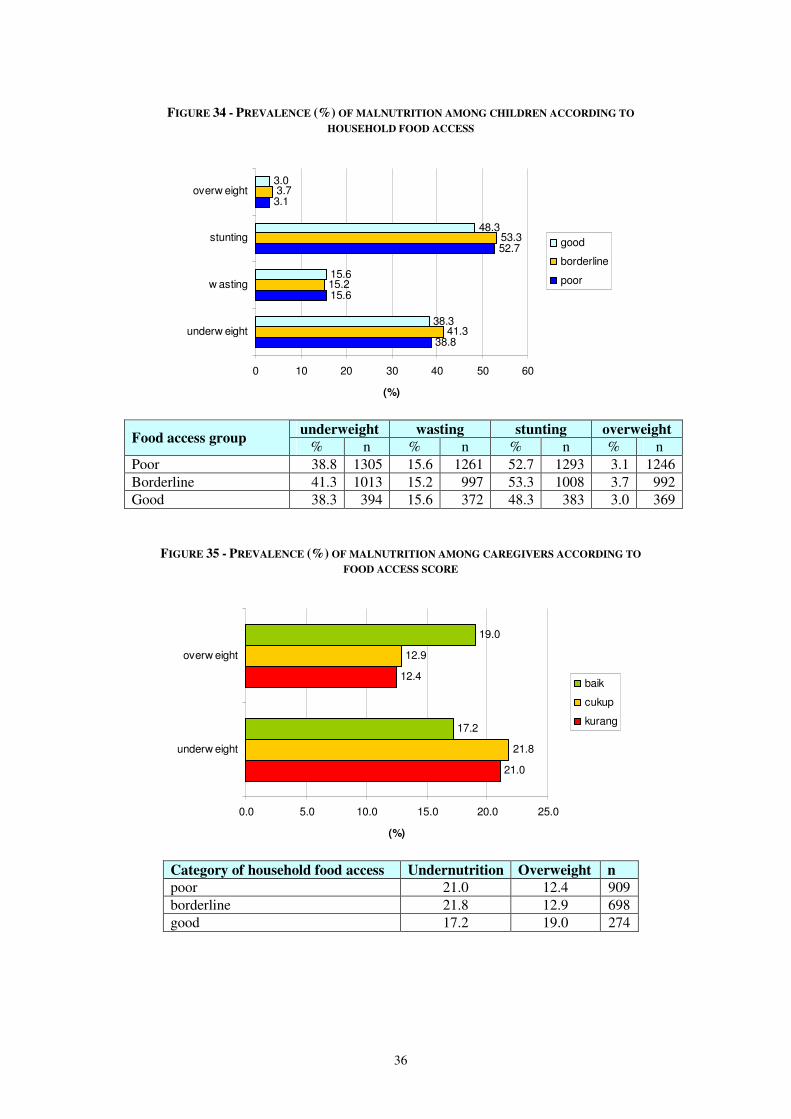
36
FIGURE 34 - PREVALENCE (%) OF MALNUTRITION AMONG CHILDREN ACCORDING TO
HOUSEHOLD FOOD ACCESS
38.8
15.6
52.7
3.1
41.3
15.2
53.3
3.7
38.3
15.6
48.3
3.0
0 10 20 30 40 50 60
underw eight
w asting
stunting
overw eight
(%)
good
borderline
poor
underweight wasting stunting overweight
Food access group % n % n % n % n
Poor 38.8 1305 15.6 1261 52.7 1293 3.1 1246 Borderline 41.3 1013 15.2 997 53.3 1008 3.7 992 Good 38.3 394 15.6 372 48.3 383 3.0 369
FIGURE 35 - PREVALENCE (%) OF MALNUTRITION AMONG CAREGIVERS ACCORDING TO
FOOD ACCESS SCORE
21.0
12.4
21.8
12.9
17.2
19.0
0.0 5.0 10.0 15.0 20.0 25.0
underw eight
overw eight
(%)
baik
cukup
kurang
Category of household food access Undernutrition Overweight n
poor 21.0 12.4 909 borderline 21.8 12.9 698 good 17.2 19.0 274
37
5.3.4 Conclusion on the relationship between the underlying determinants and
nutritional status
Child care is recognized as a determinant of nutritional status of under- 5 children. This study investigated a few specific aspects of care. Results have shown that breastfeeding practices appear to be related to good nutritional status. Among children below six-months, exclusive breastfeeding should be promoted, protected and encouraged given the fact that it is the perfect food for the child and given its well-known benefits for child health, growth and development. Above six months, breastfeeding should be continued along with the introduction of appropriate and timely complementary foods. Vitamin A supplementation and immunisation coverage also appear to be positively associated with a good nutritional status. Protecting children against preventable diseases (through immunization) and common infections (though vitamin A supplementation) is beneficial for nutritional status. Access to healthy environment appears to not be associated with child nutritional status. On the other hand in women it seems that a better access was beneficial for their nutritional status. Short distance to source of drinking water seems to be positive for the nutritional status of children. As expected, in NTT province, household food security seems to not be associated with child nutritional status – and similar results have been observed in other countries21, 22, 23. Amongst caregivers, nutritional outcomes tended to be positively associated with the household food access as measured by income * share of food expenditure in total expenditure – although the results are not significant at the 95% confidence level. Care practices, dietary intake as well as access to health services were not adequately assessed in this survey. Therefore insofar as they relate to the underlying causes of malnutrition in women and children, the survey results should be seen as partial and suggestive as opposed to comprehensive and unequivocal. Further work is necessary to corroborate the findings and generate additional conclusions.
21 Pelletier, D., Deneke, K., Kidane, Y., Haile, B., Negussie, F., 1995. The food-first bias and nutrition
policy: Lessons from Ethiopia. Food Policy, 20:279. 22 Begin, F., Frongillo, E.A., Delisle, H., 1999. Care behaviours and resources influence child height-
for-age in rural Chad. J. Nutrition, 129:680. 23 Blaney, S., Beaudry, S., Latham, M., 2008. Determinants of undernutrition in rural communities of a
protected area in Gabon. Public Health Nutrition. DOI: 10.1017/S1368980008004035.
38
6. FOOD SECURITY: STATUS, IMMEDIATE AND UNDERLYING
CAUSES
6.1. Estimating levels of household food security in the seven districts
Food security is a complex concept which cannot be measured by one single indicator. The different facets of food security can be captured though use of a number of indicators:
1. The Food Consumption Score (FCS) gives a “snapshot” of current food security status by measuring the quality and quantity of food consumed at household level.
2. Access to food was determined using two proxy indicators: (a) the share of
food expenditure in total expenditure over a six month period; and (b) reported monthly income per capita.
3. The FCS and the food access result above were cross-tabulated to estimate the
number of food insecure households.
4. The Reduced Coping Strategy Index (RCSI) is used to identify which livelihood groups struggle the most to obtain food.
The following section describes the household food security situation according to these different measures. 6.1.1 Food consumption score Household food consumption was calculated using a proxy indicator - the Food Consumption Score (FCS). The FCS is a composite score based on dietary frequency, food diversity and relative nutrition importance of different food groups. It is considered an adequate proxy indicator of current food security because it captures several elements of food access and food utilization (consumption). Dietary diversity is the number of individual foods or food groups consumed over the past 7 days. Food frequency is the number of days (in the past 7 days) that a specific food item has been consumed by a household. Household food consumption is the consumption pattern (frequency * diversity) of households over the past seven days. The actual foods consumed are given a weight according to their nutritional value and these weights are then summed to derive an overall score. The FCS was calculated following the procedure described in WFP Emergency Food Security Assessment Handbook (January 2009). First, the frequency of household intake according of food was summed up to a specified group. The food grouping is as follows: (1) staple group consists of maize, rice, cassava, potatoes, bread/biscuit, other cereals/tubers and noodle; (2) pulses group consists of beans/lentils/nuts; (3) vegetable group consists of cassava leaves and other vegetables; (4) fruit group; (5) meat and fish group consists of fish and other aquatic animals, meat and egg; (6) milk group; (7) sugar group consists of sugar, jam, honey; (8) oil/fat group; and (9)
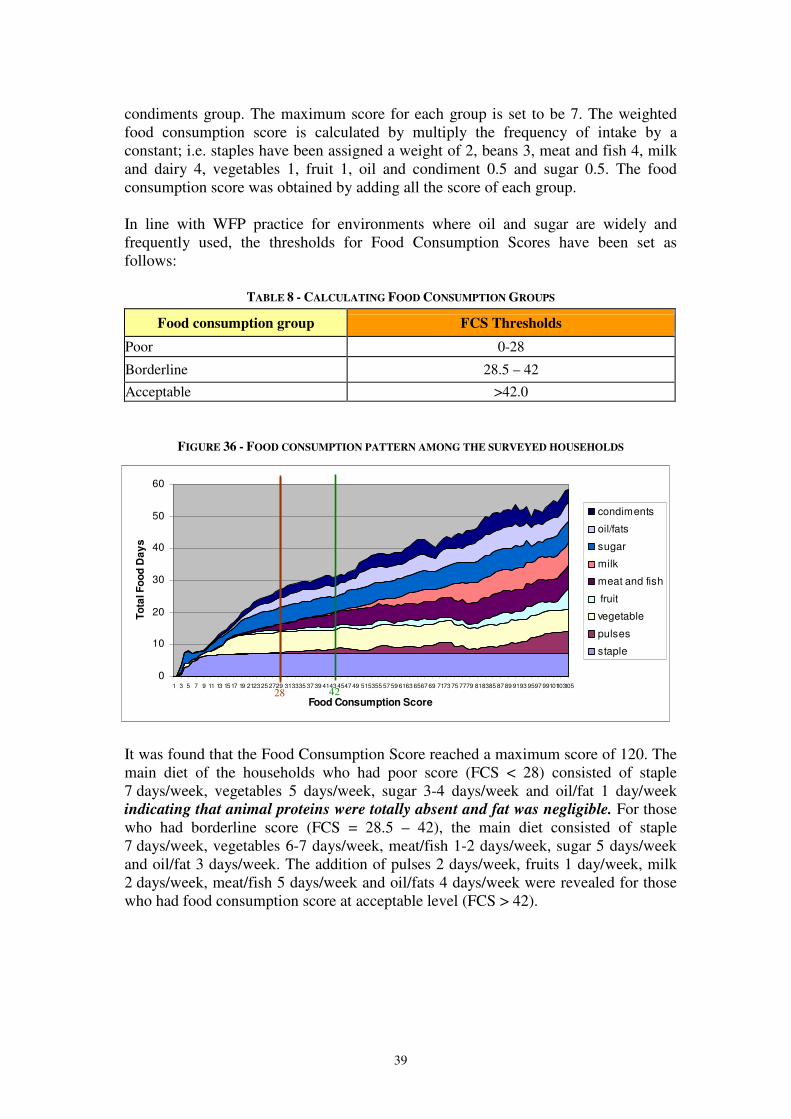
39
condiments group. The maximum score for each group is set to be 7. The weighted food consumption score is calculated by multiply the frequency of intake by a constant; i.e. staples have been assigned a weight of 2, beans 3, meat and fish 4, milk and dairy 4, vegetables 1, fruit 1, oil and condiment 0.5 and sugar 0.5. The food consumption score was obtained by adding all the score of each group. In line with WFP practice for environments where oil and sugar are widely and frequently used, the thresholds for Food Consumption Scores have been set as follows:
TABLE 8 - CALCULATING FOOD CONSUMPTION GROUPS
Food consumption group FCS Thresholds
Poor 0-28
Borderline 28.5 – 42
Acceptable >42.0
FIGURE 36 - FOOD CONSUMPTION PATTERN AMONG THE SURVEYED HOUSEHOLDS
It was found that the Food Consumption Score reached a maximum score of 120. The main diet of the households who had poor score (FCS < 28) consisted of staple 7 days/week, vegetables 5 days/week, sugar 3-4 days/week and oil/fat 1 day/week indicating that animal proteins were totally absent and fat was negligible. For those who had borderline score (FCS = 28.5 – 42), the main diet consisted of staple 7 days/week, vegetables 6-7 days/week, meat/fish 1-2 days/week, sugar 5 days/week and oil/fat 3 days/week. The addition of pulses 2 days/week, fruits 1 day/week, milk 2 days/week, meat/fish 5 days/week and oil/fats 4 days/week were revealed for those who had food consumption score at acceptable level (FCS > 42).
0
10
20
30
40
50
60
1 3 5 7 9 11 13 15 17 19 2123 25 2729 313335 37 39 4143 4547 49 515355 57 59 6163 6567 69 7173 75 7779 818385 87 89 9193 9597 99101103105
Food Consumption Score
To
tal F
oo
d D
ay
s
condiments
oil/fats
sugar
milk
meat and fish
fruit
vegetable
pulses
staple
28 42
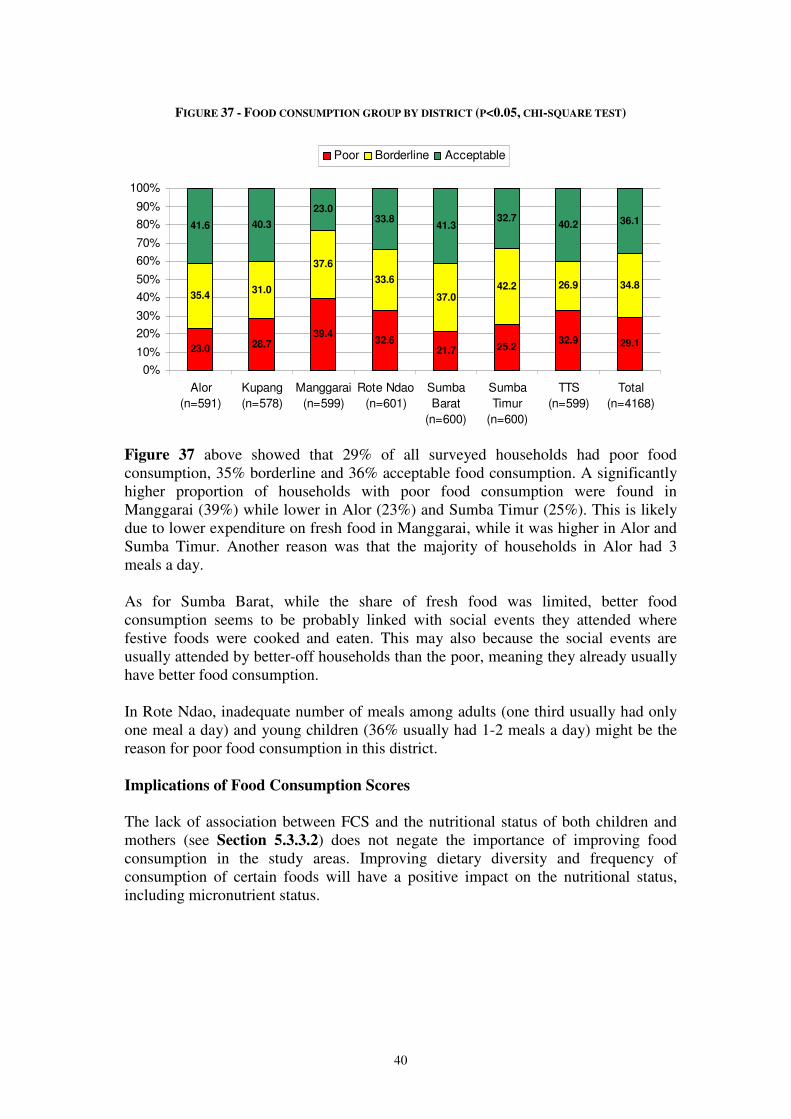
40
FIGURE 37 - FOOD CONSUMPTION GROUP BY DISTRICT (P<0.05, CHI-SQUARE TEST)
23.0 28.739.4
32.621.7 25.2
32.9 29.1
35.431.0
37.6
33.6
37.042.2 26.9 34.8
41.6 40.3
23.033.8
41.332.7
40.2 36.1
0%
10%
20%
30%
40%
50%
60%
70%
80%
90%
100%
Alor
(n=591)
Kupang
(n=578)
Manggarai
(n=599)
Rote Ndao
(n=601)
Sumba
Barat
(n=600)
Sumba
Timur
(n=600)
TTS
(n=599)
Total
(n=4168)
Poor Borderline Acceptable
Figure 37 above showed that 29% of all surveyed households had poor food consumption, 35% borderline and 36% acceptable food consumption. A significantly higher proportion of households with poor food consumption were found in Manggarai (39%) while lower in Alor (23%) and Sumba Timur (25%). This is likely due to lower expenditure on fresh food in Manggarai, while it was higher in Alor and Sumba Timur. Another reason was that the majority of households in Alor had 3 meals a day. As for Sumba Barat, while the share of fresh food was limited, better food consumption seems to be probably linked with social events they attended where festive foods were cooked and eaten. This may also because the social events are usually attended by better-off households than the poor, meaning they already usually have better food consumption. In Rote Ndao, inadequate number of meals among adults (one third usually had only one meal a day) and young children (36% usually had 1-2 meals a day) might be the reason for poor food consumption in this district.
Implications of Food Consumption Scores
The lack of association between FCS and the nutritional status of both children and mothers (see Section 5.3.3.2) does not negate the importance of improving food consumption in the study areas. Improving dietary diversity and frequency of consumption of certain foods will have a positive impact on the nutritional status, including micronutrient status.

41
6.1.2 Food access Food access was determined using two proxy indicators: (a) the share of food expenditure in total expenditure over a six month period; and (b) reported annual income levels. In this assessment, share of food expenditure in total expenditure over a six months period was grouped into three; low = < 50% of total expenditure, medium = 50-65% of total expenditure, and high = >65% of total expenditure. The number of household members was taken into account in the calculation of the annual household income. Next, the per capita monthly income was categorized also into three categories: very poor (<Rp 126,389), poor (Rp 126,389 – Rp 289,754) and not poor (>Rp 289,754), based on the NTT provincial poverty line (BPS, 2007) and the World Bank’s threshold of US$ 2 Purchasing Power Parity (PPP) translated into IDR. In order to obtain the Food Access Groups, the two variables were cross tabulated as shown in Table 9.
TABLE 9 - CALCULATING HOUSEHOLD FOOD ACCESS GROUPS (ALL DISTRICTS)
Income source group
Food expenditure group Very Poor Poor Not Poor
>65% (high) 24% 5% 3%
50%-65% (medium) 17% 4% 2%
<50% (low) 31% 7% 6%
= Poor food access (46%) = Borderline food access (38%) = Good food access (15%)
It was found that the “poor” food access group was 46% of the total; the “borderline” group was 38%; and the “good” was 15%. The results were found consistent with the WFP/UNICEF Pilot High Food Price Impact Assessment (2009). The district level picture is as shown below in Figure 38.
FIGURE 38 - HOUSEHOLD FOOD ACCESS AT DISTRICT LEVEL (P<0.05, CHI-SQUARE TEST)
51.042.8 39.9 35.9
46.754.9 52.7
46.3
27.836.8
49.743.9
37.331.2 36.5
37.6
21.2 20.410.4
20.2 15.9 13.9 10.8 16.1
0%
10%
20%
30%
40%
50%
60%
70%
80%
90%
100%
Alor
(n=576)
Kupang
(n=582)
Manggarai
(n=589)
Rote Ndao
(n=585)
Sumba
Barat
(n=584)
Sumba
Timur
(n=590)
TTS
(n=575)
Total
(n=4081)
Poor Borderline good
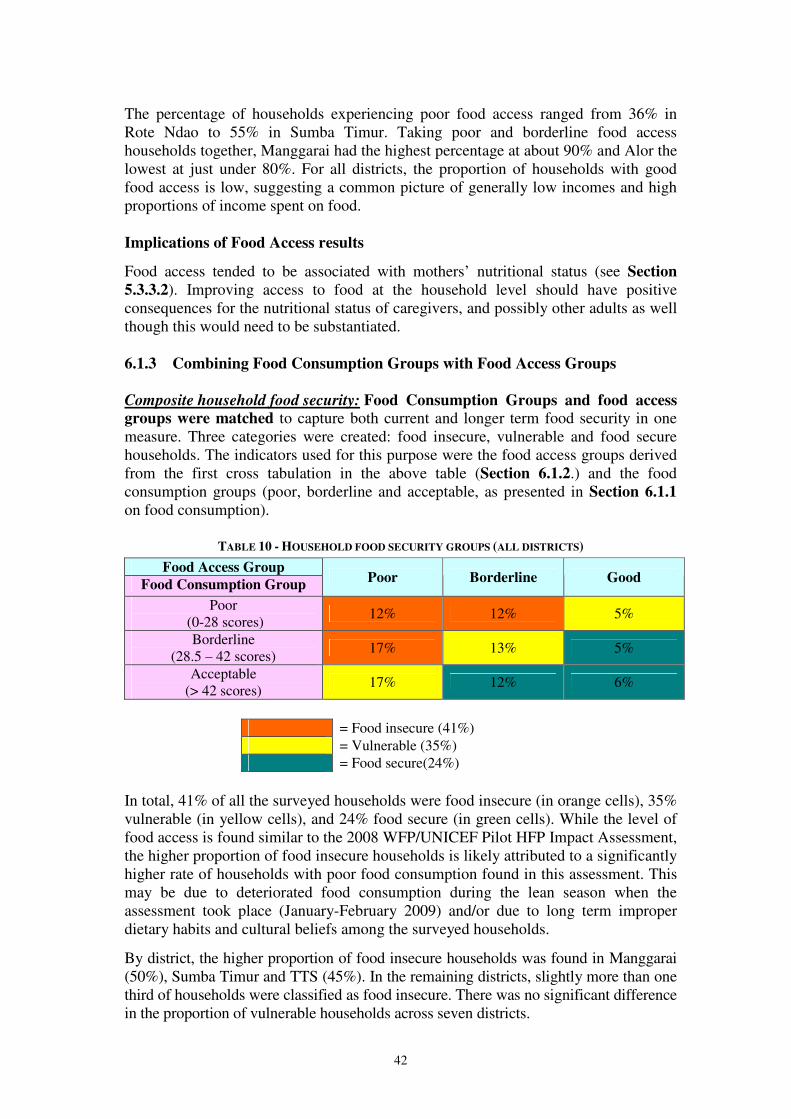
42
The percentage of households experiencing poor food access ranged from 36% in Rote Ndao to 55% in Sumba Timur. Taking poor and borderline food access households together, Manggarai had the highest percentage at about 90% and Alor the lowest at just under 80%. For all districts, the proportion of households with good food access is low, suggesting a common picture of generally low incomes and high proportions of income spent on food. Implications of Food Access results
Food access tended to be associated with mothers’ nutritional status (see Section
5.3.3.2). Improving access to food at the household level should have positive consequences for the nutritional status of caregivers, and possibly other adults as well though this would need to be substantiated. 6.1.3 Combining Food Consumption Groups with Food Access Groups
Composite household food security: Food Consumption Groups and food access groups were matched to capture both current and longer term food security in one measure. Three categories were created: food insecure, vulnerable and food secure households. The indicators used for this purpose were the food access groups derived from the first cross tabulation in the above table (Section 6.1.2.) and the food consumption groups (poor, borderline and acceptable, as presented in Section 6.1.1 on food consumption).
TABLE 10 - HOUSEHOLD FOOD SECURITY GROUPS (ALL DISTRICTS)
Food Access Group
Food Consumption Group Poor Borderline Good
Poor (0-28 scores)
12% 12% 5%
Borderline (28.5 – 42 scores)
17% 13% 5%
Acceptable (> 42 scores)
17% 12% 6%
= Food insecure (41%) = Vulnerable (35%) = Food secure(24%)
In total, 41% of all the surveyed households were food insecure (in orange cells), 35% vulnerable (in yellow cells), and 24% food secure (in green cells). While the level of food access is found similar to the 2008 WFP/UNICEF Pilot HFP Impact Assessment, the higher proportion of food insecure households is likely attributed to a significantly higher rate of households with poor food consumption found in this assessment. This may be due to deteriorated food consumption during the lean season when the assessment took place (January-February 2009) and/or due to long term improper dietary habits and cultural beliefs among the surveyed households.
By district, the higher proportion of food insecure households was found in Manggarai (50%), Sumba Timur and TTS (45%). In the remaining districts, slightly more than one third of households were classified as food insecure. There was no significant difference in the proportion of vulnerable households across seven districts.
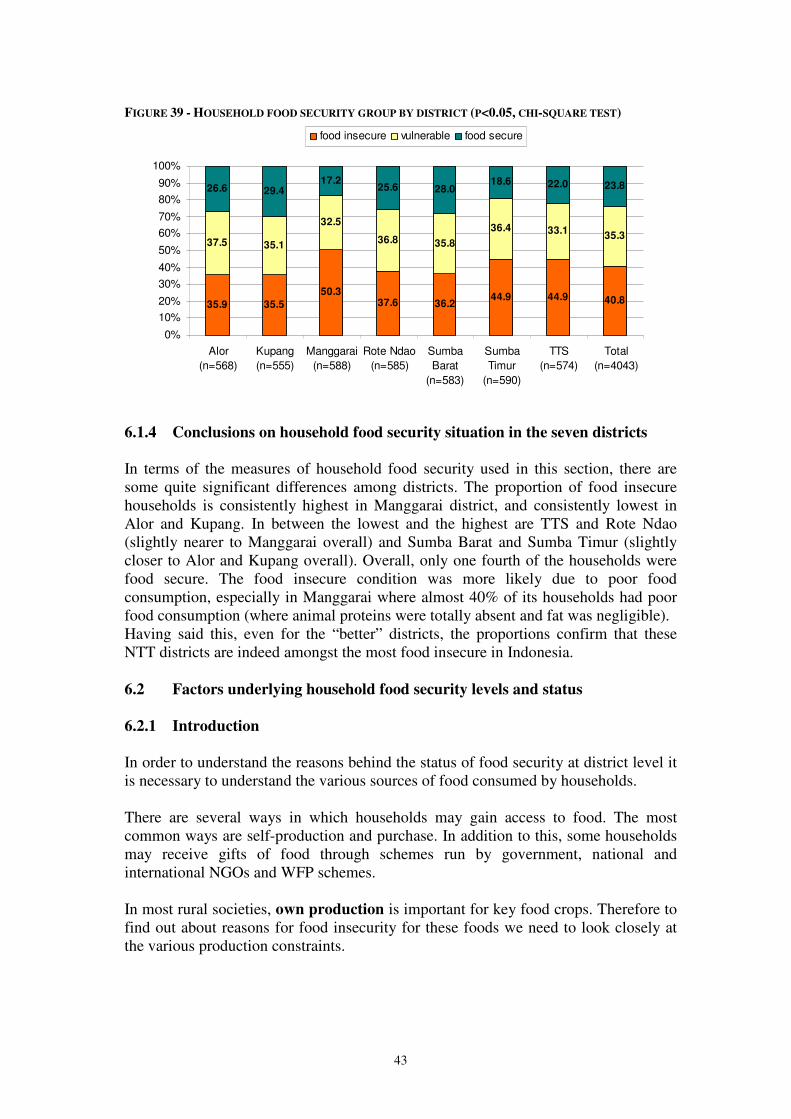
43
FIGURE 39 - HOUSEHOLD FOOD SECURITY GROUP BY DISTRICT (P<0.05, CHI-SQUARE TEST)
35.9 35.5
50.337.6 36.2
44.9 44.9 40.8
37.5 35.1
32.5
36.8 35.8
36.4 33.135.3
26.6 29.417.2
25.6 28.018.6 22.0 23.8
0%
10%
20%
30%
40%
50%
60%
70%
80%
90%
100%
Alor
(n=568)
Kupang
(n=555)
Manggarai
(n=588)
Rote Ndao
(n=585)
Sumba
Barat
(n=583)
Sumba
Timur
(n=590)
TTS
(n=574)
Total
(n=4043)
food insecure vulnerable food secure
6.1.4 Conclusions on household food security situation in the seven districts
In terms of the measures of household food security used in this section, there are some quite significant differences among districts. The proportion of food insecure households is consistently highest in Manggarai district, and consistently lowest in Alor and Kupang. In between the lowest and the highest are TTS and Rote Ndao (slightly nearer to Manggarai overall) and Sumba Barat and Sumba Timur (slightly closer to Alor and Kupang overall). Overall, only one fourth of the households were food secure. The food insecure condition was more likely due to poor food consumption, especially in Manggarai where almost 40% of its households had poor food consumption (where animal proteins were totally absent and fat was negligible). Having said this, even for the “better” districts, the proportions confirm that these NTT districts are indeed amongst the most food insecure in Indonesia. 6.2 Factors underlying household food security levels and status 6.2.1 Introduction In order to understand the reasons behind the status of food security at district level it is necessary to understand the various sources of food consumed by households. There are several ways in which households may gain access to food. The most common ways are self-production and purchase. In addition to this, some households may receive gifts of food through schemes run by government, national and international NGOs and WFP schemes. In most rural societies, own production is important for key food crops. Therefore to find out about reasons for food insecurity for these foods we need to look closely at the various production constraints.
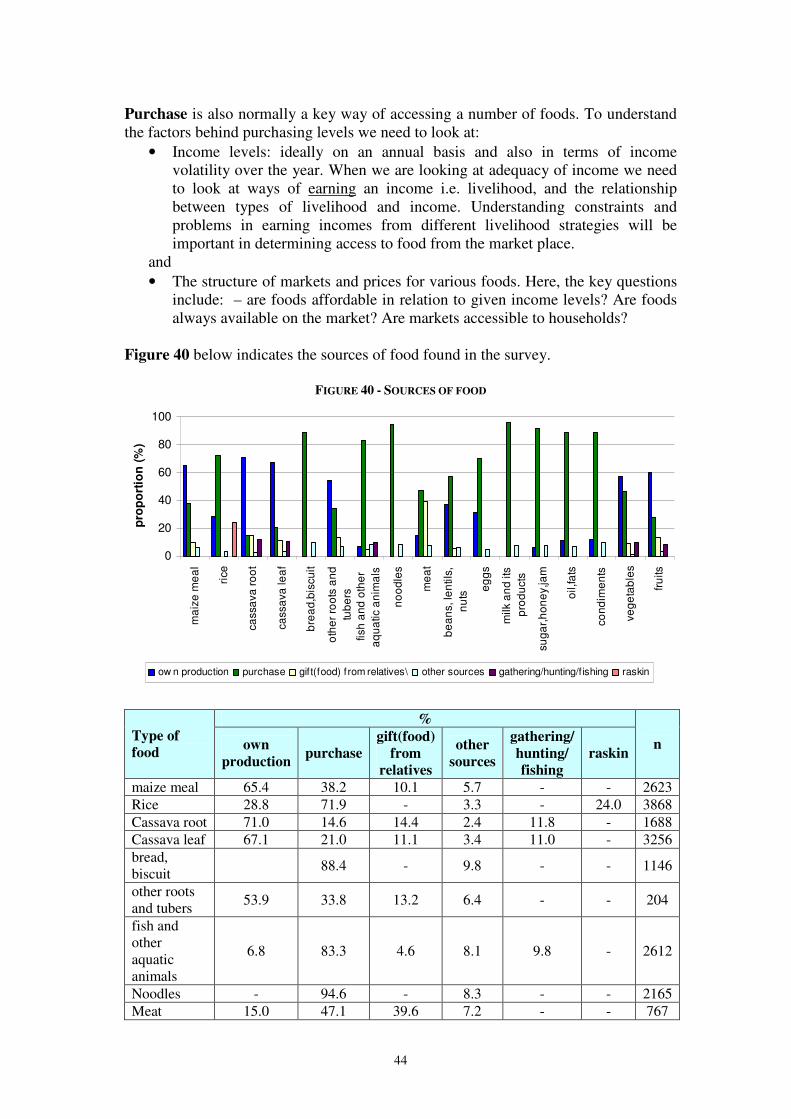
44
Purchase is also normally a key way of accessing a number of foods. To understand the factors behind purchasing levels we need to look at:
• Income levels: ideally on an annual basis and also in terms of income volatility over the year. When we are looking at adequacy of income we need to look at ways of earning an income i.e. livelihood, and the relationship between types of livelihood and income. Understanding constraints and problems in earning incomes from different livelihood strategies will be important in determining access to food from the market place.
and • The structure of markets and prices for various foods. Here, the key questions
include: – are foods affordable in relation to given income levels? Are foods always available on the market? Are markets accessible to households?
Figure 40 below indicates the sources of food found in the survey.
FIGURE 40 - SOURCES OF FOOD
0
20
40
60
80
100
ma
ize
me
al
rice
ca
ssa
va
ro
ot
ca
ssa
va
le
af
bre
ad
,bis
cu
it
oth
er
roo
ts a
nd
tub
ers
fish
an
d o
the
r
aq
ua
tic a
nim
als
no
od
les
me
at
be
an
s, le
ntils
,
nu
ts
eg
gs
milk a
nd
its
pro
du
cts
su
ga
r,h
on
ey,ja
m
oil,fa
ts
co
nd
ime
nts
ve
ge
tab
les
fru
its
pro
po
rtio
n (
%)
ow n production purchase gift(food) from relatives\ other sources gathering/hunting/fishing raskin
%
Type of
food own
production purchase
gift(food)
from
relatives
other
sources
gathering/
hunting/
fishing
raskin n
maize meal 65.4 38.2 10.1 5.7 - - 2623 Rice 28.8 71.9 - 3.3 - 24.0 3868 Cassava root 71.0 14.6 14.4 2.4 11.8 - 1688 Cassava leaf 67.1 21.0 11.1 3.4 11.0 - 3256 bread, biscuit 88.4 - 9.8 - - 1146
other roots and tubers 53.9 33.8 13.2 6.4 - - 204
fish and other aquatic animals
6.8 83.3 4.6 8.1 9.8 - 2612
Noodles - 94.6 - 8.3 - - 2165 Meat 15.0 47.1 39.6 7.2 - - 767
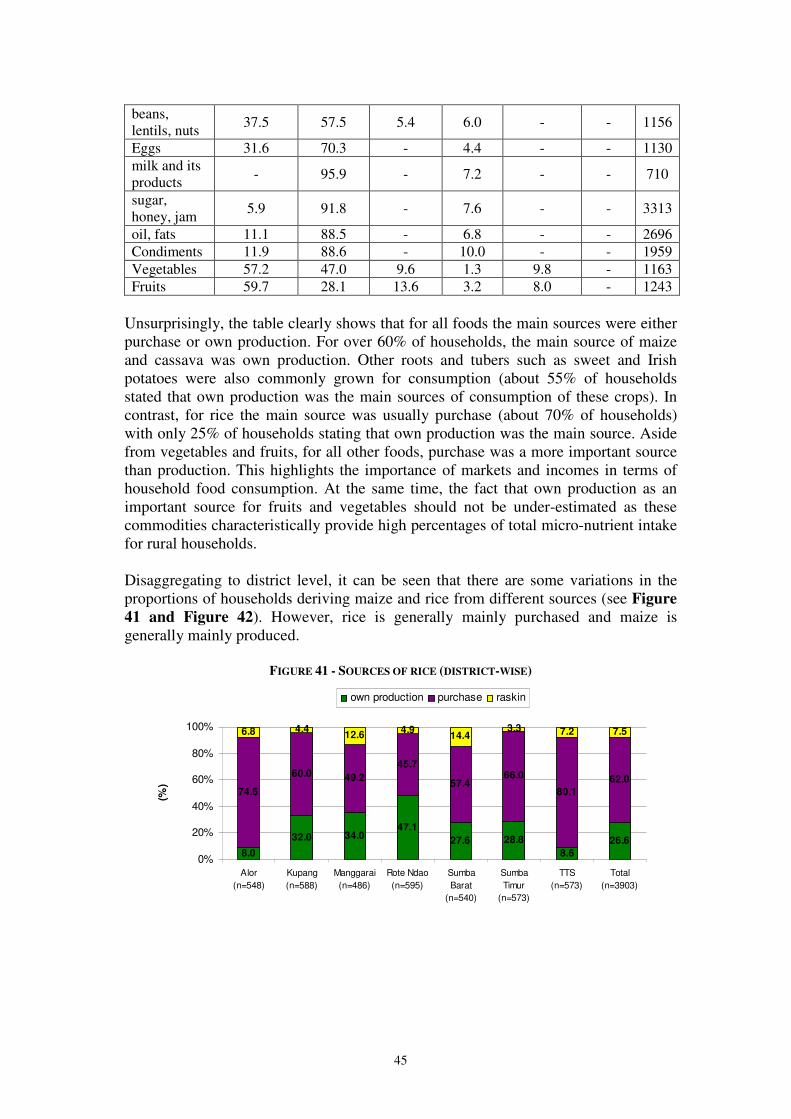
45
beans, lentils, nuts 37.5 57.5 5.4 6.0 - - 1156
Eggs 31.6 70.3 - 4.4 - - 1130 milk and its products - 95.9 - 7.2 - - 710
sugar, honey, jam 5.9 91.8 - 7.6 - - 3313
oil, fats 11.1 88.5 - 6.8 - - 2696 Condiments 11.9 88.6 - 10.0 - - 1959 Vegetables 57.2 47.0 9.6 1.3 9.8 - 1163 Fruits 59.7 28.1 13.6 3.2 8.0 - 1243
Unsurprisingly, the table clearly shows that for all foods the main sources were either purchase or own production. For over 60% of households, the main source of maize and cassava was own production. Other roots and tubers such as sweet and Irish potatoes were also commonly grown for consumption (about 55% of households stated that own production was the main sources of consumption of these crops). In contrast, for rice the main source was usually purchase (about 70% of households) with only 25% of households stating that own production was the main source. Aside from vegetables and fruits, for all other foods, purchase was a more important source than production. This highlights the importance of markets and incomes in terms of household food consumption. At the same time, the fact that own production as an important source for fruits and vegetables should not be under-estimated as these commodities characteristically provide high percentages of total micro-nutrient intake for rural households. Disaggregating to district level, it can be seen that there are some variations in the proportions of households deriving maize and rice from different sources (see Figure
41 and Figure 42). However, rice is generally mainly purchased and maize is generally mainly produced.
FIGURE 41 - SOURCES OF RICE (DISTRICT-WISE)
8.0
32.0 34.047.1
27.6 28.8
8.6
26.6
74.6
60.0 49.2
45.7
57.466.0
80.1
62.0
6.8 4.412.6
4.914.4
3.3 7.2 7.5
0%
20%
40%
60%
80%
100%
Alor
(n=548)
Kupang
(n=588)
Manggarai
(n=486)
Rote Ndao
(n=595)
Sumba
Barat
(n=540)
Sumba
Timur
(n=573)
TTS
(n=573)
Total
(n=3903)
(%)
own production purchase raskin

46
FIGURE 42 - SOURCES OF MAIZE (DISTRICT-WISE)
66.4 71.352.2 58.2 60.9
34.3
77.361.9
10.1 1.0
0.0 0.01.4
0.0
0.9
2.3
15.7 22.8
25.2 28.630.5
58.6
18.627.5
6.5 3.813.2 9.9
2.7 2.4 2.9 5.1
0%
20%
40%
60%
80%
100%
Alor
(n=464)
Kupang
(n=390)
Manggarai
(n=341)
Rote Ndao
(n=91)
Sumba
Barat
(n=440)
Sumba
Timur
(n=370)
TTS
(n=554)
Total
(n=2650)
(%)
own production gathering purchase gift from relatives
The data showed that rice consumption was preferred over maize in all districts. Whereas for 76% of households rice was consumed 5-7 days/week, just 37% of households consumed maize at the same level of frequency.
FIGURE 43 - MAIZE AND RICE: FREQUENCY OF CONSUMPTION BY DISTRICT
Weekly maize consumption
0%
20%
40%
60%
80%
100%
Alor
Kupan
g
Man
ggara
i
Rot
e Nda
o
Sumba
Bar
at
Sumba
Tim
urTTS
Total
Districts
% H
ou
se
ho
lds
Maize consumption 5-7x
Maize consumption 3-4x
Maize consumption 1-2x
Maize consumption 0x
Weekly rice consumption
0%
20%
40%
60%
80%
100%
Alor
Kupan
g
Man
ggara
i
Rot
e Nda
o
Sumba
Bar
at
Sumba
Tim
urTTS
Total
Districts
% H
ou
se
ho
lds
Rice consumption 5-7x
Rice consumption 3-4x
Rice consumption 1-2x
Rice consumption 0x
Cassava was consumed frequently only in Manggarai while other roots/tubers were not commonly consumed. Animal foods including eggs, milk and beans/lentils were not commonly consumed. As a result, the main diet of the population was rice, maize, vegetables, cassava leaves, sugars and oil.

47
6.2.2 Description of household level production of crops and livestock In the absence of extensive irrigation usage, cropping and livestock patterns are determined by the climate. In NTT province, by far the majority of the rural population are dependent on rainfed agriculture, and unlike other parts of Indonesia there is just once rainy season. Figure 44 indicates the length of the rains, harvest of maize and rice and period of hunger. As noted earlier, this survey took place towards at the end of the hungry period.
FIGURE 44 - FARMING CALENDAR
Jan Feb Mar Apr May Jun Jul Aug Sep Oct Nov Dec
Rainy Season Dry Season
Harvest of
Corn/Dry Paddy Harvest of wet land paddy *)
Ordinary Hunger
*) depends on presence of irrigation Source: compiled from various sources (Muslimatun and Fanggidae, 2008)
Overall, the main commodities cultivated were maize, rice, cassava and groundnuts/soybeans/other nuts. Each district had their specific commodities, such as candle nut in Alor; lontar24 in Kupang/Rote Ndao, groundnuts/soybeans/other nuts in Kupang, coffee in Manggarai, cassava in Sumba Barat and Sumba Timur and banana in TTS . Candle nut was also an important commodity in TTS. However, orange was cultivated in a very few households in TTS; an area which was famous for its oranges. With respect to the main staple food, maize was mostly cultivated in Alor, Kupang, Sumba Barat, Sumba Timur and TTS while rice was in Manggarai and Rote Ndao.
TABLE 11 - FIVE MOST IMPORTANT FOOD CROPS (COMMODITIES) CULTIVATED BY HOUSEHOLDS
ACCORDING TO DISTRICT (% OF HOUSEHOLDS)
District 1st commodity
2nd
commodity
3rd
commodity 4
th commodity 5
th commodity
Alor (n=459) Maize (88.9%) Candle nut
(50.1%) Rice (36.6%)
Cassava (33.6%)
Cashew nut (15.7%)
Kupang
(n=481) Maize (80.9%) Rice (47.4%)
Ground nuts/ soybean/ other
nuts (38%)
Cassava (20.4%)
Banana (9.6%)
Manggarai
(n=487) Rice (66.5%)
Coffee (44.8%)
Cassava (20.3%)
Maize (19.5%) Candle nut
(14.2%)
Rote Ndao
(n=446) Rice (82.7%)
Lontar (45.7%)
Maize (34.8%) Ground nuts/
soybean/ other nuts (15.2%)
Other roots/tubers
(7.6%)
Sumba Barat
(n=468) Maize (91.5%)
Cassava (74.8%)
Rice (71.6%) Coconut (5.3%)
Sweet potato (5.1%)
24 A fruit tree containing sweet fluid in its trunk. The fluid is used to make sugar, jam or fermented
wine.
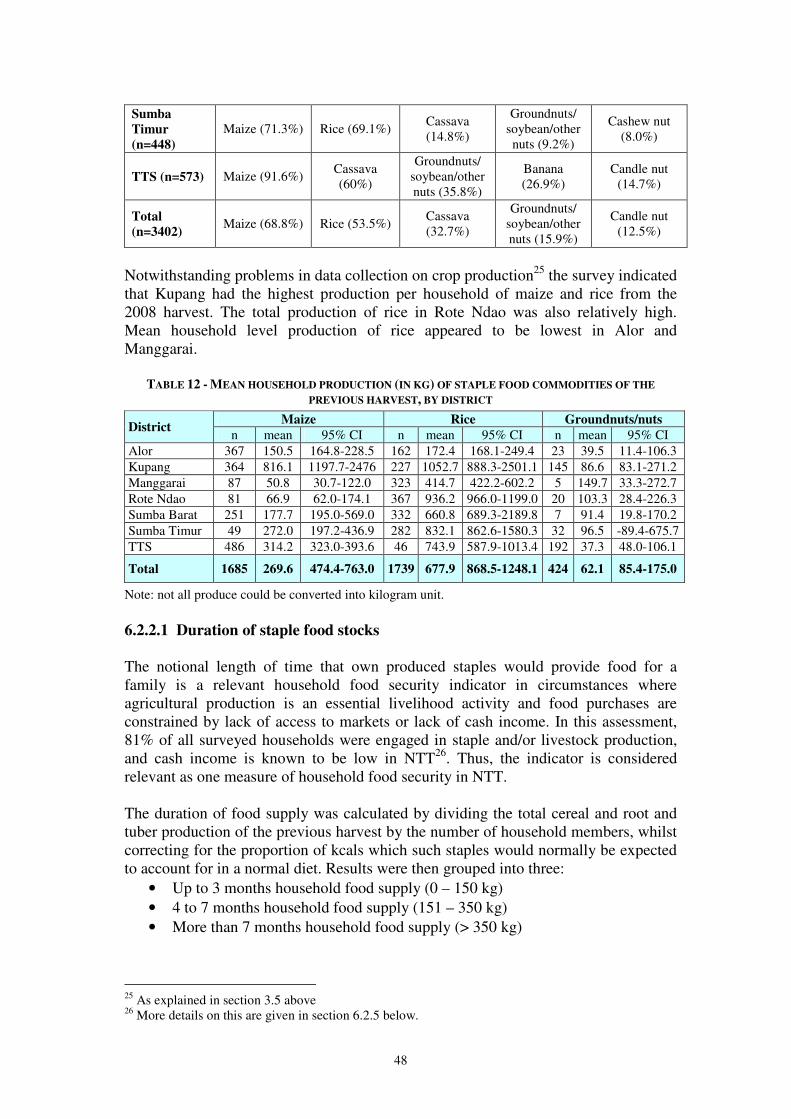
48
Sumba
Timur
(n=448)
Maize (71.3%) Rice (69.1%) Cassava (14.8%)
Groundnuts/ soybean/other nuts (9.2%)
Cashew nut (8.0%)
TTS (n=573) Maize (91.6%) Cassava (60%)
Groundnuts/ soybean/other nuts (35.8%)
Banana (26.9%)
Candle nut (14.7%)
Total
(n=3402) Maize (68.8%) Rice (53.5%)
Cassava (32.7%)
Groundnuts/ soybean/other nuts (15.9%)
Candle nut (12.5%)
Notwithstanding problems in data collection on crop production25 the survey indicated that Kupang had the highest production per household of maize and rice from the 2008 harvest. The total production of rice in Rote Ndao was also relatively high. Mean household level production of rice appeared to be lowest in Alor and Manggarai.
TABLE 12 - MEAN HOUSEHOLD PRODUCTION (IN KG) OF STAPLE FOOD COMMODITIES OF THE
PREVIOUS HARVEST, BY DISTRICT
Maize Rice Groundnuts/nuts District
n mean 95% CI n mean 95% CI n mean 95% CI Alor 367 150.5 164.8-228.5 162 172.4 168.1-249.4 23 39.5 11.4-106.3 Kupang 364 816.1 1197.7-2476 227 1052.7 888.3-2501.1 145 86.6 83.1-271.2 Manggarai 87 50.8 30.7-122.0 323 414.7 422.2-602.2 5 149.7 33.3-272.7 Rote Ndao 81 66.9 62.0-174.1 367 936.2 966.0-1199.0 20 103.3 28.4-226.3 Sumba Barat 251 177.7 195.0-569.0 332 660.8 689.3-2189.8 7 91.4 19.8-170.2 Sumba Timur 49 272.0 197.2-436.9 282 832.1 862.6-1580.3 32 96.5 -89.4-675.7 TTS 486 314.2 323.0-393.6 46 743.9 587.9-1013.4 192 37.3 48.0-106.1
Total 1685 269.6 474.4-763.0 1739 677.9 868.5-1248.1 424 62.1 85.4-175.0
Note: not all produce could be converted into kilogram unit. 6.2.2.1 Duration of staple food stocks The notional length of time that own produced staples would provide food for a family is a relevant household food security indicator in circumstances where agricultural production is an essential livelihood activity and food purchases are constrained by lack of access to markets or lack of cash income. In this assessment, 81% of all surveyed households were engaged in staple and/or livestock production, and cash income is known to be low in NTT26. Thus, the indicator is considered relevant as one measure of household food security in NTT. The duration of food supply was calculated by dividing the total cereal and root and tuber production of the previous harvest by the number of household members, whilst correcting for the proportion of kcals which such staples would normally be expected to account for in a normal diet. Results were then grouped into three:
• Up to 3 months household food supply (0 – 150 kg) • 4 to 7 months household food supply (151 – 350 kg) • More than 7 months household food supply (> 350 kg)
25 As explained in section 3.5 above 26 More details on this are given in section 6.2.5 below.
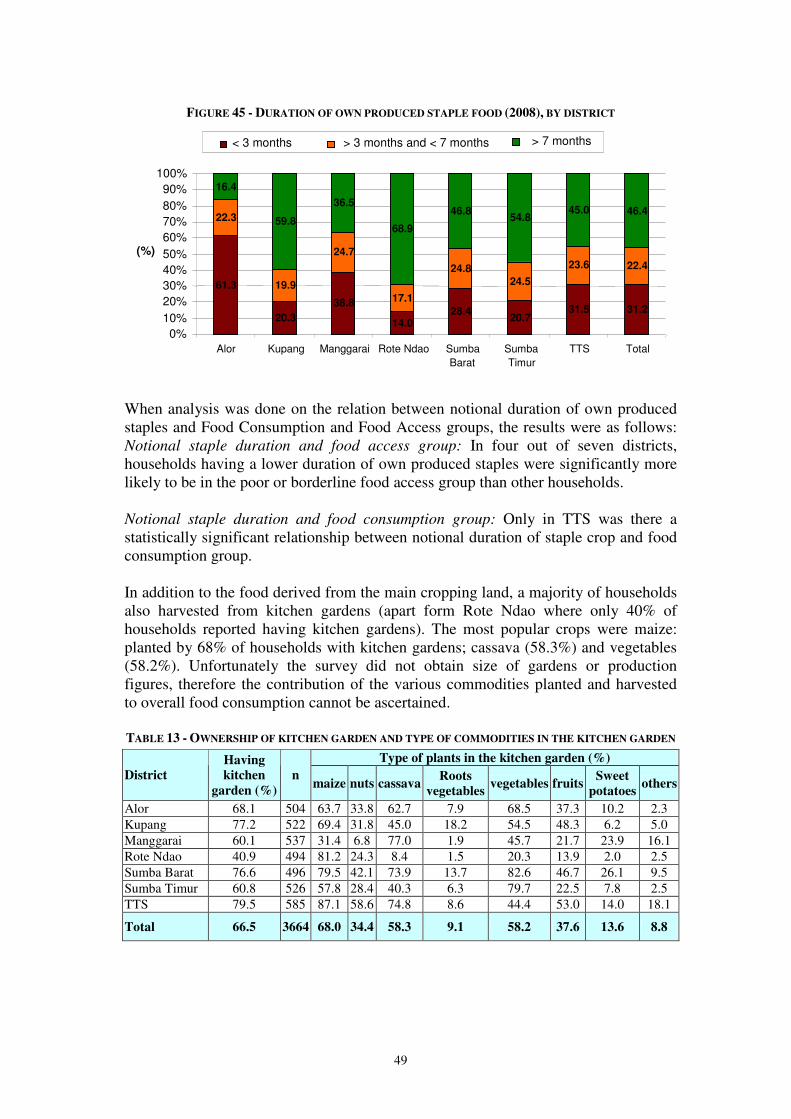
49
FIGURE 45 - DURATION OF OWN PRODUCED STAPLE FOOD (2008), BY DISTRICT
When analysis was done on the relation between notional duration of own produced staples and Food Consumption and Food Access groups, the results were as follows: Notional staple duration and food access group: In four out of seven districts, households having a lower duration of own produced staples were significantly more likely to be in the poor or borderline food access group than other households. Notional staple duration and food consumption group: Only in TTS was there a statistically significant relationship between notional duration of staple crop and food consumption group. In addition to the food derived from the main cropping land, a majority of households also harvested from kitchen gardens (apart form Rote Ndao where only 40% of households reported having kitchen gardens). The most popular crops were maize: planted by 68% of households with kitchen gardens; cassava (58.3%) and vegetables (58.2%). Unfortunately the survey did not obtain size of gardens or production figures, therefore the contribution of the various commodities planted and harvested to overall food consumption cannot be ascertained. TABLE 13 - OWNERSHIP OF KITCHEN GARDEN AND TYPE OF COMMODITIES IN THE KITCHEN GARDEN
Type of plants in the kitchen garden (%)
District
Having
kitchen
garden (%) n
maize nuts cassava Roots
vegetables vegetables fruits
Sweet
potatoes others
Alor 68.1 504 63.7 33.8 62.7 7.9 68.5 37.3 10.2 2.3 Kupang 77.2 522 69.4 31.8 45.0 18.2 54.5 48.3 6.2 5.0 Manggarai 60.1 537 31.4 6.8 77.0 1.9 45.7 21.7 23.9 16.1 Rote Ndao 40.9 494 81.2 24.3 8.4 1.5 20.3 13.9 2.0 2.5 Sumba Barat 76.6 496 79.5 42.1 73.9 13.7 82.6 46.7 26.1 9.5 Sumba Timur 60.8 526 57.8 28.4 40.3 6.3 79.7 22.5 7.8 2.5 TTS 79.5 585 87.1 58.6 74.8 8.6 44.4 53.0 14.0 18.1
Total 66.5 3664 68.0 34.4 58.3 9.1 58.2 37.6 13.6 8.8
61.3
20.3 38.8
14.0 28.4
20.7 31.5 31.2
22.3
19.9
24.7
17.1
24.8 24.5
23.6 22.4
16.4
59.8 36.5
68.9 46.8
54.8 45.0 46.4
0% 10% 20% 30% 40% 50% 60% 70% 80% 90%
100%
Alor Kupang Manggarai Rote Ndao Sumba Barat
Sumba Timur
TTS Total
(%)
< 3 months > 3 months and < 7 months > 7 months
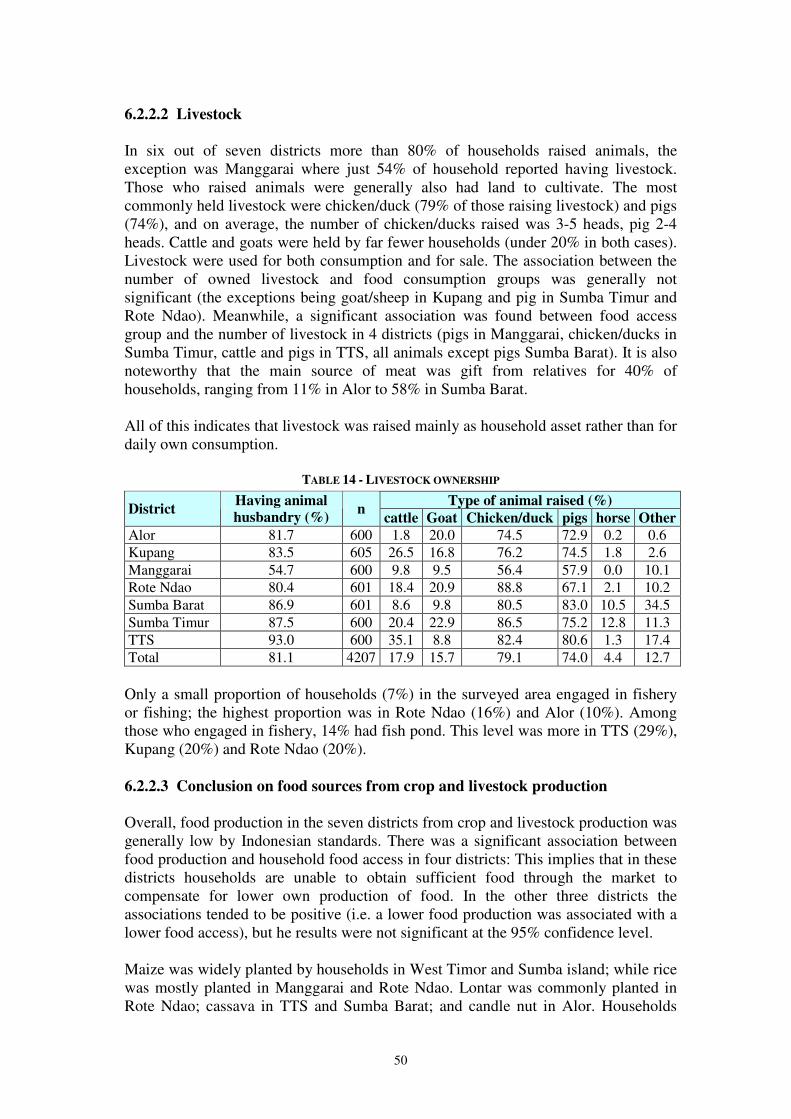
50
6.2.2.2 Livestock In six out of seven districts more than 80% of households raised animals, the exception was Manggarai where just 54% of household reported having livestock. Those who raised animals were generally also had land to cultivate. The most commonly held livestock were chicken/duck (79% of those raising livestock) and pigs (74%), and on average, the number of chicken/ducks raised was 3-5 heads, pig 2-4 heads. Cattle and goats were held by far fewer households (under 20% in both cases). Livestock were used for both consumption and for sale. The association between the number of owned livestock and food consumption groups was generally not significant (the exceptions being goat/sheep in Kupang and pig in Sumba Timur and Rote Ndao). Meanwhile, a significant association was found between food access group and the number of livestock in 4 districts (pigs in Manggarai, chicken/ducks in Sumba Timur, cattle and pigs in TTS, all animals except pigs Sumba Barat). It is also noteworthy that the main source of meat was gift from relatives for 40% of households, ranging from 11% in Alor to 58% in Sumba Barat. All of this indicates that livestock was raised mainly as household asset rather than for daily own consumption.
TABLE 14 - LIVESTOCK OWNERSHIP
Type of animal raised (%) District
Having animal
husbandry (%) n
cattle Goat Chicken/duck pigs horse Other
Alor 81.7 600 1.8 20.0 74.5 72.9 0.2 0.6 Kupang 83.5 605 26.5 16.8 76.2 74.5 1.8 2.6 Manggarai 54.7 600 9.8 9.5 56.4 57.9 0.0 10.1 Rote Ndao 80.4 601 18.4 20.9 88.8 67.1 2.1 10.2 Sumba Barat 86.9 601 8.6 9.8 80.5 83.0 10.5 34.5 Sumba Timur 87.5 600 20.4 22.9 86.5 75.2 12.8 11.3 TTS 93.0 600 35.1 8.8 82.4 80.6 1.3 17.4 Total 81.1 4207 17.9 15.7 79.1 74.0 4.4 12.7 Only a small proportion of households (7%) in the surveyed area engaged in fishery or fishing; the highest proportion was in Rote Ndao (16%) and Alor (10%). Among those who engaged in fishery, 14% had fish pond. This level was more in TTS (29%), Kupang (20%) and Rote Ndao (20%). 6.2.2.3 Conclusion on food sources from crop and livestock production Overall, food production in the seven districts from crop and livestock production was generally low by Indonesian standards. There was a significant association between food production and household food access in four districts: This implies that in these districts households are unable to obtain sufficient food through the market to compensate for lower own production of food. In the other three districts the associations tended to be positive (i.e. a lower food production was associated with a lower food access), but he results were not significant at the 95% confidence level. Maize was widely planted by households in West Timor and Sumba island; while rice was mostly planted in Manggarai and Rote Ndao. Lontar was commonly planted in Rote Ndao; cassava in TTS and Sumba Barat; and candle nut in Alor. Households
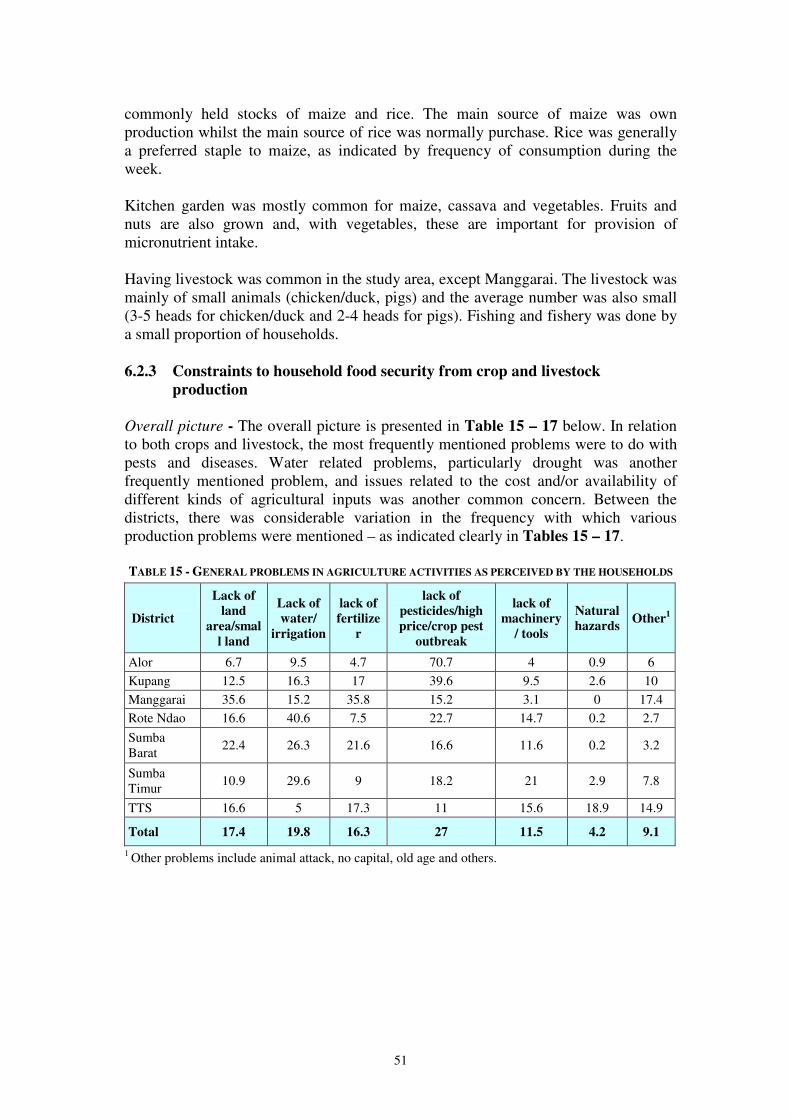
51
commonly held stocks of maize and rice. The main source of maize was own production whilst the main source of rice was normally purchase. Rice was generally a preferred staple to maize, as indicated by frequency of consumption during the week. Kitchen garden was mostly common for maize, cassava and vegetables. Fruits and nuts are also grown and, with vegetables, these are important for provision of micronutrient intake. Having livestock was common in the study area, except Manggarai. The livestock was mainly of small animals (chicken/duck, pigs) and the average number was also small (3-5 heads for chicken/duck and 2-4 heads for pigs). Fishing and fishery was done by a small proportion of households.
6.2.3 Constraints to household food security from crop and livestock
production Overall picture - The overall picture is presented in Table 15 – 17 below. In relation to both crops and livestock, the most frequently mentioned problems were to do with pests and diseases. Water related problems, particularly drought was another frequently mentioned problem, and issues related to the cost and/or availability of different kinds of agricultural inputs was another common concern. Between the districts, there was considerable variation in the frequency with which various production problems were mentioned – as indicated clearly in Tables 15 – 17. TABLE 15 - GENERAL PROBLEMS IN AGRICULTURE ACTIVITIES AS PERCEIVED BY THE HOUSEHOLDS
District
Lack of
land
area/smal
l land
Lack of
water/
irrigation
lack of
fertilize
r
lack of
pesticides/high
price/crop pest
outbreak
lack of
machinery
/ tools
Natural
hazards Other
1
Alor 6.7 9.5 4.7 70.7 4 0.9 6 Kupang 12.5 16.3 17 39.6 9.5 2.6 10 Manggarai 35.6 15.2 35.8 15.2 3.1 0 17.4 Rote Ndao 16.6 40.6 7.5 22.7 14.7 0.2 2.7
Sumba Barat
22.4 26.3 21.6 16.6 11.6 0.2 3.2
Sumba Timur
10.9 29.6 9 18.2 21 2.9 7.8
TTS 16.6 5 17.3 11 15.6 18.9 14.9
Total 17.4 19.8 16.3 27 11.5 4.2 9.1
1 Other problems include animal attack, no capital, old age and others.
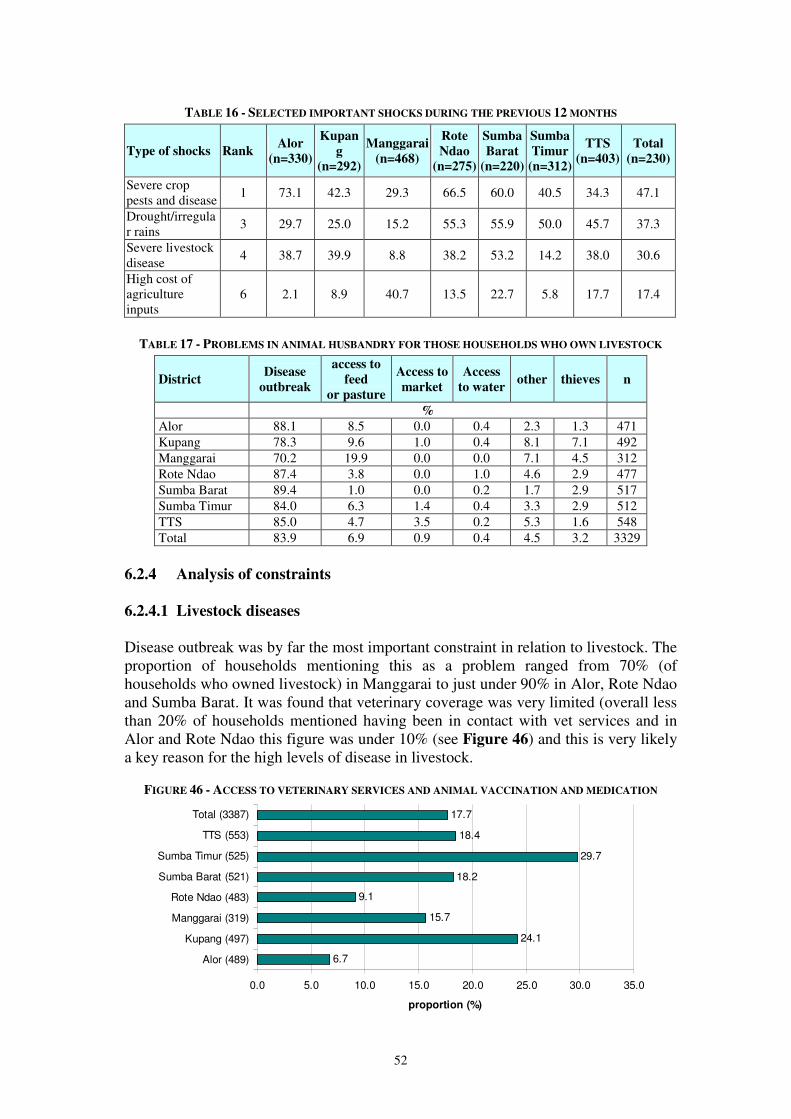
52
TABLE 16 - SELECTED IMPORTANT SHOCKS DURING THE PREVIOUS 12 MONTHS
Type of shocks Rank Alor
(n=330)
Kupan
g
(n=292)
Manggarai
(n=468)
Rote
Ndao
(n=275)
Sumba
Barat
(n=220)
Sumba
Timur
(n=312)
TTS
(n=403)
Total
(n=230)
Severe crop pests and disease
1 73.1 42.3 29.3 66.5 60.0 40.5 34.3 47.1
Drought/irregular rains
3 29.7 25.0 15.2 55.3 55.9 50.0 45.7 37.3
Severe livestock disease
4 38.7 39.9 8.8 38.2 53.2 14.2 38.0 30.6
High cost of agriculture inputs
6 2.1 8.9 40.7 13.5 22.7 5.8 17.7 17.4
TABLE 17 - PROBLEMS IN ANIMAL HUSBANDRY FOR THOSE HOUSEHOLDS WHO OWN LIVESTOCK
District Disease
outbreak
access to
feed
or pasture
Access to
market
Access
to water other thieves n
%
Alor 88.1 8.5 0.0 0.4 2.3 1.3 471 Kupang 78.3 9.6 1.0 0.4 8.1 7.1 492 Manggarai 70.2 19.9 0.0 0.0 7.1 4.5 312 Rote Ndao 87.4 3.8 0.0 1.0 4.6 2.9 477 Sumba Barat 89.4 1.0 0.0 0.2 1.7 2.9 517 Sumba Timur 84.0 6.3 1.4 0.4 3.3 2.9 512 TTS 85.0 4.7 3.5 0.2 5.3 1.6 548 Total 83.9 6.9 0.9 0.4 4.5 3.2 3329
6.2.4 Analysis of constraints
6.2.4.1 Livestock diseases Disease outbreak was by far the most important constraint in relation to livestock. The proportion of households mentioning this as a problem ranged from 70% (of households who owned livestock) in Manggarai to just under 90% in Alor, Rote Ndao and Sumba Barat. It was found that veterinary coverage was very limited (overall less than 20% of households mentioned having been in contact with vet services and in Alor and Rote Ndao this figure was under 10% (see Figure 46) and this is very likely a key reason for the high levels of disease in livestock.
FIGURE 46 - ACCESS TO VETERINARY SERVICES AND ANIMAL VACCINATION AND MEDICATION
6.7
24.1
15.7
9.1
18.2
29.7
18.4
17.7
0.0 5.0 10.0 15.0 20.0 25.0 30.0 35.0
Alor (489)
Kupang (497)
Manggarai (319)
Rote Ndao (483)
Sumba Barat (521)
Sumba Timur (525)
TTS (553)
Total (3387)
proportion (%)
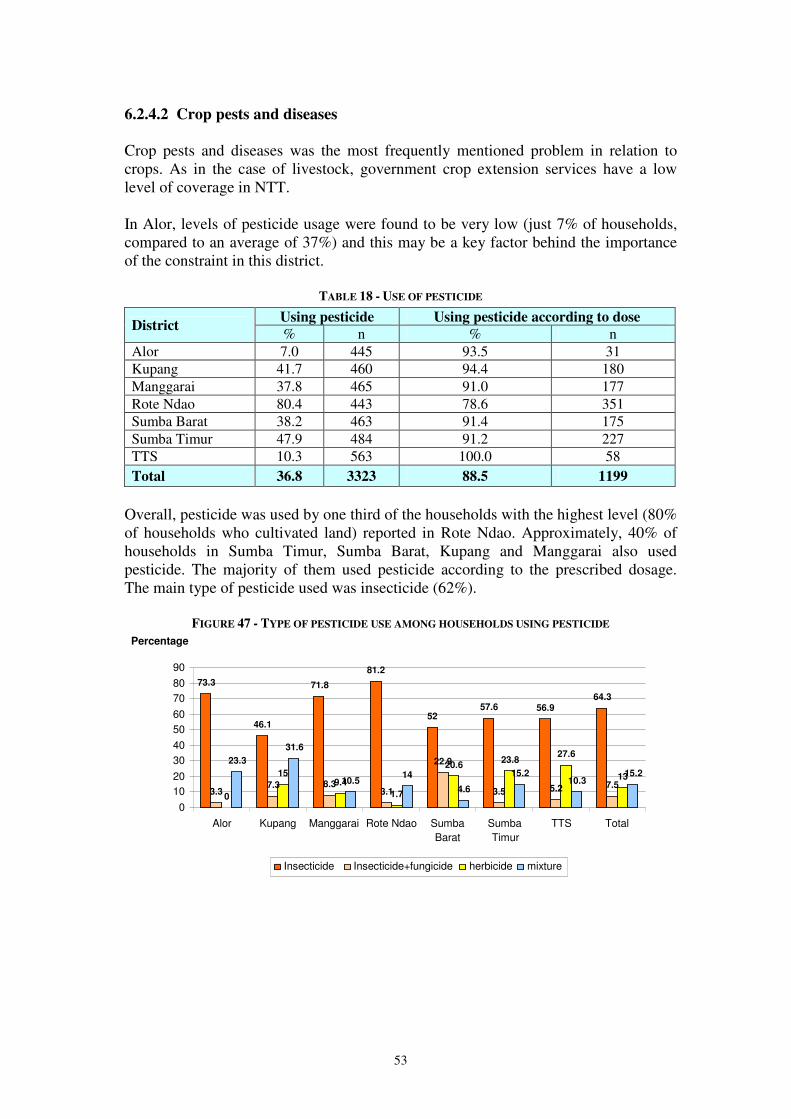
53
6.2.4.2 Crop pests and diseases Crop pests and diseases was the most frequently mentioned problem in relation to crops. As in the case of livestock, government crop extension services have a low level of coverage in NTT. In Alor, levels of pesticide usage were found to be very low (just 7% of households, compared to an average of 37%) and this may be a key factor behind the importance of the constraint in this district.
TABLE 18 - USE OF PESTICIDE
Using pesticide Using pesticide according to dose District
% n % n Alor 7.0 445 93.5 31 Kupang 41.7 460 94.4 180 Manggarai 37.8 465 91.0 177 Rote Ndao 80.4 443 78.6 351 Sumba Barat 38.2 463 91.4 175 Sumba Timur 47.9 484 91.2 227 TTS 10.3 563 100.0 58 Total 36.8 3323 88.5 1199
Overall, pesticide was used by one third of the households with the highest level (80% of households who cultivated land) reported in Rote Ndao. Approximately, 40% of households in Sumba Timur, Sumba Barat, Kupang and Manggarai also used pesticide. The majority of them used pesticide according to the prescribed dosage. The main type of pesticide used was insecticide (62%).
FIGURE 47 - TYPE OF PESTICIDE USE AMONG HOUSEHOLDS USING PESTICIDE
73.3
46.1
71.8 81.2
52 57.6 56.9
64.3
3.3 7.3 8.3 3.1
22.9
3.5 5.2 7.5 0
15 9.4
1.7
20.6 23.8 27.6
13 23.3
31.6
10.5 14 4.6
15.2 10.3 15.2
0 10 20 30 40 50 60 70 80 90
Alor Kupang Manggarai Rote Ndao Sumba Barat
Sumba Timur
TTS Total
Percentage
Insecticide Insecticide+fungicide herbicide mixture
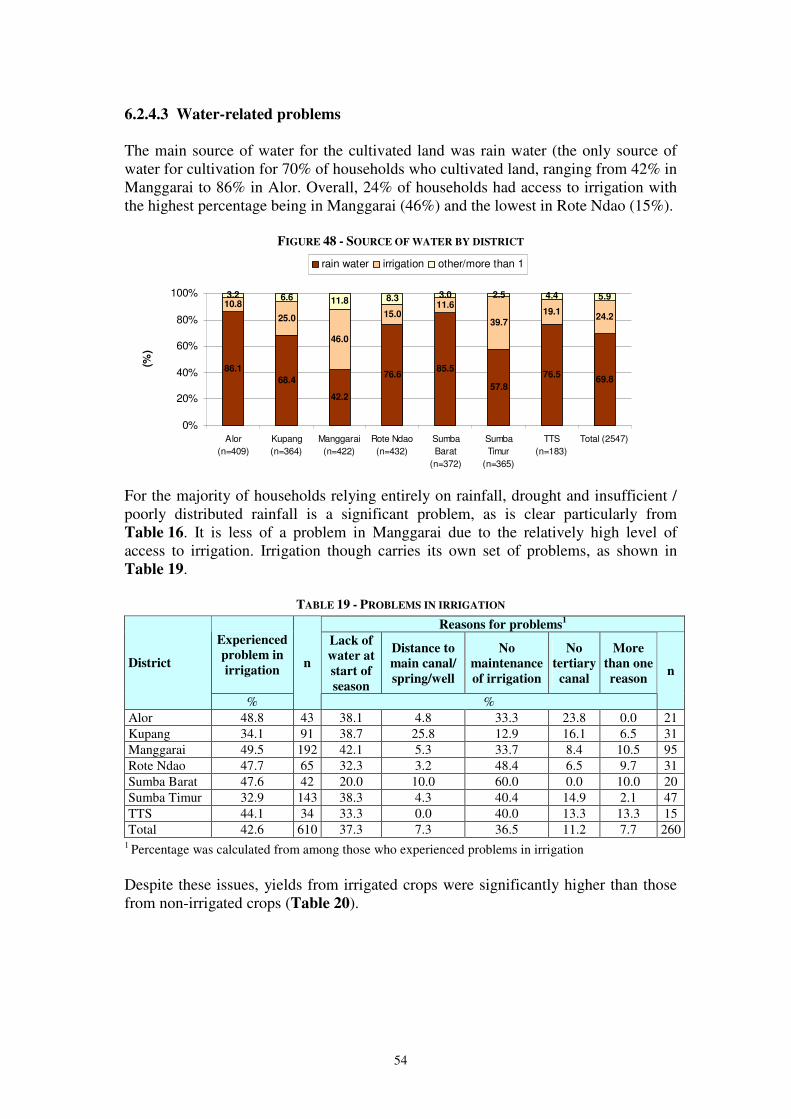
54
6.2.4.3 Water-related problems The main source of water for the cultivated land was rain water (the only source of water for cultivation for 70% of households who cultivated land, ranging from 42% in Manggarai to 86% in Alor. Overall, 24% of households had access to irrigation with the highest percentage being in Manggarai (46%) and the lowest in Rote Ndao (15%).
FIGURE 48 - SOURCE OF WATER BY DISTRICT
86.1
68.4
42.2
76.685.5
57.8
76.569.8
10.8
25.0
46.0
15.011.6
39.719.1
24.2
3.2 6.6 11.8 8.3 3.0 2.5 4.4 5.9
0%
20%
40%
60%
80%
100%
Alor
(n=409)
Kupang
(n=364)
Manggarai
(n=422)
Rote Ndao
(n=432)
Sumba
Barat
(n=372)
Sumba
Timur
(n=365)
TTS
(n=183)
Total (2547)
(%)
rain water irrigation other/more than 1
For the majority of households relying entirely on rainfall, drought and insufficient / poorly distributed rainfall is a significant problem, as is clear particularly from Table 16. It is less of a problem in Manggarai due to the relatively high level of access to irrigation. Irrigation though carries its own set of problems, as shown in Table 19.
TABLE 19 - PROBLEMS IN IRRIGATION
Reasons for problems1
Experienced
problem in
irrigation
Lack of
water at
start of
season
Distance to
main canal/
spring/well
No
maintenance
of irrigation
No
tertiary
canal
More
than one
reason
District
%
n
%
n
Alor 48.8 43 38.1 4.8 33.3 23.8 0.0 21 Kupang 34.1 91 38.7 25.8 12.9 16.1 6.5 31 Manggarai 49.5 192 42.1 5.3 33.7 8.4 10.5 95 Rote Ndao 47.7 65 32.3 3.2 48.4 6.5 9.7 31 Sumba Barat 47.6 42 20.0 10.0 60.0 0.0 10.0 20 Sumba Timur 32.9 143 38.3 4.3 40.4 14.9 2.1 47 TTS 44.1 34 33.3 0.0 40.0 13.3 13.3 15 Total 42.6 610 37.3 7.3 36.5 11.2 7.7 260
1 Percentage was calculated from among those who experienced problems in irrigation
Despite these issues, yields from irrigated crops were significantly higher than those from non-irrigated crops (Table 20).
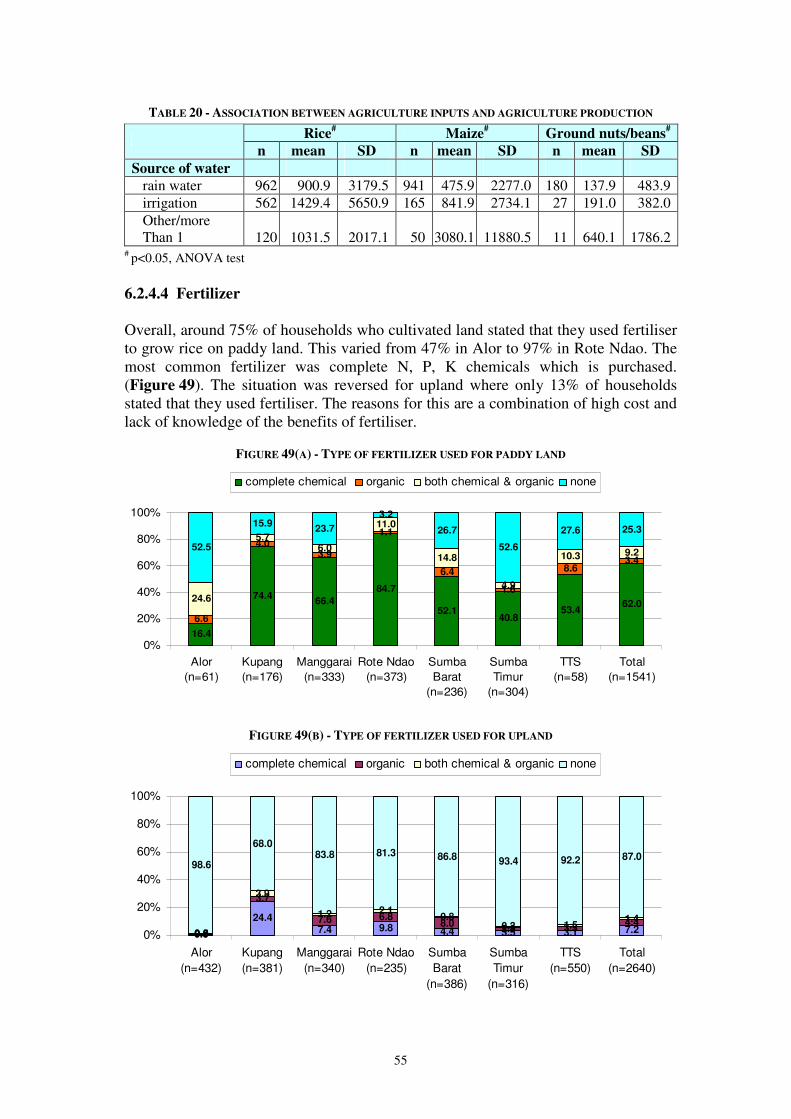
55
TABLE 20 - ASSOCIATION BETWEEN AGRICULTURE INPUTS AND AGRICULTURE PRODUCTION
Rice# Maize
# Ground nuts/beans
#
n mean SD n mean SD n mean SD
Source of water
rain water 962 900.9 3179.5 941 475.9 2277.0 180 137.9 483.9 irrigation 562 1429.4 5650.9 165 841.9 2734.1 27 191.0 382.0 Other/more Than 1 120 1031.5 2017.1 50 3080.1 11880.5 11 640.1 1786.2
# p<0.05, ANOVA test 6.2.4.4 Fertilizer Overall, around 75% of households who cultivated land stated that they used fertiliser to grow rice on paddy land. This varied from 47% in Alor to 97% in Rote Ndao. The most common fertilizer was complete N, P, K chemicals which is purchased. (Figure 49). The situation was reversed for upland where only 13% of households stated that they used fertiliser. The reasons for this are a combination of high cost and lack of knowledge of the benefits of fertiliser.
FIGURE 49(A) - TYPE OF FERTILIZER USED FOR PADDY LAND
16.4
74.466.4
84.7
52.140.8
53.462.0
6.6
4.03.9
1.1
6.4
1.6
8.63.4
24.6
5.76.0
11.0
14.8
4.9
10.3 9.252.5
15.923.7
3.2
26.7
52.6
27.6 25.3
0%
20%
40%
60%
80%
100%
Alor
(n=61)
Kupang
(n=176)
Manggarai
(n=333)
Rote Ndao
(n=373)
Sumba
Barat
(n=236)
Sumba
Timur
(n=304)
TTS
(n=58)
Total
(n=1541)
complete chemical organic both chemical & organic none
FIGURE 49(B) - TYPE OF FERTILIZER USED FOR UPLAND
0.9
24.47.4 9.8 4.4 3.5 3.1 7.20.5
3.7
7.6 6.88.0
2.8 3.34.4
0.0
3.9
1.2 2.10.8
0.3 1.51.4
98.6
68.083.8 81.3 86.8 93.4 92.2 87.0
0%
20%
40%
60%
80%
100%
Alor
(n=432)
Kupang
(n=381)
Manggarai
(n=340)
Rote Ndao
(n=235)
Sumba
Barat
(n=386)
Sumba
Timur
(n=316)
TTS
(n=550)
Total
(n=2640)
complete chemical organic both chemical & organic none
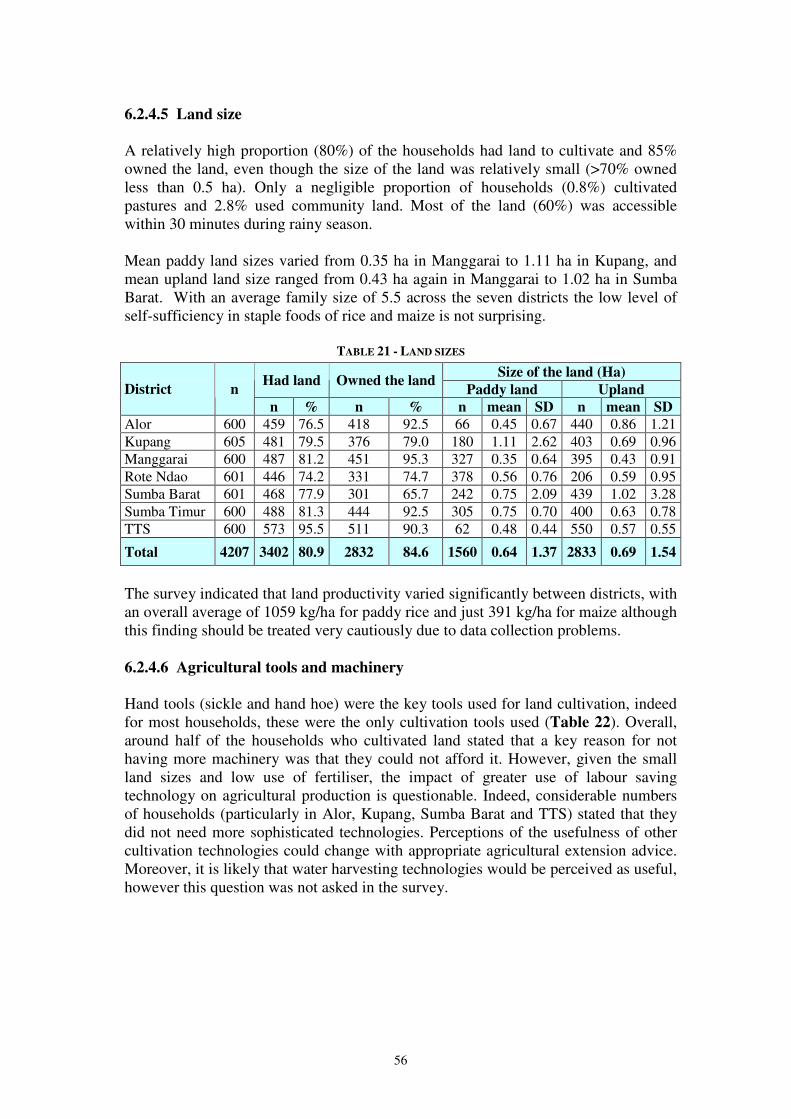
56
6.2.4.5 Land size A relatively high proportion (80%) of the households had land to cultivate and 85% owned the land, even though the size of the land was relatively small (>70% owned less than 0.5 ha). Only a negligible proportion of households (0.8%) cultivated pastures and 2.8% used community land. Most of the land (60%) was accessible within 30 minutes during rainy season. Mean paddy land sizes varied from 0.35 ha in Manggarai to 1.11 ha in Kupang, and mean upland land size ranged from 0.43 ha again in Manggarai to 1.02 ha in Sumba Barat. With an average family size of 5.5 across the seven districts the low level of self-sufficiency in staple foods of rice and maize is not surprising.
TABLE 21 - LAND SIZES
The survey indicated that land productivity varied significantly between districts, with an overall average of 1059 kg/ha for paddy rice and just 391 kg/ha for maize although this finding should be treated very cautiously due to data collection problems. 6.2.4.6 Agricultural tools and machinery Hand tools (sickle and hand hoe) were the key tools used for land cultivation, indeed for most households, these were the only cultivation tools used (Table 22). Overall, around half of the households who cultivated land stated that a key reason for not having more machinery was that they could not afford it. However, given the small land sizes and low use of fertiliser, the impact of greater use of labour saving technology on agricultural production is questionable. Indeed, considerable numbers of households (particularly in Alor, Kupang, Sumba Barat and TTS) stated that they did not need more sophisticated technologies. Perceptions of the usefulness of other cultivation technologies could change with appropriate agricultural extension advice. Moreover, it is likely that water harvesting technologies would be perceived as useful, however this question was not asked in the survey.
Size of the land (Ha) Had land Owned the land
Paddy land Upland District n
n % n % n mean SD n mean SD
Alor 600 459 76.5 418 92.5 66 0.45 0.67 440 0.86 1.21 Kupang 605 481 79.5 376 79.0 180 1.11 2.62 403 0.69 0.96 Manggarai 600 487 81.2 451 95.3 327 0.35 0.64 395 0.43 0.91 Rote Ndao 601 446 74.2 331 74.7 378 0.56 0.76 206 0.59 0.95 Sumba Barat 601 468 77.9 301 65.7 242 0.75 2.09 439 1.02 3.28 Sumba Timur 600 488 81.3 444 92.5 305 0.75 0.70 400 0.63 0.78 TTS 600 573 95.5 511 90.3 62 0.48 0.44 550 0.57 0.55
Total 4207 3402 80.9 2832 84.6 1560 0.64 1.37 2833 0.69 1.54

57
TABLE 22 - TOOLS USED FOR CULTIVATING LAND BY DISTRICT
District
Hand tools
(sickle and
hand hoe)
Hand
tractor
Animal
plough
Big
tractor n
% Alor 99.6 0.4 0.0 0.0 456 Kupang 80.0 9.1 0.8 0.6 474 Manggarai 64.8 9.9 13.6 0.6 477 Rote Ndao 60.9 25.3 3.4 5.4 443 Sumba Barat 66.4 15.8 11.8 0.0 467 Sumba Timur 57.6 26.5 4.5 0.0 486 TTS 97.0 2.1 0.0 0.0 561
Total 75.7 12.5 4.8 0.9 3364
TABLE 23 - ACCESS TO AGRICULTURE MACHINERY AND REASONS FOR NOT HAVING ACCESS
Reasons for not having access to machinery n
District
Had access
to
machinery
n High
price
Lack of
capital/fund
No need for
it Other
Alor 6.9 452 6.4 22.5 67.4 3.7 31 Kupang 19.7 457 18.0 25.6 43.9 12.5 90 Manggarai 29.4 477 18.0 35.3 12.6 34.0 140 Rote Ndao 27.6 442 31.1 45.5 17.6 5.7 122 Sumba Barat 27.0 460 23.1 31.6 37.4 7.9 124 Sumba Timur 47.5 476 28.9 51.3 7.8 12.1 226 TTS 9.2 546 24.9 32.3 33.2 9.6 50
Total 23.7 3310 20.8 33.5 33.9 11.8 783
6.2.5 Incomes and livelihoods
6.2.5.1 Levels of income As stated in the introduction, NTT is one of Indonesia’s poorest Provinces, and this is reflected in the income figures which were found in this study. TABLE 24 - MEAN HOUSEHOLD YEARLY INCOME IN THE PREVIOUS YEAR (2008) BY DISTRICT (IDR)
District n Mean SE Min Max
Alor 600 8,229,376 356,774 100,000 66,800,000 Kupang 605 10,302,978 499,074 352,400 118,500,000 Manggarai 600 4,042,728 281,017 70,000 74,000,000 Rote Ndao 601 7,875,661 460,726 225,000 84,400,000 Sumba Barat 601 11,599,350 529,190 218,000 103,000,000 Sumba Timur 600 7,755,854 412,900 90,000 92,400,000 TTS 593 3,588,714 216,241 10,000 48,250,000
Total 4200 7,638,730 160,061 10,000 118,500,000
In total, the average yearly income was calculated at IDR 7,638,730 per household in 2008. The highest level was reported in Sumba Barat, followed by Kupang, while two lowest levels were revealed in TTS and Manggarai.
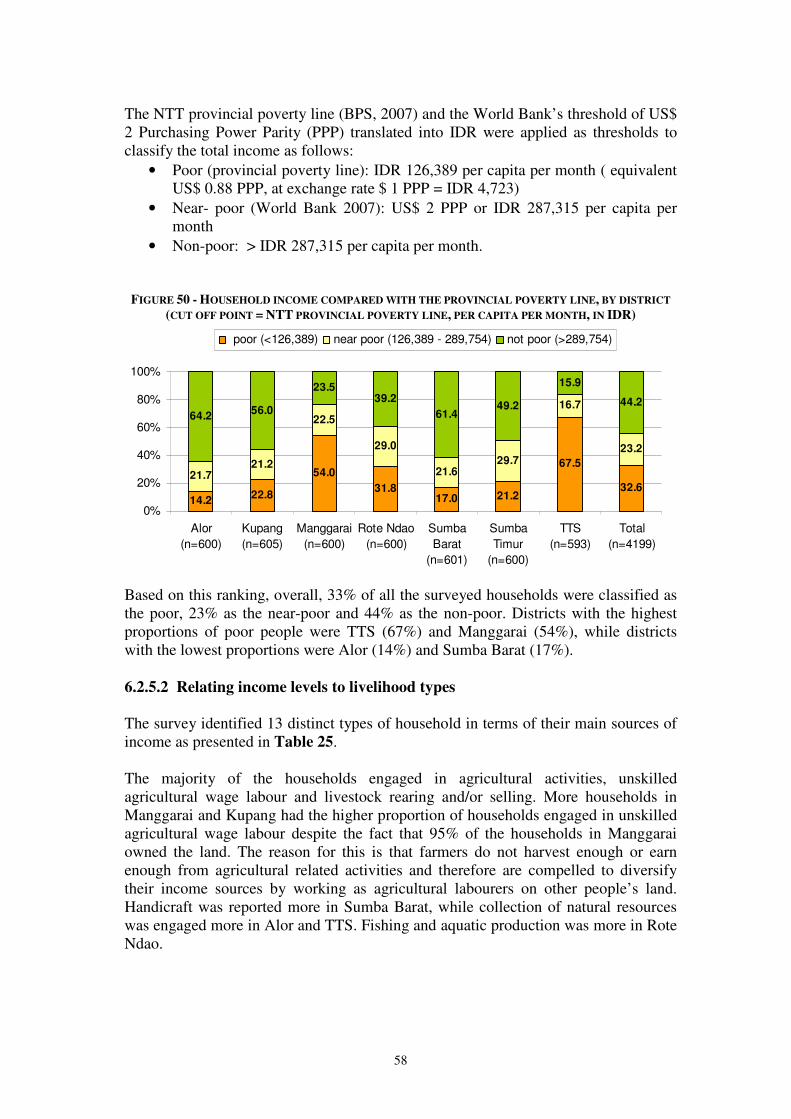
58
The NTT provincial poverty line (BPS, 2007) and the World Bank’s threshold of US$ 2 Purchasing Power Parity (PPP) translated into IDR were applied as thresholds to classify the total income as follows:
• Poor (provincial poverty line): IDR 126,389 per capita per month ( equivalent US$ 0.88 PPP, at exchange rate $ 1 PPP = IDR 4,723)
• Near- poor (World Bank 2007): US$ 2 PPP or IDR 287,315 per capita per month
• Non-poor: > IDR 287,315 per capita per month.
FIGURE 50 - HOUSEHOLD INCOME COMPARED WITH THE PROVINCIAL POVERTY LINE, BY DISTRICT
(CUT OFF POINT = NTT PROVINCIAL POVERTY LINE, PER CAPITA PER MONTH, IN IDR)
14.222.8
54.0
31.817.0 21.2
67.5
32.621.7
21.2
22.5
29.0
21.629.7
16.7
23.2
64.256.0
23.539.2
61.449.2
15.9
44.2
0%
20%
40%
60%
80%
100%
Alor
(n=600)
Kupang
(n=605)
Manggarai
(n=600)
Rote Ndao
(n=600)
Sumba
Barat
(n=601)
Sumba
Timur
(n=600)
TTS
(n=593)
Total
(n=4199)
poor (<126,389) near poor (126,389 - 289,754) not poor (>289,754)
Based on this ranking, overall, 33% of all the surveyed households were classified as the poor, 23% as the near-poor and 44% as the non-poor. Districts with the highest proportions of poor people were TTS (67%) and Manggarai (54%), while districts with the lowest proportions were Alor (14%) and Sumba Barat (17%). 6.2.5.2 Relating income levels to livelihood types The survey identified 13 distinct types of household in terms of their main sources of income as presented in Table 25. The majority of the households engaged in agricultural activities, unskilled agricultural wage labour and livestock rearing and/or selling. More households in Manggarai and Kupang had the higher proportion of households engaged in unskilled agricultural wage labour despite the fact that 95% of the households in Manggarai owned the land. The reason for this is that farmers do not harvest enough or earn enough from agricultural related activities and therefore are compelled to diversify their income sources by working as agricultural labourers on other people’s land. Handicraft was reported more in Sumba Barat, while collection of natural resources was engaged more in Alor and TTS. Fishing and aquatic production was more in Rote Ndao.
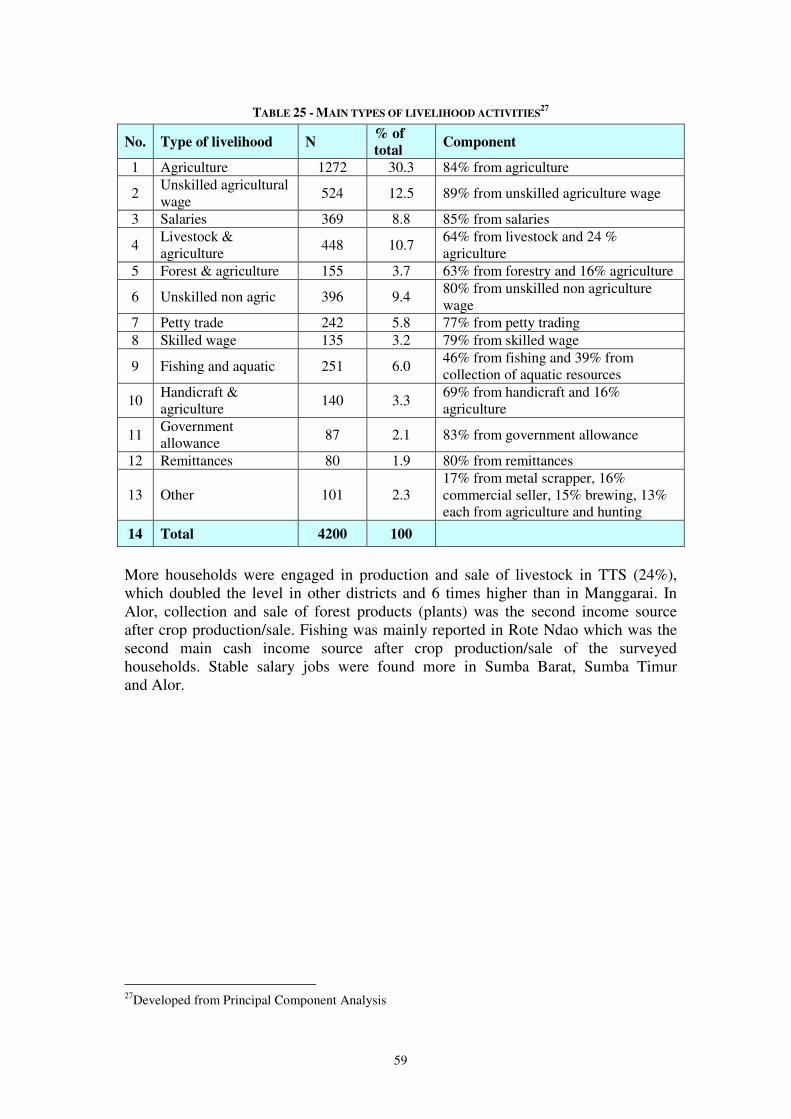
59
TABLE 25 - MAIN TYPES OF LIVELIHOOD ACTIVITIES27
No. Type of livelihood N % of
total Component
1 Agriculture 1272 30.3 84% from agriculture
2 Unskilled agricultural wage
524 12.5 89% from unskilled agriculture wage
3 Salaries 369 8.8 85% from salaries
4 Livestock & agriculture 448 10.7
64% from livestock and 24 % agriculture
5 Forest & agriculture 155 3.7 63% from forestry and 16% agriculture
6 Unskilled non agric 396 9.4 80% from unskilled non agriculture wage
7 Petty trade 242 5.8 77% from petty trading 8 Skilled wage 135 3.2 79% from skilled wage
9 Fishing and aquatic 251 6.0 46% from fishing and 39% from collection of aquatic resources
10 Handicraft & agriculture 140 3.3
69% from handicraft and 16% agriculture
11 Government allowance 87 2.1 83% from government allowance
12 Remittances 80 1.9 80% from remittances
13 Other 101 2.3 17% from metal scrapper, 16% commercial seller, 15% brewing, 13% each from agriculture and hunting
14 Total 4200 100
More households were engaged in production and sale of livestock in TTS (24%), which doubled the level in other districts and 6 times higher than in Manggarai. In Alor, collection and sale of forest products (plants) was the second income source after crop production/sale. Fishing was mainly reported in Rote Ndao which was the second main cash income source after crop production/sale of the surveyed households. Stable salary jobs were found more in Sumba Barat, Sumba Timur and Alor.
27Developed from Principal Component Analysis
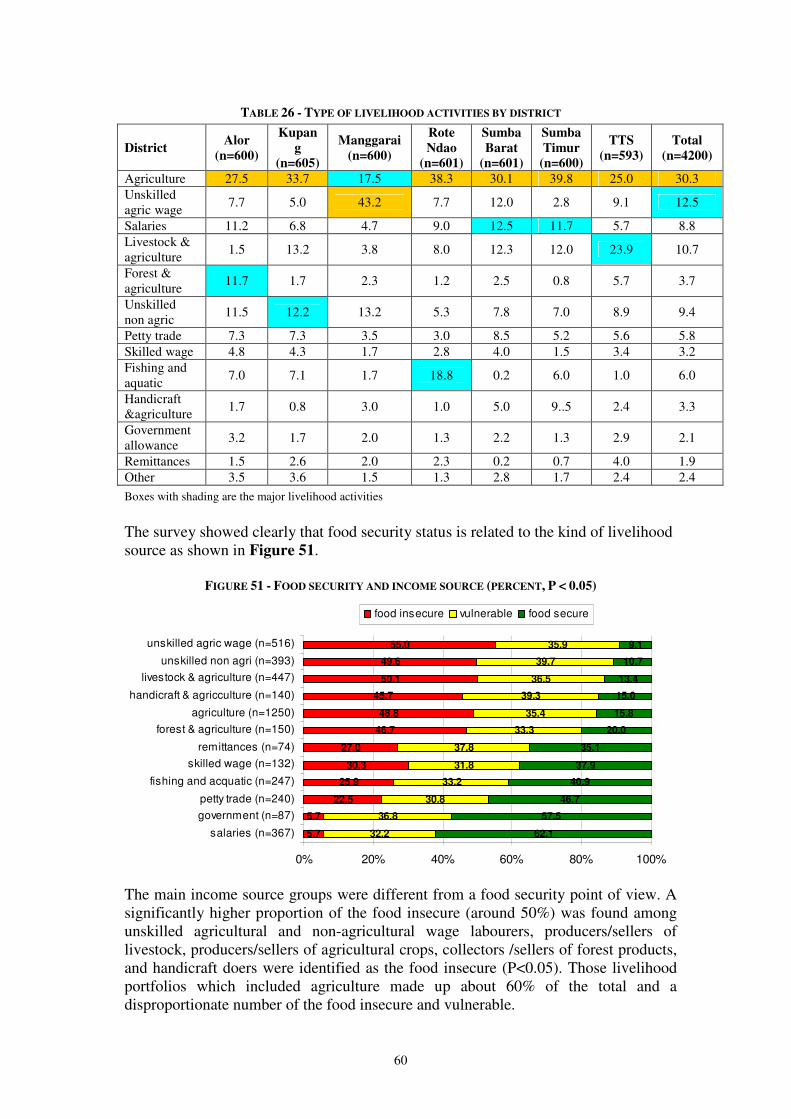
60
TABLE 26 - TYPE OF LIVELIHOOD ACTIVITIES BY DISTRICT
District Alor
(n=600)
Kupan
g
(n=605)
Manggarai
(n=600)
Rote
Ndao
(n=601)
Sumba
Barat
(n=601)
Sumba
Timur
(n=600)
TTS
(n=593)
Total
(n=4200)
Agriculture 27.5 33.7 17.5 38.3 30.1 39.8 25.0 30.3 Unskilled agric wage
7.7 5.0 43.2 7.7 12.0 2.8 9.1 12.5
Salaries 11.2 6.8 4.7 9.0 12.5 11.7 5.7 8.8 Livestock & agriculture
1.5 13.2 3.8 8.0 12.3 12.0 23.9 10.7
Forest & agriculture
11.7 1.7 2.3 1.2 2.5 0.8 5.7 3.7
Unskilled non agric
11.5 12.2 13.2 5.3 7.8 7.0 8.9 9.4
Petty trade 7.3 7.3 3.5 3.0 8.5 5.2 5.6 5.8 Skilled wage 4.8 4.3 1.7 2.8 4.0 1.5 3.4 3.2 Fishing and aquatic
7.0 7.1 1.7 18.8 0.2 6.0 1.0 6.0
Handicraft &agriculture 1.7 0.8 3.0 1.0 5.0 9..5 2.4 3.3
Government allowance
3.2 1.7 2.0 1.3 2.2 1.3 2.9 2.1
Remittances 1.5 2.6 2.0 2.3 0.2 0.7 4.0 1.9 Other 3.5 3.6 1.5 1.3 2.8 1.7 2.4 2.4
Boxes with shading are the major livelihood activities
The survey showed clearly that food security status is related to the kind of livelihood source as shown in Figure 51.
FIGURE 51 - FOOD SECURITY AND INCOME SOURCE (PERCENT, P < 0.05)
5.7
5.7
22.5
25.9
30.3
27.0
46.7
48.8
45.7
50.1
49.6
55.0
32.2
36.8
30.8
33.2
31.8
37.8
33.3
35.4
39.3
36.5
39.7
35.9
62.1
57.5
46.7
40.9
37.9
35.1
20.0
15.8
15.0
13.4
10.7
9.1
0% 20% 40% 60% 80% 100%
salaries (n=367)
government (n=87)
petty trade (n=240)
fishing and acquatic (n=247)
skilled wage (n=132)
remittances (n=74)
forest & agriculture (n=150)
agriculture (n=1250)
handicraft & agricculture (n=140)
livestock & agriculture (n=447)
unskilled non agri (n=393)
unskilled agric wage (n=516)
food insecure vulnerable food secure
The main income source groups were different from a food security point of view. A significantly higher proportion of the food insecure (around 50%) was found among unskilled agricultural and non-agricultural wage labourers, producers/sellers of livestock, producers/sellers of agricultural crops, collectors /sellers of forest products, and handicraft doers were identified as the food insecure (P<0.05). Those livelihood portfolios which included agriculture made up about 60% of the total and a disproportionate number of the food insecure and vulnerable.
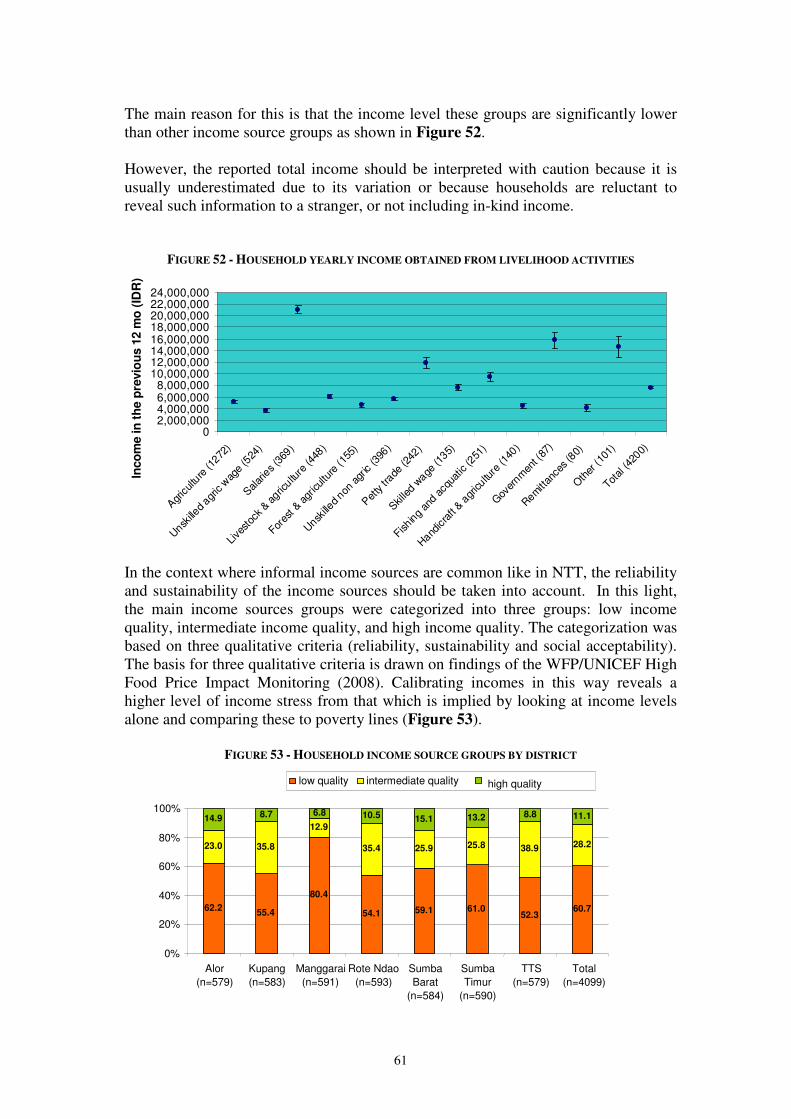
61
The main reason for this is that the income level these groups are significantly lower than other income source groups as shown in Figure 52. However, the reported total income should be interpreted with caution because it is usually underestimated due to its variation or because households are reluctant to reveal such information to a stranger, or not including in-kind income.
FIGURE 52 - HOUSEHOLD YEARLY INCOME OBTAINED FROM LIVELIHOOD ACTIVITIES
02,000,0004,000,0006,000,0008,000,000
10,000,00012,000,00014,000,00016,000,00018,000,00020,000,00022,000,00024,000,000
Agr
icultu
re (1
272)
Unsk
illed agr
ic w
age
(524
)
Salar
ies (3
69)
Live
stoc
k & agric
ulture
(448
)
Fores
t & a
gricultu
re (1
55)
Unsk
illed non
agr
ic (3
96)
Pet
ty tr
ade (2
42)
Skille
d wage
(135)
Fishin
g an
d ac
quat
ic (2
51)
Hand
icra
ft & a
gricultu
re (1
40)
Gov
ernm
ent (
87)
Rem
ittan
ces (8
0)
Oth
er (1
01)
Total (4
200)
Inco
me in
th
e p
revio
us 1
2 m
o (
IDR
)
In the context where informal income sources are common like in NTT, the reliability and sustainability of the income sources should be taken into account. In this light, the main income sources groups were categorized into three groups: low income quality, intermediate income quality, and high income quality. The categorization was based on three qualitative criteria (reliability, sustainability and social acceptability). The basis for three qualitative criteria is drawn on findings of the WFP/UNICEF High Food Price Impact Monitoring (2008). Calibrating incomes in this way reveals a higher level of income stress from that which is implied by looking at income levels alone and comparing these to poverty lines (Figure 53).
FIGURE 53 - HOUSEHOLD INCOME SOURCE GROUPS BY DISTRICT
62.2 55.4
80.4 54.1 59.1 61.0
52.3 60.7
23.0 35.8 12.9
35.4 25.9 25.8 38.9 28.2
8.7 6.8 10.5 15.1 13.2 8.8 11.1 14.9
0%
20%
40%
60%
80%
100%
Alor (n=579)
Kupang (n=583)
Manggarai (n=591)
Rote Ndao (n=593)
Sumba Barat
(n=584)
Sumba Timur
(n=590)
TTS (n=579)
Total (n=4099)
low quality intermediate quality high quality
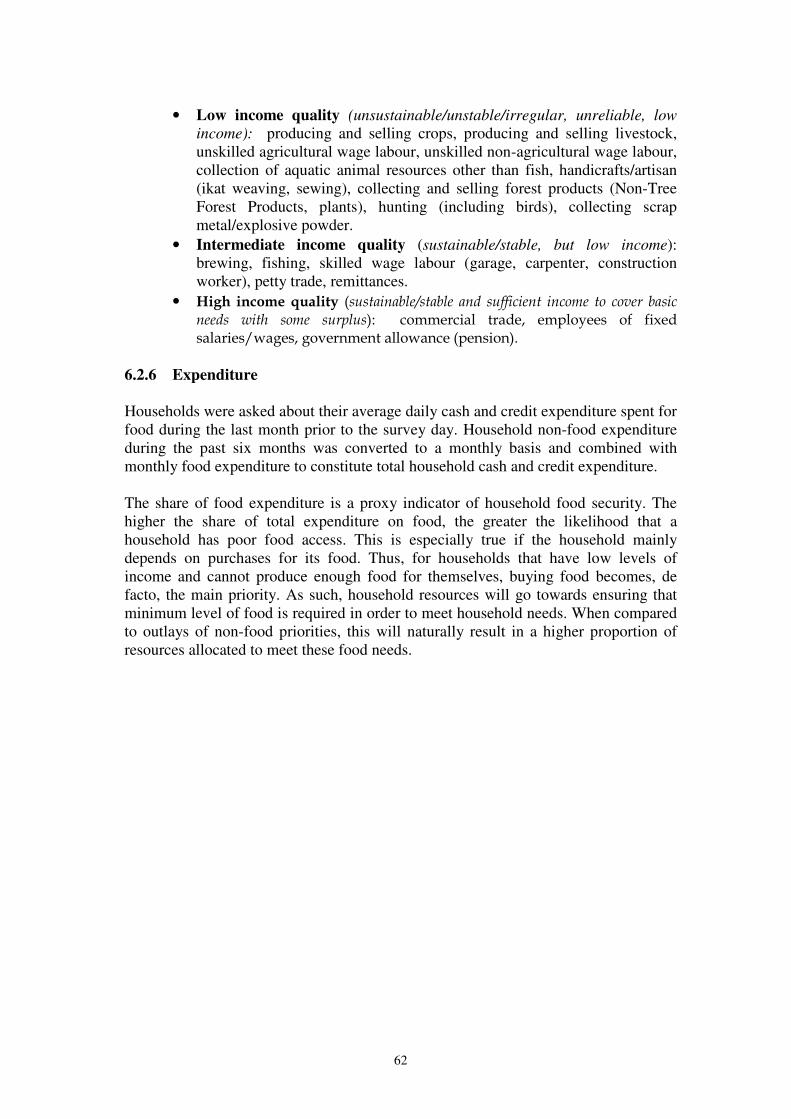
62
• Low income quality (unsustainable/unstable/irregular, unreliable, low
income): producing and selling crops, producing and selling livestock, unskilled agricultural wage labour, unskilled non-agricultural wage labour, collection of aquatic animal resources other than fish, handicrafts/artisan (ikat weaving, sewing), collecting and selling forest products (Non-Tree Forest Products, plants), hunting (including birds), collecting scrap metal/explosive powder.
• Intermediate income quality (sustainable/stable, but low income): brewing, fishing, skilled wage labour (garage, carpenter, construction worker), petty trade, remittances.
• High income quality (sustainable/stable and sufficient income to cover basic needs with some surplus): commercial trade, employees of fixed salaries/wages, government allowance (pension).
6.2.6 Expenditure Households were asked about their average daily cash and credit expenditure spent for food during the last month prior to the survey day. Household non-food expenditure during the past six months was converted to a monthly basis and combined with monthly food expenditure to constitute total household cash and credit expenditure. The share of food expenditure is a proxy indicator of household food security. The higher the share of total expenditure on food, the greater the likelihood that a household has poor food access. This is especially true if the household mainly depends on purchases for its food. Thus, for households that have low levels of income and cannot produce enough food for themselves, buying food becomes, de facto, the main priority. As such, household resources will go towards ensuring that minimum level of food is required in order to meet household needs. When compared to outlays of non-food priorities, this will naturally result in a higher proportion of resources allocated to meet these food needs.
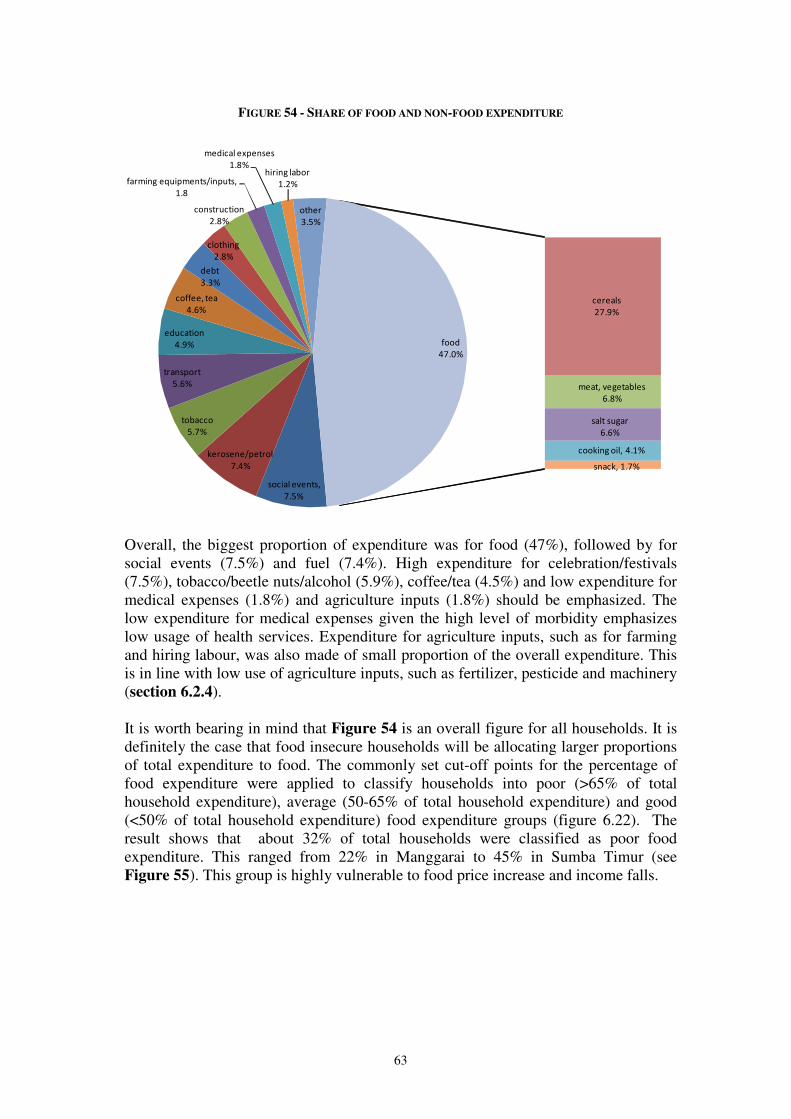
63
FIGURE 54 - SHARE OF FOOD AND NON-FOOD EXPENDITURE
social events,
7.5%
kerosene/petrol
7.4%
tobacco
5.7%
transport
5.6%
education
4.9%
coffee, tea
4.6%
debt
3.3%
clothing
2.8%
construction
2.8%
farming equipments/inputs,
1.8
medical expenses
1.8%hiring labor
1.2%
other
3.5%
cereals
27.9%
meat, vegetables
6.8%
salt sugar
6.6%
cooking oil, 4.1%
snack, 1.7%
food
47.0%
Overall, the biggest proportion of expenditure was for food (47%), followed by for social events (7.5%) and fuel (7.4%). High expenditure for celebration/festivals (7.5%), tobacco/beetle nuts/alcohol (5.9%), coffee/tea (4.5%) and low expenditure for medical expenses (1.8%) and agriculture inputs (1.8%) should be emphasized. The low expenditure for medical expenses given the high level of morbidity emphasizes low usage of health services. Expenditure for agriculture inputs, such as for farming and hiring labour, was also made of small proportion of the overall expenditure. This is in line with low use of agriculture inputs, such as fertilizer, pesticide and machinery (section 6.2.4). It is worth bearing in mind that Figure 54 is an overall figure for all households. It is definitely the case that food insecure households will be allocating larger proportions of total expenditure to food. The commonly set cut-off points for the percentage of food expenditure were applied to classify households into poor (>65% of total household expenditure), average (50-65% of total household expenditure) and good (<50% of total household expenditure) food expenditure groups (figure 6.22). The result shows that about 32% of total households were classified as poor food expenditure. This ranged from 22% in Manggarai to 45% in Sumba Timur (see Figure 55). This group is highly vulnerable to food price increase and income falls.
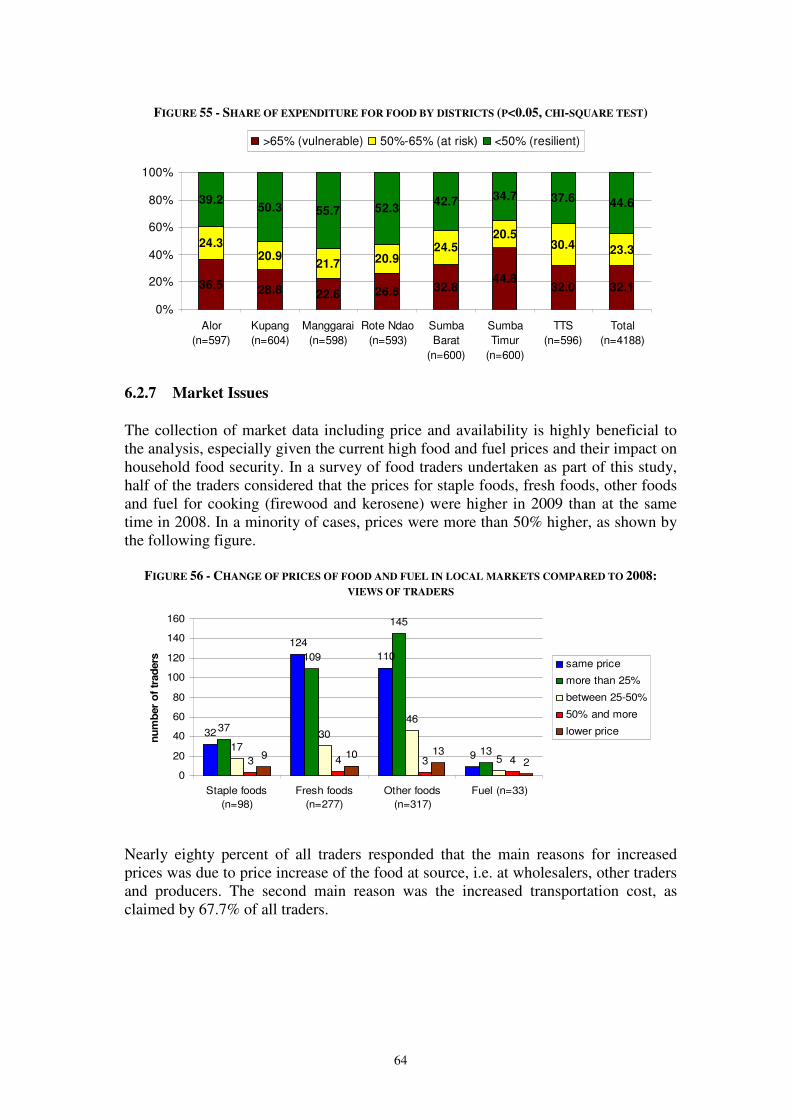
64
FIGURE 55 - SHARE OF EXPENDITURE FOR FOOD BY DISTRICTS (P<0.05, CHI-SQUARE TEST)
36.5 28.8 22.6 26.8 32.844.8
32.0 32.1
24.320.9
21.7 20.924.5
20.530.4 23.3
39.250.3 55.7 52.3
42.7 34.7 37.6 44.6
0%
20%
40%
60%
80%
100%
Alor
(n=597)
Kupang
(n=604)
Manggarai
(n=598)
Rote Ndao
(n=593)
Sumba
Barat
(n=600)
Sumba
Timur
(n=600)
TTS
(n=596)
Total
(n=4188)
>65% (vulnerable) 50%-65% (at risk) <50% (resilient)
6.2.7 Market Issues
The collection of market data including price and availability is highly beneficial to the analysis, especially given the current high food and fuel prices and their impact on household food security. In a survey of food traders undertaken as part of this study, half of the traders considered that the prices for staple foods, fresh foods, other foods and fuel for cooking (firewood and kerosene) were higher in 2009 than at the same time in 2008. In a minority of cases, prices were more than 50% higher, as shown by the following figure.
FIGURE 56 - CHANGE OF PRICES OF FOOD AND FUEL IN LOCAL MARKETS COMPARED TO 2008:
VIEWS OF TRADERS
32
124
110
9
37
109
145
1317
30
46
53 4 3 49 10 132
0
20
40
60
80
100
120
140
160
Staple foods
(n=98)
Fresh foods
(n=277)
Other foods
(n=317)
Fuel (n=33)
nu
mb
er
of
trad
ers same price
more than 25%
between 25-50%
50% and more
lower price
Nearly eighty percent of all traders responded that the main reasons for increased prices was due to price increase of the food at source, i.e. at wholesalers, other traders and producers. The second main reason was the increased transportation cost, as claimed by 67.7% of all traders.

65
TABLE 27 - REASONS FOR INCREASED PRICE OF COMMODITIES: TRADERS VIEWS
Reasons Number of
traders %
Price at the source 224 79.0 Price of transportation 226 67.7 Taxes 216 15.7 Credit interest rate 212 11.8 Other 165 20.0
Traders were asked about changes in buying behaviours of their customers since the beginning of 2008, when the food prices increased significantly. Two main behavioural changes were reported. 81% cited that their customers had reduced quantity whilst 71% mentioned that their customers tended to buy cheaper foods.
FIGURE 57 - REACTIONS OF CONSUMERS TO INCREASED PRICES OF FOODS AND COOKING FUEL:
TRADERS VIEWS
71.1
81.0
20.7
0 10 20 30 40 50 60 70 80 90
Buy cheaper foods
buy in smaller quantity
other behaviour
(%)
6.2.8 Conclusions on incomes, expenditures and prices One third of the households engaged in pure agriculture activities. When agriculture as secondary activities and unskilled labour in agriculture was included, 60% of the households were engaged in agriculture. Even though agriculture was the major livelihood in the area, the income obtained from the agriculture was among the lowest; and was considered as being low income quality. Households relying on agriculture were also more likely to be food insecure than households not engaged in agriculture. Overall, share of food expenditure was about half of total expenditure, but and one third of the households were categorized as being vulnerable to price increases/ income falls – with a food expenditure of 65% or more of overall expenditure. The price of foods and fuel in year 2009 was higher than in 2008. This will have been a particular problem for those households in the vulnerable expenditure category. Traders report that consumers have bee responding to price increases by buying in smaller quantity and switching to cheaper foods, and this may reduce quality and quantity of food intake.
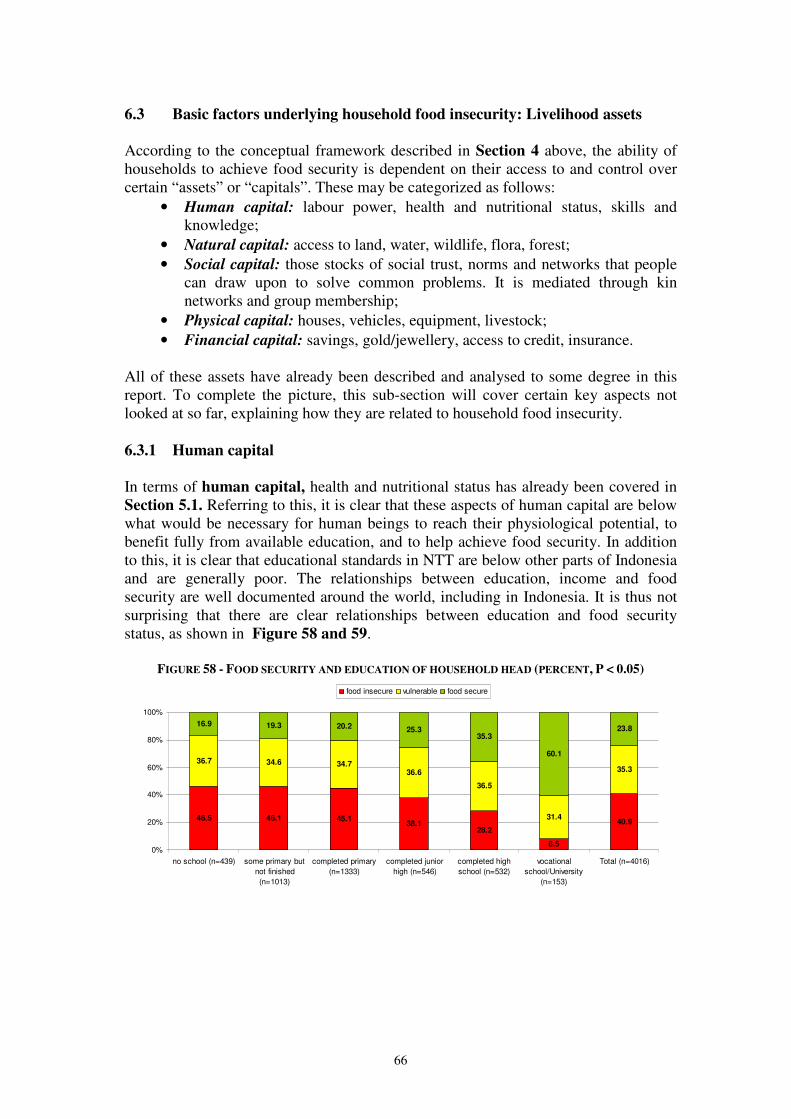
66
6.3 Basic factors underlying household food insecurity: Livelihood assets
According to the conceptual framework described in Section 4 above, the ability of households to achieve food security is dependent on their access to and control over certain “assets” or “capitals”. These may be categorized as follows:
• Human capital: labour power, health and nutritional status, skills and knowledge;
• Natural capital: access to land, water, wildlife, flora, forest; • Social capital: those stocks of social trust, norms and networks that people
can draw upon to solve common problems. It is mediated through kin networks and group membership;
• Physical capital: houses, vehicles, equipment, livestock; • Financial capital: savings, gold/jewellery, access to credit, insurance.
All of these assets have already been described and analysed to some degree in this report. To complete the picture, this sub-section will cover certain key aspects not looked at so far, explaining how they are related to household food insecurity. 6.3.1 Human capital In terms of human capital, health and nutritional status has already been covered in Section 5.1. Referring to this, it is clear that these aspects of human capital are below what would be necessary for human beings to reach their physiological potential, to benefit fully from available education, and to help achieve food security. In addition to this, it is clear that educational standards in NTT are below other parts of Indonesia and are generally poor. The relationships between education, income and food security are well documented around the world, including in Indonesia. It is thus not surprising that there are clear relationships between education and food security status, as shown in Figure 58 and 59.
FIGURE 58 - FOOD SECURITY AND EDUCATION OF HOUSEHOLD HEAD (PERCENT, P < 0.05)
46.5 46.1 45.138.1
28.2
8.5
40.9
36.7 34.6 34.736.6
36.5
31.4
35.3
16.9 19.3 20.2 25.335.3
60.1
23.8
0%
20%
40%
60%
80%
100%
no school (n=439) some primary but
not finished
(n=1013)
completed primary
(n=1333)
completed junior
high (n=546)
completed high
school (n=532)
vocational
school/University
(n=153)
Total (n=4016)
food insecure vulnerable food secure
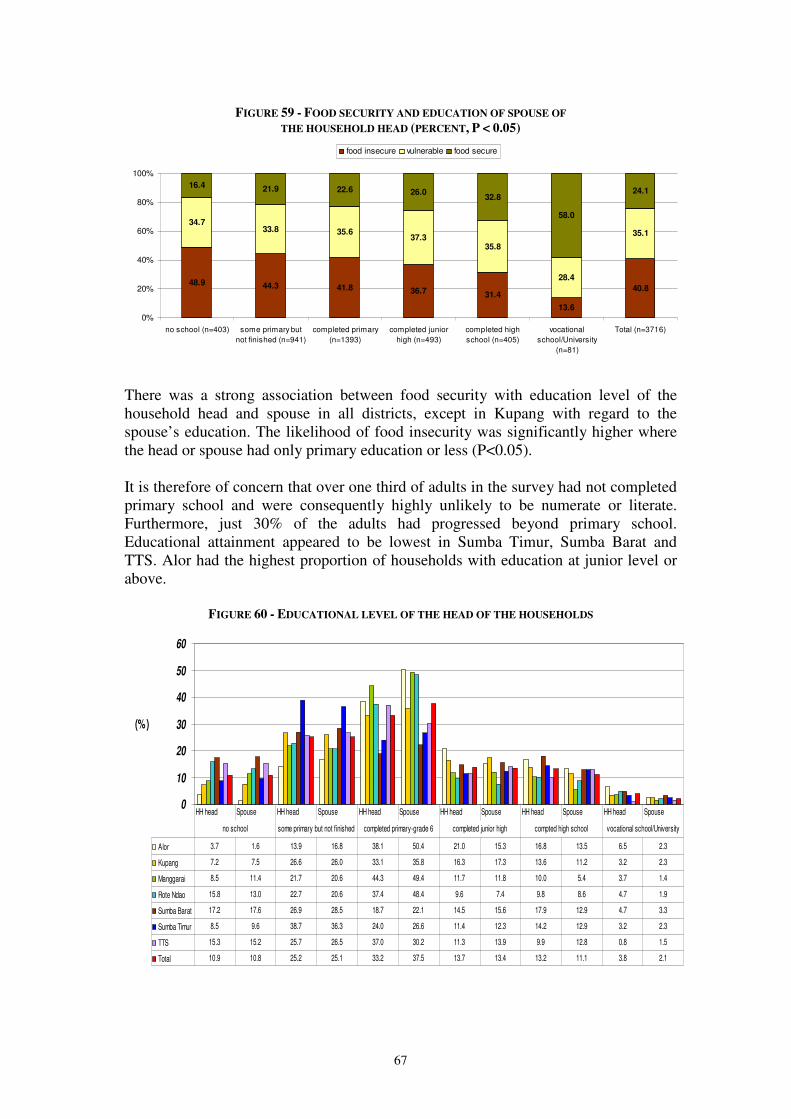
67
FIGURE 59 - FOOD SECURITY AND EDUCATION OF SPOUSE OF
THE HOUSEHOLD HEAD (PERCENT, P < 0.05)
48.9 44.3 41.8 36.7 31.4
13.6
40.8
34.733.8 35.6
37.335.8
28.4
35.1
16.4 21.9 22.6 26.032.8
58.0
24.1
0%
20%
40%
60%
80%
100%
no school (n=403) some primary but
not finished (n=941)
completed primary
(n=1393)
completed junior
high (n=493)
completed high
school (n=405)
vocational
school/University
(n=81)
Total (n=3716)
food insecure vulnerable food secure
There was a strong association between food security with education level of the household head and spouse in all districts, except in Kupang with regard to the spouse’s education. The likelihood of food insecurity was significantly higher where the head or spouse had only primary education or less (P<0.05). It is therefore of concern that over one third of adults in the survey had not completed primary school and were consequently highly unlikely to be numerate or literate. Furthermore, just 30% of the adults had progressed beyond primary school. Educational attainment appeared to be lowest in Sumba Timur, Sumba Barat and TTS. Alor had the highest proportion of households with education at junior level or above.
FIGURE 60 - EDUCATIONAL LEVEL OF THE HEAD OF THE HOUSEHOLDS
0
10
20
30
40
50
60
(%)
Alor 3.7 1.6 13.9 16.8 38.1 50.4 21.0 15.3 16.8 13.5 6.5 2.3
Kupang 7.2 7.5 26.6 26.0 33.1 35.8 16.3 17.3 13.6 11.2 3.2 2.3
Manggarai 8.5 11.4 21.7 20.6 44.3 49.4 11.7 11.8 10.0 5.4 3.7 1.4
Rote Ndao 15.8 13.0 22.7 20.6 37.4 48.4 9.6 7.4 9.8 8.6 4.7 1.9
Sumba Barat 17.2 17.6 26.9 28.5 18.7 22.1 14.5 15.6 17.9 12.9 4.7 3.3
Sumba Timur 8.5 9.6 38.7 36.3 24.0 26.6 11.4 12.3 14.2 12.9 3.2 2.3
TTS 15.3 15.2 25.7 26.5 37.0 30.2 11.3 13.9 9.9 12.8 0.8 1.5
Total 10.9 10.8 25.2 25.1 33.2 37.5 13.7 13.4 13.2 11.1 3.8 2.1
HH head Spouse HH head Spouse HH head Spouse HH head Spouse HH head Spouse HH head Spouse
no school some primary but not finished completed primary-grade 6 completed junior high compted high school vocational school/University

68
6.3.2 Natural capital
The most important issue here is access to land for agricultural cultivation. The small land sizes place limits on possible crop production, as highlighted by survey respondents particularly in Manggarai and Sumba Barat as has been shown in Table 21 (Section 6.2.4.5). Water is generally scarce in NTT province due to low precipitation and limited productivity of local aquifers (ACF 2007). Approximately 84% of the households owned their cultivated land. It is usual for households to distribute land to their children, and therefore as population increases, land distributed to the children is getting less. Land ownership was on average 0.6 Ha and only 30% of the households had land >0.5 Ha (Section 6.2.4.5). This assessment showed that size of land had a significant association with crop production and this in turn had a significant association with household food security status.
6.3.3 Social capital Social capital may act as a form of community safety net which households can turn to in hard times for support. The state of social capital is therefore of some importance in relation to household food security. The kinds of support and the ways in which it is given may vary widely, but characteristically loans and gifts of cash and food are key expressions. In this study, social capital was assessed in two ways: first by gauging the levels of financial and material support received from local institutions and family and second by looking at group membership based organizations operating at community level. On one level, levels of material and financial support received from family and local (non-financial) institutions appeared extremely limited. For example, the proportion of household reporting that they had received some material or financial support from family was just 8% overall (ranging from 4% in Alor to 20% in TTS). Similarly, proportions of households drawing support from cooperatives and local charities was well below 10% in each district. Having said this however, there is also evidence that when times are hard, a much higher proportion of families do receive support. As is clear from Section 6.3.5 below, borrowing food from relatives and borrowing money are coping strategies which are employed by significant proportions of households. On the face of it, these findings are contradictory: extremely low proportions of households receiving support from family and friends on the one hand and large numbers benefiting from such support in hard times on the other. The reason for this paradox might be that households were interpreting the question about family support as applying in normal times, as opposed to times of stress. Thus whereas normally speaking the reliance on social capital is limited, in hard times this increases significantly as coping strategies are widely employed. Through conducting semi-structured interviews with community leaders at village level and women in focus groups, a number of Community Based Organisations
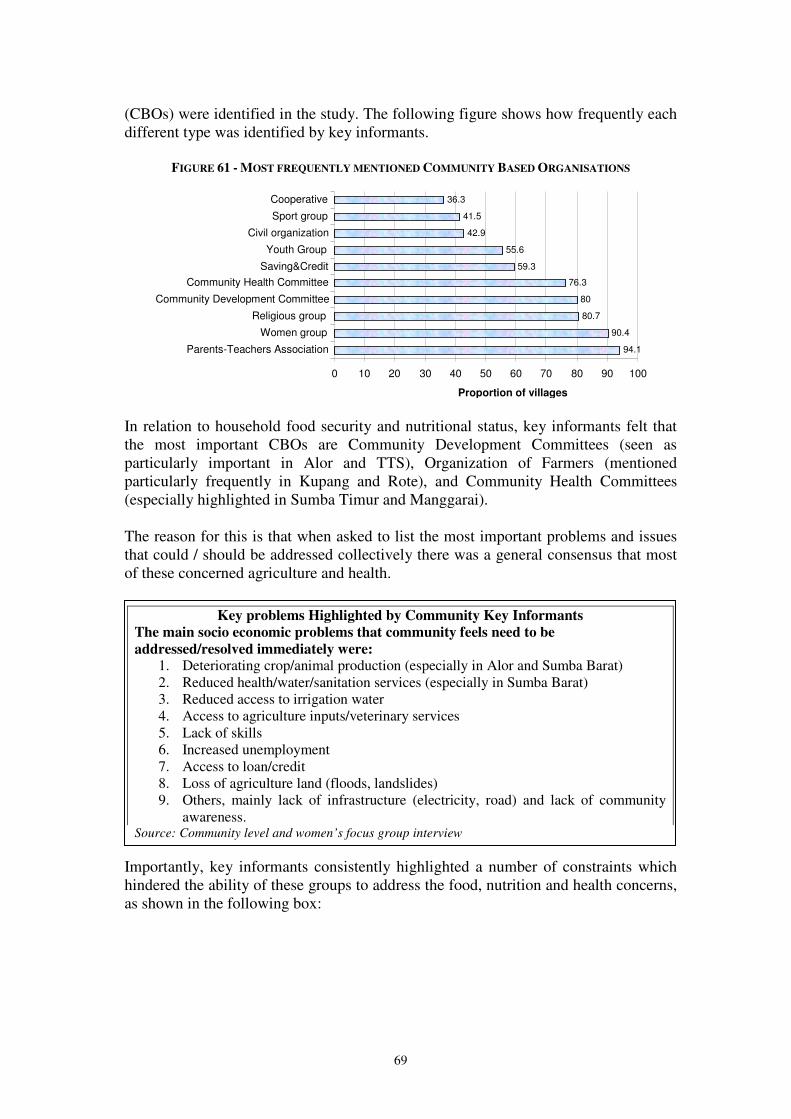
69
(CBOs) were identified in the study. The following figure shows how frequently each different type was identified by key informants.
FIGURE 61 - MOST FREQUENTLY MENTIONED COMMUNITY BASED ORGANISATIONS
In relation to household food security and nutritional status, key informants felt that the most important CBOs are Community Development Committees (seen as particularly important in Alor and TTS), Organization of Farmers (mentioned particularly frequently in Kupang and Rote), and Community Health Committees (especially highlighted in Sumba Timur and Manggarai). The reason for this is that when asked to list the most important problems and issues that could / should be addressed collectively there was a general consensus that most of these concerned agriculture and health. Importantly, key informants consistently highlighted a number of constraints which hindered the ability of these groups to address the food, nutrition and health concerns, as shown in the following box:
94.1 90.4
80.7 80
76.3 59.3
55.6 42.9
41.5 36.3
0 10 20 30 40 50 60 70 80 90 100
Parents-Teachers Association Women group
Religious group Community Development Committee
Community Health Committee Saving&Credit Youth Group
Civil organization Sport group Cooperative
Proportion of villages
Key problems Highlighted by Community Key Informants
The main socio economic problems that community feels need to be
addressed/resolved immediately were: 1. Deteriorating crop/animal production (especially in Alor and Sumba Barat) 2. Reduced health/water/sanitation services (especially in Sumba Barat) 3. Reduced access to irrigation water 4. Access to agriculture inputs/veterinary services 5. Lack of skills 6. Increased unemployment 7. Access to loan/credit 8. Loss of agriculture land (floods, landslides) 9. Others, mainly lack of infrastructure (electricity, road) and lack of community
awareness. Source: Community level and women’s focus group interview
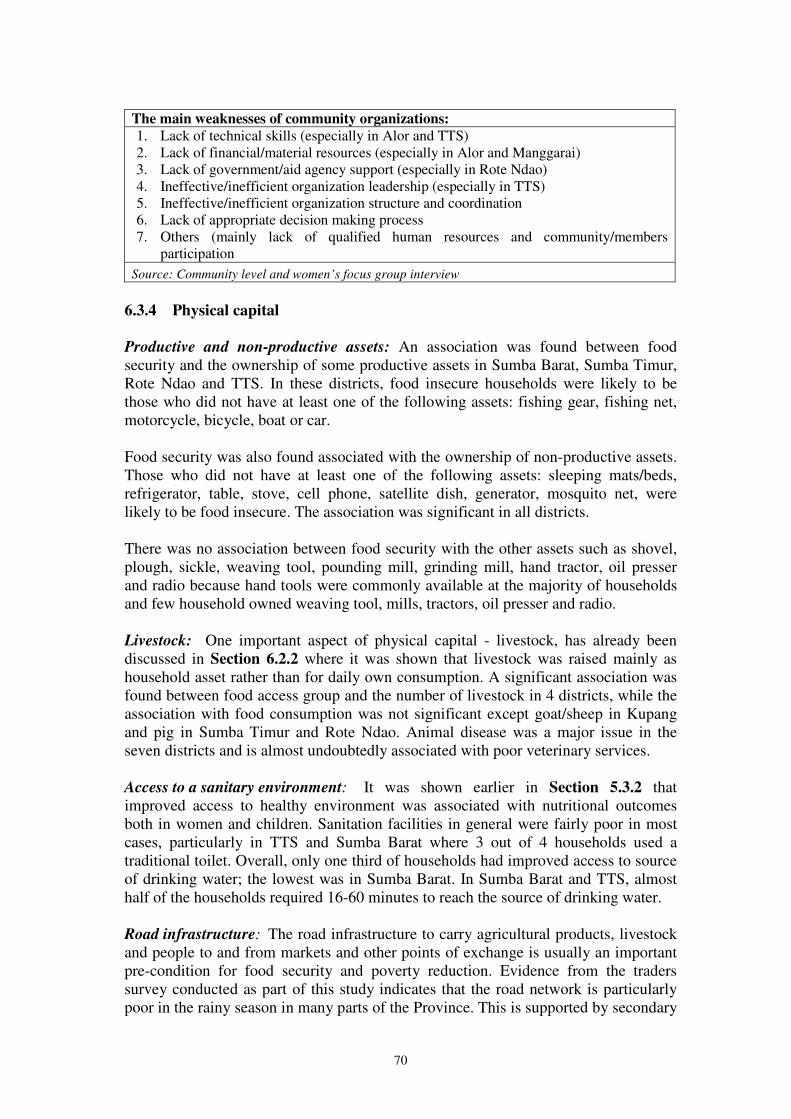
70
The main weaknesses of community organizations:
1. Lack of technical skills (especially in Alor and TTS) 2. Lack of financial/material resources (especially in Alor and Manggarai) 3. Lack of government/aid agency support (especially in Rote Ndao) 4. Ineffective/inefficient organization leadership (especially in TTS) 5. Ineffective/inefficient organization structure and coordination 6. Lack of appropriate decision making process 7. Others (mainly lack of qualified human resources and community/members
participation Source: Community level and women’s focus group interview
6.3.4 Physical capital Productive and non-productive assets: An association was found between food security and the ownership of some productive assets in Sumba Barat, Sumba Timur, Rote Ndao and TTS. In these districts, food insecure households were likely to be those who did not have at least one of the following assets: fishing gear, fishing net, motorcycle, bicycle, boat or car. Food security was also found associated with the ownership of non-productive assets. Those who did not have at least one of the following assets: sleeping mats/beds, refrigerator, table, stove, cell phone, satellite dish, generator, mosquito net, were likely to be food insecure. The association was significant in all districts. There was no association between food security with the other assets such as shovel, plough, sickle, weaving tool, pounding mill, grinding mill, hand tractor, oil presser and radio because hand tools were commonly available at the majority of households and few household owned weaving tool, mills, tractors, oil presser and radio. Livestock: One important aspect of physical capital - livestock, has already been discussed in Section 6.2.2 where it was shown that livestock was raised mainly as household asset rather than for daily own consumption. A significant association was found between food access group and the number of livestock in 4 districts, while the association with food consumption was not significant except goat/sheep in Kupang and pig in Sumba Timur and Rote Ndao. Animal disease was a major issue in the seven districts and is almost undoubtedly associated with poor veterinary services. Access to a sanitary environment: It was shown earlier in Section 5.3.2 that improved access to healthy environment was associated with nutritional outcomes both in women and children. Sanitation facilities in general were fairly poor in most cases, particularly in TTS and Sumba Barat where 3 out of 4 households used a traditional toilet. Overall, only one third of households had improved access to source of drinking water; the lowest was in Sumba Barat. In Sumba Barat and TTS, almost half of the households required 16-60 minutes to reach the source of drinking water. Road infrastructure: The road infrastructure to carry agricultural products, livestock and people to and from markets and other points of exchange is usually an important pre-condition for food security and poverty reduction. Evidence from the traders survey conducted as part of this study indicates that the road network is particularly poor in the rainy season in many parts of the Province. This is supported by secondary
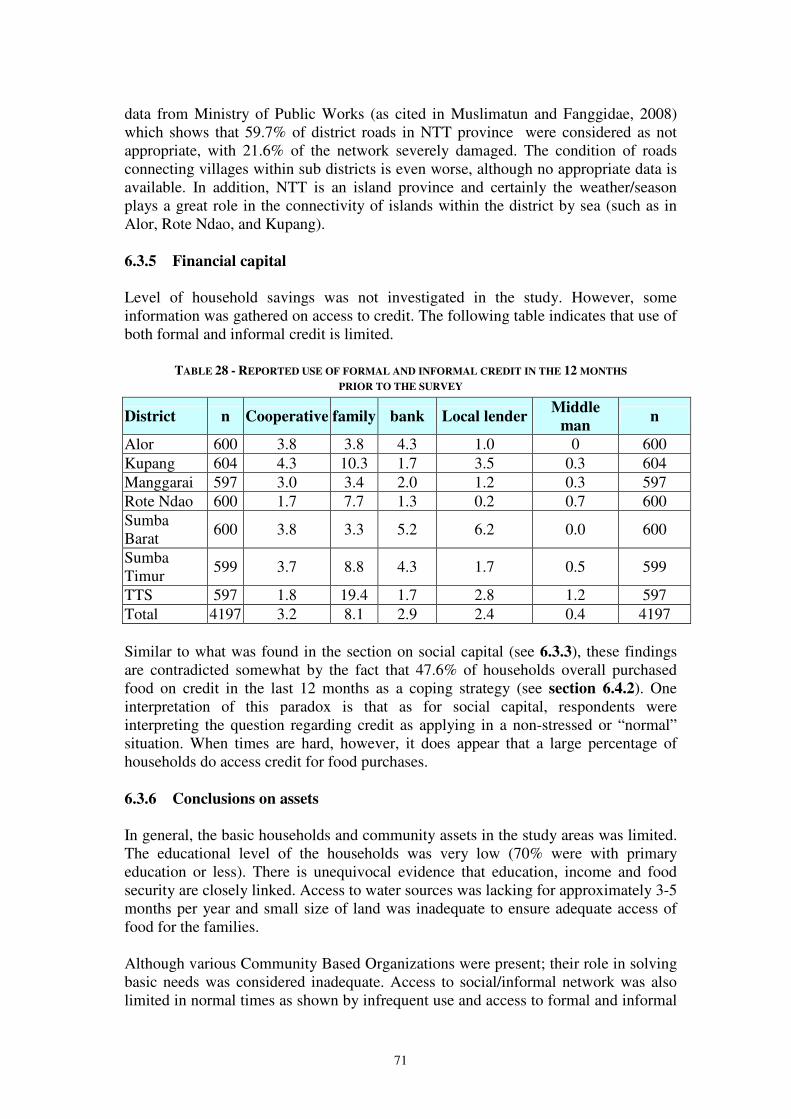
71
data from Ministry of Public Works (as cited in Muslimatun and Fanggidae, 2008) which shows that 59.7% of district roads in NTT province were considered as not appropriate, with 21.6% of the network severely damaged. The condition of roads connecting villages within sub districts is even worse, although no appropriate data is available. In addition, NTT is an island province and certainly the weather/season plays a great role in the connectivity of islands within the district by sea (such as in Alor, Rote Ndao, and Kupang). 6.3.5 Financial capital
Level of household savings was not investigated in the study. However, some information was gathered on access to credit. The following table indicates that use of both formal and informal credit is limited.
TABLE 28 - REPORTED USE OF FORMAL AND INFORMAL CREDIT IN THE 12 MONTHS
PRIOR TO THE SURVEY
District n Cooperative family bank Local lender Middle
man n
Alor 600 3.8 3.8 4.3 1.0 0 600 Kupang 604 4.3 10.3 1.7 3.5 0.3 604 Manggarai 597 3.0 3.4 2.0 1.2 0.3 597 Rote Ndao 600 1.7 7.7 1.3 0.2 0.7 600 Sumba Barat
600 3.8 3.3 5.2 6.2 0.0 600
Sumba Timur
599 3.7 8.8 4.3 1.7 0.5 599
TTS 597 1.8 19.4 1.7 2.8 1.2 597 Total 4197 3.2 8.1 2.9 2.4 0.4 4197 Similar to what was found in the section on social capital (see 6.3.3), these findings are contradicted somewhat by the fact that 47.6% of households overall purchased food on credit in the last 12 months as a coping strategy (see section 6.4.2). One interpretation of this paradox is that as for social capital, respondents were interpreting the question regarding credit as applying in a non-stressed or “normal” situation. When times are hard, however, it does appear that a large percentage of households do access credit for food purchases. 6.3.6 Conclusions on assets In general, the basic households and community assets in the study areas was limited. The educational level of the households was very low (70% were with primary education or less). There is unequivocal evidence that education, income and food security are closely linked. Access to water sources was lacking for approximately 3-5 months per year and small size of land was inadequate to ensure adequate access of food for the families. Although various Community Based Organizations were present; their role in solving basic needs was considered inadequate. Access to social/informal network was also limited in normal times as shown by infrequent use and access to formal and informal
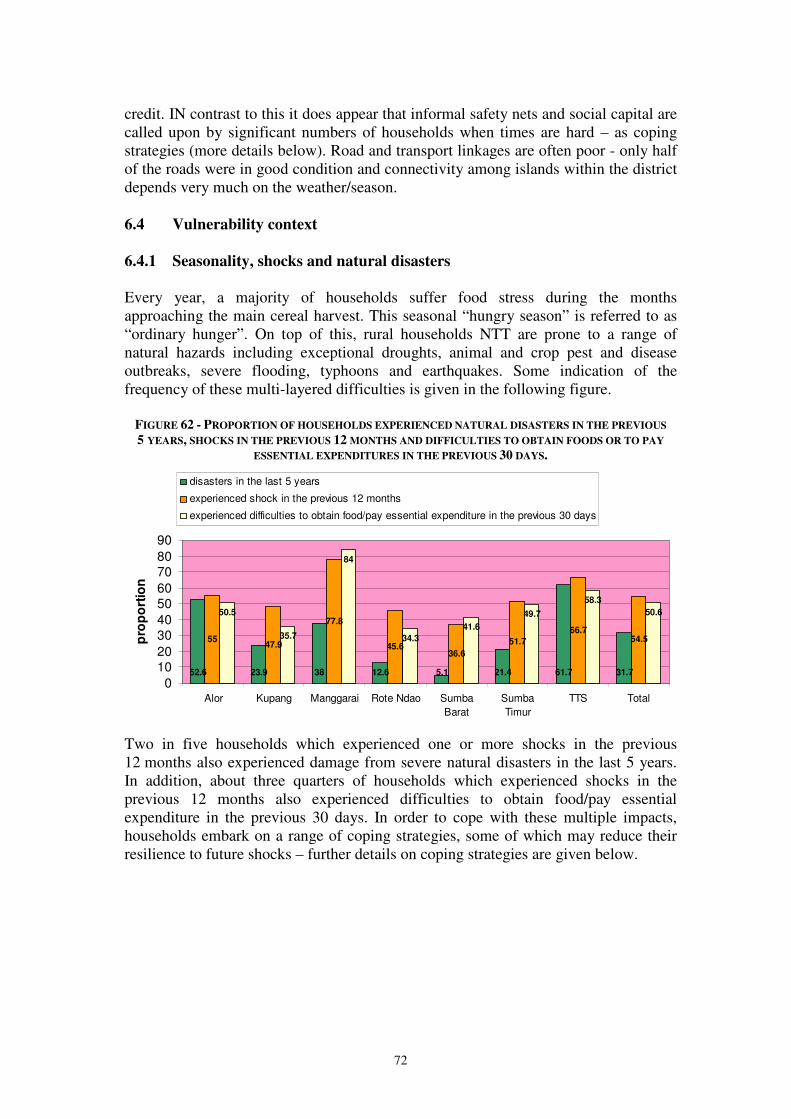
72
credit. IN contrast to this it does appear that informal safety nets and social capital are called upon by significant numbers of households when times are hard – as coping strategies (more details below). Road and transport linkages are often poor - only half of the roads were in good condition and connectivity among islands within the district depends very much on the weather/season. 6.4 Vulnerability context 6.4.1 Seasonality, shocks and natural disasters Every year, a majority of households suffer food stress during the months approaching the main cereal harvest. This seasonal “hungry season” is referred to as “ordinary hunger”. On top of this, rural households NTT are prone to a range of natural hazards including exceptional droughts, animal and crop pest and disease outbreaks, severe flooding, typhoons and earthquakes. Some indication of the frequency of these multi-layered difficulties is given in the following figure.
FIGURE 62 - PROPORTION OF HOUSEHOLDS EXPERIENCED NATURAL DISASTERS IN THE PREVIOUS
5 YEARS, SHOCKS IN THE PREVIOUS 12 MONTHS AND DIFFICULTIES TO OBTAIN FOODS OR TO PAY
ESSENTIAL EXPENDITURES IN THE PREVIOUS 30 DAYS.
52.6 23.9 38 12.6 5.1 21.4 61.7 31.7
5547.9
77.8
45.636.6
51.7
66.754.5
50.5
35.7
84
34.3
41.6
49.7
58.3
50.6
0
1020
3040
5060
7080
90
Alor Kupang Manggarai Rote Ndao Sumba
Barat
Sumba
Timur
TTS Total
pro
po
rtio
n
disasters in the last 5 years
experienced shock in the previous 12 months
experienced difficulties to obtain food/pay essential expenditure in the previous 30 days
Two in five households which experienced one or more shocks in the previous 12 months also experienced damage from severe natural disasters in the last 5 years. In addition, about three quarters of households which experienced shocks in the previous 12 months also experienced difficulties to obtain food/pay essential expenditure in the previous 30 days. In order to cope with these multiple impacts, households embark on a range of coping strategies, some of which may reduce their resilience to future shocks – further details on coping strategies are given below.
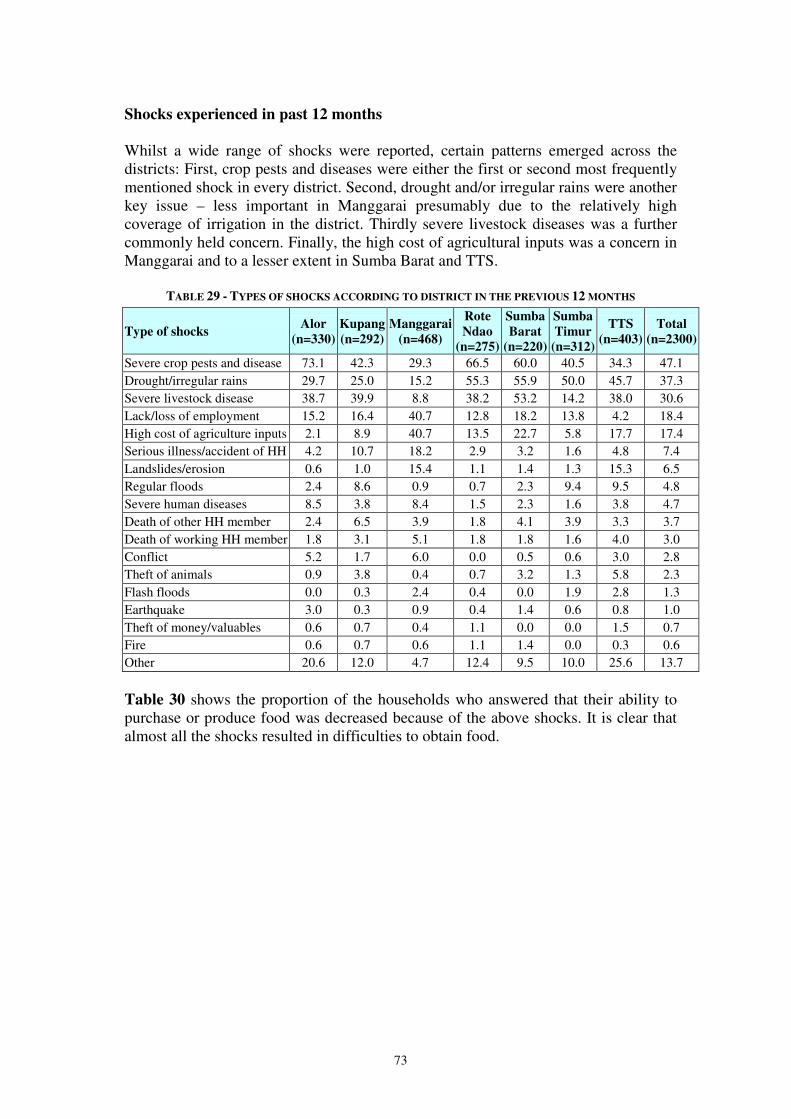
73
Shocks experienced in past 12 months Whilst a wide range of shocks were reported, certain patterns emerged across the districts: First, crop pests and diseases were either the first or second most frequently mentioned shock in every district. Second, drought and/or irregular rains were another key issue – less important in Manggarai presumably due to the relatively high coverage of irrigation in the district. Thirdly severe livestock diseases was a further commonly held concern. Finally, the high cost of agricultural inputs was a concern in Manggarai and to a lesser extent in Sumba Barat and TTS.
TABLE 29 - TYPES OF SHOCKS ACCORDING TO DISTRICT IN THE PREVIOUS 12 MONTHS
Type of shocks Alor
(n=330)
Kupang
(n=292)
Manggarai
(n=468)
Rote
Ndao
(n=275)
Sumba
Barat
(n=220)
Sumba
Timur
(n=312)
TTS
(n=403)
Total
(n=2300)
Severe crop pests and disease 73.1 42.3 29.3 66.5 60.0 40.5 34.3 47.1 Drought/irregular rains 29.7 25.0 15.2 55.3 55.9 50.0 45.7 37.3 Severe livestock disease 38.7 39.9 8.8 38.2 53.2 14.2 38.0 30.6 Lack/loss of employment 15.2 16.4 40.7 12.8 18.2 13.8 4.2 18.4 High cost of agriculture inputs 2.1 8.9 40.7 13.5 22.7 5.8 17.7 17.4 Serious illness/accident of HH 4.2 10.7 18.2 2.9 3.2 1.6 4.8 7.4 Landslides/erosion 0.6 1.0 15.4 1.1 1.4 1.3 15.3 6.5 Regular floods 2.4 8.6 0.9 0.7 2.3 9.4 9.5 4.8 Severe human diseases 8.5 3.8 8.4 1.5 2.3 1.6 3.8 4.7 Death of other HH member 2.4 6.5 3.9 1.8 4.1 3.9 3.3 3.7 Death of working HH member 1.8 3.1 5.1 1.8 1.8 1.6 4.0 3.0 Conflict 5.2 1.7 6.0 0.0 0.5 0.6 3.0 2.8 Theft of animals 0.9 3.8 0.4 0.7 3.2 1.3 5.8 2.3 Flash floods 0.0 0.3 2.4 0.4 0.0 1.9 2.8 1.3 Earthquake 3.0 0.3 0.9 0.4 1.4 0.6 0.8 1.0 Theft of money/valuables 0.6 0.7 0.4 1.1 0.0 0.0 1.5 0.7 Fire 0.6 0.7 0.6 1.1 1.4 0.0 0.3 0.6 Other 20.6 12.0 4.7 12.4 9.5 10.0 25.6 13.7
Table 30 shows the proportion of the households who answered that their ability to purchase or produce food was decreased because of the above shocks. It is clear that almost all the shocks resulted in difficulties to obtain food.
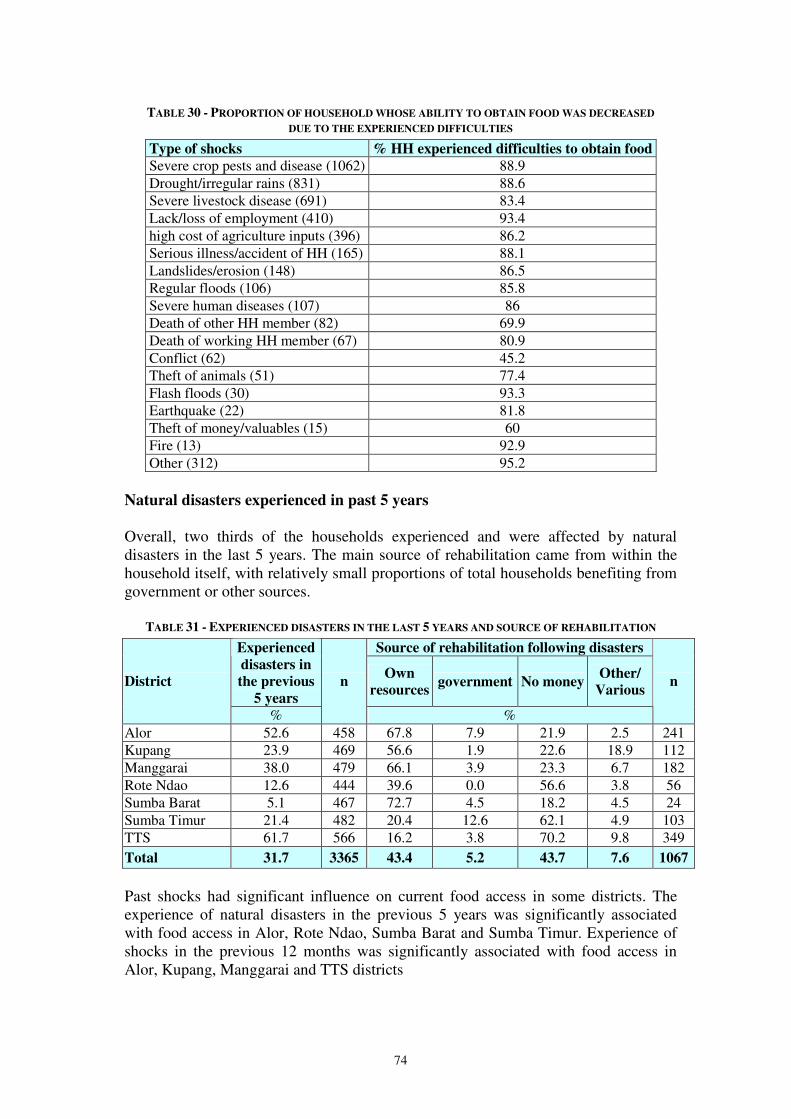
74
TABLE 30 - PROPORTION OF HOUSEHOLD WHOSE ABILITY TO OBTAIN FOOD WAS DECREASED
DUE TO THE EXPERIENCED DIFFICULTIES
Type of shocks % HH experienced difficulties to obtain food
Severe crop pests and disease (1062) 88.9 Drought/irregular rains (831) 88.6 Severe livestock disease (691) 83.4 Lack/loss of employment (410) 93.4 high cost of agriculture inputs (396) 86.2 Serious illness/accident of HH (165) 88.1 Landslides/erosion (148) 86.5 Regular floods (106) 85.8 Severe human diseases (107) 86 Death of other HH member (82) 69.9 Death of working HH member (67) 80.9 Conflict (62) 45.2 Theft of animals (51) 77.4 Flash floods (30) 93.3 Earthquake (22) 81.8 Theft of money/valuables (15) 60 Fire (13) 92.9 Other (312) 95.2
Natural disasters experienced in past 5 years Overall, two thirds of the households experienced and were affected by natural disasters in the last 5 years. The main source of rehabilitation came from within the household itself, with relatively small proportions of total households benefiting from government or other sources.
TABLE 31 - EXPERIENCED DISASTERS IN THE LAST 5 YEARS AND SOURCE OF REHABILITATION
Source of rehabilitation following disasters Experienced
disasters in
the previous
5 years
Own
resources government No money
Other/
Various District
%
n
%
n
Alor 52.6 458 67.8 7.9 21.9 2.5 241 Kupang 23.9 469 56.6 1.9 22.6 18.9 112 Manggarai 38.0 479 66.1 3.9 23.3 6.7 182 Rote Ndao 12.6 444 39.6 0.0 56.6 3.8 56 Sumba Barat 5.1 467 72.7 4.5 18.2 4.5 24 Sumba Timur 21.4 482 20.4 12.6 62.1 4.9 103 TTS 61.7 566 16.2 3.8 70.2 9.8 349 Total 31.7 3365 43.4 5.2 43.7 7.6 1067
Past shocks had significant influence on current food access in some districts. The experience of natural disasters in the previous 5 years was significantly associated with food access in Alor, Rote Ndao, Sumba Barat and Sumba Timur. Experience of shocks in the previous 12 months was significantly associated with food access in Alor, Kupang, Manggarai and TTS districts
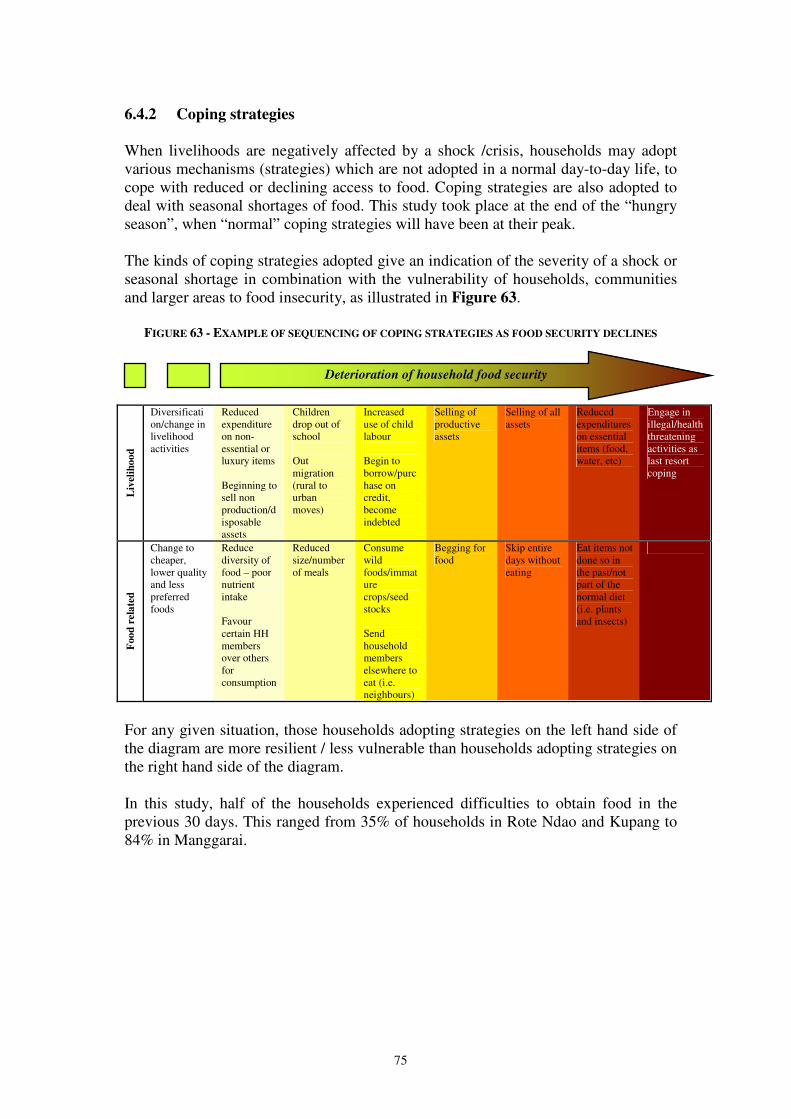
75
6.4.2 Coping strategies When livelihoods are negatively affected by a shock /crisis, households may adopt various mechanisms (strategies) which are not adopted in a normal day-to-day life, to cope with reduced or declining access to food. Coping strategies are also adopted to deal with seasonal shortages of food. This study took place at the end of the “hungry season”, when “normal” coping strategies will have been at their peak. The kinds of coping strategies adopted give an indication of the severity of a shock or seasonal shortage in combination with the vulnerability of households, communities and larger areas to food insecurity, as illustrated in Figure 63.
FIGURE 63 - EXAMPLE OF SEQUENCING OF COPING STRATEGIES AS FOOD SECURITY DECLINES
Liv
elih
oo
d
Diversification/change in livelihood activities
Reduced expenditure on non-essential or luxury items Beginning to sell non production/disposable assets
Children drop out of school Out migration (rural to urban moves)
Increased use of child labour Begin to borrow/purchase on credit, become indebted
Selling of productive assets
Selling of all assets
Reduced expenditures on essential items (food, water, etc)
Engage in illegal/health threatening activities as last resort coping
Foo
d r
ela
ted
Change to cheaper, lower quality and less preferred foods
Reduce diversity of food – poor nutrient intake Favour certain HH members over others for consumption
Reduced size/number of meals
Consume wild foods/immature crops/seed stocks Send household members elsewhere to eat (i.e. neighbours)
Begging for food
Skip entire days without eating
Eat items not done so in the past/not part of the normal diet (i.e. plants and insects)
For any given situation, those households adopting strategies on the left hand side of the diagram are more resilient / less vulnerable than households adopting strategies on the right hand side of the diagram. In this study, half of the households experienced difficulties to obtain food in the previous 30 days. This ranged from 35% of households in Rote Ndao and Kupang to 84% in Manggarai.
Deterioration of household food security
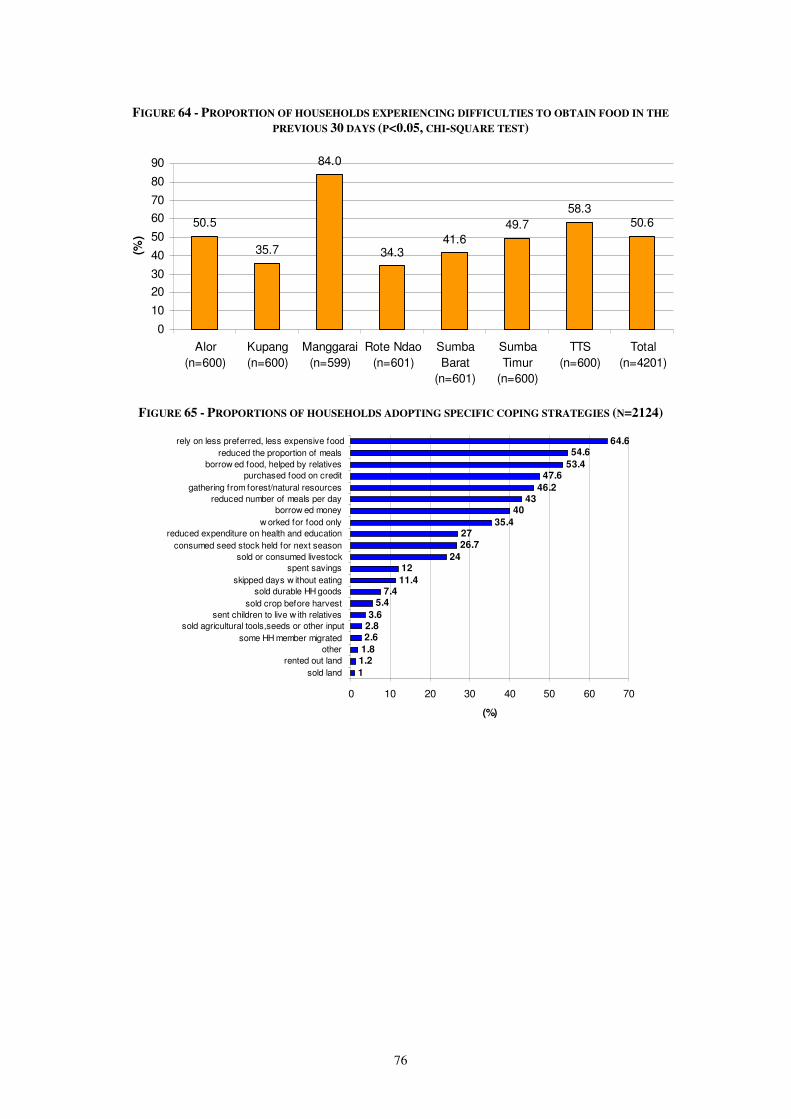
76
FIGURE 64 - PROPORTION OF HOUSEHOLDS EXPERIENCING DIFFICULTIES TO OBTAIN FOOD IN THE
PREVIOUS 30 DAYS (P<0.05, CHI-SQUARE TEST)
50.5
35.7
84.0
34.341.6
49.7
58.350.6
0
10
20
30
40
50
60
70
80
90
Alor
(n=600)
Kupang
(n=600)
Manggarai
(n=599)
Rote Ndao
(n=601)
Sumba
Barat
(n=601)
Sumba
Timur
(n=600)
TTS
(n=600)
Total
(n=4201)
(%)
FIGURE 65 - PROPORTIONS OF HOUSEHOLDS ADOPTING SPECIFIC COPING STRATEGIES (N=2124)
1
1.21.8
2.62.83.6
5.47.4
11.4
1224
26.727
35.4
4043
46.2
47.653.4
54.664.6
0 10 20 30 40 50 60 70
sold land
rented out land
other
some HH member migrated
sold agricultural tools,seeds or other input
sent children to live w ith relatives
sold crop before harvest
sold durable HH goods
skipped days w ithout eating
spent savings
sold or consumed livestock
consumed seed stock held for next season
reduced expenditure on health and education
w orked for food only
borrow ed money
reduced number of meals per day
gathering from forest/natural resources
purchased food on credit
borrow ed food, helped by relatives
reduced the proportion of meals
rely on less preferred, less expensive food
(%)

77
TABLE 32 - PROPORTION OF COPING TO OBTAIN FOOD IN THE PREVIOUS 30 DAYS (%)
Alor Kupang Manggarai Rote
Ndao
Sumba
Barat
Sumba
Timur TTS
Strategies for coping to
obtain food n=303
n=214 n=503 n=206 n=250 n=298 n=350
Rely on less preferred, less expensive food
70.3 39.3 71.4 52.9 81.2 47.0 75.4
Reduced the proportion of meals 36.6 43.9 53.3 66.0 75.6 65.8 47.1
Borrowed food, helped by relatives 33.3 37.4 79.3 63.6 56.0 51.0 37.7
Purchased food on credit 31.7 40.7 76.1 49.0 42.8 44.3 30.0 Gathering from forest/natural resources
42.2 43.0 60.4 40.8 59.2 16.4 50.3
Reduced number of meals per day 30.0 41.6 47.5 58.7 41.6 46.6 37.1
Borrowed money 30.0 32.7 74.4 48.1 28.0 21.1 23.7
Worked for food only 30.7 25.2 68.0 49.0 26.0 13.1 16.3 Reduced expenditure on health and education
8.9 34.6 44.9 26.2 32.8 8.1 24.6
Consumed seed stock held for next season
23.8 26.2 25.0 30.6 39.6 27.5 20.0
Sold or consumed livestock 24.8 26.6 13.9 30.1 22.8 26.5 31.1
Spent savings 10.6 7.5 15.5 22.8 11.2 2.3 13.4
Skipped days without eating 5.9 9.3 14.1 38.3 5.2 11.1 2.3
Sold durable HH goods 0.3 9.8 2.8 3.4 11.6 7.4 18.0
Sold crop before harvest 8.9 2.8 7.6 6.3 7.2 1.7 2.3
Sent children to live with relatives 0.7 3.3 5.2 6.8 7.6 1.0 1.4 Sold agricultural tools, seeds or other input
2.6 1.4 3.6 2.4 4.8 1.3 2.9
Some HH member migrated 1.7 1.4 5.8 2.4 4.0 0.3 0.9
Other 2.0 1.9 0.6 3.9 2.4 1.7 2.0
Rented out land 1.3 0.9 2.6 1.0 0.4 0.7 0.3
Sold land 0.7 0.0 2.6 0.5 2.0 0.0 0.3
Among the households adopting coping strategies, the most common was reliance on less preferred and cheaper food28 (64.6% of households). Other important mechanisms included reduced the portion of meals, borrowing food and help by relatives, purchasing food on credit, gather food from forest/natural resources and reduced number of meals a day, which ranged from 46% to 55% of all households. A similar coping pattern was seen in seven districts. Nearly 11.4% skipped meals. A significant proportion of households adopted more “erosive” strategies – i.e. those which adversely affect future resilience and ability to access food. Examples of such strategies include:
• Consuming seed stock held for next season: Depending on the district, between 20 and 40% of households engaged in this strategy.
• Selling durable household goods: About 10% of households in Kupang and Sumba Barat and almost 20% of households in TTS.
• Skipped days without eating: Quite common in Rote Ndao (38% of households) and around 10 – 15% in Kupang, Manggarai and Sumba Timur.
On this basis it would appear that significant proportions of households in the districts are vulnerable to the shocks and seasonal strains entailed in living in rural NTT. From a policy perspective, it would be important support such households to become more resilient to shocks through asset strengthening and livelihood diversification.
28 The high prevalence of this strategy is corroborated by findings from the traders survey (section 6.2.7).

78
6.4.3 Coping Strategies Index
Coping Strategy Index (CSI) is often used as a proxy indicator of household food insecurity to identify which population group or which location was struggling the most. CSI combines: (i) the frequency of each strategy (how many times each strategy was adopted in the past 30days); and (ii) their (severity) (how serious is each strategy?) for households reporting food consumption problems. Higher CSI indicates a higher level of vulnerability to food security and vice versa. The mean of Reduced CSI (RCSI) was calculated for comparing the households in seven districts and different income source groups. RCSI was calculated based on the list of 5 commonly seen food related coping strategies, and the severity weights assigned to each strategy to:
1. Eating less-preferred foods – weight 1 2. Borrowing food or relying on help from relatives/friends – weight 2 3. Limiting portion size – weight 1 4. Limiting number of meal – weight 1 5. Gathering wild food – weight 2
The results are presented in Figure 66 and 67. The mean RCSI was significantly higher in Manggarai (11.5) and Rote Ndao (10.6) while lowest in Kupang. Households highly dependent on remittances, unskilled agricultural wage labour, forest and agriculture, handicraft and agriculture, and livestock and agriculture scored highest on the RCSI, indicating that they struggle the most to obtain food. These types of household were also amongst the most food insecure (Figure 51).
FIGURE 66 - MEAN REDUCED COPING STRATEGY INDEX (RCSI) BY DISTRICT
11.5
10.6
9.59.1
7.5 7.3
6.5
9.1
0
2
4
6
8
10
12
14
Manggarai Rote Ndao Sumba
Barat
TTS Alor Sumba
Timur
Kupang Total
Reduced C
opin
g S
trate
gy Index
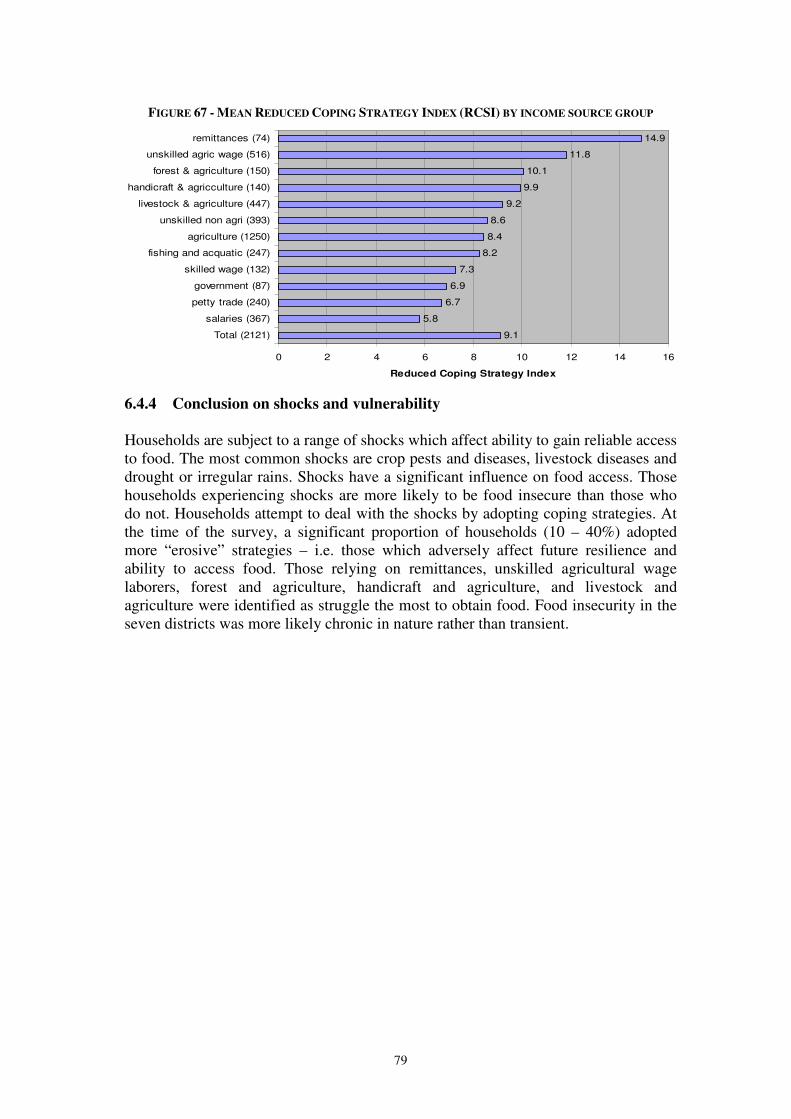
79
FIGURE 67 - MEAN REDUCED COPING STRATEGY INDEX (RCSI) BY INCOME SOURCE GROUP
9.1
5.8
6.7
6.9
7.3
8.2
8.4
8.6
9.2
9.9
10.1
11.8
14.9
0 2 4 6 8 10 12 14 16
Total (2121)
salaries (367)
petty trade (240)
government (87)
skilled wage (132)
fishing and acquatic (247)
agriculture (1250)
unskilled non agri (393)
livestock & agriculture (447)
handicraft & agricculture (140)
forest & agriculture (150)
unskilled agric wage (516)
remittances (74)
Reduced Coping Strategy Index
6.4.4 Conclusion on shocks and vulnerability Households are subject to a range of shocks which affect ability to gain reliable access to food. The most common shocks are crop pests and diseases, livestock diseases and drought or irregular rains. Shocks have a significant influence on food access. Those households experiencing shocks are more likely to be food insecure than those who do not. Households attempt to deal with the shocks by adopting coping strategies. At the time of the survey, a significant proportion of households (10 – 40%) adopted more “erosive” strategies – i.e. those which adversely affect future resilience and ability to access food. Those relying on remittances, unskilled agricultural wage laborers, forest and agriculture, handicraft and agriculture, and livestock and agriculture were identified as struggle the most to obtain food. Food insecurity in the seven districts was more likely chronic in nature rather than transient.
80
7. DISTRICT, PROVINCIAL AND CENTRAL GOVERNMENT AND
INGO POLICIES, INTERVENTIONS AND CAPACITIES
7.1 Introduction The results of this study have highlighted the serious nutrition and food security challenges facing the people of NTT. This section will review current responses to these challenges by government, UN and NGOs and will explore the extent to which the responses have been effective, picking out key constraints and issues for further reflection.
7.2 Government responses29
7.2.1 Delivery structures At Provincial level, the core institution is the Food Security Council (Dewan
Ketahanan Pangan). This was created in 2002 in an effort to coordinate multi-sector response and intervention to food problems in the province. The Council is chaired by the Governor, and coordinated by the planning ministry (Bappeprov), with 24 government agencies as members, including universities. It consists of 5 Task Forces namely Food Production; Distribution Control and Price Monitoring; Food and Nutrition Diversification; Quality Monitoring of Food; and Nutrition and Supporting Infrastructures. The Council has drawn up three main strategies to coordinate programs and intervention on food security, namely:
1. Mainstreaming food security into particular sectors’ development programs. 2. Emergency response programs, such as rice distribution (rice for poor, special
market operations) and seeds distribution. These are aimed at relieving acute food insecurity.
3. Community Development programs in order to overcome chronic and recurrent food crises. These aim at improving resilience and self-sufficiency within communities.
The effectiveness of the Council in addressing NTT’s food secuerity and nutrition problems is arguably adversely affected by the fact that the government of NTT relies too heavily to Central Government budget for food and nutrition programmes and does not have sufficient leeway for design and financing of interventions which are more tailored to the NTT context. At district level, several goverment agencies are involved in food security and nutrtion interventions. Again, Bappeda is the main ccordinator of programmes. Table 32 maps out the key government institutions and their mandate at district level.
29 Information with regard to government response has drawn on Muslimatun & Fanggidae (2008) and
from a separate Capacity Response study that was done as part of the overall joint nutrition and food security survey.
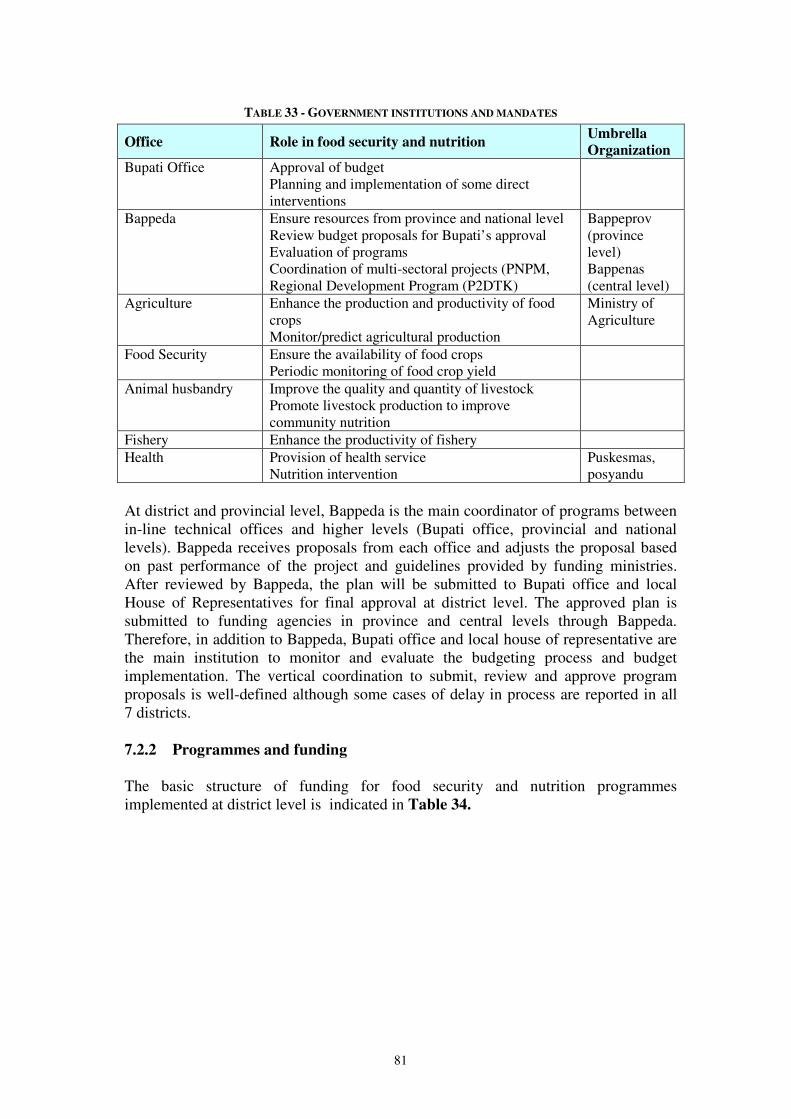
81
TABLE 33 - GOVERNMENT INSTITUTIONS AND MANDATES
Office Role in food security and nutrition Umbrella
Organization
Bupati Office Approval of budget Planning and implementation of some direct interventions
Bappeda Ensure resources from province and national level Review budget proposals for Bupati’s approval Evaluation of programs Coordination of multi-sectoral projects (PNPM, Regional Development Program (P2DTK)
Bappeprov (province level) Bappenas (central level)
Agriculture Enhance the production and productivity of food crops Monitor/predict agricultural production
Ministry of Agriculture
Food Security Ensure the availability of food crops Periodic monitoring of food crop yield
Animal husbandry Improve the quality and quantity of livestock Promote livestock production to improve community nutrition
Fishery Enhance the productivity of fishery Health Provision of health service
Nutrition intervention Puskesmas, posyandu
At district and provincial level, Bappeda is the main coordinator of programs between in-line technical offices and higher levels (Bupati office, provincial and national levels). Bappeda receives proposals from each office and adjusts the proposal based on past performance of the project and guidelines provided by funding ministries. After reviewed by Bappeda, the plan will be submitted to Bupati office and local House of Representatives for final approval at district level. The approved plan is submitted to funding agencies in province and central levels through Bappeda. Therefore, in addition to Bappeda, Bupati office and local house of representative are the main institution to monitor and evaluate the budgeting process and budget implementation. The vertical coordination to submit, review and approve program proposals is well-defined although some cases of delay in process are reported in all 7 districts. 7.2.2 Programmes and funding The basic structure of funding for food security and nutrition programmes implemented at district level is indicated in Table 34.
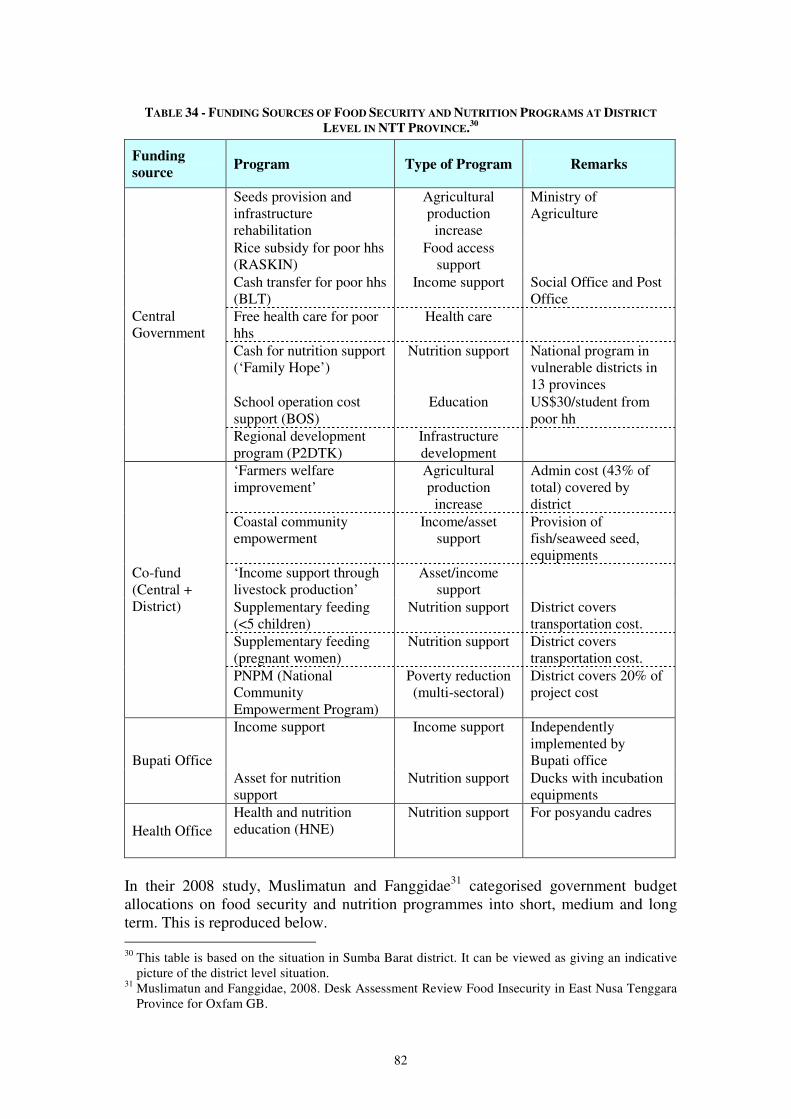
82
TABLE 34 - FUNDING SOURCES OF FOOD SECURITY AND NUTRITION PROGRAMS AT DISTRICT
LEVEL IN NTT PROVINCE.30
Funding
source Program Type of Program Remarks
Seeds provision and infrastructure rehabilitation
Agricultural production
increase
Ministry of Agriculture
Rice subsidy for poor hhs (RASKIN)
Food access support
Cash transfer for poor hhs (BLT)
Income support Social Office and Post Office
Free health care for poor hhs
Health care
Cash for nutrition support (‘Family Hope’)
Nutrition support National program in vulnerable districts in 13 provinces
School operation cost support (BOS)
Education US$30/student from poor hh
Central Government
Regional development program (P2DTK)
Infrastructure development
‘Farmers welfare improvement’
Agricultural production
increase
Admin cost (43% of total) covered by district
Coastal community empowerment
Income/asset support
Provision of fish/seaweed seed, equipments
‘Income support through livestock production’
Asset/income support
Supplementary feeding (<5 children)
Nutrition support District covers transportation cost.
Supplementary feeding (pregnant women)
Nutrition support District covers transportation cost.
Co-fund (Central + District)
PNPM (National Community Empowerment Program)
Poverty reduction (multi-sectoral)
District covers 20% of project cost
Income support Income support Independently implemented by Bupati office Bupati Office
Asset for nutrition support
Nutrition support Ducks with incubation equipments
Health Office Health and nutrition education (HNE)
Nutrition support For posyandu cadres
In their 2008 study, Muslimatun and Fanggidae31 categorised government budget allocations on food security and nutrition programmes into short, medium and long term. This is reproduced below. 30 This table is based on the situation in Sumba Barat district. It can be viewed as giving an indicative
picture of the district level situation. 31 Muslimatun and Fanggidae, 2008. Desk Assessment Review Food Insecurity in East Nusa Tenggara
Province for Oxfam GB.

83
Source: Muslimatun and Fanggidae: 2008.
Govenment Budget Allocation
2005-2007
63%
37%
0.1%
Short Term Middle Term Long Term
FIGURE 68 – GOVERNMENT BUDGET ALLOCATION 2005-2007
Short term responses covers the type of program/activities that are aimed at fulfilling immediate food needs, such as food aid or food for work. Middle term covers activities such as seeds distribution, which enable people to get enough food for one planting season, and can only be effective if people still have other production assets and preconditions. While long term interventions refers to activities which strengthen people’s livelihoods, mostly in the form of strengthening people’s economic ability in agriculture and forestry sectors. Within the longer term livelihood strengthening interventions, the main type of livelihoods that are encouraged by government intervention are: wet paddy agriculture (by providing infrastructure and inputs) and cash crops (by providing seeds, trainings, transportation infrastructur – mainly road, etc). Short term responses consist mainly of rice distribution. There are limited programmes/interventions to strengthen food self-production capacities and/or food diversification. It should be noted that this figure includes the considerable support given through the rice subsidy scheme (RASKIN), but excludes the contribution of the cash transfer scheme (BLT). The district by district coverage of different government sponsored food security and nutriton programmes (including RASKIN but not BLT) is indicated in Table 35.
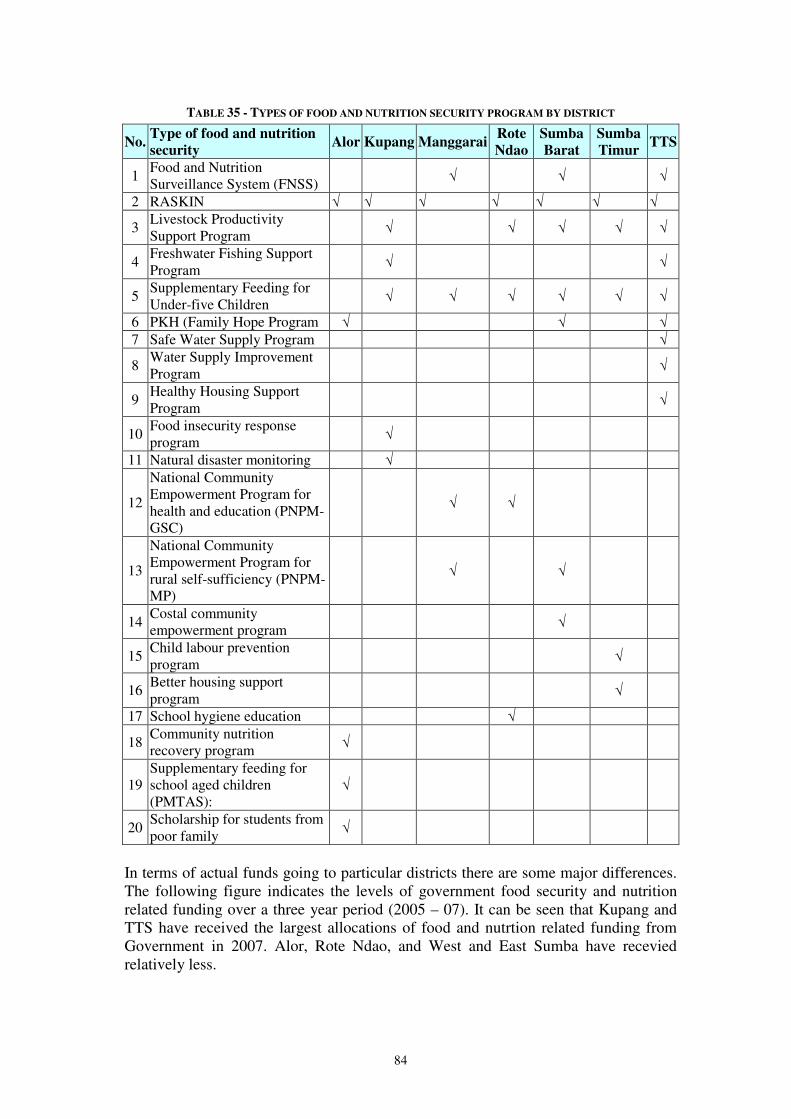
84
TABLE 35 - TYPES OF FOOD AND NUTRITION SECURITY PROGRAM BY DISTRICT
No. Type of food and nutrition
security Alor Kupang Manggarai
Rote
Ndao
Sumba
Barat
Sumba
Timur TTS
1 Food and Nutrition Surveillance System (FNSS) √ √ √
2 RASKIN √ √ √ √ √ √ √
3 Livestock Productivity Support Program
√ √ √ √ √
4 Freshwater Fishing Support Program
√ √
5 Supplementary Feeding for Under-five Children
√ √ √ √ √ √
6 PKH (Family Hope Program √ √ √ 7 Safe Water Supply Program √
8 Water Supply Improvement Program
√
9 Healthy Housing Support Program
√
10 Food insecurity response program
√
11 Natural disaster monitoring √
12
National Community Empowerment Program for health and education (PNPM-GSC)
√ √
13
National Community Empowerment Program for rural self-sufficiency (PNPM-MP)
√ √
14 Costal community empowerment program √
15 Child labour prevention program
√
16 Better housing support program
√
17 School hygiene education √
18 Community nutrition recovery program √
19 Supplementary feeding for school aged children (PMTAS):
√
20 Scholarship for students from poor family √
In terms of actual funds going to particular districts there are some major differences. The following figure indicates the levels of government food security and nutrition related funding over a three year period (2005 – 07). It can be seen that Kupang and TTS have received the largest allocations of food and nutrtion related funding from Government in 2007. Alor, Rote Ndao, and West and East Sumba have recevied relatively less.
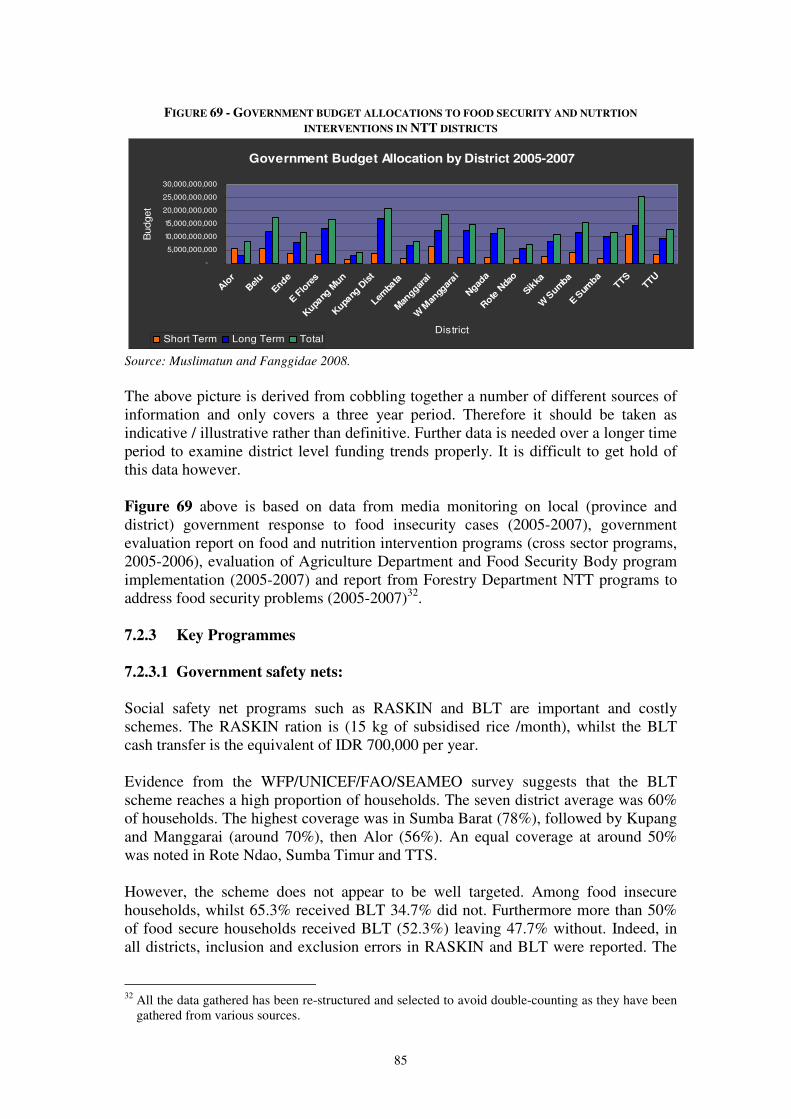
85
FIGURE 69 - GOVERNMENT BUDGET ALLOCATIONS TO FOOD SECURITY AND NUTRTION
INTERVENTIONS IN NTT DISTRICTS
Government Budget Allocation by District 2005-2007
-
5,000,000,000
10,000,000,000
15,000,000,000
20,000,000,000
25,000,000,000
30,000,000,000
Alo
r
Belu
Ende
E Flo
res
Kupa
ng M
un
Kupa
ng D
ist
Lemba
ta
Man
ggarai
W M
angg
arai
Ngad
a
Rote
Nda
o
Sikka
W S
umba
E Sum
baTTS
TTU
District
Budget
Short Term Long Term Total
Source: Muslimatun and Fanggidae 2008.
The above picture is derived from cobbling together a number of different sources of information and only covers a three year period. Therefore it should be taken as indicative / illustrative rather than definitive. Further data is needed over a longer time period to examine district level funding trends properly. It is difficult to get hold of this data however. Figure 69 above is based on data from media monitoring on local (province and district) government response to food insecurity cases (2005-2007), government evaluation report on food and nutrition intervention programs (cross sector programs, 2005-2006), evaluation of Agriculture Department and Food Security Body program implementation (2005-2007) and report from Forestry Department NTT programs to address food security problems (2005-2007)32.
7.2.3 Key Programmes
7.2.3.1 Government safety nets: Social safety net programs such as RASKIN and BLT are important and costly schemes. The RASKIN ration is (15 kg of subsidised rice /month), whilst the BLT cash transfer is the equivalent of IDR 700,000 per year. Evidence from the WFP/UNICEF/FAO/SEAMEO survey suggests that the BLT scheme reaches a high proportion of households. The seven district average was 60% of households. The highest coverage was in Sumba Barat (78%), followed by Kupang and Manggarai (around 70%), then Alor (56%). An equal coverage at around 50% was noted in Rote Ndao, Sumba Timur and TTS. However, the scheme does not appear to be well targeted. Among food insecure households, whilst 65.3% received BLT 34.7% did not. Furthermore more than 50% of food secure households received BLT (52.3%) leaving 47.7% without. Indeed, in all districts, inclusion and exclusion errors in RASKIN and BLT were reported. The
32 All the data gathered has been re-structured and selected to avoid double-counting as they have been
gathered from various sources.
86
discussion with government officials identified two factors which led to these errors. First, the data used for the targeting seems to be outdated: the beneficiaries, households below poverty line, have been identified in accordance with the household socioeconomic survey conducted 4 years ago. According to the National Statistics Bureau and its district branch, the result of new survey will be applied for re-targeting in 2009 and the number of beneficiaries will be slightly reduced. Second, some districts reported that subsidized rice was equally distributed in the community to prevent any social tension as a consequence of selection of limited households. Another social safety net program, PKH, or ‘Family Hope’ program, which distributes US$ 60-210/hh/year to poor households with pregnant and lactating mothers and/or children up to secondary school, states its objective as to improve maternal and child nutrition. This project is currently piloted in some districts including most districts in NTT, and will be expanded to all districts in the country. 7.2.4 Other major programmes A number of food security and nutrition programs are operating in NTT. Most programs have been initiated and funded by in-line ministries in central government or co-funded by central government and district government. 7.2.4.1 Agriculture, fishery and livestock specific interventions The main emphasis in government programmes is normally in distributing commodities such as seeds, livestock and equipment. There is often insufficient follow up in terms of technical advice and /or training and/or monitoring and for this reason many programmes fail. Where training is intended this may not be possible due to financial reasons, and in other cases successful training may not achieve intended results due to poor project design. Two examples from Sumba Barat serve to illustrate some of these issues: First the ‘Farmer’s Welfare Improvement’ program; which did attempt to provide some training however, a low level of farmers’ participation and high personnel cost were reported as main obstacles to the success of this programme. Second, a fishery program with a training component called ‘Costal Community Empowerment Program’ has been implemented by the Fishery Office. This aims to increase the income of vulnerable fishery communities and it provided fisherman’s groups with fishing equipment (including boat) and seaweed seed and also training on seaweed cultivation and fishery. Most groups successfully increased their production at the end of the project. However, their incomes were not increased because they could not sell their products due to the lack of marketing skills and physical access to market. 7.2.4.2 Nutrition Support Most nutrition support programs have been designed and implemented to fulfil short-term needs of critical cases. MP-ASI, a nation-wide supplementary feeding program for children 0-59 months has been implemented to provide malnourished children with fortified foods for 90 days. The achievement of the MP-ASI has not been evaluated. Yet, it appears that the impact is below expectations, reportedly due to the lack of transportation budget to remote areas (the district governments need to cover the administration costs of the project including transportation) as well as to problems
87
of targeting. Although some officials recognize the need for public awareness on food for infants’ nutrition, generally speaking very few programmes have been developed by government to address such needs. Lack of awareness has also been a key factor behind low achievement of supplementary feeding programmes for pregnant women. There have been some attempts by district governments to tackle chronic malnutrition at community level through promotion of protein-rich food. For example, the Bupati Office in Sumba Barat. District has funded a programme which targets certain villages with ducks and incubation equipments in an attempt to improve the protein intake of malnourished children. However, no guidance was provided to breed, and to help the beneficiaries to understand the nutritional value of ducks. Consequently, unplanned consumption without farming was reported.
7.2.4.3 Food security and nutrition status monitoring The Food and Nutrition Surveillance System (FNSS) was initiated by the central government in 1979 and then transferred to the authority of each district office since decentralization. Until recently, it has been the main program for food security and nutrition monitoring in the district level and aims to provide early warning and help in the design and implementation of effective interventions. It is now being supplemented by the new WFP food security monitoring system which was introduced in August 2009. The implementation of the FNSS has varied among districts. The constraints for regular implementation of FNSS have been insufficient budget allocation from the central government and frequent personnel relocation. In terms of methodology of the FNSS, agricultural production and market price information are the two main types of information being collected by the Food Security Office. Nutrition data seems to be separately collected by Health Office. It is unclear whether the information monitored by FNSS is being systematically analysed and utilised in the policy-making process. 7.2.4.4 Multi-sectoral programmes In all districts, the PNPM (National Community Empowerment Program) is the main government source for rehabilitating and building food security and nutrition related infrastructure such as village roads, irrigation, Puskesmas (village clinic) and Posyandu (community health post). The PNPM provides ample funds; the budget allocated for 2008 was around 5-8 billion rupiah (US$ 5-800,000) per district. PNPM applies a ‘bottom-up’ approach in identifying needs and planning, using participatory assessment tools such as community focus group discussion. However, projects implemented in 2008 were mostly rehabilitation of infrastructure. As it has been discussed earlier in this report the rehabilitated health facilities have not been used by the community due to the lack of midwives and other technical staff in the facilities. In many districts, the Health Office has raised the urgent need for improvement of the coordination.

88
7.2.5 Overall observations on Government support to food security and
nutrition in NTT Co-ordination and field capacity issues While vertical coordination is firmly established, the lack of inter-sectoral coordination between technical offices is a major challenge faced by technical offices. Some projects result in unexpected outcome due to the lack of consultation with related technical offices. This case was found in most livestock distribution projects with the aim of nutrition support, which simply distributed livestock and breeding equipments to communities without nutrition advocacy. Technical officers working in line ministries (particularly the Health Office) have raised the need for the improvement of the coordination between PNPM (National Community Empowerment Program) coordination office and technical offices. In interviews conducted as part of this assessment, technical offices claimed no consultation was offered to them before PNPM interventions such as rehabilitation of Puskesmas and schools. In some districts, rehabilitated facilities were not used by community due to the lack of technical staffs to provide service.
Implementation issues Partly as a result of poor inter-sectoral coordination, it is apparent that many well intentioned programmes fail due to inappropriate implementation. A key issue is lack of extension support to accompany distribution programmes (whether this is seed, livestock or food). This is in turn due to lack of funding and trained personnel at district and sub-district levels. Implementation (in)flexibility at district level The process of budgeting and funding of nutrition and food security programs is such that technical offices are not given a substantial authority to formulate new programs and to decide the size of the program. The discussion at district levels also revealed that the budget for food and nutrition security programs amounts to only a few percentage of total annual budget. In fact, the issue of budgeting has become a serious concern in discussing government commitment to address food security problems. Budget dependency to central government lessens local government ability to formulate programs which really suit to local context. In addition, the budget available under local government authority (APBD) is usually allocated mostly for government operational costs (ranging between 60% to 80% annually of the allocation) which leaves much smaller amounts to fund direct developmental programs. Possible funding bias towards certain districts The data available for this study indicates that certain districts may consitently receive more resources than others - although this would need to be corroborated. Districts which may be underfunded include Alor, Rote Ndao, and West and East Sumba. BLT and RASKIN coverage Whilst the BLT programme does reach a significant proportion of the food insecure, there appear to be very significant inclusion and exclusion errors which affect the effectiveness and efficiency of the programme. The RASKIN programme is more
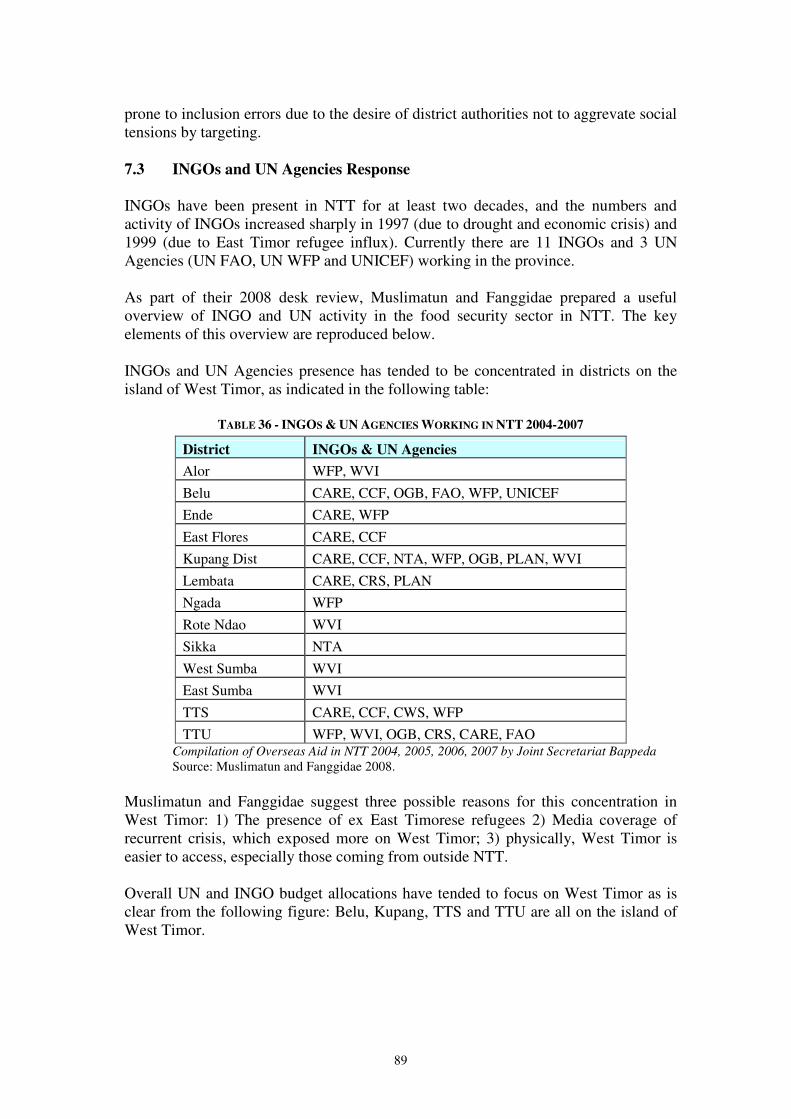
89
prone to inclusion errors due to the desire of district authorities not to aggrevate social tensions by targeting. 7.3 INGOs and UN Agencies Response INGOs have been present in NTT for at least two decades, and the numbers and activity of INGOs increased sharply in 1997 (due to drought and economic crisis) and 1999 (due to East Timor refugee influx). Currently there are 11 INGOs and 3 UN Agencies (UN FAO, UN WFP and UNICEF) working in the province. As part of their 2008 desk review, Muslimatun and Fanggidae prepared a useful overview of INGO and UN activity in the food security sector in NTT. The key elements of this overview are reproduced below. INGOs and UN Agencies presence has tended to be concentrated in districts on the island of West Timor, as indicated in the following table:
TABLE 36 - INGOS & UN AGENCIES WORKING IN NTT 2004-2007
District INGOs & UN Agencies
Alor WFP, WVI
Belu CARE, CCF, OGB, FAO, WFP, UNICEF
Ende CARE, WFP
East Flores CARE, CCF
Kupang Dist CARE, CCF, NTA, WFP, OGB, PLAN, WVI
Lembata CARE, CRS, PLAN
Ngada WFP
Rote Ndao WVI
Sikka NTA
West Sumba WVI
East Sumba WVI
TTS CARE, CCF, CWS, WFP
TTU WFP, WVI, OGB, CRS, CARE, FAO Compilation of Overseas Aid in NTT 2004, 2005, 2006, 2007 by Joint Secretariat Bappeda
Source: Muslimatun and Fanggidae 2008. Muslimatun and Fanggidae suggest three possible reasons for this concentration in West Timor: 1) The presence of ex East Timorese refugees 2) Media coverage of recurrent crisis, which exposed more on West Timor; 3) physically, West Timor is easier to access, especially those coming from outside NTT. Overall UN and INGO budget allocations have tended to focus on West Timor as is clear from the following figure: Belu, Kupang, TTS and TTU are all on the island of West Timor.
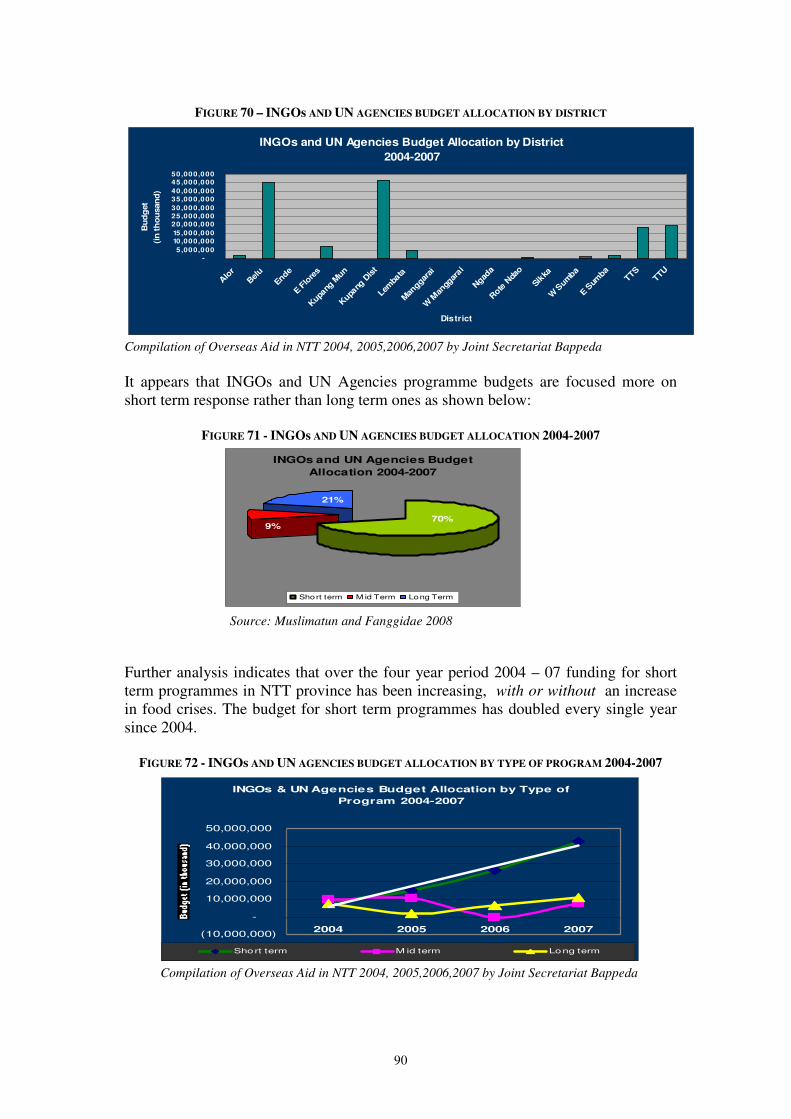
90
Source: Muslimatun and Fanggidae 2008
INGOs and UN Agencies Budget
Allocation 2004-2007
9%
21%
70%
Short term M id Term Long Term
FIGURE 70 – INGOs AND UN AGENCIES BUDGET ALLOCATION BY DISTRICT
INGOs and UN Agencies Budget Allocation by District
2004-2007
-
5 ,000,000
10,000,000
15,000,000
20,000,000
25,000,000
30,000,000
35,000,000
40,000,000
45,000,000
50,000,000
Alo
r
Bel
u
Ende
E Flo
res
Kupa
ng M
un
Kupa
ng D
ist
Lemba
ta
Man
ggara
i
W M
angg
arai
Ngad
a
Rote
Nda
o
Sikka
W S
umba
E Sum
baTTS
TTU
District
Bu
dg
et
(in
th
ou
san
d)
Compilation of Overseas Aid in NTT 2004, 2005,2006,2007 by Joint Secretariat Bappeda
It appears that INGOs and UN Agencies programme budgets are focused more on short term response rather than long term ones as shown below:
FIGURE 71 - INGOs AND UN AGENCIES BUDGET ALLOCATION 2004-2007
Further analysis indicates that over the four year period 2004 – 07 funding for short term programmes in NTT province has been increasing, with or without an increase in food crises. The budget for short term programmes has doubled every single year since 2004.
FIGURE 72 - INGOs AND UN AGENCIES BUDGET ALLOCATION BY TYPE OF PROGRAM 2004-2007
INGOs & UN Agencies Budget Allocation by Type of
Program 2004-2007
(10,000,000)
-
10,000,000
20,000,000
30,000,000
40,000,000
50,000,000
2004 2005 2006 2007
Short term M id term Long term
Compilation of Overseas Aid in NTT 2004, 2005,2006,2007 by Joint Secretariat Bappeda
91
8. CONCLUSIONS AND RECOMMENDATIONS
8.1 Conclusions
8.1.1 Coverage and representativeness of the study This study has covered seven districts which were selected to be representative of the ten livelihood zones in NTT province. Levels of malnutrition and food insecurity found in the study are in line with previous province-wide work.
8.1.2 Levels of malnutrition in children and women
The nutritional indicators for the districts covered in this study signify a serious public health problem indicating a chronic emergency situation. The prevalence of undernutrition among children was as follows:
• underweight 39.7% - this is classified as “very high” by the WHO. • stunting 52.5% - this is classified as “very high”. • wasting 15.4% - this is classified as a “critical emergency food insecurity
situation” by the WHO. For each measurement, the results fall into the highest categories. These levels are well above the national averages for Indonesia. For women, the situation is also of concern. The prevalence of thinness among women was 21.3%. This result indicates that undernutrition among women is a “high public health problem” (range from 20 to 39%). The results of the study have also highlighted the overweight prevalence among women is also of concern; around 13% of them were overweight. A highest prevalence of wasting was observed among children below 2 years old than above this age. However, the highest prevalence of stunting and underweight were found among children 24-59 months. The prevalence of underweight and of stunting was higher among boys. Children living in female-headed households have a higher prevalence of undernutrition. Higher schooling of caregivers and of head of household seems to be associated with a better nutritional outcome for both, children and caregivers. In caregivers, the high prevalence of undernutrition is preoccupying given the consequences on pregnancy outcome as well as on child care. Malnutrition among caregivers parallels that of children 0-59 mo. For instance, the prevalence of undernutrition in children was higher among undernourished caregivers. As for children 0-59 mo, among caregivers, the highest prevalence of undernutrition was observed in TTS district
92
8.1.3 Causes of undernutrition
Immediate causes: A meal frequency of ≥3 meals per day was associated with lower prevalence of underweight among children and higher prevalence of overweight among mothers. Rote Ndao had the highest proportion of women and children with less than three meals per day. Illness in previous 14 days was associated with underweight. The prevalence of illnesses was high particularly among younger children. The prevalence of diarrhea was higher than that observed in Riskesdas survey (11.7% in the previous month). Underlying causes: Child care is clearly a critical factor determining nutritional status of under- 5 children. This study investigated some but not all of the aspects of care, Feeding practices were looked at to some degree and it was found that breastfeeding practices appear to be related to good nutritional status. Vitamin A supplementation and immunisation coverage also appear to be positively associated with a good nutritional status. Protecting children against preventable diseases (through immunization) and common infections (though vitamin A supplementation) has been recognized as to be beneficial for their nutritional status. Access to healthy environment appears to not be associated with child nutritional status. On the other hand in women it seems that a better access was beneficial for their nutritional status. As expected, in NTT province, household food security seems to not be associated with child nutritional status – and similar results have been observed in other countries33, 34, 35. Amongst caregivers, nutritional outcomes tended to be positively associated with the household food access as measured by income * share of food expenditure in total expenditure – although the results are not significant at the 95% confidence level Care practices, dietary intake as well as access to health services were not fully assessed in this survey. Therefore insofar as they relate to the underlying causes of malnutrition in women and children, the survey results should be seen as partial and suggestive as opposed to comprehensive and unequivocal. Further work is necessary to corroborate the findings and generate additional conclusions.
33 Pelletier, D., Deneke, K., Kidane, Y., Haile, B., Negussie, F., 1995. The food-first bias and nutrition
policy: Lessons from Ethiopia. Food Policy, 20:279. 34 Begin, F., Frongillo, E.A., Delisle, H., 1999. Care behaviours and resources influence child height-
for-age in rural Chad. J. Nutrition, 129:680. 35 Blaney, S., Beaudry, S., Latham, M., 2008. Determinants of undernutrition in rural communities of a
protected area in Gabon. Public Health Nutrition. DOI: 10.1017/S1368980008004035.
93
8.1.4 Household Food Insecurity Consumption of a diet adequate in nutritional content was found to be lacking in 30% of households overall, rising to 40% in Manggarai. A further 35% of households were consuming a diet which was on the borderline of acceptability in terms of quantity and quality of nutrients. In addition, just under half of households were estimated to have inadequate economic access to food, with a further 38% having borderline access. This finding underscores the depth of poverty in NTT. When food consumption and economic access to food are combined to derive an overall picture of household food security, over 40% of households in the study are food insecure, rising to 50% in Manggarai. 8.1.5 Underlying causes of household food insecurity Insufficient food production at household level Overall, per capita crop production was generally low in the seven districts. There was a significant association between the level of food production and household food access in most districts: households with a longer period of notional food self sufficiency had better food access. This implies that in general households are unable to obtain sufficient food through the market to compensate for lower own production of food. The major constraints of food production at household level are as follows: Crop pests and diseases: Crop pests and diseases was the most frequently mentioned problem in relation to crops. Nearly half of the households who cultivated land experienced crop pests and/or diseases in the past 12 months, ranging from 29.3% in Manggarai to 73.1% in Alor. Government crop extension services have a low level of coverage in the seven districts. Drought, lack of access to irrigation: Drought is a major concern for the majority of households who rely on rainfall for crop cultivation. For the 25% of households with access to irrigation, the critical problems are lack of water at the start of the season and maintenance problems. Limited use of fertiliser: Whilst 75% of the households who cultivated land stated that they used fertiliser to grow rice on paddy land, just 13% used fertiliser on upland, due to high costs and possibly lack of knowledge on the benefits. Small land size: Mean paddy land sizes varied from 0.35 ha in Manggarai to 1.11 ha in Kupang, and mean upland land size ranged from 0.43 ha again in Manggarai to 1.02 ha in Sumba Barat. With an average family size of 5.5 across the seven districts the low level of self-sufficiency in staple foods of rice and maize is not surprising. Livestock diseases: Disease outbreak was by far the most important constraint in relation to livestock. The proportion of households mentioning this as a problem ranged from 70% (of households who owned livestock) in Manggarai to just under 90% in Alor, Rote Ndao and Sumba Barat. As in the case of crop extension, the coverage of veterinary service appears very limited.
94
Limited Incomes and unstable income source: By comparing reported household income with the provincial poverty line and the World Bank’s threshold of US$ 2 Purchasing Power Parity (PPP) translated into IDR, it was found that overall 33% of households were classified as poor, 23% as near poor and 44% as non-poor. If income figures are adjusted for the quality of income sources then the picture becomes worse: 60% of households were classified as being in the low income quality group (unsustainable/unstable/irregular and low income); 28% in the intermediate income quality group (sustainable/stable but low); with just 11% in the high income quality group (sustainable/stable and sufficient) The income obtained from agriculture was among the lowest and was considered as being low income quality. One third of the households engaged in pure agriculture activities. When agriculture as secondary activities and unskilled labour in agriculture was included, 60% of the households were engaged in agriculture. Dependency on purchase of food Overall, share of food expenditure was about half of total expenditure, and one third of the households had to spend 65% or more of overall expenditure. These households were considered as highly vulnerable to price increases as well as income falls. The main source of rice was usually the market (about 70% of households) only 25% of households stated that own production was the main source. 8.1.6 Basic causes of household food insecurity
In general, the basic household and community assets in the study areas was limited. The educational level of the households was very low (70% were with primary education or less). There is unequivocal evidence that education, income and food security are closely linked. Low level of human assets Over one third of adults in the survey had not completed primary school and were consequently highly unlikely to be numerate or literate. Furthermore, just 30% of the adults had progressed beyond primary school. Educational attainment appeared to be lowest in Sumba Timur, Sumba Barat and TTS. Alor had the highest proportion of households with education at junior level or above. A strong association between food security with education level of the household head and spouse was found in all districts, except in Kupang with regard to the spouse’s education. The likelihood of food insecurity was significantly higher where the head or spouse had only primary education or less (P<0.05). Government crop extension and veterinary services have a low level of coverage in seven districts.
95
Insufficient natural assets for adequate crop production
Land ownership was on average 0.6 Ha and only 30% of the households had land over 0.5 Ha (section 6.2.4.1). This assessment showed that size of land had a significant association with crop production and this in turn had a significant association with household food security status. The small land sizes place limits on possible crop production, as highlighted by survey respondents particularly in Manggarai and Sumba Barat as has been shown in Table 20. (section 6.2.4.1).
More food insecure households were found among those who had to travel more than one hour to the main water source. The difference was significant in Sumba Barat and TTS (P< 0.05).
Limited use of physical assets for crop production Hand tools (sickle and hand hoe) were the only cultivation tools used for most farming households. However, given the small land sizes and low use of fertiliser, the impact of greater use of labour saving technology on agricultural production is questionable. Perceptions of the usefulness of other cultivation technologies could change with appropriate agricultural extension advice. Livestock was raised mainly as household asset rather than for daily own consumption. In 4 districts, a significant association was found between food access and the number of livestock, while the association with food consumption was not significant except goat/sheep in Kupang and pig in Sumba Timur and Rote Ndao. Access to water sources was lacking for approximately 3-5 months per year and small size of land was inadequate to ensure adequate access of food for the families. Limited role of CBOs (Community Based Organizations) Although various Community Based Organizations were present, their role in solving basic needs was considered inadequate. Access to social/informal network was also limited as shown by infrequent use and access to formal and informal credit. Road and transport linkages are often poor - only half of the roads were in good condition and connectivity among islands within the district depends very much on the weather/season. 8.1.7 Shocks and coping strategies
Households are subject to a range of shocks which affect ability to gain reliable access to food. The most common shocks are crop pests and diseases, livestock diseases and drought or irregular rains. Shocks have a significant influence on food access. Households attempt to deal with the shocks by adopting coping strategies. At the time of the survey, a significant proportion of households (10 – 40%) adopted more “erosive” strategies – i.e. those which adversely affect future resilience and ability to access food. Those relying heavily on remittances, unskilled agricultural wage labour, forest and agriculture, handicraft and agriculture, and livestock and agriculture were identified as struggling the most to obtain food.
96
8.1.8 Interventions and capacities of government, NGOs and UN agencies Government
Coordination and field capacity issues: While vertical coordination is firmly established, the lack of inter-sectoral coordination between technical offices is a major challenge faced by technical offices. Some projects result in unexpected outcome due to the lack of consultation with related technical offices. Implementation issues: Partly as a result of poor inter-sectoral coordination, it is apparent that many well intentioned programmes fail due to inappropriate implementation. A key issue is lack of extension support to accompany distribution programmes (whether this is seed, livestock or food). This is in turn due to lack of funding and trained personnel at district and sub-district levels. Implementation (in)flexibility at district level: The process of budgeting and funding of nutrition and food security programs is such that technical offices are not given a substantial authority to formulate new programs and to decide the size of the program. In addition, the budget available under local government authority (APBD) is usually allocated mostly for government operational costs (ranging between 60% to 80% annually of the allocation) which leaves much smaller amounts to fund direct developmental programs. Funding bias towards certain districts: Certain districts consistently receive more resources than others. Districts which may be underfunded include Alor, Rote Ndao, and West and East Sumba. BLT and RASKIN coverage: Whilst the BLT programme does reach a significant proportion of the food insecure, there appear to be very significant inclusion and exclusion errors which affect the effectiveness and efficiency of the programme. The RASKIN programme is more prone to inclusion errors due to the desire of district authorities not to aggrevate social tensions by targeting. UN Agencies and NGOs
Bias in geographical coverage: INGOs and UN agencies have concentrated activities on the island of West Timor. Other parts of NTT have received much less attention. Bias towards short term programmes: Analysis of budgets indicates that there has been an excessive concentration on short-term programmes. Over the four year period 2004 – 07 funding for short term programmes in NTT province has been increasing, with or without an increase in food crises. The budget for short term programmes has doubled every single year since 2004.
97
8.2 Recommendations 8.2.1 Key interventions to address infant and maternal malnutrition 8.2.1.1 Prevention of malnutrition among infants and young children
The prevention of nutrition insecurity among young children and the reduction in morbidity and mortality can be reached most effectively through the improvement of access to care and particularly through appropriate breastfeeding and complementary feeding practices in early childhood. Appropriate hygiene and health practices are also essential. Moreover, appropriate care to the child caregiver is crucial particularly during pregnancy:
• Exclusive breastfeeding in the first 6 months of life: Children who are exclusively breastfed have fewer infections, and thus, significantly lower rates of diarrhoea and other illnesses, and lower mortality rate. Focus on promotion of early initiation of breastfeeding and exclusive breastfeeding in the first 6 months of life is a must.
• Timely introduction of nutrient-rich complementary foods at 6 months: Programmes need to scale up complementary feeding practices through sound and culture-specific nutrition information and counseling of mothers, caregivers and communities to ensure that infants are fed nutrient-rich, local and low-cost and age-appropriate complementary foods (also note the possibility to use multi-micronutrient supplements to improve nutrient intake).
• Active complementary feeding: Caregivers should encourage and facilitate eating of young children
• Appropriate hygiene practices at child and household levels: washing hand with soap before the child eats and regular child bathing are necessary. Moreover, appropriate hygiene during food preparation is also essential.
• Appropriate health preventive practices: To prevent diseases, timely immunization is essential. Deworming using single-dose drugs to treat soil-transmitted worm infections is important. Using effective measures to prevent malaria such as bednet is also necessary.
• Prevention and treatment of micronutrient deficiencies.
Undernutrition and micronutrient deficiencies lead to increased morbidity and mortality among children and women, reduced cognitive development of children and well as their growth and school performance and, on the long-term, their work productivity. To mitigate the impact of reduced dietary quality and to prevent micronutrient deficiencies, the following interventions should be undertaken with a special effort to reach vulnerable groups such as children and women as well particularly the unreached populations:
• Strengthen vitamin A supplementation programmes for children aged 6-59 months and lactating women
• Initiate/strengthen programmes which provide iron-folate or multiple micronutrient supplements to pregnant and vitamin A to lactating women.
• Initiate/strengthen programmes which provide multi-micronutrient supplements (sprinkles, fortified spreads) to children under 5 with a focus on 6-24 months.
• Strengthen programmes which aim to fortify staple foods or condiments with vitamins and minerals (iron, folic acid, vitamin A).
98
• Identify and promote the utilization of local micronutrient-rich food. • Promote a fair intra-household distribution of food.
8.2.1.2 Treatment and prevention of acute malnutrition
• Control acute malnutrition in children 6 to 59 months old, and keep rates below critical values (<10%) throughout the year to prevent a rise in and treat micronutrient deficiencies.
•••• Community-based Management of Severe Acute Malnutrition to treat at home the majority of children with severe acute malnutrition. With this strategy, ready-to-use therapeutic foods (RUTF) are used to treat children with severe acute malnutrition without medical complications at the community level.
•••• Facility-based services should focus on the management of complicated cases of severe acute malnutrition and the treatment of medical complications.
•••• Supplementary feeding programmes for the management of moderate acute malnutrition where food insecurity and malnutrition rates are high. These feeding programmes can either be targeted (for example, pregnant and lactating women). If possible, fortified blended foods should be used (such as BP-5, UNIMIX). In this, positive deviance approach can be used to improve nutritional status and, in particular, care practices using local resources and knowledge.
•••• Participatory assessment of care practices. This will help to identify the good and poor caring practices as well as to find solutions.
8.2.1.3 Accelerate selected health interventions
• Increase and improve free outreach services (that include a package of essential interventions).
• Improve community health worker networks and competencies. • Diarrhoeal diseases management, including the use of oral rehydration therapy
and zinc. • Increase and maintain high coverage of measles vaccination. • Use of long-lasting insecticidal bed-nets against malaria.
8.2.1.4 Strengthen access to WASH
Access to appropriate sanitation and safe water are fundamental for child survival. Improved sanitation can reduce diarrhoea by 35%. Households access to clean water may be reduced, especially for those who have to purchase water (in peri-urban areas), leading to worsening sanitation outcomes. Therefore, it may be necessary to:
• Ensure the provision of safe water to reduce the burden on the household to purchase water.
• Ensure access to adequate sanitation
99
8.2.1.5 Improved knowledge of women/mothers and community about nutrition
and health:
• Improved access to nutrition and health information using all possible and existing channels for health workers, Posyandu cadres, village leaders and women.
• IEC on nutrition and health information should include appropriate breastfeeding practices, food selection and preparation to prepare a balance meals/diets, identification and use of local food in child’s diet, child growth and development, essential nutrition and health package for children and women (immunization, vitamin/mineral supplementation), diarrhea control, appropriate hygienic practices and health seeking behaviour, early identification of child illnesses and growth faltering. Optimum care for children by balancing earning income activities and child care.
• Advocate balanced expenditure pattern for sufficient and diversified food: The value of nutritious food – including animal proteins - compared to items such as alcohol and tobacco should be advocated to households. The advocacy should target both men and women through different channels and occasions such as media, village events and farmers associations.
• Provision of nutrition and health counsellor at village level as a back-up for cadres; such as breastfeeding counsellor.
8.2.1.6 Re-double efforts to increase female enrolment and retention at school
through to the end of High school and scale-up female literacy
programmes The importance of female education and literacy in the fight against malnutrition cannot be underestimated. The following interventions are recommended:
• Community education and mobilization to tackle the problem of early marriage.
• The elimination of school fees of every kind • Village based female literacy programmes should be scaled up.
8.2.2 Key interventions to address household food insecurity The following six strategies with action plans are recommended to improve food insecure people’s physical and economic access to adequate food, both in quantity and quality, as well as to reduce the risk of vulnerable people becoming food insecure. 8.2.2.1 Increased and strengthen food production household and community
levels
The assessment result illustrated the situation where food insecure households were unable to obtain sufficient staple food through the market to compensate for lower own production. A mid and long-term support to tackle improve the productivity of those household will be one of the key strategies to enhance their access to staple food and resilience to high food price which were frequently stated as one of the major shocks experienced. The actions may include:
100
• Provision of water and irrigation for food crops through water conservation and rainwater harvesting. Introduction/scaling up of low cost water management and watershed management techniques and processes. Food for work could be a key mechanism to help construct small-scale irrigation and also to maintain and repair existing irrigation to optimize the use of irrigation.
• Investigation of reasons for high rates of crop and animal pests and diseases
with relevant action being taken as appropriate to improve yields and to prevent harvest failure in crops and to improve animal productivity and reduce mortality in livestock..
• Provision of simple technology, including tools and equipment for land preparation, sowing/seedling, weeding, harvesting and post harvesting.
• Increased access to agricultural knowledge at household level through introduction/scaling-up of participatory farmer field school approaches and food for training activities to address production constraints. This is particularly important given the low coverage of state, NGO and INGO crop extension systems.
8.2.2.2 Diversify foods cultivated at household level
With 30% of households having a poor Food Consumption Score and a further 35% having a borderline score, it is clear that diets of many households are too narrow. The main diet of the population was rice, maize, cassava leaves, sugars and oil, with some vegetables and very little animal protein. Accordingly efforts to diversify the production base should be pursued through promoting kitchen gardens, as well as small-scale livestock production. 8.2.2.3 Improve levels and stability of rural incomes Food insecure and vulnerable households were found more among those who rely on unsustainable, unstable and low income which include crop sale, agricultural wage labour, unskilled labour and livestock raising. Efforts to raise incomes in for these households should focus on improving the profitability of current livelihood sources as appropriate whilst at the same time encouraging diversification into activities with higher and more stable incomes. In order to achieve this, the following actions are recommended:
• Introduction/scaling-up of sustainable rural finance schemes – thus helping to improve financial capital at household level – and linking these to the following recommended actions:
• Increase incomes from agriculture by undertaking value chain analysis of key crops and supporting production and marketing of cash crops
• Training in enterprise development and adding value to existing livelihood
activities. • Market infrastructure development: A number of activities are possible here
depending on the key constraints identified. Physical development of market places, rural road construction and maintenance are two key areas.
101
8.2.2.4 Reduce disaster risk and severity of food security shocks Food insecurity in the seven districts in NTT is a chronic issue made worse by sudden and repeated shocks. In order to improve household resilience to the frequent shocks which are experienced a number of interventions are recommended.
• Mainstream Disaster Risk Reduction into design and implementation of all community based food security and nutrition programmes.
• Establish a district level task force for disasters • Use food and cash based interventions to support/supplant household coping
mechanisms. Food for work and cash for work schemes will be relevant and important in many cases and should focus on infrastructural improvements thus addressing a key constraint in terms of physical capital.
• Strengthen informal safety net facilities for seasonal lean period through strengthening Community Based Organizations (thereby strengthening social capital). Specifically, seriously address the following issues:
• Lack of technical skills • Lack of financial/material resources • Lack of government/aid agency support • Ineffective/inefficient organization leadership • Ineffective/inefficient organization structure and coordination • Lack of appropriate decision making process
8.2.2.5 Continue to enhance evidence-based information on food access for early
warning and timely programming of appropriate responses
Building on the results of this survey, national, provincial and district government need to strengthen food security monitoring system to provide early warning, predict possible effects on vulnerable and food insecure households, and prepare appropriate responses. The existing systems which tend to focus on food production should be revitalized to capture a wider range of food security indicators. The monitoring should include the following areas:
� Food availability: crop cultivation, damaged area, harvested production and stocks;
� Food accessibility: prices of main commodities, household expenditure, household income source,
� Food utilization: access to water source and sanitation � Vulnerability: natural disasters, shocks experienced by households, main
difficulties at household level, coping strategies, official support � Livelihood assets: land, productive assets, household assets, livestock,
8.2.2.6 Advocate multi-causality of food security for effective planning,
implementation and monitoring of programs
Food Security Agency at national, provincial and district levels needs to enhance its role in advocating multi-causality of food security among sect oral stakeholders, in order to formulate effective multi-sectoral interventions. This current survey together with the results of the revitalized food security monitoring system should be used as
102
the evidence-base for planning. District governor’s office, secretariat to the governor’s office (SECDA), district development planning board (BAPPEDA), Health Office, Public Works Office, Education Office, and Agricultural Office should be regularly involved in the planning. 8.2.3 Institutional and funding issues Implementation of the above recommendations on child and maternal nutrition situation on the one hand and household food security on the other will be much more effective if certain shortcomings in the implementation modalities and capacity of government, INGOs and the UN agencies are addressed. The following actions are highly recommended: 8.2.3.1 Government institutions
• Increase level of autonomy given to district and provincial authorities to formulate food security and nutrition programmes. Priority should be given to reversing the current structure of central government funding content of programmes and local / provincial government funding the running costs and /or giving local authorities more say over programme design.
• Create structures and incentives for meaningful intersectoral/ministerial
collaboration and communication within district government to address the current “silo mentality”.
• Address the funding bias towards West Timor. Central government should
allocate higher proportions and amounts of funds to support local governments in other parts of the Province.
8.2.3.2 UN Agencies and NGOs
• Address the funding bias towards West Timor. International agencies should continue to diversify funding and programme focus towards other parts of the Province.
• Address the short term programme funding bias. NTT faces a chronic nutrition
and food insecurity. Whilst emergency and short term funding will continue to be necessary, the key problems will not be effectively tackled unless agencies commit to providing greater amounts of longer term funding which is squarely focused at the underlying issues and causes of the problem.
103
References
1. Atmarita. 2005. Nutrition problems in Indonesia. Presented during International Seminar and Workshop on Lifestyle and Related Diseases. Gadjah Mada University, 19 – 20 March, 2005.
2. Barbiche, JC and Geraets, C. 2007. Water and sanitation and food security assessment in NTT – Dec 2006/Jan 2007. Action Contre La Faim.
3. Beaton, George H., et al., ‘Effectiveness of Vitamin A Supplementation in the Control of Young Child Morbidity and Mortality in Developing Countries’, ACC/SCN State-of-the-Art Series, Nutrition Policy Paper No. 13, Geneva, 1993.
4. Begin, F., Frongillo, E.A., Delisle, H., 1999. Care behaviours and resources influence child height-for-age in rural Chad. J. Nutrition, 129:680.
5. Benson, T. 2004. Africa’s food and nutrition security situation: Where are we and how did we get there? International Food Policy Research Institute. 2020 Discussion Paper, No. 37. Washington, DC, USA.
6. Black, R.E., Allen, L.H., Bhutta, Z.A., Caulfied, L.E., de Onis, M., Ezzati, M., Mathers, C., Rivera, J., for the Maternal and Child Undernutrition Study Group. 2008. Maternal and child undernutrition: Global and regional exposures and health consequences. Lancet. DOI:10.1016/S0140-6736(07)61690-0.
7. Blaney, S., Beaudry, S., Latham, M., 2008. Determinants of undernutrition in rural communities of a protected area in Gabon. Public Health Nutrition. DOI: 10.1017/S1368980008004035.
8. CWS. 2007. Fact sheet: West Timor Situation 2007.
9. de Onis, M., and Blossner, M., 2000. Prevalence and trends of overweight among preschool children in developing countries. Am. J. Clin. Nutr. 72: 1032-1039.
10. Gibson 2005. Principles of Nutritional Assessment. Second edition. Oxford University Press.
11. Gillespie RS and Haddad L. 2001. Effective food and nutrition policy responses
toHIV/AIDS: What we know and what we need to know. Food Consumption and Nutrition Division Discussion Paper 112. Washington, D.C: International food Policy Research Institute.
12. GAVA, 2006 Improving National Vitamin A Supplementation Programme Monitoring: Conclusions of an informal consultation of the Global Alliance for Vitamin A, New York, 19 – 20 July, 2006.
13. Government of NTT. 2009. Perspektif Pembangunan Provinsi Nusa Tenggara Timur (Perspective of NTT province development). http://www.nttprov.gov.id/ntt_09/index.php?hal=tampilberita&id=UMU3747).
104
14. Gross R. 2002. Food and Nutrition Security in Poverty Alleviation: Concepts, Strategies, and Experiences at the German Agency for Technical Cooperation. Asia Pacific Journal of Clinical Nutrition; 11 (Suppl): S341-S347.
15. Hartoyo & Hadi Riyadi. 2008. Food livelihoods-based food security and nutrition in Nusa Tenggara Timur (NTT) province, Indonesia.
16. Kieft J and Soekarjo D. 2007. Food and nutritional security assessment March 2007: Initial impact analysis of the 2006/2007 crop season in comparison to 1997/1998 and 2002/2003 El Nino events for the Eastern NTT region. CARE International Indonesia.
17. Maxwell D, Watkins B, Wheeler R, Collins G. 2003. The Coping Strategy Index: A tool for rapid measurement of household food security and the impact of food aid programs in humanitarian emergencies. Field Method Manuals. CARE and WFP.
18. MOH (Ministry of Health). Health Research and Development. 2008. Laporan Riskesdas 2007 Provinsi Nusa Tenggara Timur (Report of 2007 Baseline Health Survey of NTT province).
19. Muslimatun and Fanggidae, 2008. Desk Assessment Review Food Insecurity in East Nusa Tenggara Province.
20. Pelletier, D., Deneke, K., Kidane, Y., Haile, B., Negussie, F., 1995. The food-first bias and nutrition policy: Lessons from Ethiopia. Food Policy, 20:279.
21. Scrimshaw NS and SanGiovanni JP. 1997. Synergism of nutrition, infection and immunity: an overview. Am J Clin Nutr. 66:464S-77S.
22. Smith and Haddad (2000) Overcoming Child Malnutrition in Developing Countries: Past Achievements and Future Choices. Food Agriculture and the Environment Discussion Paper 30, International Food Policy Research Institute, February 2000.
23. Thesome T. 2008. Nutrition and Food Security Baseline Evaluation Survey Timor Tengah Utara (TTU) district, Nusa Tenggara Timor (NTT) province, Indonesia. Oxfam GB.
24. Tomkins A and Watson F. 1989. Malnutrition and infection – A review – Nutrition policy discussion paper No. 5 UN ACC/SCN.
25. UNICEF. 1990. Strategy for improved nutrition of children and women in developing countries. A policy review. New York, NY, USA.
26. UNICEF 2007. Vitamin A Supplementation: A Decade of Progress.
27. Wamani H, Åstrøm AN, Peterson S, Tumwine JK, Tylleskär T. 2007. Boys are more stunted than girls in Sub-Saharan Africa: a meta-analysis of 16 demographic and health surveys. BMC Pediatrics 7:17 doi: 10.1186/1471-2431-7-17.

105
28. WFP/SEAMEO, 2005. Rapid nutritional assessment among children 6-59 months and women of reproductive age in West Nusatenggara and East Nusatenggara provinces. World Food Programme Indonesia and SEAMEO TROPMED RCCN UI.
29. WFP/SEAMEO. 2007. Rapid Food Security and Nutritional Assessment in Alor, Sikka, and East Sumba, NTT province. Jakarta.
30. WHO and UNICEF, 2004. Meeting the MDG drinking water and sanitation: A mid-term assessment of progress.
31. WFP and UNICEF. 2009. Pilot Monitoring of High Food Price Impact at Household Level in Selected Vulnerable Areas. August – November 2008.
32. WFP. 2009a. Comprehensive Food Security and Vulnerability Analysis Guidelines.
33. WFP/VAM. 2009. Emergency Food Security Assessment Handbook. Second edition.
34. Yang H and de Onis M. 2008. Algorithms for converting estimates of child malnutrition based on the NCHS reference into estimates based on the WHO Child Growth Standards. BMC Pediatrics. 8:19 doi:10.1186/1471-2431/8/19.

ANNEXES

109
Annex 1
Livelihood zones of NTT province
District Livelihood zone Description of livelihood zone
Alor LZ8: Plantation archipelago
Limited rainfall, subject to drought and wind. Production of copra, cashew, seaweed and fish. Variable market access, local and export.
LZ1: lowland palm
Lowland coastal with limited rainfall and infertile land. Limited food crop production, good potential for seaweed and palm sap. Variable market access for local markets and exports.
LZ2: Northern Timor coastal
Rainfed coastal with limited rainfall and food crop production, potential for fisheries and maize crops, but variable market access, especially local market.
LZ4: Central Timor highlands
Subject to limited rainfall, drought and winds. Production of cashew, garlic and Bali cows. Marble in mountains. Market access dominant for local markets.
Kupang
LZ5: Timor mountain oranges
Subject to landslide and drought. High humidity, enough rainfall for production of oranges, garlic and vegetables. Marble production. Market access dominant for local market.
LZ9: Flores mountain plantation
Enough rainfall, but subject to floods and landslides. Plantation commodities include coffee, cacao, clove, beans, potato, banana and vegetables. Export production. Variable market access, local and export.
Manggarai
LZ10: West Flores coastal
Coastal areas surround Flores mountain plantation and outer islands. Variable rainfall with limited but sometimes with heavy rainfall, drought, landslides and locust outbreak. Main products are cashew, cacao, banana, and seaweed for export. Market access is good for local and export.
Rote Ndao LZ1: lowland palm
Lowland coastal with limited rainfall and infertile land. Limited food crop production, good potential for seaweed and palm sap. Variable market access for local markets and exports.
Sumba Barat
LZ7: West Sumba
Highlands and lowlands, enough rainfall for production of rice, coffee, cacao, cashew, banana. Ongole cows, sandalwood horse, also woven clothes. Variable market access, local and export.
Sumba Timur
LZ6: East Sumba Savannah
Good rainfall, subject to drought and locust outbreak. Potential for maize, cashew and seaweed, and famous Ongole cattle, sandalwood horse, also woven clothes. Variable market access, local and export.
TTS LZ3: Low land mung beans
Lowland coastal with infertile land, variable rainfall, drought and often floods. Potential for mung bean, maize and candlenuts. Variable market access, especially local market.
LZ5: Timor mountain oranges
Subject to landslide and drought. High humidity, enough rainfall for production of oranges, garlic and vegetables. Marble production. Market access dominant for local market.
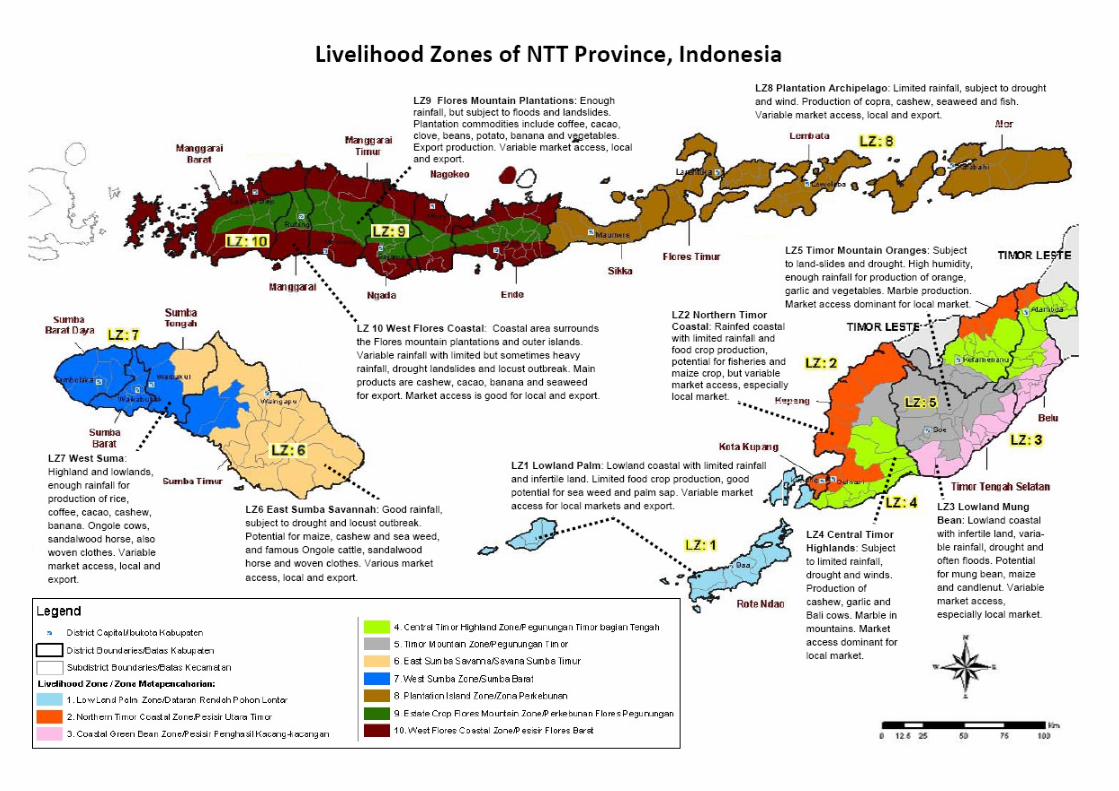
109

109
Annex 2
The variables – indicators matrix for the Livelihood-based Food security and
Nutrition Assessment in NTT province
Parameter Indicator Methods of
assessment
Means of
verification
Stunting, wasting, underweight Weight and length/height measurement
Household health and nutrition questionnaire
Nutritional status of children
Presence of oedema and other clinical signs of malnutrition
Observation and oedema test
Household health and nutrition questionnaire
Vitamin A supplementation of children
Receipt of vitamin A capsule in the last 12 months
interview Household health and nutrition questionnaire
For children 6-12 months:
- Exclusive breastfeeding for 6 months
- Exclusive breastfeeding in the previous 24 hours
- Age of introduction of complementary foods for the first time
interview Household health and nutrition questionnaire
Breastfeeding status of children
For children 13-24 months:
- Receipt of breast milk in the previous 24 hours
- Age of stopping breast feeding
interview Household health and nutrition questionnaire
Morbidity status of children 0-59 months
- Presence of diarrhoea and ARI on the day of interview
- Presence of diarrhoea and ARI on the previous 14 days
Interview Household health and nutrition questionnaire
Coverage of immunization and other relevant MCH interventions
- Receipt of basic immunization according to age
- Completeness of basic immunization according to age
- attendance to Posyandu in the previous 3 months
Interview Household health and nutrition questionnaire
…Continued
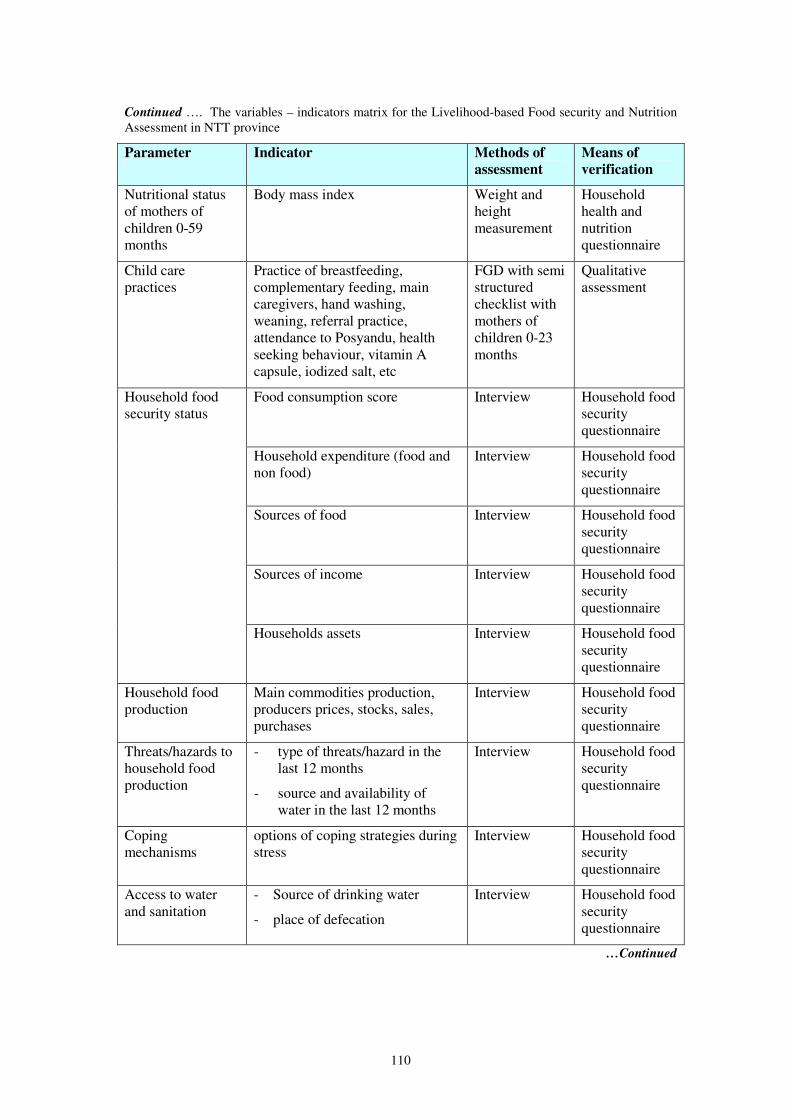
110
Continued …. The variables – indicators matrix for the Livelihood-based Food security and Nutrition Assessment in NTT province
Parameter Indicator Methods of
assessment
Means of
verification
Nutritional status of mothers of children 0-59 months
Body mass index Weight and height measurement
Household health and nutrition questionnaire
Child care practices
Practice of breastfeeding, complementary feeding, main caregivers, hand washing, weaning, referral practice, attendance to Posyandu, health seeking behaviour, vitamin A capsule, iodized salt, etc
FGD with semi structured checklist with mothers of children 0-23 months
Qualitative assessment
Food consumption score Interview Household food security questionnaire
Household expenditure (food and non food)
Interview Household food security questionnaire
Sources of food Interview Household food security questionnaire
Sources of income Interview Household food security questionnaire
Household food security status
Households assets Interview Household food security questionnaire
Household food production
Main commodities production, producers prices, stocks, sales, purchases
Interview Household food security questionnaire
Threats/hazards to household food production
- type of threats/hazard in the last 12 months
- source and availability of water in the last 12 months
Interview Household food security questionnaire
Coping mechanisms
options of coping strategies during stress
Interview Household food security questionnaire
Access to water and sanitation
- Source of drinking water
- place of defecation
Interview Household food security questionnaire
…Continued
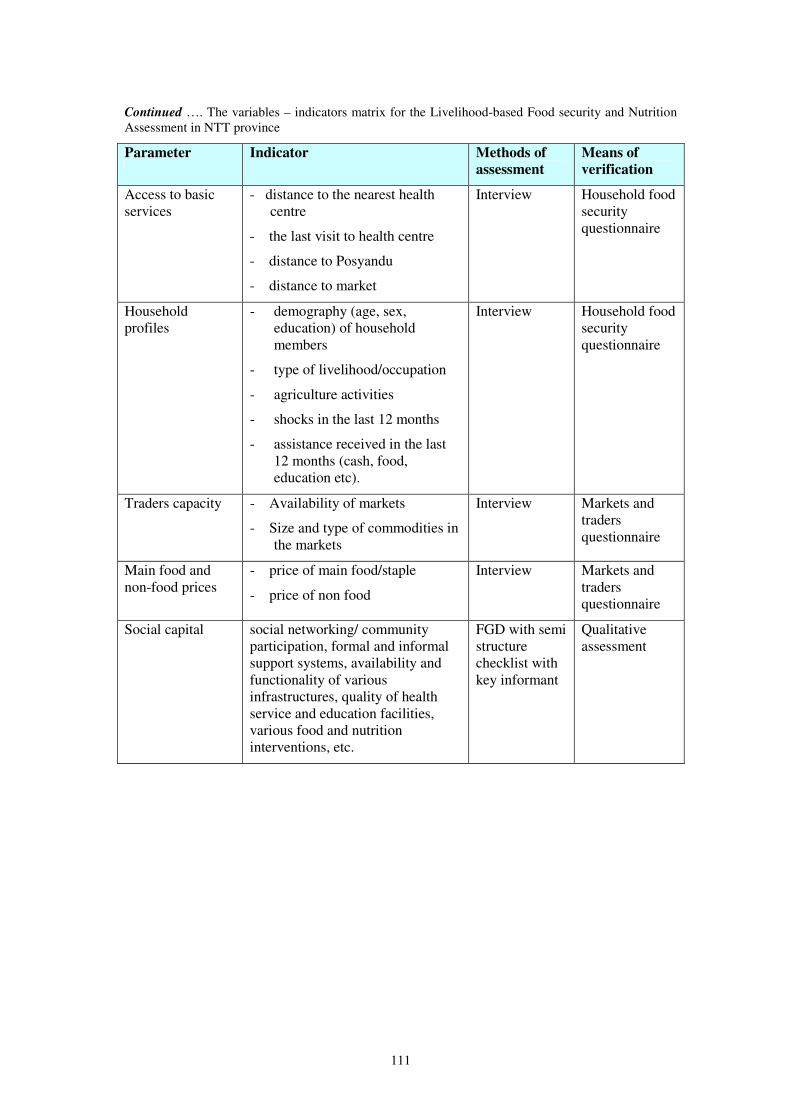
111
Continued …. The variables – indicators matrix for the Livelihood-based Food security and Nutrition Assessment in NTT province
Parameter Indicator Methods of
assessment
Means of
verification
Access to basic services
- distance to the nearest health centre
- the last visit to health centre
- distance to Posyandu
- distance to market
Interview Household food security questionnaire
Household profiles
- demography (age, sex, education) of household members
- type of livelihood/occupation
- agriculture activities
- shocks in the last 12 months
- assistance received in the last 12 months (cash, food, education etc).
Interview Household food security questionnaire
Traders capacity - Availability of markets
- Size and type of commodities in the markets
Interview Markets and traders questionnaire
Main food and non-food prices
- price of main food/staple
- price of non food
Interview Markets and traders questionnaire
Social capital social networking/ community participation, formal and informal support systems, availability and functionality of various infrastructures, quality of health service and education facilities, various food and nutrition interventions, etc.
FGD with semi structure checklist with key informant
Qualitative assessment
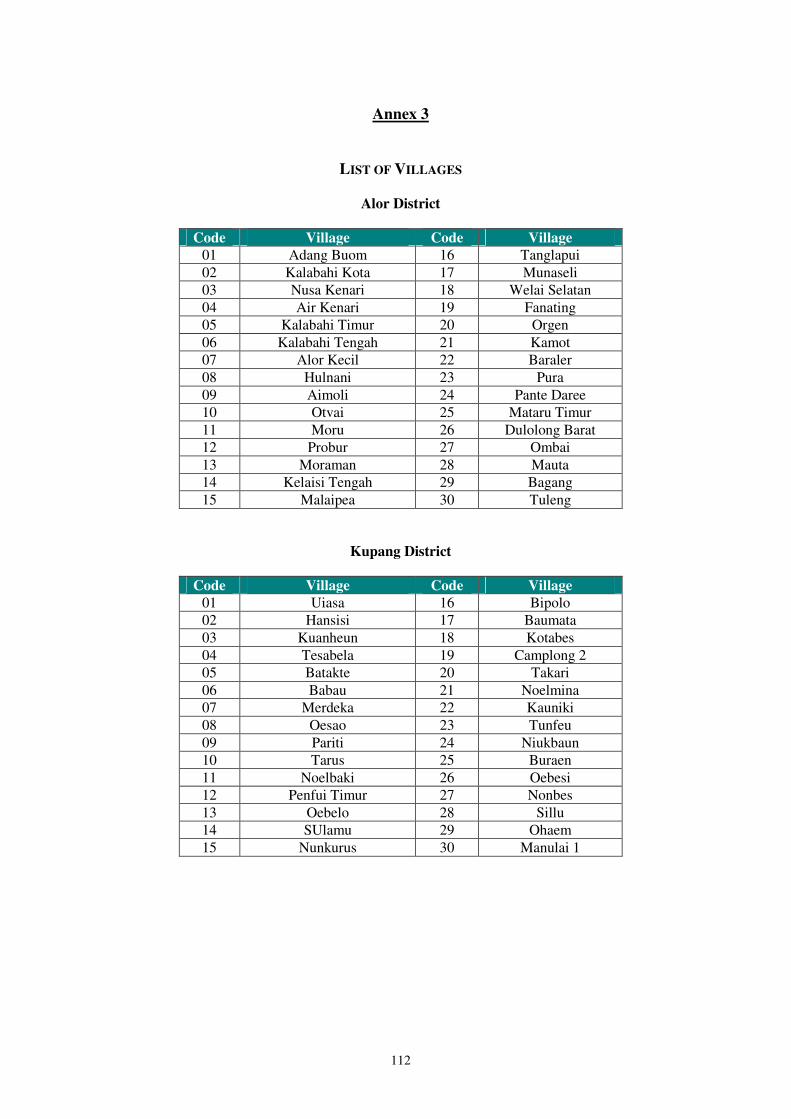
112
Annex 3
LIST OF VILLAGES
Alor District
Code Village Code Village
01 Adang Buom 16 Tanglapui 02 Kalabahi Kota 17 Munaseli 03 Nusa Kenari 18 Welai Selatan 04 Air Kenari 19 Fanating 05 Kalabahi Timur 20 Orgen 06 Kalabahi Tengah 21 Kamot 07 Alor Kecil 22 Baraler 08 Hulnani 23 Pura 09 Aimoli 24 Pante Daree 10 Otvai 25 Mataru Timur 11 Moru 26 Dulolong Barat 12 Probur 27 Ombai 13 Moraman 28 Mauta 14 Kelaisi Tengah 29 Bagang 15 Malaipea 30 Tuleng
Kupang District
Code Village Code Village
01 Uiasa 16 Bipolo 02 Hansisi 17 Baumata 03 Kuanheun 18 Kotabes 04 Tesabela 19 Camplong 2 05 Batakte 20 Takari 06 Babau 21 Noelmina 07 Merdeka 22 Kauniki 08 Oesao 23 Tunfeu 09 Pariti 24 Niukbaun 10 Tarus 25 Buraen 11 Noelbaki 26 Oebesi 12 Penfui Timur 27 Nonbes 13 Oebelo 28 Sillu 14 SUlamu 29 Ohaem 15 Nunkurus 30 Manulai 1

113
Manggarai District
Code Village Code Village
01 Poco 16 Wali 02 Compang Ndehes 17 Pitak 03 Ranaka 18 Waso 04 Kakor 19 Mbaumuku 05 Wae Belang 20 Tenda 06 Ketang 21 Pongkor 07 Tengku Lese 22 Hilihintir 08 Rai 23 Renda 09 Meler 24 Cireng 10 Pong Leko 25 Ling 11 Nenu 26 LIa 12 Golo 27 Wewo 13 Golo Ncuang 28 Kajong 14 Compang Cibal 29 Ruis 15 Pagal 30 Reo
Rote Ndao District
Code Village Code Village
01 Lekik 16 Sanggaoen 02 Oebatu 17 Tuanatuk 03 Meoain 18 Metina 04 Oeteffu 19 Seubela 05 Oeseli 20 Meubesi 06 Mbueain 21 Tebole 07 Oenggaut 22 Oebau 08 Lidor 23 Keoen 09 Busalangga 24 Olafulihaa 10 Daudolu 25 Tesabela 11 Modosinal 26 Mukekuku 12 Tolama 27 Hundihopo 13 Boni 28 Londalusi 14 Bebalain 29 Bolatena 15 Helebeik 30 Daiama

114
Sumba Barat District
Code Village Code Village
01 Komerda 16 Mamodu 02 Kampung Baru 17 Gaura 03 Kampong Sawah 18 Patialoa Dete 04 Tebara 19 Patiala Bawah 05 Kalimbukuni 20 Lamboya Bawah 06 Maliti 21 Kabu Karudi 07 Bera Dolu 22 Sodana 08 Doka Kaka 23 Ringu Rara 09 Bali Ledo 24 Loko Ry 10 Ubu Pede 25 Malata 11 Wee Karou 26 Ngadu Pada 12 Sobawawi 27 Kareka Nduku 13 Katiku Loku 28 Zala Kadu 14 Hoba Wawi 29 Manu Kuku 15 Pahola 30
Sumba Timur District
Code Village Code Village
01 Mondu Lambi 16 Heikatapu 02 Kel. Lewa Paku 17 Lairuru 03 Kondamara 18 Watuhadang 04 Tanatuku 19 Wanga 05 Praibakul 20 Kambatatana 06 Praing Kreha 21 Palakahembi 07 Lumbu Kore 22 Malumbi 08 Praimadita 23 Mauliru 09 Kakaha 24 Kambaniru 10 Kananggar 25 Prailiu 11 Karipi 26 Matawai 12 Kataka 27 Kamalaputi 13 Wulla 28 Kambajawa 14 Mburu Kulu 29 Temu 15 Kaliuda 30 Rambangaru
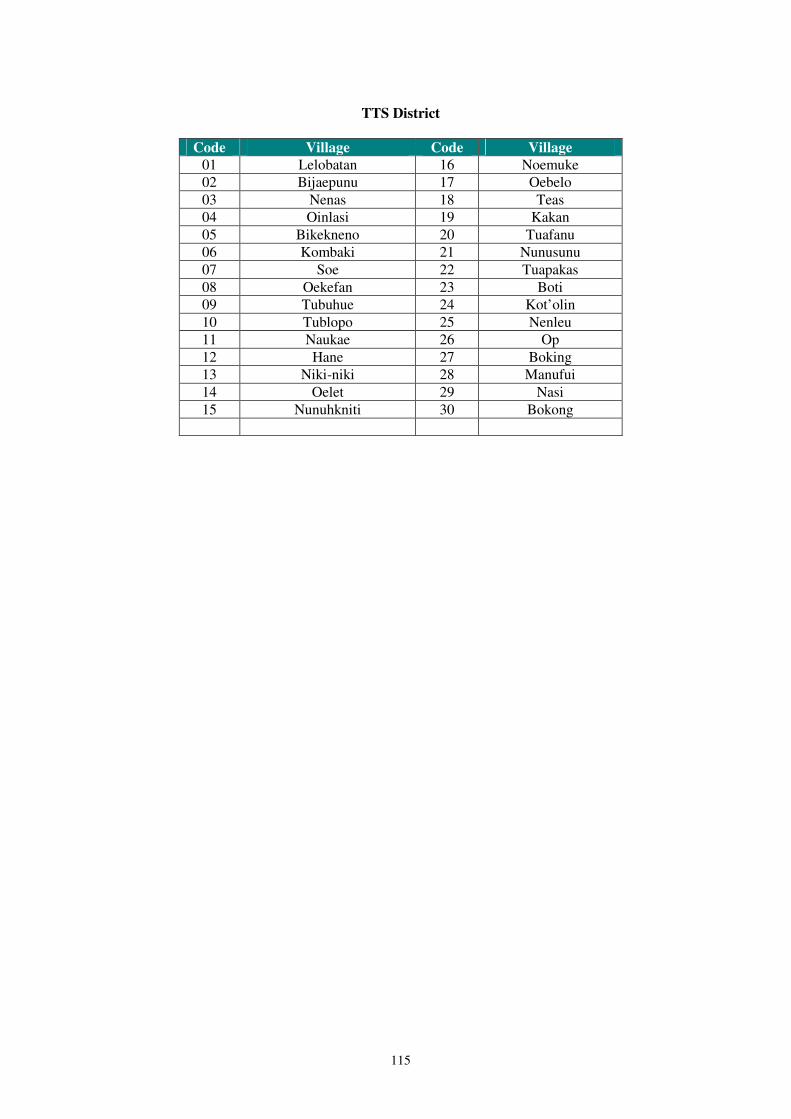
115
TTS District
Code Village Code Village
01 Lelobatan 16 Noemuke 02 Bijaepunu 17 Oebelo 03 Nenas 18 Teas 04 Oinlasi 19 Kakan 05 Bikekneno 20 Tuafanu 06 Kombaki 21 Nunusunu 07 Soe 22 Tuapakas 08 Oekefan 23 Boti 09 Tubuhue 24 Kot’olin 10 Tublopo 25 Nenleu 11 Naukae 26 Op 12 Hane 27 Boking 13 Niki-niki 28 Manufui 14 Oelet 29 Nasi 15 Nunuhkniti 30 Bokong