indonesia economic developments and outlook - world...
TRANSCRIPT

January 25, 2017
Indonesia Economic Developments and Outlook
Hans Anand Beck
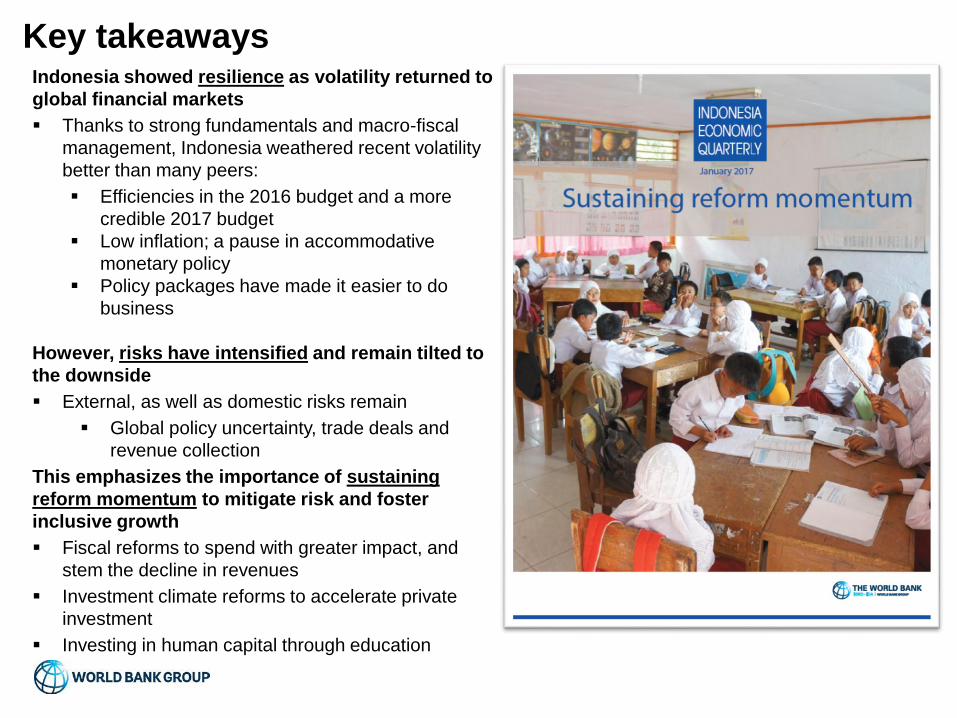
Key takeawaysIndonesia showed resilience as volatility returned to
global financial markets
Thanks to strong fundamentals and macro-fiscal
management, Indonesia weathered recent volatility
better than many peers:
Efficiencies in the 2016 budget and a more
credible 2017 budget
Low inflation; a pause in accommodative
monetary policy
Policy packages have made it easier to do
business
However, risks have intensified and remain tilted to
the downside
External, as well as domestic risks remain
Global policy uncertainty, trade deals and
revenue collection
This emphasizes the importance of sustaining
reform momentum to mitigate risk and foster
inclusive growth
Fiscal reforms to spend with greater impact, and
stem the decline in revenues
Investment climate reforms to accelerate private
investment
Investing in human capital through education

0
2
4
6
8
2014 2015 2016 2017 2018
Indonesia remains resilient to sluggish global growth
3Source: World Bank Global Economic Prospects
Economic growth (Annual percentage change)
Forecasts
World
Indonesia
Philippines
East Asia ex China
Malaysia
Thailand
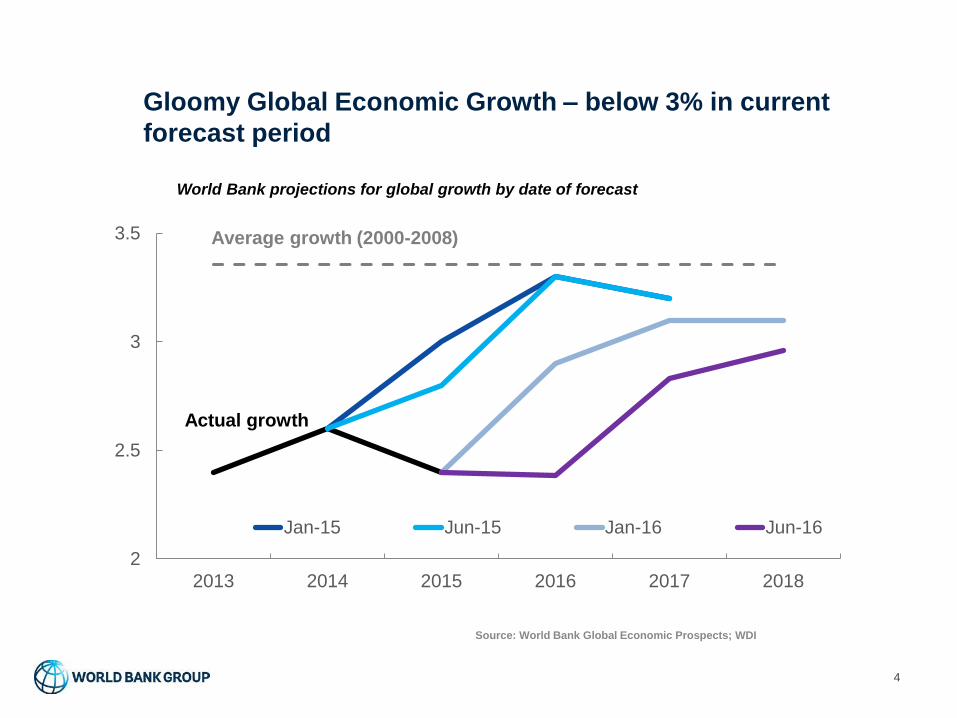
Gloomy Global Economic Growth – below 3% in current
forecast period
4
Source: World Bank Global Economic Prospects; WDI
World Bank projections for global growth by date of forecast
2
2.5
3
3.5
2013 2014 2015 2016 2017 2018
Jan-15 Jun-15 Jan-16 Jun-16
Average growth (2000-2008)
Actual growth
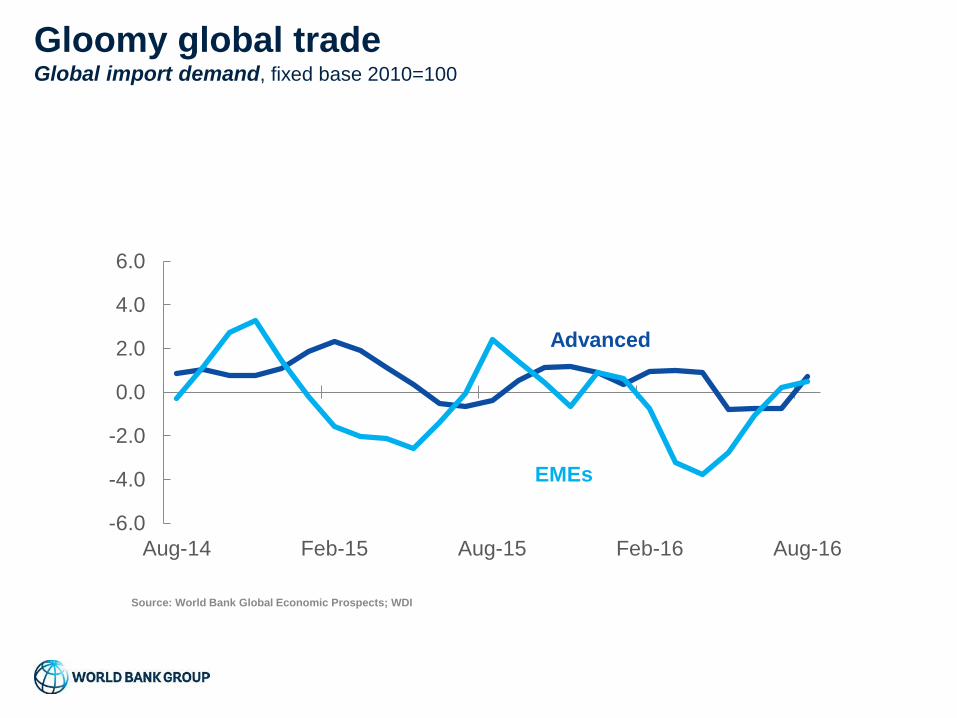
Gloomy global tradeGlobal import demand, fixed base 2010=100
-6.0
-4.0
-2.0
0.0
2.0
4.0
6.0
Aug-14 Feb-15 Aug-15 Feb-16 Aug-16
Advanced
EMEs
Source: World Bank Global Economic Prospects; WDI

85
90
95
100
105
Apr-2016 Jun-2016 Aug-2016 Oct-2016 Dec-2016
Malaysia Philippines Thailand Singapore Indonesia EMCI
Indonesia remains resilient to global financial volatility
6
Exchange rates against USD (index, April 1=100)
Source: CEIC; WB Staff Calculation
US electionBrexit

Exports in the region Depend On Global Growth Outlook
(Gross exports, percent of GDP, 2015)
0
10
20
30
40
50
60
70
80C
am
bo
dia
Fiji
Ind
on
esia
La
o P
DR
Ma
laysia
Mo
ngo
lia
Myan
mar
Papu
a N
ew
Guin
ea
Phili
ppin
es
Solo
mon
Isla
nds
Tha
iland
Vie
tna
m
China Emerging and dev. Asia excl. China
Emerging and dev. excl. EAP European Union
Japan United States
Source: World Bank Global EAP Update November 2016
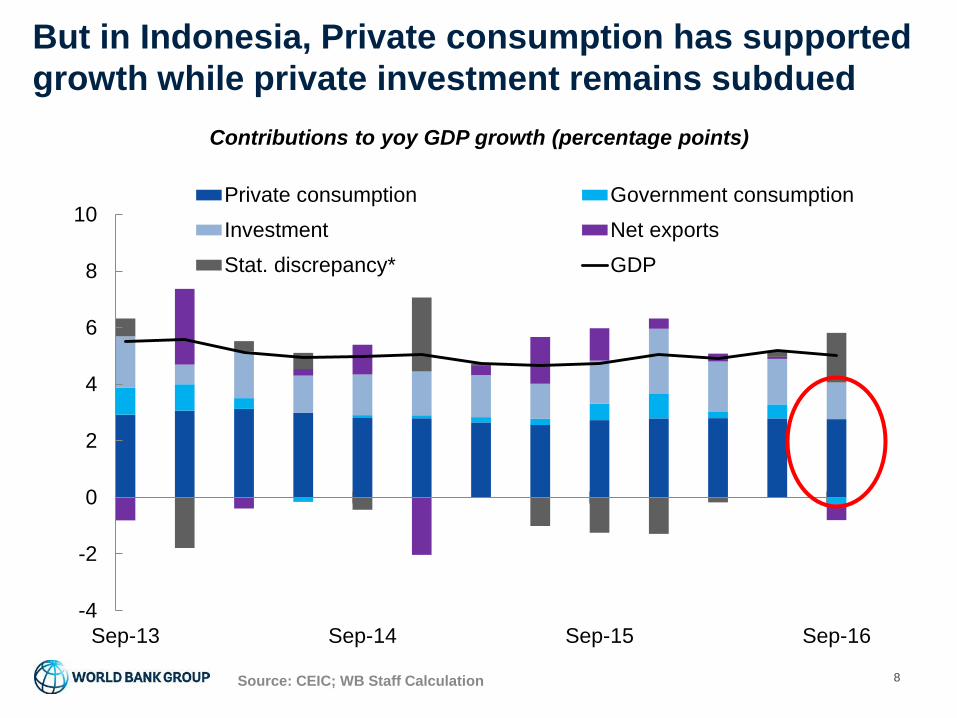
But in Indonesia, Private consumption has supported
growth while private investment remains subdued
8
Contributions to yoy GDP growth (percentage points)
Source: CEIC; WB Staff Calculation
-4
-2
0
2
4
6
8
10
Sep-13 Sep-14 Sep-15 Sep-16
Private consumption Government consumption
Investment Net exports
Stat. discrepancy* GDP
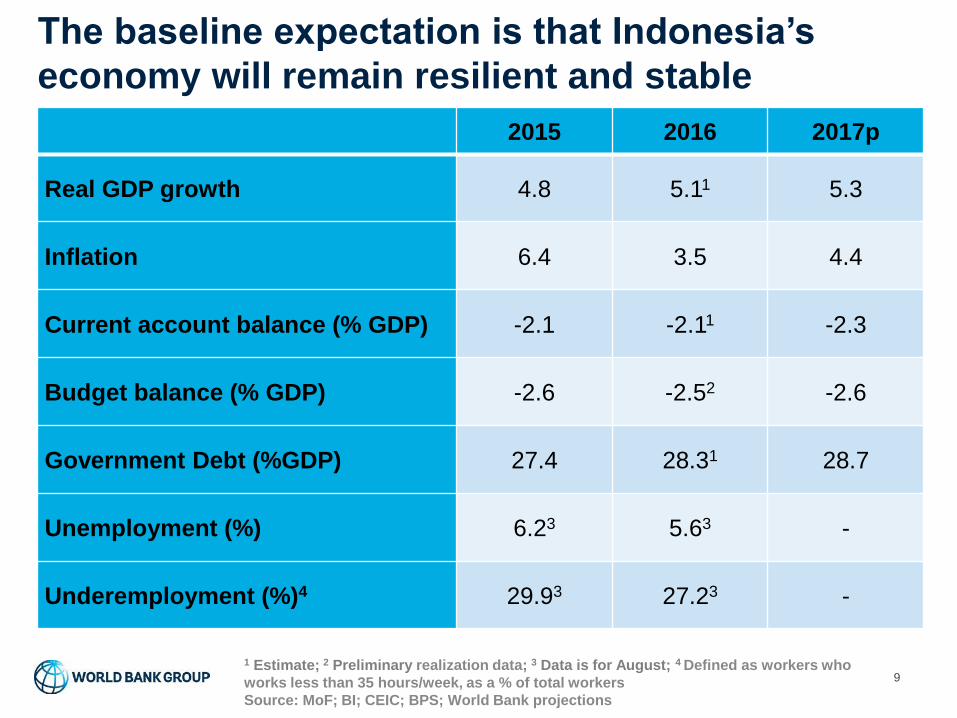
The baseline expectation is that Indonesia’s
economy will remain resilient and stable
9
1 Estimate; 2 Preliminary realization data; 3 Data is for August; 4 Defined as workers who
works less than 35 hours/week, as a % of total workers
Source: MoF; BI; CEIC; BPS; World Bank projections
2015 2016 2017p
Real GDP growth 4.8 5.11 5.3
Inflation 6.4 3.5 4.4
Current account balance (% GDP) -2.1 -2.11 -2.3
Budget balance (% GDP) -2.6 -2.52 -2.6
Government Debt (%GDP) 27.4 28.31 28.7
Unemployment (%) 6.23 5.63 -
Underemployment (%)4 29.93 27.23 -
10
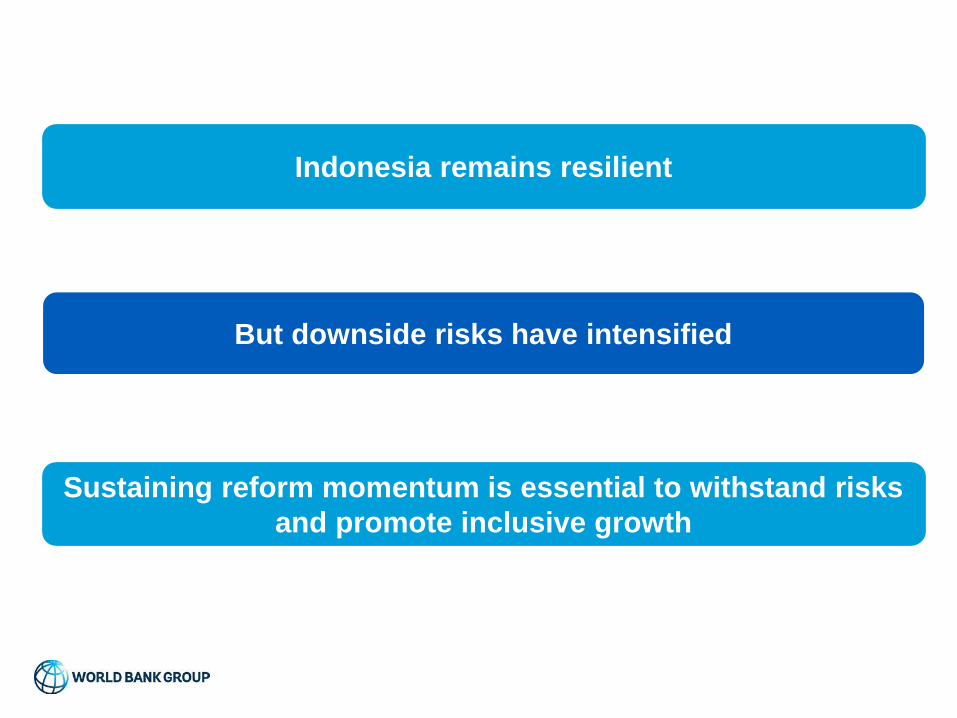
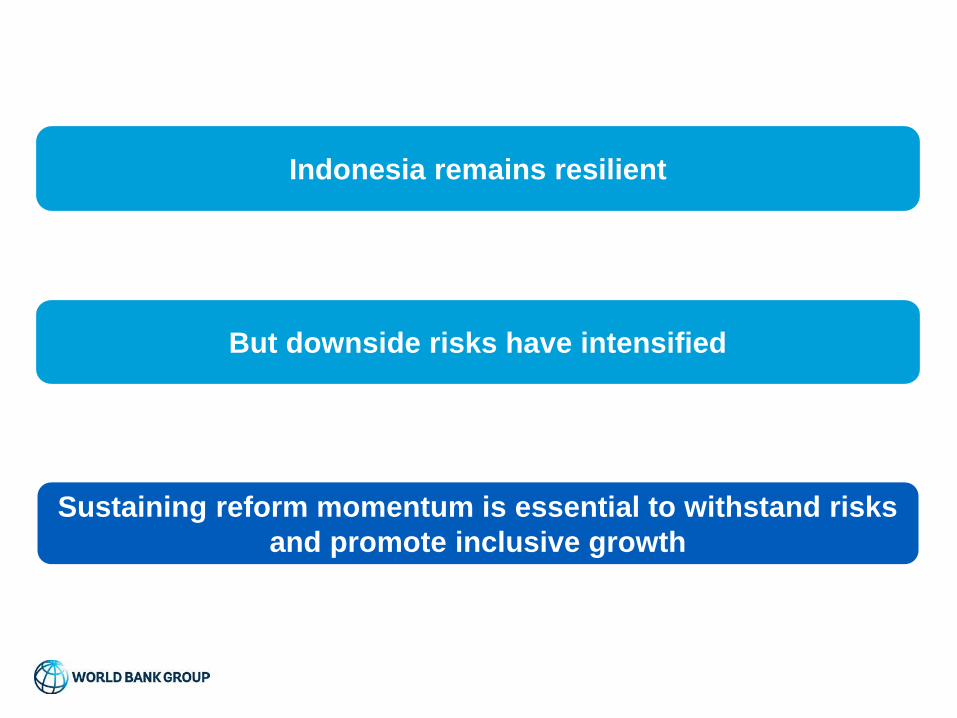
But downside risks have intensified
Indonesia remains resilient
Sustaining reform momentum is essential to withstand risks
and promote inclusive growth
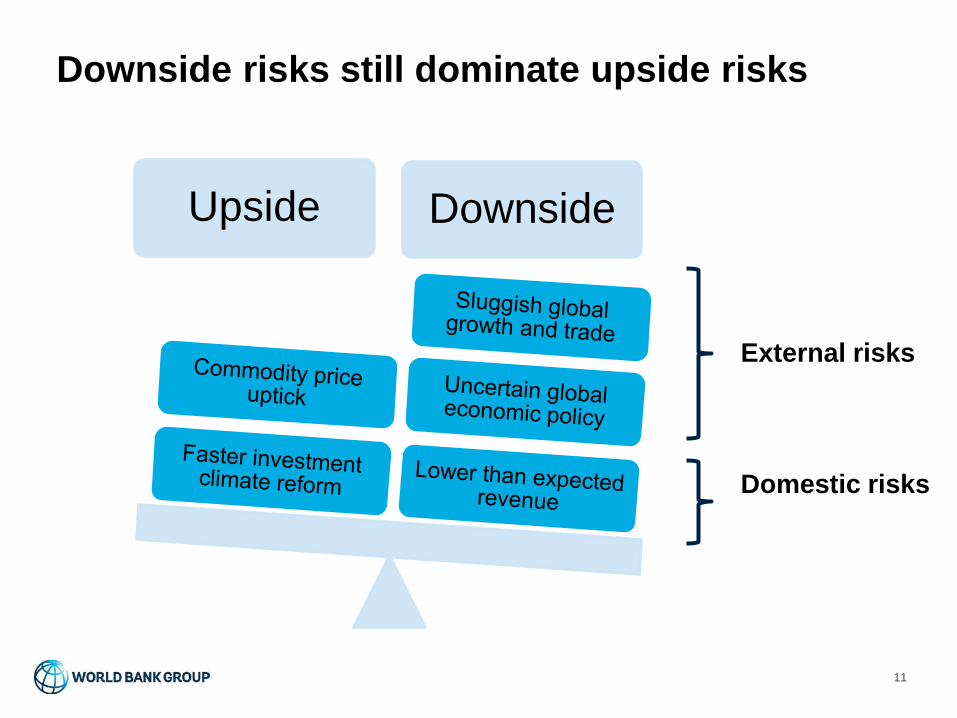
Downside risks still dominate upside risks
11
Upside Downside
External risks
Domestic risks
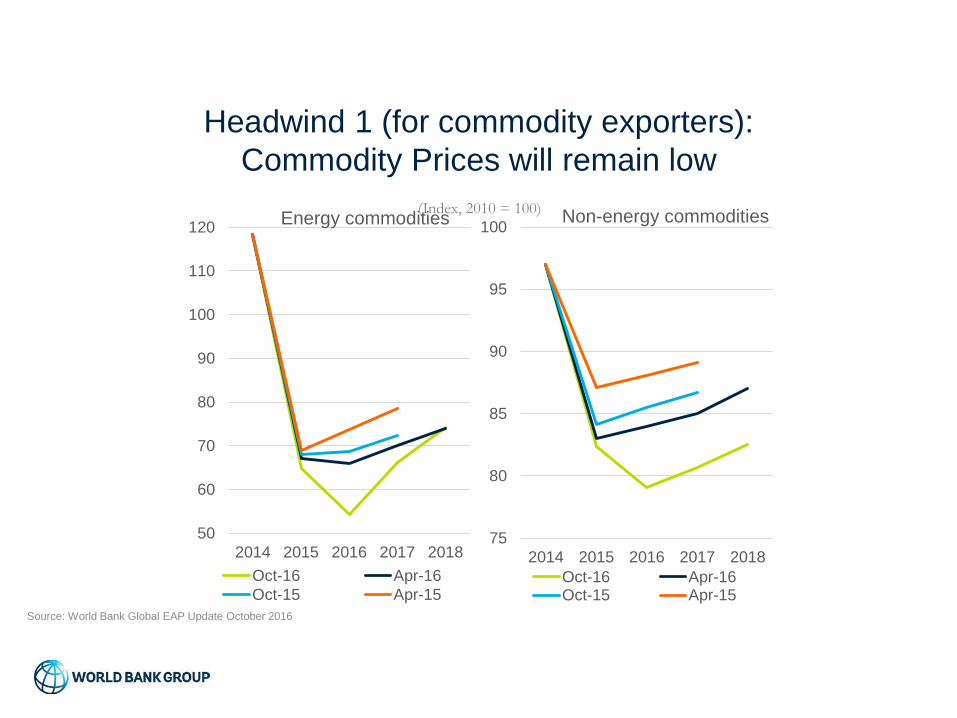
Headwind 1 (for commodity exporters):
Commodity Prices will remain low
(Index, 2010 = 100)
50
60
70
80
90
100
110
120
2014 2015 2016 2017 2018
Energy commodities
Oct-16 Apr-16
Oct-15 Apr-15
75
80
85
90
95
100
2014 2015 2016 2017 2018
Non-energy commodities
Oct-16 Apr-16Oct-15 Apr-15
Source: World Bank Global EAP Update October 2016
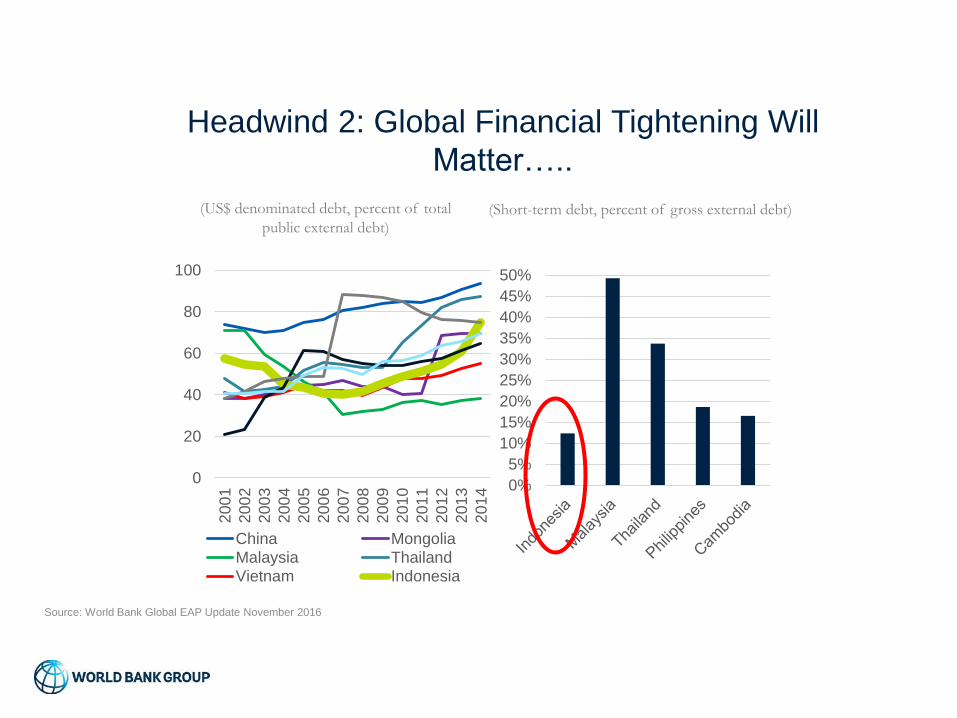
Headwind 2: Global Financial Tightening Will
Matter…..
0
20
40
60
80
100
200
1
200
2
200
3
200
4
200
5
200
6
200
7
200
8
200
9
201
0
201
1
201
2
201
3
201
4
China Mongolia
Malaysia ThailandVietnam Indonesia
0%
5%
10%
15%
20%
25%
30%
35%
40%
45%
50%
(US$ denominated debt, percent of total
public external debt)(Short-term debt, percent of gross external debt)
Source: World Bank Global EAP Update November 2016
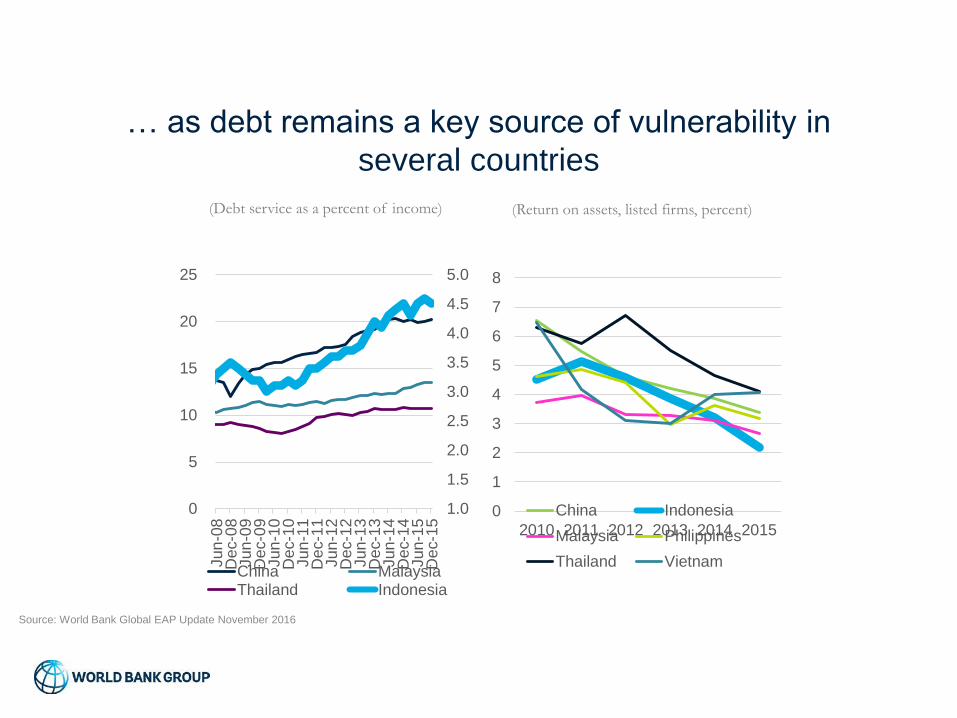
… as debt remains a key source of vulnerability in
several countries
0
1
2
3
4
5
6
7
8
2010 2011 2012 2013 2014 2015
China Indonesia
Malaysia Philippines
Thailand Vietnam
(Debt service as a percent of income) (Return on assets, listed firms, percent)
1.0
1.5
2.0
2.5
3.0
3.5
4.0
4.5
5.0
0
5
10
15
20
25
Jun
-08
Dec-0
8Jun
-09
Dec-0
9Jun
-10
Dec-1
0Jun
-11
Dec-1
1Jun
-12
Dec-1
2Jun
-13
Dec-1
3Jun
-14
Dec-1
4Jun
-15
Dec-1
5
China MalaysiaThailand Indonesia
Source: World Bank Global EAP Update November 2016
15
Sustaining reform momentum is essential to withstand risks
and promote inclusive growth
But downside risks have intensified
Indonesia remains resilient
16Source: Ministry of Finance; World Bank staff calculations
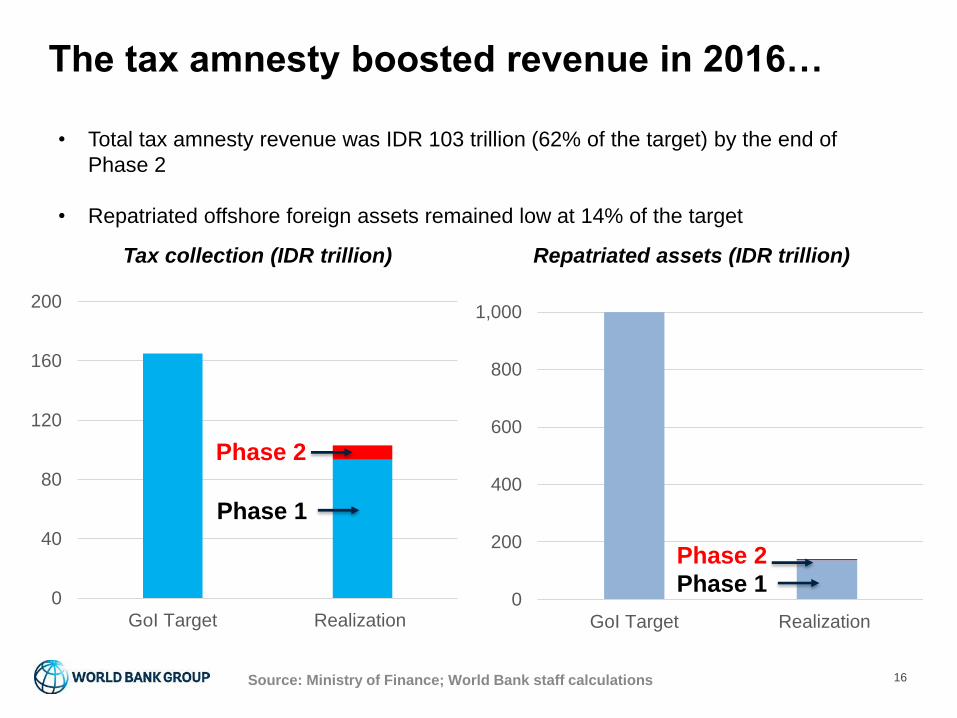
The tax amnesty boosted revenue in 2016…
• Total tax amnesty revenue was IDR 103 trillion (62% of the target) by the end of
Phase 2
• Repatriated offshore foreign assets remained low at 14% of the target
Repatriated assets (IDR trillion)Tax collection (IDR trillion)
0
200
400
600
800
1,000
GoI Target Realization
0
40
80
120
160
200
GoI Target Realization
Phase 2
Phase 2
Phase 1
Phase 1
17Source: Ministry of Finance; World Bank staff calculations
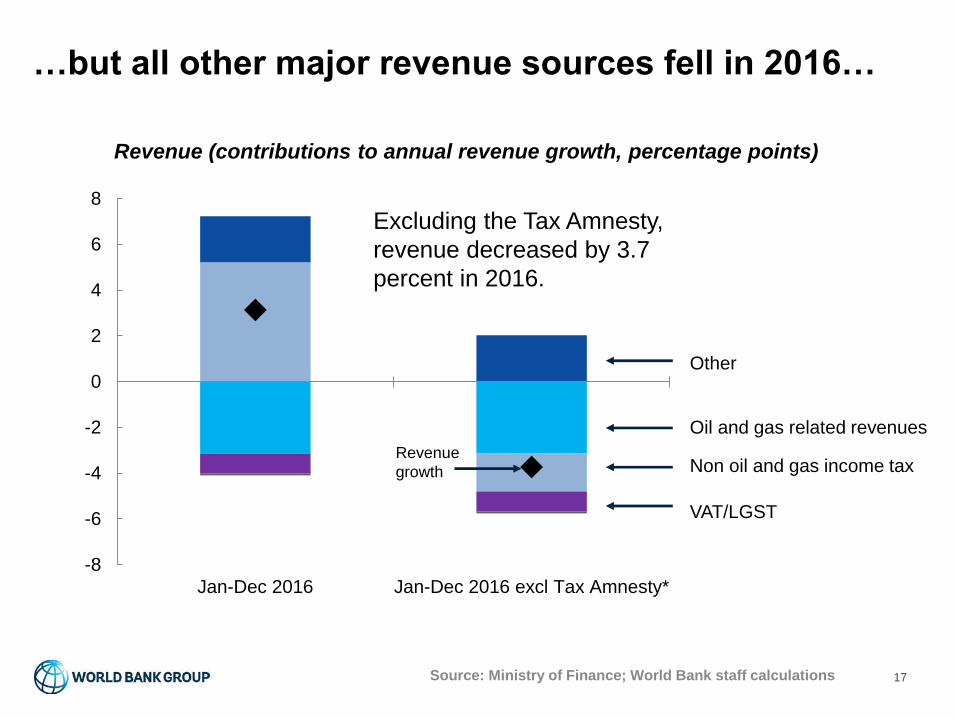
…but all other major revenue sources fell in 2016…
Other
-8
-6
-4
-2
0
2
4
6
8
Jan-Dec 2016 Jan-Dec 2016 excl Tax Amnesty*
Excluding the Tax Amnesty,
revenue decreased by 3.7
percent in 2016.
Revenue (contributions to annual revenue growth, percentage points)
Non oil and gas income tax
Oil and gas related revenues
VAT/LGST
Revenue
growth

18Source: Ministry of Finance; World Bank staff calculations
...emphasizing the need to accelerate revenue reform
• VAT e-filing and e-invoicing
• Formation of Tim Reformasi Perpajakan (Tax Reform Team)
Implemented
• Use new Tax Amnesty data to improve compliance and expand tax base
• Reform VAT law (reduce exemptions, lower VAT threshold)
• Income tax law
• Strengthen measures to reduce base erosion and profit shifting (BEPS)
• Reform tax administration (KUP law, business processes and IT)
Ongoing
-2.7
-2.6
-2.5
-2.4
-2.30
500
1,000
1,500
2,000
2,500
Revised Budget Actual (Prelim) Budget World Bank
Revenues Expenditures Budget Deficit (RHS, inverse)
2016 2017
19Source: Ministry of Finance; World Bank staff calculations
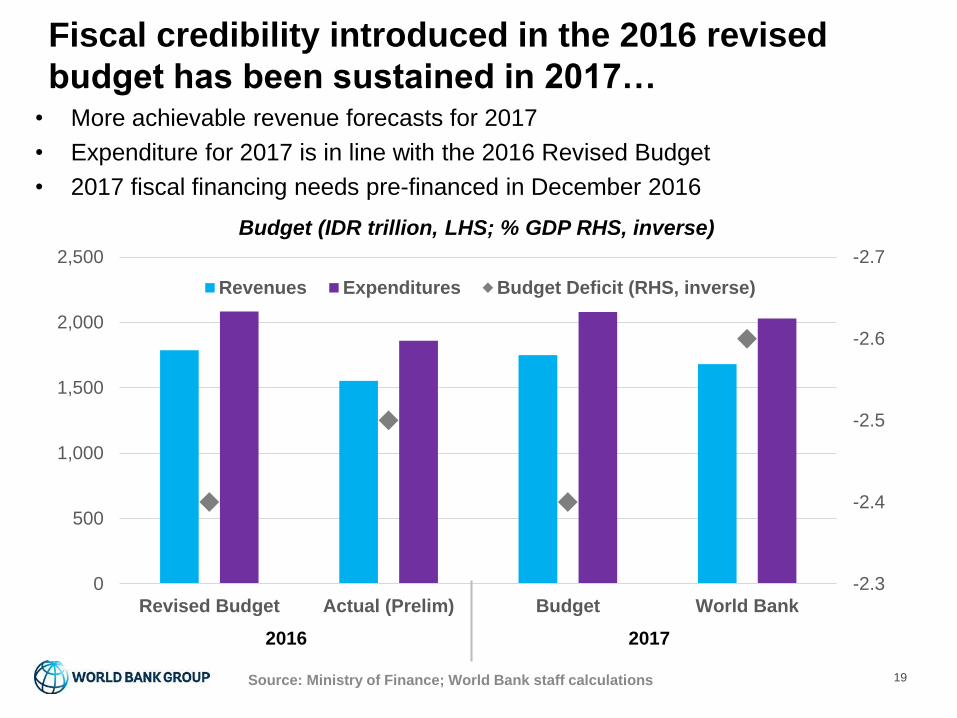
• More achievable revenue forecasts for 2017
• Expenditure for 2017 is in line with the 2016 Revised Budget
• 2017 fiscal financing needs pre-financed in December 2016
Fiscal credibility introduced in the 2016 revised
budget has been sustained in 2017…
Budget (IDR trillion, LHS; % GDP RHS, inverse)

20Source: Ministry of Finance; World Bank staff calculations
• Capital expenditure fell by 23% in
2016:
• Base effect
• Several projects deferred
• The government maintained lower
subsidy spending in 2016 and in
the 2017 Budget, along with other
improvements to the quality of
spending
• improved targeting of energy
subsidies
• mandated higher infrastructure
spending at the sub-national
level
Government expenditure (IDR trillion)
…with room for improvements to the quality of
spending, particularly capital spending…
-
50
100
150
200
250
300
2014 2015 2016 2017
Capital Subsidies

…and in other priority sectors
21
Government expenditure (% GDP)
Note: Infrastructure and social assistance data use World Bank sectoral definitions
Source: Ministry of Finance; World Bank staff calculations
0 1 2 3 4 5
Infrastructure
Health
Social assistance
Subsidies
Personnel (CG)
2016 Revised Budget 2017 approved Budget World Bank target (2020)

22Source: World Bank
Sustain investment climate reform momentum
• The investment climate is improving - Indonesia was a top 10 reformer in
the 2017 Doing Business Report
• But more needs to be done, especially to meet the government’s target
Doing Business rank of 30 in 2019
• Need to move beyond “quick win” reforms and implement medium-term
structural reforms
Overall ranking 106 91
Starting a business (days) 48 25
Getting electricity (days) 76 56
Compliance for exporting (cost, $) 170 139
DB 2016 DB 2017
30
Target 2019
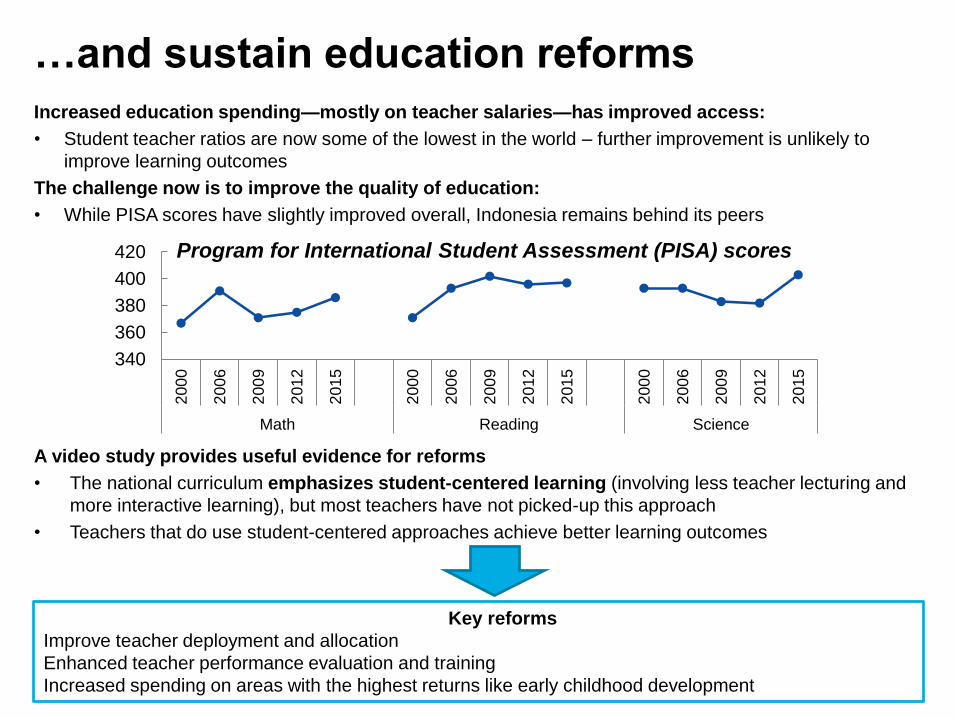
…and sustain education reforms
Increased education spending—mostly on teacher salaries—has improved access:
• Student teacher ratios are now some of the lowest in the world – further improvement is unlikely to
improve learning outcomes
The challenge now is to improve the quality of education:
• While PISA scores have slightly improved overall, Indonesia remains behind its peers
A video study provides useful evidence for reforms
• The national curriculum emphasizes student-centered learning (involving less teacher lecturing and
more interactive learning), but most teachers have not picked-up this approach
• Teachers that do use student-centered approaches achieve better learning outcomes
23
340
360
380
400
420
200
0
200
6
200
9
201
2
201
5
200
0
200
6
200
9
201
2
201
5
200
0
200
6
200
9
201
2
201
5
Math Reading Science
Program for International Student Assessment (PISA) scores
Key reforms
Improve teacher deployment and allocation
Enhanced teacher performance evaluation and training
Increased spending on areas with the highest returns like early childhood development

Terima Kasih