individual differences in visual comparison processes
TRANSCRIPT

Perception &Psychophysics1976, Vol. 19(5), 433-444
Individual differences invisual comparison processes
LYNN A. COOPERUniversity ofCalifornia, San Diego, La Jolla, California 92093
Two experiments are reported in which subjects compared the shape of two successively presentedrandom visual forms. The first stimulus in the pair was one of five "standard" shapes. and thesecond stimulus was either the same as the standard or different by virtue of a perturbation inshape or an overall reflection. Marked individual differences were found in reaction time for thesame-different comparison. For one type of subject "same" responses were faster than "different"responses, speed of "different" responses was unaffected by similarity of the test shape to thestandard, and error rates and reaction times were not systematically related. For the other type ofsubject, "different" responses were generally faster than "same" responses, "different" reactiontime decreased as the standard shape and the test shape became increasingly dissimilar. and errorrates and reaction times were positively correlated. Implications of these individual differences formodels of the same-different comparison process are discussed.
A central problem in the area of visual informationprocessing concerns how two visual stimuli arejudged to be the same or different. Recently, thenature of the same-different visual comparisonprocess has been studied extensively. Typical variables manipulated include the mode of stimuluspresentation (simultaneous and successive) and thedegree of difference between the pair of visualstimuli. Most investigators have examined the timerequired for correct "same" and "different"responses and also error rates on same and differenttrials. 1 The results of 'this research are often conflicting and difficult to summarize briefly. Typically,"same" responses are faster than "different"responses, and "different" reaction times decreaseas the stimuli to be compared become less similar.This is true when the stimuli are simple visual formswhich vary on a number of well-specified dimensionssuch as color, shape, and size (e.g., Egeth, 1966;Hawkins, 1969; Nickerson, 1967) and also when thestimuli vary on a single dimension such as hue(e.g., Bindra, Donderi, & Nishisato, 1968). Inaddition, "same" responses are generally faster than"different" responses when the stimuli consist ofstrings of letters (e.g., Bamber, 1969) even when the
This research was funded primarily by National Science Foundation Grant GB-31971X to Roger N. Shepard and also in part byNational Institute of Mental Health Small Grant MH 25722-01 tothe author. James P. Cunningham and Roger N. Shepard provided extremely helpful discussions concerning these data andadvice concerning interpretation. Peter 'Podgomy made manyexceedingly significant contributions to this research, from assistance in collecting and analyzing the data to fruitful discussionand .argumentation concerning interpretations of the results.Requests for reprints should be sent to: Lynn A. Cooper,Department of Psychology, C-009, University of California,San Diego, La Jolla, California 92093.
number of unique same and different pairs is equal(Krueger, 1973). The greater speed of "same"responses in visual comparison tasks is not alwaysfound, and Bindra, Donderi, and Nishisato (1968)have suggested that easily codable stimuli mayproduce quicker "same" responses. However, thedecrease in "different" reaction time with increasingdiscriminability between the stimuli to be comparedis obtained regardless of stimulus codability (Bindra,Donderi, & Nishisato, 1968).
Various models of the same-different visual comparison process have been proposed to account forthe results described above. (See Nickerson, 1972,for a comprehensive review.) One class of modelspostulates a single underlying comparison processwhich determines the speed of both "same" and"different" responses. The underlying process isgenerally assumed to consist of a self-terminatingcomparison of the features of the two visual stimuli,either serially (e.g., Egeth, 1966; Nickerson, 1969)or simultaneously (e.g., Hawkins, 1969). Thesesingle-process models can predict the relationshipbetween "different" reaction time and similarity of apair of visual stimuli, for as the number of featureson which two stimuli differ becomes greater, theearlier a differing feature will be found and the"different" response executed. Unfortunately, thisclass of models has difficulty predicting the greaterspeed of the "same" response, for presumably thisresponse occurs only after all features have beencompared and no difference has been detected.
A second class of models postulates two independent processes, one underlying the "same" responseand the other underlying the "different" response(Bamber, 1969; Bamber & Paine, 1973; Krueger,1973; Sekuler & Abrams, 1968; Tversky, 1969). As
433

434 COOPER
in single-process models, the "different" processorcompares the individual features of the two stimuliand executes the "different" response as soon as adifference is found. The "same" processor operatessimultaneously with the "different" processor andgives an output only if the two stimuli are judgedto be the same. By assuming independence of theprocesses underlying the "same" and the "different" responses, these dual-process models canaccount for all of the major results describedabove. In addition, dual-process models are consistent with the finding that the speed of "same"and "different" responses can be affected differentially by a given stimulus manipulation (e.g.,Egeth & Blecker, 1971; Hock, 1973; Krueger, 1970,1973).
The models of the same-different visual comparison process described above are designed toaccount for the data of an average subject. Implicitly,they assume that the only significant differencebetween subjects in the same-different comparisontask is that of overall speed. Recently, Cooper andPodgorny (in press) have reported qualitative differences between the performance of individual subjectsin a visual comparison task which are not easilyaccommodated by either single-process or dualprocess models.
In the Cooper-Podgorny experiment, six subjectswere required to imagine a predesignated random,angular two-dimensional shape rotated from acanonical picture-plane orientation into anotherdesignated orientation. When the subject had completed this "mental rotation" (cf. Cooper, 1975;Cooper & Shepard, 1973; Shepard & Metzler, 1971),he depressed a response key which provided ameasure of the time needed to carry out the mentaltransformation. Immediately following this firstresponse, a test form was presented in the previouslydesignated orientation and the subject was requiredto indicate as rapidly as possible, by means of a vocalresponse, whether the test form was the same as ordifferent from the previously designated randomshape. One of five "standard" random shapes,which varied in visual complexity, was used as thefirst or to-be-transformed stimulus on each trial.For each of the standard shapes, the test probecould be the same as the standard or different byvirtue of an overall reflection or a random perturbation of the points determining angles of the standardshape. Perturbed test probes varied in their ratedsimilarity to the standard, and six levels of similaritywere included. Thus, in the Cooper-Podgornyexperiment, the stimuli differed on a continuousdimension of shape. For the purposes of the presentpaper, only the second, discriminative reaction timewill be considered. Results of the Cooper-Podgornyexperiment indicated that all of the time required for
rotational processing was reflected in the first"preparation" response. Thus, the second "same""different" response provides a measure of the timerequired to compare a memory representation of avisual form with an externally presented visual testprobe and the time required to execute the response.
The discriminative reaction-time data of each ofthe six individual subjects were analyzed separately,and two distinct patterns emerged. For two of thesubjects, "same" responses were faster than "different" responses and "different" reaction time wasnot affected by the similarity of perturbed test probesto the standard. Cooper and Podgorny (in press)labeled these two individuals "Type I'; subjects.For the remaining four subjects, "same" responseswere slower than the average "different" response,but faster than "different" responses to highlysimilar test probes. In addition, for these foursubjects, "different" reaction time decreased monotonically with increasing dissimilarity between theperturbed test probes and the standard. These fourindividuals were labeled "Type II" subjects. Thepattern of errors was virtually identical for bothtypes of subjects. Errors to different probes weremore frequent than errors to same probes, and"different" error rates decreased monotonically asthe standard shape and the test probe became moredissimilar. That is, for Type I subjects, reactiontimes and error rates were uncorrelated, whereasfor Type II subjects there was a positive correlationbetween reaction times and error rates. For neithertype of subject did test-form complexity significantlyaffect reaction times or error rates. In addition,overall response speed of Type I subjects was about200 msec faster than that of Type II subjects.
These differences in performance suggest thatType I and Type (I subjects may compare a visualmemory representation with an external visual formin qualitatively different ways. One possibility isthat the faster Type l subjects use a holistic processin comparing an internal representation with a visualstimulus, while the slower Type II subjects use amore analytic comparison process. That is, Type Isubjects might attempt to match in parallel a memoryrepresentation with a visual test form, seeking toverify that the two representations are the same. Ifthis holistic comparison fails to produce a match,then the slower "different" response is made bydefault. Type II subjects might analytically comparethe features of a visual memory representation witha test form, checking for a difference between thetwo representations. Implications of the Type 1Type II performance differences for models ofsame-different visual comparison will be examined inthe General Discussion.
The purpose of Experiment I was to explore thegenerality of the Type I-Type II performance differ-

DIFFERENCES IN VISUAL COMPARISON 435
6 POINT FORM
Figure 1. The simplest (6-point) standardshape, shown with the seven associated distractors. "D I" through "06" forms represent random perturbations of the standardvarying in similarity to the standard.
@@@@STANDARD 01 OZ 03
I~@@®04 0~ 06 REFLECTED
ences reported by Cooper and Podgorny (in press).A new group of subjects was used, and an attemptwas made to replicate as closely as possible thestimulus conditions of the Cooper-Podgorny experiment. However, in the present experiment, nopreparatory mental rotation was required. Rather,subjects compared a memory representation of aform presented in a particular picture-plane orientation with a test shape presented in the sameorientation. In addition, the time between the presentation of the first or to-be-remembered stimulusand the presentation of the test stimulus was manipulated. The reason for this manipulation was thepossibility that a very brief interstimulus intervalmight encourage the presumably holistic Type Imode of processing. In contrast, a long interstimulusinterval might result in some degradation of thememory representation of the first stimulus and/orprovide sufficient time for the development of afeature code of the first stimulus, thus encouragingthe presumably analytic Type II mode of processing.
EXPERIMENT I
MethodSubjects. The 10 subjects were students at Stanford University
24 POINT FORM
and volunteers from the Stanford area who were paid for theirparticipation in five l-h sessions. Five of the subjects were male,five of the subjects were female, and all of the subjects wereright-handed.
Stimuli. The stimulus set was based upon the random,angular shapes used by Cooper (1975) and was identical to theset used by Cooper and Podgorny (in press). Five "standard"shapes were generated by Attneave and Arnoult's (1956)Method [ for the construction of random nonsense forms. Theshapes varied in the number of angles or points determininginflections on the perimeter, a measure highly correlated withratings of perceptual complexity of the forms (Auneave, 1957).The five standard shapes in the present experiment were composed of 6, 8, 12, 16, and 24 angles.
Associated with each of the five standard shapes was a set ofseven distractors, One of the distractors was a rel1ected or mirrorimage version of the standard. The six remaining distractors wererandom perturbations of the standard shape which varied in theirrated similarity to the standard. Figure 1 illustrates the simplest(6-point) standard shape and its associated distractors, andFigure 2 illustrates the most complex (24-point) standard shapeand its associated distractors,
The method for generating the perturbations of the standardshapes and the procedure for selecting the six perturbations ofeach standard included in the stimulus set are described in detailby Cooper and Podgorny (in press). In general, both the numberof points perturbed and the extent of each perturbation increasesfrom a "DI" distractor to a "D6" distractor (cf. Figures I and 2).In addition, the six perturbations associated with each of the fivestandard shapes were chosen from a much larger set of perturbations on the basis of ratings of the similarity of each perturbation
Figure 2. The most complex (24-point)standard shape, shown with the seven associated distractors. "Dl" through "06"forms represent random perturbations ofthe standard, varying in similarity to thestandard.
03
REFLECTED
OZ
06O~
01
04
STANDARD

436 COOPER
to its standard. This selection procedure ensured that rated similarity decreased monotonically and in approximately equal stepsfrom a "01" to a "06" perturbation. Thus, the complete set ofstimuli consisted of the five standard shapes, their reflected versions, and six perturbations associated with each standard. Someof the perturbations were highly similar to the standards ("01,""02") and some of the perturbations were highly dissimilar("05, .. "06").
The stimuli could be presented at anyone of six equally spacedorientations around the circle in the two-dimensional pictureplane. These six possible orientations consisted of 60° steps ofclockwise rotation from the arbitrarily chosen 0° position illustrated in Figures I and 2. Six orientations were used for the following reasons: (a) to ensure, as far as possible, that each of theexperimental trials was novel, and (b) to replicate, as closely aspossible, the stimulus conditions of the Cooper and Podgorny(in press) experiment. The stimuli were presented in an Iconixthree-field tachistoscope and appeared centered within anilluminated circular field with a black surround. The circularfield subtended a visual angle of 4°, and the stimuli subtended anangle of about 2°. Luminance of the circular field was 68.5 cd/rn",
Procedure. Each of the 10 subjects was randomly assigned toone of two experimental groups. Group A was composed ofthree. females and two males, and Group B was composed of twofemales and three males. The structure of each experimentaltrial was as follows: The subject was informed verbally that thetrial was about to begin, and an outline drawing of one of thefive standard shapes in one of the six possible picture-planeorientations was presented for a fixed duration of 3,000 msec.Immediately following the offset of the standard shape, a blankgray field was presented. The duration of this interstimulus interval was 100 msec for the subjects in Group A and 3,000 msec forthe subjects in Group B. Immediately following the offset of theblank gray field, a test form was presented and the subject determined as rapidly as possible whether the test form was the same asor different from the previously presented standard shape. The testform was always presented in the same orientation as the standardshape, and it could either be the same in shape as the standard ordifferent by virtue of a rel1ection or a perturbation (cf'. Figures I and 2).
The subject signaled the "same-different" response vocally, bysaying "S" or "0," respectively, into a microphone positioneddirectly below his mouth.' This vocal response activated a noiseoperated relay (Hunter sensitivity relay indicator 3203), whichtriggered the stop on a clock, displaying the total duration of the
test form, and terminated the visual display. Thus, reaction timefor the same-different discrimination was recorded from the onsetof the test form to the subject's response. Verbal feedback concerning the accuracy of the response was given on every trial.Instructions to the subjects emphasized both speed and accuracyof the discriminative response.
Prior to the experimental sessions. subjects were shownillustrations of the stimuli. In addition, each subject participatedin 30 practice trials randomly selected from the experimentaltrials. The composition of the experimental trials was as follows:Each of the five standard shapes was presented 84 times as thefirst or to-be-remembered stimulus, 14 times in each of the sixpicture-plane orientations. For any given standard shape presentedin any given orientation, on half of the trials the test form was thesame as that standard shape and on the other half of the trials thetest form was different. Each of the seven types of distraciors(six perturbations and one reflection) appeared equally often.Thus, each of the 10 subjects completed 420 experimental trials,as specified by the complete factorial design. The order of trialswas randomized anew for each subject. Subjects were informedthat the probability of same and different trials was equal.
The experimental trials required five I-h sessions for each subject. Each session began with a series of 10 practice trials.Although error reaction' times were recorded, trials on whicherrors were made were retaken, randomly interspersed with fillertrials, in order to obtain a complete set of error-free data for eachsubject.
Results and DiscussionOn the basis of the reaction-time criteria outlined
above, three of the subjects in the lOO-msecinterstimulus-interval condition were classified asType I subjects and two of the subjects were classified as Type II. All five of the subjects in the3,OOO-msec-interstimulus-interval condition were classified as Type II. Figure 3 presents the reaction-timedata for both types of subjects in the lOO-mseccondition and for the group data from the 3,OOO-mseccondition. All plotted points are based on correctreaction times only. Although the data are averagedwithin each type of subject, these average data arequite representative of the data of each of the
100 MILLISECOND lSI
Type IT (Slow) Ss
N'2
3000 MLLISECONO lSI
GROUP DATA N=5
• Difl_' RT
o s-RT
II
o II
II
II
•
II
II
I
"
o
Type I (Fast) Ss
N'3Ul0 lIOOzalil 1000Ul
:3 900~
BOOw~ 700~
z 600Qf- 500~w 400a:
z 300s~
Reflected 0I 02 D3 D4 D5 D602 03 04 05 06 Reflected DI D2 D3 D4 D5 D6
TYPE OF DIFFERENT PROBE
Figure 3. Mean "different" reaction time as a function of type of different probe for Experiment I. Mean "same" reaction timesare also shown. Type I subjects in the too-msec condition are shown in the left-hand panel, Type II subjects in the l()().msec condition are shown in the center panel, and the group data from the 3,OOO-msec condition are shown in the right-hand panel.

Type I and Type II subjects in both interstimulusinterval conditions.
In Figure 3, mean "different" reaction time isplotted as a function of type of different probe-inthe left-hand panel for the Type I subjects in thelOO-msec condition, in the center panel for theType II subjects in the lOO-msec condition, and inthe right-hand panel for the group data from the3,OOO-msec condition. The plotted points are averagedover subjects (within each type), test-form complexity, and test-form orientation. Mean "same"reaction times are also shown. Note that for Type Isubjects, "same" reaction time is generally fasterthan "different" reaction times. In addition, overall response speed is faster for Type I subjects thanfor Type II subjects (cf. Cooper & Podgorny,in press).
For the Type II subjects in the lOO-msec conditionand for the 3,OOO-msec condition group data, "different" reaction time exhibits a sharp monotonicdecrease with increasing dissimilarity between thestandard shape and the different probe. Average"same" reaction times are of intermediate speed,as are "reflected" reaction times for the Type IIsubjects in the lOO-msec condition. For the groupdata from the 3,OOO-msec condition, "reflected"responses are relatively rapid. For Type I subjects,"different" reaction times to all six types of perturbed test probes are approximately equal inspeed and "reflected" responses are somewhatfaster.
Separate analyses of variance were performed onthe "same" and the "different" reaction times ofthe two types of subjects in the lOO-msec conditionand on the group data from the 3,OOO-msec condition. In analyses of "same" responses, the factorswere Subjects, Test-Form Complexity, and TestForm Orientation. In analyses of "different"responses, there was an additional factor of Type ofDifferent Probe. Subjects was treated as a randomfactor in all analyses, and only correct reaction timeswere included. Consider, first, analyses of the datafrom the lOO-msec condition. For the "same"responses of Type I subjects, the only significantmain effect or interaction was the factor of Subjects[F(2,360) = 87.97, p < .01]. This was true also forthe "same" responses of Type II subjects [F(1,180) =48.61, p < .01]. For the "different" responses ofType I subjects, the main effect of Subjects was againsignificant [F(2,240) = 73.72, p < .01], as were twotwo-way interactions with this factor [for Subjects by Test-Form Complexity, F(8,240) = 3.39,p < .01, and for Subjects by Test-Form Orientation,F(IO,240) = 2.31, p < .05]. No other main effects orinteractions were significant. For the "different"responses of Type II subjects, two main effects weresignificant-Subjects and Type of Different Probe
DIFFERENCES IN VISUAL COMPARISON 437
[for Subjects, F(l, 120) = 10.24, P < .01, and forType of Different Probe, F(6,6) = 9.09, p < .01).Only one interaction, between the factors of TestForm Complexity and Type of Different Probe, wasmarginally significant [F(24,24) = 2.08, p < .05).
Results of the analyses of the 3,OOO-msec condition were similar to those of the Type II subjectsin the lOO-msec condition. For "same" responses,the only significant main effects were Subjects andTest-Form Complexity [F(4,720) = 134.34, P < .01,and F(4,16) = 7.85, p < .01, respectively], -and theonly significant interaction was between these sametwo factors [F(l6,nO) = 6.07,p < .01). For "different" responses, only the main effects of Subjects andType of Different Probe achieved statistical significance [F(4,480) = 110.08, p < .01, and F(6,24) =16.23, p < .01, respectively). The only significantinteractions were between Test-Form Complexityand Type of Different Probe [F(24,96) = 3.09,p < .01) and the three-way interaction of these twofactors with the factor of Subjects [F(96,480) = 1.56,P < .01).
Table I presents error rates to same test forms,different test forms, and the seven types of differentprobes separately for the Type I and Type II subjects in the lOO-msec condition and for the groupdata from the 3,OOO-msec condition. For the lOO-mseccondition, Type I subjects are generally more accurate than Type II subjects. However, despite themarked differences in the reaction-time data forthese two types of subjects (cf. Figure 3), the patternsin their error rates are quite similar. Both types ofsubjects make more errors to different than to sametest forms, and for both types of subjects error ratesdecrease monotonically with increasing dissimilaritybetween the standard shape and the test probe. Forsubjects in the 3,OOO-msec condition, error rates to
Table 1Error Rates to Same Test Forms, Different Test Forms. and theSeven Types of Different Probes for Type I Subjects in thel00-msec Condition, Type n Subjects in the l00-msec Condition
and the Group Datafor the 3,OOO-msec Condition(Experiment n
100-msec lSI
Type I Type II 3,000-msec lSISubjects Subjects Group Data(n = 3) (n = 2) (n = 5)
Same 7.08 11.39 9.09Different 8.56 15.15 8.79D1 26.23 33.33 31.19D2 14.27 27.71 14.28D3 6.25 10.45 5.66D4 4.25 7.69 1.96D5 1.10 3.22D6Reflected 1.10 9.09 .66
Note-Numbers are expressed in percentages.

438 COOPER
10 .20 30 40 50 607080 90 1.00
PROBABILITY OF RESPONSE
same and to different test forms are virtually equal.In addition, error rates to different test formsdecrease as the standard shape and the test formbecome less similar.
Figure 4. Mean reaction time as a function of probability ofthe response. Both correct and incorrect reaction times areplotted. Type I subjects in the lOO-msec condition are shownin the upper panel. Type n subjects in the lOO-msec conditionare shown in the center panel, and the group data from the3,OOO-msec condition are shown in the lower panel.
In Figure 4, mean reaction time is illustrated as afunction of response probability separately for theType I and Type II subjects in the lOO-msec condition and for the group data from the 3,OOO-mseccondition. Note that both correct ("same" I sameand "different" I different) and incorrect ("same" Idifferent and "different" I same) reaction times areplotted. Filled symbols represent correct responses,and unfilled symbols represent incorrect responses.Mean reaction time for correct "same" responses isplotted, and mean reaction times for correct "different" responses are plotted separately for each ofthe seven types of different probes. Similarly, meanreaction time for incorrect "different" responses isplotted, and mean reaction times for incorrect
. "same" responses are plotted separately for thevarious types of different probes. Only data pointswith five or more observations are included, so theincorrect "same" responses which are plottedrepresent error reaction times to different probeswhich are highly similar to the standard shape.
For the Type I subjects, both correct and incorrectreaction times fall within a lOO-msec range, and"same" responses (both correct and incorrect) aregenerally faster than "different" responses (bothcorrect and incorrect). For the Type II subjects inthe lOO-msec condition and for the group data fromthe 3,000-msec condition, the speed of the "different" response is strongly related to the probabilityof the response. This is a reflection of the facts that(a) correct reaction time to different probes decreasesand accuracy increases with increasing dissimilaritybetween the standard shape and the test form, and(b) incorrect "different" reaction time is the longestresponse made and occurs with low probability.Note, however, that the speed of the "same"response is not systematically related to the probability of the response. All "same" responses,whether correct or incorrect, are executed withapproximately equal speed. Implications of thesereaction-time-probability data for the nature ofType l-Type II processing differences will be outlined in the General Discussion.
In summary, the performance differences reportedby Cooper and Podgorny (in press) were obtained inthe present experiment only when the intervalbetween presentation of a standard shape and presentation of a test probe was short. When theinterstimulus interval was extended to 3,000 msec, allsubjects exhibited Type II performance. At firstblush, these results seem to suggest that the holisticsort of processing hypothesized to underlie Type Iperformance is possible only when a test form iscompared with a memory representation of animmediately preceding visual shape. Alternatively,the above results might simply be explained by asampling problem. That is, it may be that the length
I-
Type I ( FCIII) S. 100 MlLUSECCNl lSI
N'3 -
e= "."1.0=".'10A' "0"106, "0"1.
6 A A -0
0til'
e A
Go
T"" D ( SlowI S. IDO ~CONl 151
f-N'Z
A
-00 A •0
A
AA
A
A
A 3000 MlU.JSECDNO lSIGROlP DlTA
N'5A
..0 0
0 •A
A
t
-600
700
900
1000
1100
1ZOO
800
1100
IZOO
600
700
BOO
900
1000
1200
1100

DIFFERENCES IN VISUAL COMPARISON 439
Type I (Fast) 55 Type n (Slow) 55V'l
N=2 N=60 IZ 800 6 I0Id I
V'l ,J::J...J 700
./~Figure S. Mean "different" reaction time ias a function of type of different probe for
"" " ,Experiment II. Mean "same" responses are :::Ii 600also shown. In the left-hand panel, the data ~
for Type I subjects are shown for both z0
interstimulus intervals. In the right-hand ~ 500 -~0 Different RT, 3000 ms, 151
panel, the data for Type II subjects are ~ 0" 6. Same RT, 3000~, 151shown for both interstimulus intervals. ~ 6
r-~ • Different FIT, 0 ms. 151z 400 • Same RT, 0 m5, 151« •w:::Ii
Reflected 01 02 03 04 05 06 Reflecled 01 02 03 04 D5 06
TYPE OF DIFFERENT PROeE
of the memory retention interval has no effect onthe way in which a visual test form is compared witha memory representation. Rather, all of the fivesubjects in the 3,OOO-msec condition may have beenof the Type II variety and, thus, would haveexhibited the same performance with a short memoryinterval. In order 10 evaluate this possibility, asecond experiment was conducted with a new groupof subjects, and length of the interstimulus intervalwas varied within subjects.
EXPERIMENT II
MethodSubjects. The eight subjects were students and staff at Stanford
University and volunteers from the Stanford area who were paidfor their participation. Five of the subjects were female. andthree were male, All of the subjects were right-handed. None ofthe subjects had participated in Experiment I.
Stimuli. The stimuli and the apparatus were identical to thoseused in Experiment I. In order to reduce the number of trialsper subject, standard shapes and test forms were presented in oneof three equally spaced picture-plane orientations. The threepossible orientations consisted of 1200 steps of clockwise rotation from the arbitrarily chosen 0 0 position illustrated in Figures1and 2.
Procedure. The structure of the experimental trials, the natureof the required response, the composition of practice trials andthe instructions to the subjects were identical to those of Experiment I. For each of the eight subjects, two interstimulus intervals-O and 3,000 msec-> were used. Within each of the interstimulus-interval values. each of the standard shapes was presented 42 times as the first or to-be-remembered stimulus, 14times in each of the three picture-plane orientations. For anygiven standard shape presented in any given orientation. on halfof the trials the test form was the same as that standard shapeand on the other half of the trials thetest form was different.Each of the seven types of different probes appeared equallyoften. Thus, each of the eight subjects completed 420 experimental trials, as specified by the complete factorial design,
The experimental trials required five l-h sessions for each subject. Trials were blocked by condition (O-msec interstimulusinterval and 3,OOO-msec inierstirnulus interval), and two blocksof each type of trials were run in each session. Order of blockswas balanced across sessions, and the order of trials within each
block was random. As in Experiment I, error reaction times wererecorded and error trials were retaken.
Results and DiscussionTwo of the eight subjects were classified as Type I,
and six were classified as Type II. Each of the subjects showed the same pattern of performance inboth the 0- and the 3,OOO-msec-interstimulus-intervalconditions. Figure 5 presents the correct reactiontime data for both types of subjects and for bothinterstimulus intervals. Although the data areaveraged over subjects within each group, theaverage data for each type of subject are representative of the data of each individual subject in thegroup.
In Figure 5. mean "different" reaction timeaveraged over subjects, test-form complexity, andtest-form orientation-is plotted as a function oftype of different probe. Mean "same" reactiontimes are also shown. For the Type I subjects shownin the left-hand panel, "same" reaction times arefaster than "different" reaction times. For theType II subjects shown in the right-hand panel,"same" reaction times are of intermediate speed.For both types of subjects, the speed of both "same"and "different" 'responses is slower with the longerinterstimulus interval. In addition, overall responsespeed is faster for Type I than for Type II subjectsfor both interstirnulus intervals (cf, Figure 3; Cooper& Podgorny, in pess). As in Experiment 1, "different" reaction times of the Type I subjects are notsystematically related to type of different probe. Forthe Type II subjects, "different" reaction timedecreases markedly with increasing dissimilaritybetween the standard shape and the test form.
Separate analyses of variance were performed onthe "same" and the "different" reaction times forthe two types of subjects. In analyses of "same"responses, the factors were Subjects, InterstirnulusInterval Conditions, Test-Form Complexity, and
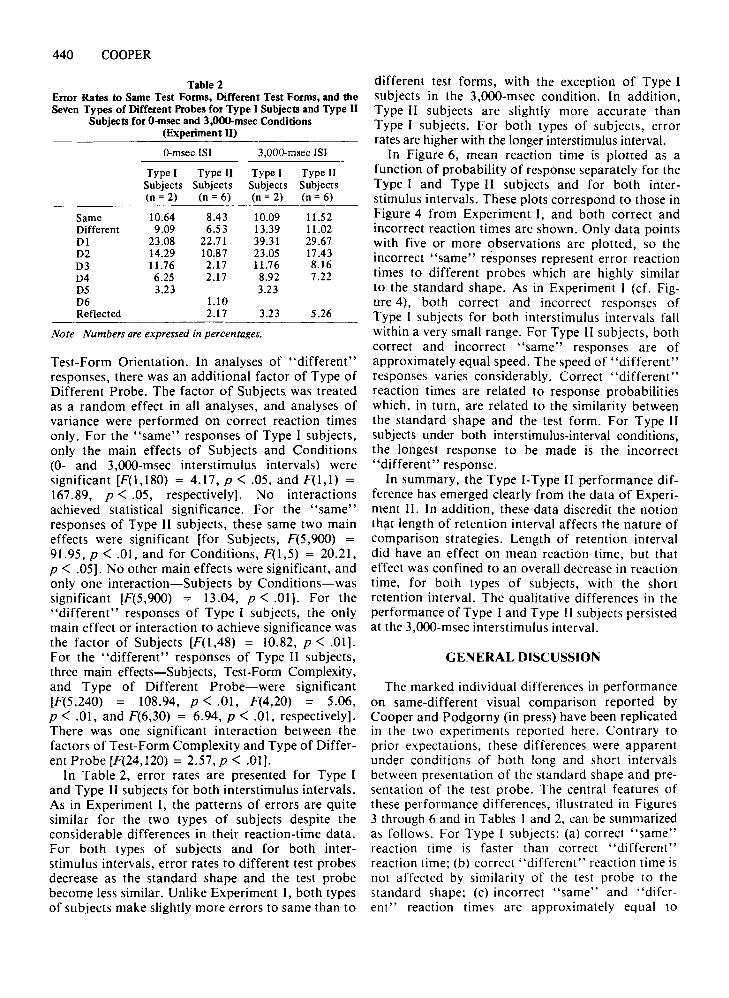
440 COOPER
Table 2Error Rates to Same Test Forms, Different Test Forms, and theSeven Types of Different Probes for Type I Subjects and Type II
Subjects for O-msec and 3,OOO-msec Conditions(Experiment II)
O-msec lSI 3,OOO-msec lSI
Type I Type II Type I Type IISubjects Subjects Subjects Subjects(n = 2) (n = 6) (n = 2) (n = 6)
Same 10.64 8.43 10.09 11.52Different 9.09 6.53 13.39 11.02Dl 23.08 22.71 39.31 29.67D2 14.29 10.87 23.05 17.43D3 11.76 2.17 11.76 8.16D4 6.25 2.17 8.92 7.22D5 3.23 3.23D6 1.10Reflected 2.17 3.23 5.26
Note-Numbers are expressed in percentages.
Test-Form Orientation. In analyses of "different"responses, there was an additional factor of Type ofDifferent Probe. The factor of Subjects. was treatedas a random effect in all analyses, and analyses ofvariance were performed on correct reaction timesonly. For the "same" responses of Type I subjects,only the main effects of Subjects and Conditions(0- and 3,OOO-msec interstimulus intervals) weresignificant [F(l,180) = 4.17, p < .05, and F(l,l) =167.89, p < .05, respectively]. No interactionsachieved statistical significance. For the "same"responses of Type II subjects, these same two maineffects were significant [for Subjects, F(5,900) =91.95, p < .01, and for Conditions, F(l,5) = 20.21,p < .05]. No other main effects were significant, andonly one interaction-Subjects by Conditions-wassignificant [F(5,900) = 13.04, p < .01]. For the"different" responses of Type I subjects, the onlymain effect or interaction to achieve significance wasthe factor of Subjects [F(l,48) = 10.82, p < .01].For the "different" responses of Type II subjects,three main effects-Subjects, Test-Form Complexity,and Type of Different Probe-were significant[F(5,240) = 108.94, p < .01, F(4,20) = 5.06,p < .01, and F(6,30) = 6.94, p < .01, respectively].There was one significant interaction between thefactors of Test-Form Complexity and Type of Different Probe [F(24,120) = 2.57, p < .01].
In Table 2, error rates are presented for Type Iand Type II subjects for both interstimulus intervals.As in Experiment I, the patterns of errors are quitesimilar for the two types of subjects despite theconsiderable differences in their reaction-time data.For both types of subjects and for both interstimulus intervals, error rates to different test probesdecrease as the standard shape and the test probebecome less similar. Unlike Experiment I, both typesof subjects make slightly more errors to same than to
different test forms, with the exception of Type Isubjects in the 3,OOO-msec condition. In addition,Type II subjects are slightly more accurate thanType I subjects. For both types of subjects, errorrates are higher with the longer interstimulus interval.
In Figure 6, mean reaction time is plotted as afunction of probability of response separately for theType I and Type II subjects and for both interstimulus intervals. These plots correspond to those inFigure 4 from Experiment I, and both correct andincorrect reaction times are shown. Only data pointswith five or more observations are plotted, so theincorrect "same" responses represent error reactiontimes to different probes which are highly similarto the standard shape. As in Experiment I (cf'. Figure 4), both correct and incorrect responses ofType I subjects for both interstimulus intervals fallwithin a very small range. For Type II subjects, bothcorrect and incorrect "same" responses are ofapproximately equal speed. The speed of "different"responses varies considerably. Correct "different"reaction times are related to response probabilitieswhich, in turn, are related to the similarity betweenthe standard shape and the test form. For Type IIsubjects under both interstimulus-interval conditions,the longest response to be made is the incorrect"different" response.
In summary, the Type I-Type II performance difference has emerged clearly from the data of Experiment II. In addition, these data discredit the notionthat length of retention interval affects the nature ofcomparison strategies. Length of retention intervaldid have an effect on mean reaction time, but thateffect was confined to an overall decrease in reactiontime, for both types of subjects, with the shortretention interval. The qualitative differences in theperformance of Type I and Type II subjects persistedat the 3,OOO-msec interstimulus interval.
GENERAL DISCUSSION
The marked individual differences in performanceon same-different visual comparison reported byCooper and Podgorny (in press) have been replicatedin the two experiments reported here. Contrary toprior expectations, these differences were apparentunder conditions of both long and short intervalsbetween presentation of the standard shape and presentation of the test probe. The central features ofthese performance differences, illustrated in Figures3 through 6 and in Tables I and 2, can be summarizedas follows. For Type I subjects: (a) correct "same"reaction time is faster than correct "different"reaction time; (b) correct "different" reaction time isnot affected by similarity of the test probe to thestandard shape; (c) incorrect "same" and "diferem" reaction times are approximately equal to

DIFFERENCES IN VISUALCOMPARISON 441
lo MILUSEC<Nl I~ITYIlII IF"") S.
10 20 ,30 110 .eo eo ,70 .eo 90 1.00
PR08AIIR.ITY Of' I!DPONSE
N·2
.0 "s' I.Ooy 10."'0"106· ''0''Is
A • ·.·.t00 •
TYIlI II (Siowl S. o Ml.USECCH> 151N'6
A
•0 •0 • ~•
r".1 t",*l Sa 3000 MI.UlEC(Hl 151N·2
• • .:A •0 •0 •
A Typo n (Slaw) Sa 3000 Ml.USECCH> 151
N060 •0 0 0
• •• •• ••
~
lIOO
400
900
700
700
900
500
800
600
1000
700
600
500
lIOO
700
500
1000
400
600
correct reaction times; (d) error rates and reactiontimes are not systematically related; and (e) overallresponse speed is quite fast. For Type II subjects:(a) correct "same" reaction time is slower thanaverage correct "different" reaction time. but fasterthan "different" reaction time to test probes whichare highly similar to the standard shape; (b) correct"different" reaction time decreases monotonicallyas the standard shape and the test probe becomeincreasingly dissimilar; (c) incorrect "same" reactiontimes are approximately equal to correct "same"reaction time, but incorrect "different" reactiontime is longer than all correct "different" reactiontimes; (d) error rates and reaction times are positivelycorrelated; and (e) overall response speed is relatively slow.
In addition, analyses of the correct "different"responses of Type II subjects consistently revealed asignificant interaction between the factors of TestForm Complexity and Type of Different Probe.Analyses of "different" reaction times of Type Isubjects never showed this interaction. If we consider the fact that only for Type II subjects wereresponse times affected by similarity between thetest probe and the standard shape, then this interaction can be explained in the following way. Despitethe rating procedure used to select the test stimuli.it is still possible that the sizes of the similaritysteps from DI perturbations to D6 perturbations(cf. Figures I and 2) were unequal both within agiven standard shape and between standards at thefive complexity levels. If this were true. then theseunequal similarity steps should have affected the"different" reaction times of Type 11 subjects. Inorder to evaluate this possibility, 10 naive subjectswere asked to make a complete rank ordering ofthe similarity between 30 pairs of shapes-each ofthe five standards paired with each of its six perturbations. These similarity rankings (I = most similarpair, 30 = least similar pair) were then correlatedwith rank order of "different" reaction-time speedfor each perturbation at each of the complexity levels(1 = slowest response, 30 = fastest response). Foreach of the three groups of Type II subjects in thepresent experiments (lOO-msec condition in Experiment I, 3,OOO-msec condition in Experiment 1, and
Figure 6. Mean reaction time as a function of probability ofresponse. Both correct and incorrect reaction times are plotted.The data of both Type I and Type n subjects for the G-msecinterstimulus-interval condition are shown in the upper twopanels. The data of both Type I and Type II subjects for the3,OOO-msec-interstimulus-interval condition are shown in thelower two panels.

442 COOPER
the average of both conditions in Experiment II),these rank-order correlations were above + .90, andfor all, p < .01. For the Type I subjects, whose"different" reaction times were not affected bysimilarity between the standard shape and the testform, all correlations were extremely small andnonsignificant.
Two invitingly simple explanations for the Type 1Type II performance differences can be discarded onthe basis of the constellation of results from Experiments I and II. First, the possibility that a "flooreffect" might explain the flat "different" reactiontime functions for the Type I subjects can be rejectedbecause the "same" responses of these subjects areeven faster than their "different" responses (cf. Figures 3 through 6). Second, the possibility that aspeed-accuracy tradeoff might somehow explain thesubject differences is unlikely for the followingreasons: (a) Neither type of subject consistentlymade more errors than the other type of subject(cf. Tables I and 2). (b) Neither type of subject consistently made more errors to different than to sametest probes (or vice versa, cf. Tables I and 2).(c) Despite the marked differences in the patternof the reaction-time data for the two types of subjects, the pattern of their error rates associated witheach class of test probe are quite comparable(cf. Figures 3 through 6 and Tables I and 2).
The Type l-Type II performance differences haveimplications for models of the same-different visualcomparison process, particularly in light of theinadequacy of the simple explanations discussedabove. Consider, first, the performance of the Type Isubjects. Neither the single-process nor the dualprocess models outlined in the introduction canexplain the Type I data, because both classes ofmodels postulate a self-terminating feature comparison which should produce longer "different"responses as the stimuli being compared becomemore similar.
A more plausible model for the performance ofType I subjects postulates a rapid, holistic comparison of a visual memory representation with a visuallypresented test form. If the outcome of this holisticcomparison produces a match, then the "same"response is executed. If the comparison fails to produce a match, then extra time is required to executethe "different" response. Under this account, the"different" response is made by default (only whenthe comparison process cannot verify that the memoryrepresentation and the test stimulus are the same).Thus, the "different" response should be executedwith uniform speed regardless of the similaritybetween the test probe and the standard shape.Both the correct and the incorrect reaction-time dataof Type I subjects are consistent with this simplesingle-process model. This is because all "same"
responses and all "different" responses are madeequally rapidly, regardless of whether or not theyare accurate (cf. Figures 4 and 6).
The pattern of errors made by Type I subjects(cf'. Tables 1 and 2) is also consistent with a modelwhich postulates a single, holistic comparison. Thisis because the memory representation of the standardshape is probably a somewhat degraded or incomplete representation of the standard. Thus, themajority of errors will occur when the comparisonprocess fails to detect a match (owing to the partiallydegraded memory representation of the standard),and also when the memory representation containsinsufficient information to permit rejection of adifferent probe which is highly similar to the standard. In addition, the higher error rates obtainedwith long interstimulus intervals (cf. Table 2) canbe explained by this simple model. That is, thesomewhat incomplete memory representation of thestandard shape presumably becomes even moredegraded with time, thereby resulting in more errorsof the sort outlined above.
Note, however, that one feature of the data ofType I subjects from Experiment II cannot bereadily explained-viz, the longer reaction timesobtained with the longer interstimulus interval(cf. Figures Sand 6). Presumably, the holistic,parallel nature of the comparison process resultsin nearly uniform "different" response speeds,regardless of the discriminability of the standardand the test probe. Why, then, should furtherdegradation of the memory representation of thestandard, resulting from the long interstimulusinterval, produce longer comparison times when thisdegradation serves only to reduce further the discriminability of the memory representation and thetest probe?
The performance of the Type II subjects is notconsistent with the class of single-process modelswhich assume a self-terminating comparison of thefeatures of two visual representations. This is becausethe "same" response, while slower than the average"different" response, is still faster than "different"responses to test probes which are highly similar tothe standard (cf. Figures 3 through 6). The data ofthe Type II subjects are, however, easily explainedby dual-process models which assume independenceof the processes underlying the "same" and the"different" responses. The intermediate speed of the"same" response suggests that the two processesoperate simultaneously. The monotonic decrease in"different" reaction time with increasing dissimilarity between the standard shape and the test probesuggests that the "different" processor comparesfeatures of the two visual representations, checkingfor a difference in shape. The greater the dissimilarity between the memory representation of the

standard and the visual test probe, the earlier adifference will be found and, thus, the faster willbe the "different" response. The "same" processoris assumed to operate in a manner similar to thesingle holistic comparison process postulated forType I subjects. That is, the processor attempts toverify that the memory representation of the standardand the visual test probe are the same, and if amatch is found the "same" response is executed.The crucial difference between the holistic Type Icomparison process and the processor underlying the"same" responses of Type II subjects is that thelatter process cannot give any output concerning amismatch, i.e., a "different" response (cf. Bamber,1969).
The incorrect reaction-time data of Type II subjects shown in Figures 4 and 6 provide strong support for a dual-process model. Note that for allthree groups of Type II subjects (IOO-msec conditionin Experiment I, 3,OOO-msec condition in Experiment I, and both conditions in Experiment II),both incorrect and correct "same" responses areapproximately equal in speed. This is preciselywhat we should expect if the "same" processoroperates independently and holistically, providingoutput only when sufficient evidence for a matchhas been obtained (whether or not this evidence isaccurate or inaccurate). In addition, note thatincorrect "different" responses are considerablylonger than all correct "different" responses.Again, this is precisely what we should expect ifthe "different" processor operates independentlyand performs a self-terminating comparison of thefeatures of the memory representation of the standard and the features of the test probe. When thetest probe is, in fact, the same as the standard,it takes considerable time for the "different" processor to obtain (inaccurate) evidence for a mismatchand output the "different" response. Unfortunately,two-process models are obviously uneconomical inthat only one process is logically sufficient to makethe same-different comparison. (This is clear fromthe above analysis of the processes underlying Type Iperformance.) Nonetheless, the sort of dual-processmodel outlined above provides an excellent accountof the performance of Type II subjects.
Recently, Hock and his associates (Hock, 1973;Hock, Gordon, & Marcus, 1974) have reported individual differences in same-different visual comparison which may be related to the Type l-Type IIdifferences reported here. Specifically, Hock hasfound that certain stimulus manipulations such assymmetry, familiarity (varied by rotating the stimulus from a previously learned orientation), andembeddedness affect the "same" response speed ofsome subjects and not of others. "Different" reaction times do not appear to be affected by these stimulus manipulations. Hock describes the subjects
DIFFERENCES IN VISUAL COMPARISON 443
whose "same" responses are facilitated by thesemanipulations as "structural" subjects. Subjectswhose "same" responses are unaffected are termed"analytic' subjects.
The terms which Hock uses to describe these performance differences are quite descriptive of theprocessing differences hypothesized to underlieType I and Type II performance. However, it is notclear whether there is any relationship betweenHock's results and the results of the present experiments. There are significant methodological differences between the Hock studies and the presentexperiments. In addition, Hock's differences areapparent only in "same" reaction times, while theType I-Type II differences are found in the patternof both "same" and "different" responses. Finally,Hock's "structural" subjects-whose processingwould presumably be similar to that of Type Isubjects-have longer reaction times than the "analytic" subjects-whose processing would presumablybe similar to that of Type II subjects. The situationis reversed in the case of the subjects in the presentexperiment, for Type I subjects have unusually rapidresponse times. Hopefully, further research canclarify the possible relationship between the"structural"-"analytic" performance difference andthe Type I-Type II performance differences.
In summary, the individual differences in samedifferent visual comparison reported by Cooper andPodgorny (in press) have been found again in thepresent experiments. Of the 24 subjects studied thusfar (6 in the Cooper-Podgorny experiment and .IS inthe present experiments), 17 have shown Type IIperformance while only 7 have shown Type I performance. If these samples are at all representativeof the population of subjects used in most visualcomparison experiments, then the relative paucityof Type I subjects may explain why this pattern ofperformance has not been detected by other investigators who generally report only group data. Furtherresearch concerning the nature of the processingdifferences which underlie Type I and Type II performance is currently in progress. Questions beingexplored include how obligatory these comparisonstrategies are and whether these comparison strategiesgeneralize to a variety of stimulus and task domains.Hopefully, such research will clarify the nature of theType I-Type II processing difference and lead to amore detailed model of same-different visualcomparison.
REFERENCES
ATTN EAVE. F. Physical determinants of the judged complexityof shapes. Journal ot' Experimental Psychology. 1957. 53.221·227
ATTNEAVE. F .. & ARNOULT. M. D. The quantitative study ofshape and pattern perception. Psychological Bulletin, 1956.53. 452-471.

444 COOPER
BAMBER. D. Reaction times and error rates for ..same··· ..different"judgments of multidimensional stimuli. Perception &Psychophysics. 1%9.6. 169-174.
BAMBER. D .. &: PAINE. S. Information retrieval processes in"same"·"different" judgments of letter strings. In S.Kornblum (Ed.). Attention and Performance IV. New York:Academic Press. 1973. .
BINDRA. D.. DONDER!. D. c.. & NISHISATO. S. Decisionlatencies of "same" and "different" judgments. Perception& Psychophysics. 1%8.3. 121-130.
COOPER. L. A. Mental rotation of random two-dimensionalshapes. Cognitive Psychology. 1975. 7. 20-43.
COOPER. L. A.. & PODGORNY. P. Mental transformations andvisual comparison processes: Effects of complexity andsimilarity. Journal of Experimental Psychology: Human Perception and Performance, in press.
COOPER. L. A.. &: SHEPARD. R. N. Chronometric studies of therotation of mental images. In W. G. Chase (Ed'>. Visualin/fir/nation processing. New York: Academic Press. 1973.
EGETH. H. Parallel versus serial processes in multidimensionalstimulus discrimination. Perception & Psychophysics. [%6.I. 245-252.
EGETH. H.. &: BLECKER. D. Differential effects of familiarityon judgments of sameness and difference. Perception &Psychophysics. 1971. 9. 321·326.
HAWKINS. H. L. Parallel processing in complex visual discrimination. Perception & Psychophysics. 1%9. S. 50:64,
HOCK. H. S. The effects of stimulus structure and farniliaritvon same-different comparison. Perception & Psychophysics'.197.1. 14. 413-420.
HOCK. H. S.. GORDON. G. P.. & MARCUS. N. Individualdifferences in the detection of embedded figures, Perception& Psychophysics. 1974. 15.47·52.
KRUEGER. L. E. Effect of bracketing lines on speed of "same""different" judgment of two adjacent letters. Journal ofExperimental Psychology. 1970. 84. 324-330. .
KRUEGER. L. E. Effect of stimulus frequency on speed of "same""different" judgments. In S. Kornblum (Ed.), Attention andnertormunce IV. New York: Academic Press. 1973.
NICKERSON. R, S. "Samet-t'different" response times withrnulti-uttribute stimulus differences, Perceptual and MotorSkills. 1%7.24.543-554.
NICKERSON. R. S.. "Same"-"different" response times: A modeland a preliminary test. Acta Psychologica, 1%9. 30. 257-275.
NICKERSON. R. S. Binarv-classification reaction time: A reviewof some studies of human information-processing capabilities.Psychonomic Monograph Supplements, 1972. 4. (WholeNo. t>5l. 275·.1Ill.
SEKULER. R. Woo &: ABRAMS. M. Visual sameness: A choice timeanahsis of pattern recognition processes. Journal otEx pcrimrutal Psychology. 1'lO1l. 77. 232·238.
SHEPARD. R. Noo &: METZLER. J. Mental rotation of threedimensional objectv. Science. 197 t. 171. 70f- 703.
TVERSKY, B. Pictoriul and verbal encoding in a short termmemorv task. Prrrrpticm & Psychophysics. 'I %9. 6. 225-233.
NOTES
I. Throughout, the identity of responses and reaction timeswill be placed in quotations. The nature of trial types andstimulus pairs will not be placed in quotations. For example. theexpression. probability ("same" I same). refers to the probabilityof a "same" response given that the pair of stimuli were, in fact,the same.
2. Following the experiment, the same 10 subjects were calledback in order to determine whether the time to say "S" differedfrom the time to say "D." For each of the 10 subjects, 40 trialswere run. On 20 of the trials, the letter S was presented and on 20of the trials, the letter D was presented. Subjects were required toname the presented letter as rapidly as possible. Mean time to say"S" was 430 msec, and mean time to say "D" was 423 msec.For individual subjects, the difference between "S" and "D"response times ranged from 30 to 2 msec.
(Received for publication November 19, 1975;accepted February 17, 1976.)