indicators of socioeconomic inequalities in cardiovascular
TRANSCRIPT
Stronger evidence, better decisions, improved health and welfare
Indicators of socioeconomic inequalities in cardiovascular disease, diabetes and chronic kidney disease


Indicators of socioeconomic inequalities in cardiovascular disease, diabetes and chronic kidney disease

The Australian Institute of Health and Welfare is a major national agency whose purpose is to create authoritative and accessible information and statistics
that inform decisions and improve the health and welfare of all Australians.
© Australian Institute of Health and Welfare 2019
This product, excluding the AIHW logo, Commonwealth Coat of Arms and any material owned by a third party or protected by a trademark, has been released under a Creative Commons BY 3.0 (CC BY 3.0) licence. Excluded material owned by third parties may include, for example, design and layout, images obtained under licence from third parties and signatures. We have made all reasonable efforts to identify and label material owned by third parties.You may distribute, remix and build upon this work. However, you must attribute the AIHW as the copyright holder of the work in compliance with our attribution policy available at <www.aihw.gov.au/copyright/>. The full terms and conditions of this licence are available at <http://creativecommons.org/licenses/by/3.0/au/>.
ISBN 978-1-76054-476-8 (PDF) ISBN 978-1-76054-477-5 (Print)DOI 10.25816/5ebca9d1fa7e0
Suggested citationAustralian Institute of Health and Welfare 2019. Indicators of socioeconomic inequalities in cardiovascular disease, diabetes and chronic kidney disease. Cat. no. CDK 12. Canberra: AIHW.
Australian Institute of Health and WelfareBoard ChairMrs Louise Markus
Chief Executive OfficerMr Barry Sandison
Any enquiries about or comments on this publication should be directed to:Australian Institute of Health and WelfareGPO Box 570Canberra ACT 2601Tel: (02) 6244 1000Email: [email protected]
Published by the Australian Institute of Health and Welfare.
Please note that there is the potential for minor revisions of data in this report.Please check the online version at <www.aihw.gov.au> for any amendments.

iiiIndicators of socioeconomic inequalities in cardiovascular disease, diabetes and chronic kidney disease
ContentsAcknowledgments ............................................................................................................................v
Abbreviations ...................................................................................................................................vi
Symbols .............................................................................................................................................vi
Summary ..........................................................................................................................................vii
1 Introduction ...............................................................................................................................1
Impact varies across socioeconomic groups .........................................................................1
What we already know ..............................................................................................................1
Underlying causes of socioeconomic inequalities in health ................................................3
What this report does ...............................................................................................................3
2 Cardiovascular disease ............................................................................................................6
Overview of findings on socioeconomic inequalities in cardiovascular disease ..............6
Heart attack by socioeconomic area .......................................................................................8
Stroke by socioeconomic area................................................................................................10
Cardiovascular disease mortality by socioeconomic area .................................................12
Cardiovascular disease mortality by income .......................................................................14
Cardiovascular disease mortality by education ..................................................................15
Cardiovascular disease mortality by housing tenure .........................................................16
3 Diabetes ....................................................................................................................................17
Overview of findings on socioeconomic inequalities in diabetes .....................................18
Diabetes by socioeconomic area ...........................................................................................20
Diabetes mortality by socioeconomic area ......................................................................... 22
Diabetes mortality by income ................................................................................................24
Diabetes mortality by education ...........................................................................................25
Diabetes mortality by housing tenure ..................................................................................26
4 Chronic kidney disease ..........................................................................................................27
Overview of findings on socioeconomic inequalities in chronic kidney disease ............27
Chronic kidney disease by socioeconomic area ..................................................................29
Treated end-stage kidney disease by socioeconomic area ............................................... 30
Chronic kidney disease mortality by socioeconomic area .................................................32
Chronic kidney disease mortality by income ...................................................................... 34
Chronic kidney disease mortality by education ..................................................................35
Chronic kidney disease mortality by housing tenure .........................................................36
5 Gaps and limitations ..............................................................................................................37
iv Indicators of socioeconomic inequalities in cardiovascular disease, diabetes and chronic kidney disease
Appendix A: Data sources .............................................................................................................39
ABS 2011–12 Australian Health Survey ..................................................................................39
ABS Death Registrations to Census linked dataset .............................................................39
AIHW National Mortality Database ...................................................................................... 40
AIHW National Hospital Morbidity Database ..................................................................... 40
Australian and New Zealand Dialysis and Transplant Registry .........................................41
National Diabetes Services Scheme ......................................................................................41
Appendix B: Methods and classifications ..................................................................................42
Age-standardised rates ...........................................................................................................42
Disease classifications .............................................................................................................42
Estimating heart attack and stroke events ......................................................................... 43
Measures of inequality ........................................................................................................... 43
Measures of socioeconomic position ................................................................................... 44
Significance testing ................................................................................................................. 46
Underlying and associated causes of death ....................................................................... 46
References .......................................................................................................................................47
List of tables ....................................................................................................................................50
List of figures ...................................................................................................................................50
Related publications ......................................................................................................................51

vIndicators of socioeconomic inequalities in cardiovascular disease, diabetes and chronic kidney disease
AcknowledgmentsThe authors of this report are Michael de Looper, Kate Brewer, Sophie Guo, Kate Hafekost, Lany Trinh and Thao Vu of the Cardiovascular, Diabetes and Kidney Unit at the Australian Institute of Health and Welfare.
The authors thank Larissa Baines, Lauren Benger, Larissa Fischer, Louise Gates and Alan Jenner from the Australian Bureau of Statistics, and Rosemary Korda from the Australian National University for their assistance.
Valuable guidance and advice were provided by Matthew James, Richard Juckes, Miriam Lum On, Sushma Mathur, Lynelle Moon, David Whitelaw and Members of the National Vascular Disease Monitoring and Advisory Group, including Tom Briffa, Derek Chew, Annette Dobson, Bettina Douglas, Mark Harris, Mark Nelson, Jonathan Shaw, Mandy Thrift, Andrew Tonkin and Sophia Zoungas.
This project was funded by the Department of Health.

vi Indicators of socioeconomic inequalities in cardiovascular disease, diabetes and chronic kidney disease
AbbreviationsABS Australian Bureau of Statistics
AHS Australian Health Survey
AIHW Australian Institute of Health and Welfare
ANZDATA Australia and New Zealand Dialysis and Transplant Registry
ASCED Australian Standard Classification of Education
CKD chronic kidney disease
CVD cardiovascular disease
ESKD end-stage kidney disease
IRSD Index of Relative Socio-economic Disadvantage
NDSS National Diabetes Services Scheme
NHMD National Hospital Morbidity Database
NHS National Health Survey
NMD National Mortality Database
NMDS National minimum data set
PAF population attributable fraction
RII relative index of inequality
SEIFA Socio-Economic Indexes for Areas
Symbols— nil or rounded to zero

viiIndicators of socioeconomic inequalities in cardiovascular disease, diabetes and chronic kidney disease
Summary Australians as a whole enjoy good health, but the benefits are not shared equally by all. People who are socioeconomically disadvantaged have, on average, greater levels of cardiovascular disease (CVD), diabetes and chronic kidney disease (CKD).
This report uses latest available data to measure socioeconomic inequalities in the incidence, prevalence and mortality from these 3 diseases, and where possible, assess whether these inequalities are growing. Findings include that, in 2016:
• males aged 25 and over living in the lowest socioeconomic areas of Australia had a heart attack rate 1.55 times as high as males in the highest socioeconomic areas. For females, the disparity was even greater, at 1.76 times as high
• type 2 diabetes prevalence for females in the lowest socioeconomic areas was 2.07 times as high as for females in the highest socioeconomic areas. The prevalence for males was 1.70 times as high
• the rate of treated end-stage kidney disease for males in the lowest socioeconomic areas was 1.52 times as high as for males in the highest socioeconomic areas. The rate for females was 1.75 times as high
• the CVD death rate for males in the lowest socioeconomic areas was 1.52 times as high as for males in the highest socioeconomic areas. For females, the disparity was slightly less, at 1.33 times as high
• if all Australians had the same CVD death rate as people in the highest socioeconomic areas in 2016, the total CVD death rate would have declined by 25%, and there would have been 8,600 fewer deaths.
CVD death rates have declined for both males and females in all socioeconomic areas since 2001—however there have been greater falls for males in higher socioeconomic areas, and as a result, inequalities in male CVD death rates have grown.
• Both absolute and relative inequality in male CVD death rates increased—the rate difference increasing from 62 per 100,000 in 2001 to 78 per 100,000 in 2011, and the relative index of inequality (RII) from 0.25 in 2001 to 0.53 in 2016.
Often, the health outcomes affected by socioeconomic inequalities are greater when assessed by individual characteristics (such as income level or highest educational attainment), than by area.
• Inequalities in CVD death rates by highest education level in 2011–12 (RII = 1.05 for males and 1.05 for females) were greater than by socioeconomic area in 2011 (0.50 for males and 0.41 for females).
The impact on death rates of socioeconomic inequality was generally greater for diabetes and CKD than for CVD.
• In 2016, the diabetes death rate for females in the lowest socioeconomic areas was 2.39 times as high as for females in the highest socioeconomic areas. This compares to a ratio 1.75 times as high for CKD, and 1.33 for CVD. For males, the equivalent rate ratios were 2.18 (diabetes), 1.64 (CKD) and 1.52 (CVD).

viii

1Indicators of socioeconomic inequalities in cardiovascular disease, diabetes and chronic kidney disease
1 IntroductionChronic diseases such as cardiovascular disease (CVD), diabetes and chronic kidney disease (CKD) are leading causes of ill health, disability and death in Australia.
In addition to the personal and community costs, these chronic diseases result in a significant economic burden, because of the combined effects of health-care costs and lost productivity from illness and death.
Australians diagnosed with 1 or more of these diseases often have complex health needs, may die prematurely and have poorer overall quality of life. As a result, CVD, diabetes and CKD are priorities for action in the health sector, a key focus of which is the prevention and better management of chronic disease to improve health outcomes.
Impact varies across socioeconomic groupsAustralians as a whole enjoy good health, but good health is not equally shared by all. The impact of chronic diseases, including CVD, diabetes and CKD, is unequally distributed among the population. Some population groups have higher disease rates, and these higher rates are often associated with earlier disease onset, greater severity and a need for more complex management.
Most apparent are inequalities in chronic disease among Aboriginal and Torres Strait Islander people and non-Indigenous Australians. Social and economic factors are estimated to account for slightly more than one-third (34%) of the ‘good health’ gap between the 2 groups, with health risk factors such as high blood pressure, smoking and risky alcohol consumption explaining another 19%, and 47% due to other, unexplained factors. An estimated 11% of the total health gap can be attributed to the overlap, or interactions between the social determinants and health risk factors (AIHW 2018a).
It is well established that people who are socioeconomically disadvantaged have, on average, a greater disease burden (AIHW 2016). They are at greater risk of poor health, have higher rates of illness, disability and death, and live shorter lives than people from higher socioeconomic groups (Mackenbach 2015). The general observation is that the higher a person’s socioeconomic position, the healthier they tend to be—a phenomenon often termed the ‘social gradient of health’. In Australia, many chronic diseases, including CVD, diabetes and CKD, exhibit a social gradient.
The Australian Government’s National Strategic Framework for Chronic Conditions reaffirms that people who experience socioeconomic disadvantage are more negatively impacted than the general population. Socioeconomically disadvantaged people require greater investment and sustained effort to reduce risk, complications, multimorbidities and disabilities associated with their conditions (AHMAC 2017). Reduction of health inequalities is also one of the guiding principles of the Australian National Diabetes Strategy 2016–2020 (Department of Health 2015).
What we already knowMuch is already known about socioeconomic inequalities in CVD in Australia.
Early studies focussed on how levels of CVD varied according to individual characteristics. People with lower occupational status or levels of education were found to be at greater risk of developing cardiovascular disease than those with higher occupational status or education (Bennett 1995, Dobson et al. 1985). The incidence of heart attack varied among occupational groups, with men in less skilled manual occupations at greater risk (Burnley 1999). Men in manual occupations were also more likely to die from coronary heart disease or stroke than men in professional occupations (Bennett 1996).
More recent studies have used area-level measures of socioeconomic disadvantage to assess inequalities in CVD (see Box 1.1). These studies found that both sexes living in lower socioeconomic areas were at greater risk of heart attack and death from coronary heart disease (Taylor et al. 1999).

2 Indicators of socioeconomic inequalities in cardiovascular disease, diabetes and chronic kidney disease
Fatal and non-fatal stroke incidence was higher among people living in areas with greater socioeconomic disadvantage (Thrift et al. 2006, Heeley et al. 2011). Adults living in the most disadvantaged areas had significantly higher death rates from CVD, including from coronary heart disease and stroke, than adults living in the least disadvantaged areas (AIHW: Moon & Waters 2006).
Both approaches—using individual or area-level data to measure socioeconomic disadvantage—found inequalities in CVD. However, the level of inequality varied depending on which type of measure was used (Dutton et al. 2005). When the occurrence of major cardiovascular events—such as heart attack or stroke—was assessed, for example, greater inequalities were found when using individual-level measures of socioeconomic disadvantage (such as a persons’ education or income level) than area-level measures (Korda et al. 2016). Area-level data reflect the overall or average socioeconomic position of the population of an area, and do not show how individuals living in the same area might differ from each other in their socioeconomic position.
The picture of CVD inequality has changed over time in Australia. In the 1970s, people in professional occupations had much lower death rates from coronary heart disease, compared with manual occupations, and they also experienced greater declines over time (Dobson et al. 1985; Gibberd et al. 1984). By the early 2000s, differences in mortality rates between lower and higher socioeconomic groups had narrowed for both coronary heart disease (in females) and stroke (in males and females), although coronary heart disease differences for males were still large (Page et al. 2012). The proportion of deaths associated with socioeconomic inequality had increased for all CVD, including for coronary heart disease and stroke (AIHW: Moon & Waters 2006).
A number of studies have examined socioeconomic inequalities in diabetes. These found that:
• adults living in the lowest socioeconomic areas in 2011–12 were more than 3 times as likely to have diabetes as those living in the highest socioeconomic areas (AIHW 2014)
• individual behaviours that increased disease risk, such as smoking and physical inactivity, help to explain the relationship between low education and type 2 diabetes (Williams et al. 2010)
• low socioeconomic position was more consistently associated with a worse profile of diabetes among women, as compared with men (Kavanagh et al. 2010)
• socioeconomic position explained some but not all of the difference in diabetes prevalence between Aboriginal and Torres Strait Islander people and non-Indigenous Australians (Cunningham 2010)
• socioeconomic inequalities in prevalence rates of diabetes were greater than for other chronic diseases such as CVD (Glover et al. 2004).
Research has also documented socioeconomic inequalities in chronic kidney disease:
• the prevalence of biomedical signs of CKD for adults living in the lowest socioeconomic areas was 1.6 times as high as the rate for those living in the highest socioeconomic areas in 2011–12 (AIHW 2014)
• capital city areas that are more disadvantaged have higher rates of end-stage kidney disease (ESKD) than capital city areas that are less disadvantaged (Cass et al. 2001)
• the incidence of kidney replacement therapy—dialysis or kidney transplant—is higher in socioeconomically disadvantaged areas (Grace et al. 2012).

3Indicators of socioeconomic inequalities in cardiovascular disease, diabetes and chronic kidney disease
Underlying causes of socioeconomic inequalities in healthThere are various reasons why socioeconomically disadvantaged people experience poorer health. Evidence points to the close relationship between people’s health and the living and working conditions which form their social environment. Factors such as socioeconomic position, early life, social exclusion, social capital, employment and work, housing and the residential environment—known collectively as the ‘social determinants of health’—can act to either strengthen or to undermine the health of individuals and communities (Wilkinson & Marmot 2003).
These social determinants play a key role in the incidence, treatment and outcomes of chronic diseases. Social determinants can be seen as ‘causes of the causes’—that is, as the foundational determinants which influence other health determinants such as individual lifestyles and exposure to behavioural and biological risk factors.
Socioeconomic factors influence chronic disease through multiple mechanisms. Socioeconomic disadvantage may adversely affect chronic disease risk through its impact on mental health, and in particular, on depression. Socioeconomic gradients exist for multiple health behaviours over the life course, including for smoking, overweight and obesity, and poor diet. When combined, these unhealthy behaviours help explain much of the socioeconomic health gap. Current research also seeks to link social factors and biological processes which affect chronic disease. In CVD, for example, socioeconomic determinants of health have been associated with high blood pressure, high cholesterol, chronic stress responses and inflammation (Havranek et al. 2015).
The direction of causality of social determinants on health is not always one-way (Berkman et al. 2014). To illustrate, people with chronic conditions may have a reduced ability to earn an income; family members may reduce or cease employment to provide care for those who are ill; and people or families whose income is reduced may move to disadvantaged areas to access low-cost housing.
Action on social determinants is often seen as the most appropriate way to tackle unfair and avoidable socioeconomic inequalities. There are significant opportunities for reducing death and disability from CVD, diabetes and CKD through addressing their social determinants.
What this report doesThis report presents a range of indicators to describe the current magnitude of socioeconomic inequalities in CVD, diabetes and CKD in Australia. Where possible, it presents long-term data to assess whether these inequalities have changed over time.
The results contribute to the evidence base for preventing and managing chronic diseases, by providing a baseline for ongoing monitoring of inequalities in CVD, diabetes and CKD.
To assess inequalities, both individual and area-based measures of socioeconomic position are used (Box 1.1). These measures include income, education and housing tenure, which are reported by individuals, and the Socio-Economic Indexes for Areas (SEIFA) constructed by the Australian Bureau of Statistics, which is area-based.
Although individual measures of socioeconomic position are included in some health data sets, area-based measures are generally used to evaluate health inequalities. To more fully compare variations in cardiovascular disease, diabetes and kidney disease, this report adds a number of individual measures, through use of the newly linked ABS Death Registrations to Census data set (see Appendix A).

4 Indicators of socioeconomic inequalities in cardiovascular disease, diabetes and chronic kidney disease
Box 1.1: Measuring socioeconomic position
Populations can be grouped along different social dimensions. These dimensions include socioeconomic position, ethnicity, gender, and social or political power (ABS 2011; Galobardes et al. 2007).
This report focusses on how levels of CVD, diabetes and CKD differ in the Australian population according to socioeconomic position.
Inequalities in CVD, diabetes and CKD are compared using 4 different stratifiers of socioeconomic position:
• income—the equivalised household income for persons living in private dwellings
• education—the highest educational attainment among persons aged 25–74
• housing tenure—whether private dwellings are owned or are rented
• area-level disadvantage—the Index of Relative Socioeconomic Disadvantage, 1 of the ABS Socio-Economic Indexes for Areas (SEIFA), which classifies individuals according to the socioeconomic characteristics of the area in which they live. Areas were ranked according to their socioeconomic position and classified into 5 groups (or quintiles), based on their rank.
Each population group is compared with a reference group—in this report, this is the group with the highest socioeconomic position.
For more information, see Appendix B.
A number of measures are used to indicate the level of inequality between population groups (Box 1.2). These measures gauge both the absolute and relative impacts of inequality. Simple measures—the rate ratio (lowest/highest groups) and rate difference (lowest – highest groups)—use information from the lowest and highest socioeconomic groups only. More complex measures—the relative index of inequality (RII) and population attributable fraction (PAF)—use information from all socioeconomic groups.

5Indicators of socioeconomic inequalities in cardiovascular disease, diabetes and chronic kidney disease
Box 1.2: Measuring socioeconomic inequality
This report uses several measures to give a fuller understanding of the level of socioeconomic inequality between population groups.
Both absolute and relative measures are important, as they reflect different aspects of inequality. Absolute measures indicate the magnitude of inequality (using the measure rate difference in this report), while relative measures compare the relative size of the inequality (using the measures rate ratio, relative index of inequality and population attributable fraction).
Rate difference (absolute inequality)—The rate for the group of interest minus the rate for the reference group. A rate difference of greater than 0 indicates that the rate for the group of interest is higher than the rate for the reference group. A rate difference of less than 0 indicates that the rate for the group of interest is lower than the rate for the reference group. A rate difference of 0 indicates that the rate for the group of interest is the same as the rate for the reference group.
Rate ratio (relative inequality)—The rate for the group of interest relative to (divided by) the rate for the reference group. A rate ratio of greater than 1 indicates that the rate for the group of interest is higher than the rate for the reference group. A rate ratio of less than 1 indicates that the rate for the group of interest is lower than the rate for the reference group. A rate ratio of 1 indicates that the rate for the group of interest is the same as the rate for the reference group.
Relative index of inequality (RII) (relative inequality)—The RII describes the gradient of health observed across the disadvantage scale, relative to the mean. It is calculated using modelling (regression analysis). An RII of 0 indicates no inequality. Larger values of the RII indicate higher levels of inequality relative to the mean.
Population attributable fraction (PAF) (relative inequality)—The population attributable fraction (PAF) is a relative measure of impact. It is the percentage of total cases that would be avoided if all groups had the same rate as the least disadvantaged group. Large values for the PAF indicate high levels of inequality.
For more information, see Appendix B.
This report is structured by disease, with separate chapters on CVD, diabetes and CKD. Each chapter begins with a description of the disease and its effect on the Australian population. An overview of findings summarises the indicators which follow. These indicators measure socioeconomic inequalities in disease incidence, prevalence and mortality, assessed by income, education, housing tenure and area-level disdavantage. Where data allow, trends over time are evaluated.
A section on gaps and limitations in monitoring socioeconomic inequalities in CVD, diabetes and CKD concludes the report.

6 Indicators of socioeconomic inequalities in cardiovascular disease, diabetes and chronic kidney disease
2 Cardiovascular diseaseCardiovascular disease (CVD) includes a range of conditions that affect the heart or blood vessels. The most common and serious types include coronary heart disease, stroke and heart failure. CVD is a major health problem in Australia, despite declining mortality and hospitalisation rates.
One of the main underlying causes of CVD is atherosclerosis. This is a process in which fatty and fibre-like deposits build up on the inner walls of arteries, often forming plaques that can then cause blockages. Atherosclerosis is most serious when it leads to reduced or blocked blood supply to the heart (causing angina or heart attack) or to the brain (causing stroke). The process leading to atherosclerosis is slow and complex, often starting in childhood and progressing with age.
Factors that are known to increase the risk of developing CVD include poor nutrition, insufficient physical activity, overweight and obesity, smoking, high blood pressure, high blood cholesterol and diabetes. High blood pressure can lead to serious health problems such as heart attack, stroke, heart failure or kidney disease.
Box 2.1: How common is cardiovascular disease?
Based on self-reporting, an estimated 1.2 million Australians aged 18 and over (6.7% of the adult population) had heart, stroke and vascular diseases in 2014–15, which encompasses a range of cardiovascular conditions including angina, heart attack and stroke (ABS 2015).
Of these, 472,000 had a heart attack or other form of coronary heart disease and 282,000 experienced angina. In addition, 111,000 adults had heart failure in 2014–15, with two-thirds of these (72,800 people) aged 65 years and over (AIHW 2018b).
In 2015, based on hospital and mortality data, an estimated 61,600 people aged 25 and over had an acute coronary event in the form of a heart attack or unstable angina—around 170 events every day (AIHW 2018a).
Almost 400,000 people—199,000 males and 195,000 females—were estimated to have had a stroke at some time in their lives, based on self-reported data (ABS 2016a). In 2015, there were around 36,700 stroke events–around 100 every day.
Overview of findings on socioeconomic inequalities in cardiovascular diseaseThis overview summarises findings for the indicators of socioeconomic inequalities in CVD which follow. Where data allow, trends over time are evaluated.
Incidence• The incidence of both heart attack and stroke increases with increasing socioeconomic disadvantage.
• Males and females aged 25 and over living in the lowest socioeconomic areas in 2016 had heart attack rates that were 1.55 and 1.76 times as high, respectively, as rates for males and females in the highest socioeconomic areas (Figure 2.1).
• Similarly, stroke incidence rates for males and females living in the lowest socioeconomic areas were 1.21 and 1.27 times as high, respectively, as rates for males and females in the highest socioeconomic areas (Figure 2.2).
• If all Australians had the same heart attack rate as people in the highest socioeconomic areas in 2016, the total heart attack rate would have declined by 36%, and there would have been 19,700 fewer heart attacks.
CVD

7Indicators of socioeconomic inequalities in cardiovascular disease, diabetes and chronic kidney disease
Mortality• There are large socioeconomic inequalities in CVD death rates.
• The CVD death rate for males living in the lowest socioeconomic areas in 2016 was 1.52 times as high as the rate for males in the highest socioeconomic areas (Figure 2.3). The disparity for disadvantaged females was slightly less, at 1.33 times as high.
• Had the inequality in CVD death rates between socioeconomic groups been eliminated, the overall death rate would have declined by 25%, with 8,600 fewer deaths.
• Inequalities in CVD death rates are even greater for some individual characteristics. The CVD death rate for males aged 25–74 with secondary education or lower in 2011–12 was more than twice (2.42 times) as high as for males with a Bachelor degree or higher (Figure 2.5). The equivalent female rate was 2.17 times as high.
• If all Australians aged 25–74 had the same CVD death rate as those with a Bachelor degree or higher in 2011–12, the total CVD death rate would have declined by 55%, and there would have been 7,800 fewer deaths.
• Inequalities in CVD death rates by highest education level in 2011–12 (RII = 1.05 for males and 1.05 for females) were greater than inequalities by socioeconomic area in 2011 (0.50 for males and 0.41 for females).
Male and female inequalities• Inequalities in CVD mortality are greater for males than for females.
• The CVD mortality rate for males with the lowest equivalised household income in 2011–12 was 1.83 times that of males with the highest income, whereas the corresponding rate for females was 1.32 times as high (Figure 2.4).
• However, there were greater inequalities for females in the incidence of heart attack. In 2016, the heart attack rate for females in the lowest socioeconomic areas was 1.76 times as high as for females in the highest socioeconomic areas, whereas the male rate was 1.55 times as high (Figure 2.1).
Changes in inequalities• Although rates of heart attack and stroke, and deaths from CVD are declining overall, in some
instances socioeconomic inequalities are widening.
• For females, the heart attack rate ratio (lowest/highest socioeconomic group) increased from 1.59 in 2006 to 1.76 in 2016, and the relative index of inequality (RII, a measure of inequality across all socioeconomic groups) increased from 0.57 in 2006 to 0.64 in 2016 (Table 2.1).
• CVD death rates have declined for both males and females in all socioeconomic areas since 2001, however there have been greater falls for males in higher socioeconomic areas, and as a result inequalities in CVD death rates have grown. There were increases in both absolute and relative measures, including the rate difference (62 per 100,000 in 2001 to 78 per 100,000 in 2011) and the RII (0.25 in 2001 to 0.53 in 2016) (Table 2.3).

8 Indicators of socioeconomic inequalities in cardiovascular disease, diabetes and chronic kidney disease
Heart attack by socioeconomic area
Figure 2.1: Heart attack incidence, people aged 25 and over, by socioeconomic area and sex, 2016
Note: Rates are age-standardised to the 2001 Australian population.Sources: AIHW National Hospital Morbidity Database and AIHW National Mortality Database; Table S1.
Inequalities in 2016• The incidence of heart attack (acute coronary events) among males living in the lowest
socioeconomic areas (567 per 100,000 population) was 1.55 times as high as the rate among males in the highest socioeconomic areas (367 per 100,000 population) (Figure 2.1).
• The difference in the male heart attack rate between the lowest and highest socioeconomic areas was 200 per 100,000 population.
• The incidence of heart attack among females in the lowest socioeconomic areas (272 per 100,000 population) was 1.76 times as high as the rate among females in the highest socioeconomic areas (155 per 100,000 population).
• The difference in the female heart attack rate between the lowest and highest socioeconomic areas was 117 per 100,000 population.
• If all Australians had the same heart attack rate as people in the highest socioeconomic areas in 2016, the total heart attack rate would have declined by 36%, and there would have been 19,700 fewer heart attacks.
CVD
0
200
400
600
500
300
100
Group 1 (lowest) Group 2 Group 3 Group 4 Group 5 (highest)
Per 100,000
Socioeconomic area
Males Females

9Indicators of socioeconomic inequalities in cardiovascular disease, diabetes and chronic kidney disease
Changes in inequalitiesInequalities in male heart attack incidence changed little between 2006 and 2016. The rate ratio, relative index of inequality (RII) and population attributable fraction (PAF)—3 summary measures of socioeconomic inequalities in health—remained stable. The rate difference, however, fell from 312 to 200 per 100,000 population (Table 2.1).
For females, there is some evidence that inequalities in heart attack incidence widened between 2006 and 2016. Although the rate difference (the absolute difference between the lowest and highest socioeconomic groups) fell:
• the rate ratio (lowest/highest socioeconomic group) increased from 1.59 in 2006 to 1.76 in 2016.
• the relative index of inequality (RII) (a measure of inequality across all socioeconomic groups) increased from 0.57 in 2006 to 0.64 in 2016.
• the population attributable fraction (PAF) (the percentage of total cases avoided if all groups had the same rate as the least disadvantaged group) increased from 38.3% in 2006 to 41.5% in 2016.
Table 2.1: Summary measures of inequalities in heart attack incidence, people aged 25 and over, by socioeconomic area and sex, 2006 to 2016
2006 2011 2016 Trend
Males
Rate ratio (lowest/highest) 1.56 1.59 1.55
Rate difference (lowest – highest) 312 255 200
Relative index of inequality (RII) 0.51 0.52 0.47
Population attributable fraction (PAF) 36.0% 40.0% 33.5%
Females
Rate ratio (lowest/highest) 1.59 1.63 1.76
Rate difference (lowest – highest) 157 131 117
Relative index of inequality (RII) 0.57 0.60 0.64
Population attributable fraction (PAF) 38.3% 41.5% 41.5%
Favourable trend, Unfavourable trend, No change or trend unclear.
Sources: AIHW National Hospital Morbidity Database and AIHW National Mortality Database; Table S1.

10 Indicators of socioeconomic inequalities in cardiovascular disease, diabetes and chronic kidney disease
Stroke by socioeconomic area
Figure 2.2: Stroke incidence, by socioeconomic area and sex, 2016
Note: Rates are age-standardised to the 2001 Australian population.Sources: AIHW National Hospital Morbidity Database and AIHW National Mortality Database; Table S2.
Inequalities in 2016• The incidence of stroke for males living in the lowest socioeconomic areas (165 per 100,000
population) was 1.21 times as high as the rate for males in the highest socioeconomic areas (137 per 100,000 population) (Figure 2.2).
• The difference in the male stroke rate between the lowest and highest socioeconomic areas was 29 per 100,000 population.
• The incidence of stroke for females in the lowest socioeconomic areas (127 per 100,000 population) was 1.27 times as high as the rate for females in the highest socioeconomic areas (100 per 100,000 population).
• The difference in the female stroke rate between the lowest and highest socioeconomic areas was 27 per 100,000 population.
• If all Australians had the same stroke rate as people in the highest socioeconomic areas in 2016, the total stroke rate would have declined by 13%, and there would have been 4,200 fewer strokes.
CVD
0
50
100
150
200
Group 1 (lowest) Group 2 Group 3 Group 4 Group 5 (highest)
Per 100,000
Socioeconomic area
Males Females

11Indicators of socioeconomic inequalities in cardiovascular disease, diabetes and chronic kidney disease
Changes in inequalitiesInequalities in male stroke rates showed little net change between 2006 and 2016, based on values of the rate ratio, rate difference, relative index of inequality (RII) and population attributable fraction (PAF) (Table 2.2).
For females, the rate ratio, RII and PAF also changed little, however, the absolute value of the rate difference (lowest – highest socioeconomic group) fell slightly, from 32 per 100,000 in 2006 to 27 per 100,000 in 2016.
Table 2.2: Summary measures of inequalities in stroke incidence, by socioeconomic area and sex, 2006 to 2016
2006 2011 2016 Trend
Males
Rate ratio (lowest/highest) 1.24 1.38 1.21
Rate difference (lowest – highest) 36 49 29
Relative index of inequality (RII) 0.26 0.34 0.24
Population attributable fraction (PAF) 17.5% 27.8% 10.0%
Females
Rate ratio (lowest/highest) 1.28 1.29 1.27
Rate difference (lowest – highest) 32 30 27
Relative index of inequality (RII) 0.31 0.34 0.29
Population attributable fraction (PAF) 22.3% 24.8% 17.5%
Favourable trend, Unfavourable trend, No change or trend unclear.
Sources: AIHW National Hospital Morbidity Database and AIHW National Mortality Database; Table S2.
12 Indicators of socioeconomic inequalities in cardiovascular disease, diabetes and chronic kidney disease
Cardiovascular disease mortality by socioeconomic area
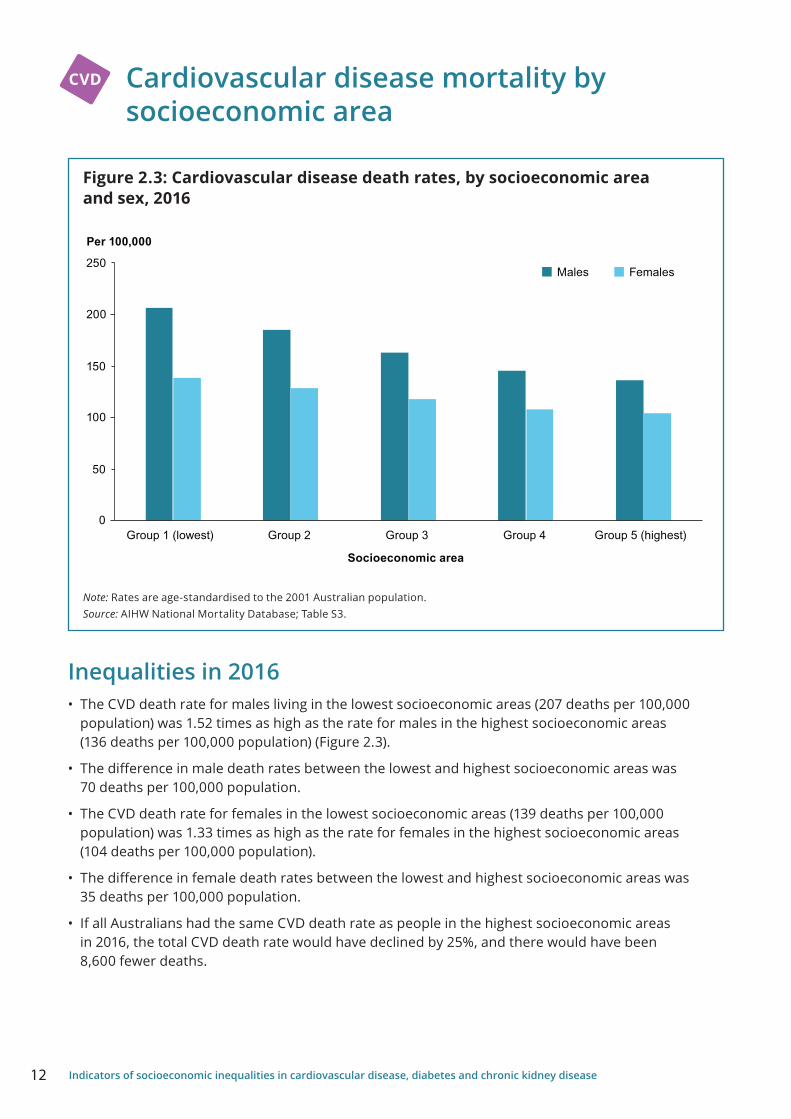
Figure 2.3: Cardiovascular disease death rates, by socioeconomic area and sex, 2016
Note: Rates are age-standardised to the 2001 Australian population.Source: AIHW National Mortality Database; Table S3.
Inequalities in 2016• The CVD death rate for males living in the lowest socioeconomic areas (207 deaths per 100,000
population) was 1.52 times as high as the rate for males in the highest socioeconomic areas (136 deaths per 100,000 population) (Figure 2.3).
• The difference in male death rates between the lowest and highest socioeconomic areas was 70 deaths per 100,000 population.
• The CVD death rate for females in the lowest socioeconomic areas (139 deaths per 100,000 population) was 1.33 times as high as the rate for females in the highest socioeconomic areas (104 deaths per 100,000 population).
• The difference in female death rates between the lowest and highest socioeconomic areas was 35 deaths per 100,000 population.
• If all Australians had the same CVD death rate as people in the highest socioeconomic areas in 2016, the total CVD death rate would have declined by 25%, and there would have been 8,600 fewer deaths.
CVD
0
100
50
150
250
200
Group 1 (lowest) Group 2 Group 3 Group 4 Group 5 (highest)
Per 100,000
Socioeconomic area
Males Females
13Indicators of socioeconomic inequalities in cardiovascular disease, diabetes and chronic kidney disease
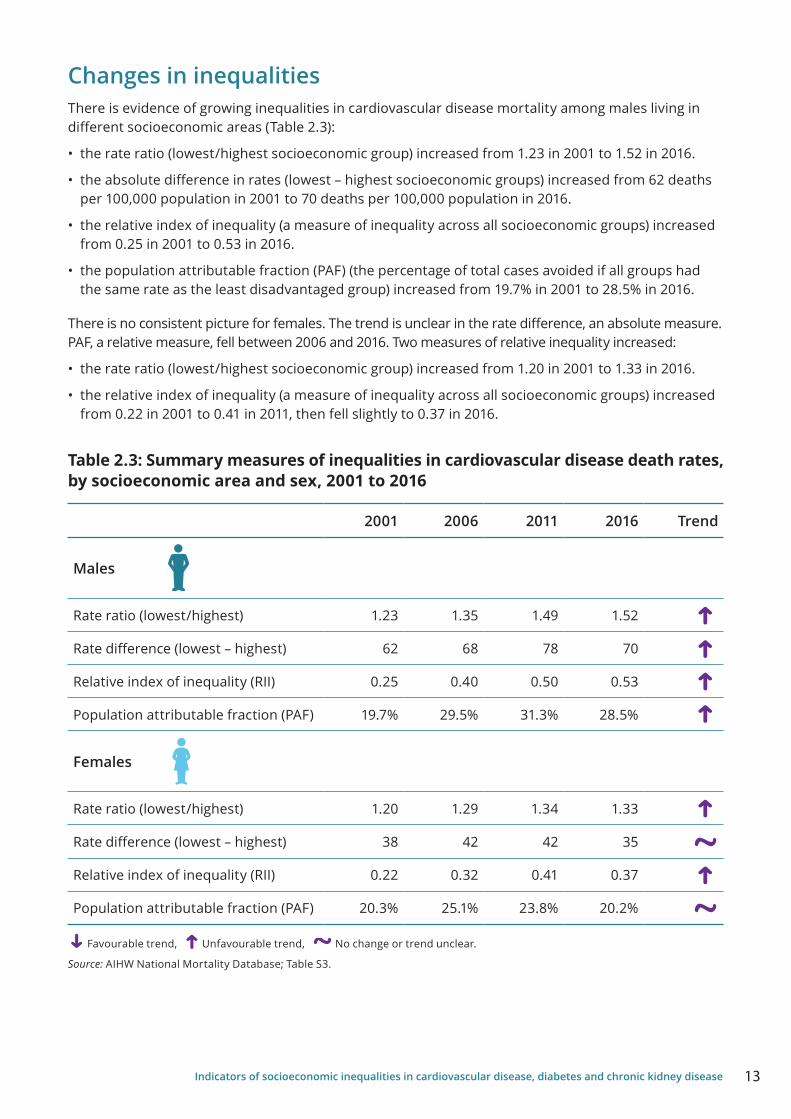
Changes in inequalitiesThere is evidence of growing inequalities in cardiovascular disease mortality among males living in different socioeconomic areas (Table 2.3):
• the rate ratio (lowest/highest socioeconomic group) increased from 1.23 in 2001 to 1.52 in 2016.
• the absolute difference in rates (lowest – highest socioeconomic groups) increased from 62 deaths per 100,000 population in 2001 to 70 deaths per 100,000 population in 2016.
• the relative index of inequality (a measure of inequality across all socioeconomic groups) increased from 0.25 in 2001 to 0.53 in 2016.
• the population attributable fraction (PAF) (the percentage of total cases avoided if all groups had the same rate as the least disadvantaged group) increased from 19.7% in 2001 to 28.5% in 2016.
There is no consistent picture for females. The trend is unclear in the rate difference, an absolute measure. PAF, a relative measure, fell between 2006 and 2016. Two measures of relative inequality increased:
• the rate ratio (lowest/highest socioeconomic group) increased from 1.20 in 2001 to 1.33 in 2016.
• the relative index of inequality (a measure of inequality across all socioeconomic groups) increased from 0.22 in 2001 to 0.41 in 2011, then fell slightly to 0.37 in 2016.
Table 2.3: Summary measures of inequalities in cardiovascular disease death rates, by socioeconomic area and sex, 2001 to 2016
2001 2006 2011 2016 Trend
Males
Rate ratio (lowest/highest) 1.23 1.35 1.49 1.52
Rate difference (lowest – highest) 62 68 78 70
Relative index of inequality (RII) 0.25 0.40 0.50 0.53
Population attributable fraction (PAF) 19.7% 29.5% 31.3% 28.5%
Females
Rate ratio (lowest/highest) 1.20 1.29 1.34 1.33
Rate difference (lowest – highest) 38 42 42 35
Relative index of inequality (RII) 0.22 0.32 0.41 0.37
Population attributable fraction (PAF) 20.3% 25.1% 23.8% 20.2%
Favourable trend, Unfavourable trend, No change or trend unclear.
Source: AIHW National Mortality Database; Table S3.

14 Indicators of socioeconomic inequalities in cardiovascular disease, diabetes and chronic kidney disease
Cardiovascular disease mortality by income
Figure 2.4: Cardiovascular disease mortality, by equivalised household income and sex, 2011–12
Notes 1. Rates are age-standardised to the 2001 Australian population.2. Includes persons living in occupied private dwellings only.Source: AIHW analysis of ABS Death Registrations to Census linked data set; Table S4.
Inequalities in 2011–12• The CVD death rate for males in the lowest income group (229 deaths per 100,000 population)
was 1.83 times as high as the rate for males in the highest income group (125 deaths per 100,000 population) (Figure 2.4).
• The difference in male death rates between the lowest and highest income groups was 104 deaths per 100,000 population.
• The CVD death rate for females in the lowest income group (117 deaths per 100,000 population) was 1.32 times as high as the rate for females in the highest income group (89 deaths per 100,000 population).
• The difference in female death rates between the lowest and highest income groups was 29 deaths per 100,000 population.
• If all Australians had the same CVD death rate as people in the highest income group in 2011–12, the total CVD death rate would have declined by 31%, and there would have been 7,350 fewer deaths.
CVD
0
50
100
150
200
250
<$300 per week $300–$599 per week $600–$999 per week $1,000–$1,499 per week
$1,500 or more perweek
Per 100,000
Income group
Males Females

15Indicators of socioeconomic inequalities in cardiovascular disease, diabetes and chronic kidney disease
Cardiovascular disease mortality by education
Figure 2.5: Cardiovascular disease mortality, persons aged 25–74, by highest educational attainment and sex, 2011–12
Note: Rates are age-standardised to the 2001 Australian population.Source: AIHW analysis of ABS Death Registrations to Census linked data set; Table S5.
Inequalities in 2011–12• The CVD death rate for males aged 25–74 with secondary education or lower (119 deaths per 100,000
population) was 2.42 times as high as the rate for males with a Bachelor degree or higher (49 deaths per 100,000 population) (Figure 2.5).
• The difference in male death rates between the lowest and highest education groups was 70 deaths per 100,000 population.
• The CVD death rate for females aged 25–74 with secondary education or lower (45 deaths per 100,000 population) was 2.17 times as high as the rate for females with a Bachelor degree or higher (21 deaths per 100,000 population).
• The difference in female death rates between the lowest and highest education groups was 24 deaths per 100,000 population.
• If all Australians aged 25–74 had the same CVD death rate as people with a Bachelor degree or higher in 2011–12, the total CVD death rate would have declined by 55%, and there would have been 7,800 fewer deaths.
CVD
0
20
40
60
80
100
120
140
Secondary or lower Diploma, certificate Bachelor degree or higher
Per 100,000
Highest educational attainment
Males Females

16 Indicators of socioeconomic inequalities in cardiovascular disease, diabetes and chronic kidney disease
Cardiovascular disease mortality by housing tenure
Figure 2.6: Cardiovascular disease mortality, persons aged 25 and over, by housing tenure and sex, 2011–12
Notes1. Age-standardised to the 2001 Australian population.2. Includes persons living in occupied private dwellings only.Source: AIHW analysis of ABS Death Registrations to Census linked dataset; Table S6.
Inequalities in 2011–12• The CVD death rate for males aged 25 and over in rented dwellings (351 deaths per 100,000
population) was 1.42 times as high as the rate for males in owned dwellings (248 deaths per 100,000 population) (Figure 2.6).
• The difference in male death rates between those in rented and owned dwellings was 103 deaths per 100,000 population.
• The CVD death rate for females aged 25 and over in rented dwellings (184 deaths per 100,000 population) was 1.27 times as high as the rate for females in owned dwellings (145 deaths per 100,000 population).
• The difference in female death rates between those in rented and owned dwellings was 39 deaths per 100,000 population.
• If all Australians aged 25 and over who occupied rented dwellings had the same CVD death rate as those in owned dwellings in 2011–12, the total CVD death rate would have declined by 8%, and there would have been 2,300 fewer deaths.
CVD
0
100
200
300
400
Rented Owned
Per 100,000
Housing tenure
Males Females

17Indicators of socioeconomic inequalities in cardiovascular disease, diabetes and chronic kidney disease
3 DiabetesDiabetes is a chronic disease characterised by high levels of glucose in the blood. It is caused either by the inability to produce enough insulin (a hormone produced by the pancreas to control blood glucose levels), by the body not being able to use insulin effectively, or both.
The main types of diabetes are: type 1 diabetes—an autoimmune disease that usually has its onset in childhood or early adulthood but can be diagnosed at any age; type 2 diabetes—largely preventable, usually associated with modifiable risk factors and with adult onset; and gestational diabetes—when higher than normal blood glucose is diagnosed in pregnancy.
Diabetes may progress to a range of health complications, including heart disease, stroke, kidney disease, retinopathy (eye disease), heart failure and limb amputation.
While the exact cause of type 1 diabetes is unknown, it is believed to be caused by an interaction of genetic predisposition and environmental factors. A number of factors are known to increase the risk of developing type 2 diabetes, including physical inactivity, poor diet, overweight and obesity, tobacco smoking, high blood pressure and dyslipidaemia.
The treatment of diabetes aims to maintain healthy blood glucose levels to prevent both short- and long-term complications, such as heart disease, kidney disease, blindness and lower limb amputation. All people with type 1 diabetes need insulin replacement therapy, as do a proportion of people with other forms of diabetes as their condition progresses over time.
Box 3.1: How common is diabetes?
Based on self-reported estimates from the ABS 2014–15 National Health Survey, more than 1 in 20 Australian adults (6.0%, or 1.2 million) had diabetes. However, self-reported data are likely to underestimate diabetes prevalence. Analysis of measured diabetes data from 2011–12 showed that, for every 4 adults with diagnosed diabetes, there was 1 with undiagnosed diabetes (AIHW 2018c).
An estimated 1 in 5 Australians aged 75 and over (19%) had diabetes in 2014–15, compared with 1.3% of people aged under 45. Diabetes was also more common in males (6.8%) than females (5.4%).
The age-standardised rate of self-reported diabetes has more than tripled over 25 years—from 1.5% in 1989–90 to 4.7% in 2014–15.
Diabetes

18 Indicators of socioeconomic inequalities in cardiovascular disease, diabetes and chronic kidney disease
Overview of findings on socioeconomic inequalities in diabetesThis overview summarises findings for the indicators of socioeconomic inequalities in diabetes which follow. Where data allow, trends over time are evaluated.
Prevalence• The prevalence of type 2 diabetes increases with increasing socioeconomic disadvantage.
• Males and females living in the lowest socioeconomic areas in 2016 had type 2 diabetes prevalence rates that were 1.70 and 2.07 times as high respectively as rates for males and females living in the highest socioeconomic areas (Figure 3.1).
• If all Australians had the same type 2 diabetes prevalence as people in the highest socioeconomic areas in 2016, the total type 2 diabetes rate would have declined by 46% and there would have been 416,000 fewer people with type 2 diabetes.
Mortality• There are large socioeconomic inequalities in diabetes death rates.
• The diabetes death rate for males living in the lowest socioeconomic areas in 2016 was 2.18 times as high as the rate for males in the highest socioeconomic areas, when diabetes was assessed as either an underlying or associated cause of death (Figure 3.2). The disparity for disadvantaged females was greater, at 2.39 times as high.
• If all Australians had the same diabetes death rate as people in the highest socioeconomic areas in 2016, the total diabetes death rate would have declined by 52% and there would have been 6,900 fewer deaths.
• If all Australians aged 25–74 had the same diabetes death rate as those with a Bachelor degree or higher in 2011–12, the total diabetes death rate would have declined by 57%, and there would have been 3,700 fewer deaths.
• Inequalities in diabetes death rates by highest education level in 2011–12 (RII = 1.21 for males and 1.31 for females) were greater than by socioeconomic area in 2011 (0.76 for males and 0.90 for females).
Male and female inequalities• The diabetes death rate for females in the lowest socioeconomic areas in 2016 was 2.39 times
as high as for females in the highest socioeconomic areas, whereas the rate among males was 2.18 times as high (Figure 3.2). Similarly, the diabetes death rate for females in rented housing in 2011–12 was 1.80 times as high as for females in owned housing, compared with 1.57 times as high for males (Figure 3.5).
• There is a different pattern when diabetes mortality is assessed by income and education level. Males in the lowest income group had a diabetes death rate 2.13 times as high as males in the highest income group in 2011–12, compared with 1.57 for females (Figure 3.3). Males with secondary education or lower had a diabetes death rate 2.71 times as high as males with a Bachelor degree or higher in 2011–12, similar to the disparity among females of 2.67 times as high (Figure 3.4).

19Indicators of socioeconomic inequalities in cardiovascular disease, diabetes and chronic kidney disease
Diabetes and CVD inequalities• Inequalities in diabetes mortality are greater than inequalities in CVD mortality.
• The relative index of inequality (RII) for mortality by socioeconomic area in 2016 was 0.96 for diabetes, compared with 0.45 for CVD. For mortality in 2011–12, the RII by income group was 0.59 for diabetes and 0.39 for CVD, by education group 1.05 for diabetes and 0.85 for CVD, and by housing tenure 0.95 for diabetes and 0.58 for CVD.
Changes in inequalities• There is evidence of growing inequalities in diabetes mortality between socioeconomic areas.
• For males, there was an absolute increase in the rate difference (31 per 100,000 in 2001 to 53 per 100,000 in 2016). Relative measures, such as the RII also increased (0.52 in 2001 to 0.91 in 2016). For females, there was no increase in rate difference, however relative measures such as the rate ratio increased (1.86 in 2001 to 2.39 in 2016) as did the RII (0.74 in 2001 to 1.01 in 2016) (Table 3.2).

20 Indicators of socioeconomic inequalities in cardiovascular disease, diabetes and chronic kidney disease
Diabetes by socioeconomic area
Figure 3.1: Type 2 diabetes prevalence, by socioeconomic area and sex, 2016
Note: Rates are age-standardised to the 2001 Australian population.Sources: AIHW analysis of 2016 National Diabetes Services Scheme snapshot; Table S7.
Inequalities in 2016• The prevalence of type 2 diabetes for males living in the lowest socioeconomic areas
(5,216 per 100,000 population) was 1.70 times as high as the prevalence for males in the highest socioeconomic areas (3,063 per 100,000 population) (Figure 3.1).
• The difference in the male type 2 diabetes prevalence between the lowest and highest socioeconomic areas was 2,154 per 100,000 population.
• The prevalence of type 2 diabetes for females in the lowest socioeconomic areas (4,546 per 100,000 population) was 2.07 times as high as the prevalence for females in the highest socioeconomic areas (2,195 per 100,000 population).
• The difference in the female type 2 diabetes prevalence between the lowest and highest socioeconomic areas was 2,351 per 100,000 population.
• If all Australians had the same type 2 diabetes prevalence as people in the highest socioeconomic areas in 2016, the total type 2 diabetes prevalence would have declined by 46%, and there would have been 416,000 fewer people with type 2 diabetes.
Diabetes
0
1,000
2,000
3,000
4,000
5,000
6,000
Group 1 (lowest) Group 2 Group 3 Group 4 Group 5 (highest)
Per 100,000
Socioeconomic area
Males Females

21Indicators of socioeconomic inequalities in cardiovascular disease, diabetes and chronic kidney disease
Changes in inequalitiesWith 2 data points for 2011 and 2016, trends in inequalities in type 2 diabetes between socioeconomic areas cannot be assessed. However, inequalities in 2011 can be compared with inequalities in 2016 (Table 3.1).
For males:
• the prevalence ratio (lowest/highest socioeconomic group) decreased from 1.88 in 2011 to 1.70 in 2016.
• the absolute difference in prevalence (lowest – highest socioeconomic group) decreased from 2,512 per 100,000 population in 2011 to 2,154 per 100,000 population in 2016.
• the relative index of inequality (a measure of inequality across all socioeconomic groups) decreased from 0.74 in 2011 to 0.58 in 2016.
• the population attributable fraction (PAF) (the percentage of total cases avoided if all groups had the same rate as the least disadvantaged group) increased from 30.7% in 2011 to 42.6% in 2016.
For females:
• the prevalence ratio (lowest/highest socioeconomic group) decreased from 2.32 in 2011 to 2.07 in 2016.
• the absolute difference in prevalence (lowest – highest socioeconomic group) decreased from 2,807 per 100,000 population in 2011 to 2,351 per 100,000 population in 2016.
• the relative Index of Inequality (a measure of inequality across all socioeconomic groups) decreased from 0.98 in 2011 to 0.79 in 2016.
• the population attributable fraction (PAF) (the percentage of total cases avoided if all groups had the same rate as the least disadvantaged group) increased from 41.9% in 2011 to 50.4% in 2016.
Table 3.1: Summary measures of inequalities in type 2 diabetes prevalence, by socioeconomic area and sex, 2011 and 2016
2011 2016
Males
Prevalence ratio (lowest/highest) 1.88 1.70
Prevalence difference (lowest – highest) 2,512 2,154
Relative index of inequality (RII) 0.74 0.58
Population attributable fraction (PAF) 30.7% 42.6%
Females
Prevalence ratio (lowest/highest) 2.32 2.07
Prevalence difference (lowest – highest) 2,807 2,351
Relative index of inequality (RII) 0.98 0.79
Population attributable fraction (PAF) 41.9% 50.4%
Sources: AIHW analysis of 2016 National Diabetes Services Scheme snapshot; Table S7.

22 Indicators of socioeconomic inequalities in cardiovascular disease, diabetes and chronic kidney disease
Diabetes mortality by socioeconomic area
Figure 3.2: Diabetes death rates, by socioeconomic area and sex, 2016
Notes1. Rates are age-standardised to the 2001 Australian population.2. Includes diabetes as either an underlying or associated cause of death.Source: AIHW National Mortality Database; Table S8.
Inequalities in 2016• The diabetes death rate for males living in the lowest socioeconomic areas (98 deaths per 100,000
population) was 2.18 times as high as the rate for males in the highest socioeconomic areas (45 deaths per 100,000 population) (Figure 3.2).
• The difference in male death rates between the lowest and highest socioeconomic areas was 53 deaths per 100,000 population.
• The diabetes death rate for females in the lowest socioeconomic areas (63 deaths per 100,000 population) was 2.39 times as high as the rate for females in the highest socioeconomic areas (26 deaths per 100,000 population).
• The difference in female death rates between the lowest and highest socioeconomic areas was 37 deaths per 100,000 population.
• If all Australians had the same diabetes death rate as people in the highest socioeconomic areas in 2016, the total diabetes death rate would have declined by 52%, and there would have been 6,900 fewer deaths.
Diabetes
0
25
50
75
100
Group 1 (lowest) Group 2 Group 3 Group 4 Group 5 (highest)
Per 100,000
Socioeconomic area
Males
Females
Males Females

23Indicators of socioeconomic inequalities in cardiovascular disease, diabetes and chronic kidney disease
Changes in inequalitiesThere is evidence of growing inequalities in diabetes mortality between socioeconomic areas (Table 3.2).
For males:
• the rate ratio (lowest/highest socioeconomic group) increased from 1.57 in 2001 to 2.18 in 2016.
• the absolute difference in rates (lowest – highest socioeconomic group) increased from 31 deaths per 100,000 population in 2001 to 53 deaths per 100,000 population in 2016.
• the relative index of inequality (a measure of inequality across all socioeconomic groups) increased from 0.52 in 2001 to 0.91 in 2016.
• the population attributable fraction (PAF) (the percentage of total cases avoided if all groups had the same rate as the least disadvantaged group) increased from 36.7% in 2001 to 50.4% in 2016.
For females:
• the rate ratio (lowest/highest socioeconomic group) increased from 1.86 in 2001 to 2.39 in 2016.
• the relative index of inequality (a measure of inequality across all socioeconomic groups) increased from 0.74 in 2001 to 1.01 in 2016.
• the population attributable fraction (PAF) (the percentage of total cases avoided if all groups had the same rate as the least disadvantaged group) increased from 45.4% in 2001 to 53.7% in 2016.
Table 3.2: Summary measures of inequalities in diabetes death rates, by socioeconomic area and sex, 2001 to 2016
2001 2006 2011 2016 Trend
Males
Rate ratio (lowest/highest) 1.57 1.78 1.92 2.18
Rate difference (lowest – highest) 31 40 47 53
Relative index of inequality (RII) 0.52 0.67 0.76 0.91
Population attributable fraction (PAF) 36.7% 45.3% 47.7% 50.4%
Females
Rate ratio (lowest/highest) 1.86 2.13 2.16 2.39
Rate difference (lowest – highest) 25 35 33 37
Relative index of inequality (RII) 0.74 0.86 0.90 1.01
Population attributable fraction (PAF) 45.4% 47.7% 53.2% 53.7%
Favourable trend, Unfavourable trend, No change or trend unclear.
Source: AIHW National Mortality Database; Table S8.

24 Indicators of socioeconomic inequalities in cardiovascular disease, diabetes and chronic kidney disease
Diabetes mortality by income
Figure 3.3: Diabetes mortality, by equivalised household income and sex, 2011–12
Notes1. Rates are age-standardised to the 2001 Australian population.2. Includes diabetes as either an underlying or associated cause of death.3. Includes persons living in occupied private dwellings only.Source: AIHW analysis of ABS Death Registrations to Census linked data set; Table S9.
Inequalities in 2011–12• The diabetes death rate for males in the lowest income group (85 deaths per 100,000 population)
was 2.13 times as high as the rate for males in the highest income group (40 deaths per 100,000 population) (Figure 3.3).
• The difference in male death rates between the lowest and highest income groups was 45 deaths per 100,000 population.
• The diabetes death rate for females in the lowest income group (36 deaths per 100,000 population) was 1.57 times as high as the rate for females in the highest income group (23 deaths per 100,000 population).
• The difference in female death rates between the lowest and highest income groups was 13 deaths per 100,000 population.
• If all Australians had the same diabetes death rate as people in the highest income group in 2011–12, the total diabetes death rate would have declined by 47%, and there would have been 3,800 fewer deaths.
Diabetes
0
25
50
75
100
<$300 per week $300–$599 per week $600–$999 per week $1,000 –$1,499 per week
$1,500 or more perweek
Per 100,000
Income group
Males Females

25Indicators of socioeconomic inequalities in cardiovascular disease, diabetes and chronic kidney disease
Diabetes mortality by education
Figure 3.4: Diabetes mortality, persons aged 25–74, by highest educational attainment and sex, 2011–12
Notes1. Rates are age-standardised to the 2001 Australian population.2. Includes diabetes as either an underlying or associated cause of death.Source: AIHW analysis of ABS Death Registrations to Census linked data set; Table S10.
Inequalities in 2011–12• The diabetes death rate for males aged 25–74 with secondary education or lower (54 deaths per
100,000 population) was 2.71 times as high as the rate for males with a Bachelor degree or higher (20 deaths per 100,000 population) (Figure 3.4).
• The difference in male death rates between the lowest and highest education groups was 34 deaths per 100,000 population.
• The diabetes death rate for females aged 25–74 with secondary education or lower (25 deaths per 100,000 population) was 2.67 times as high as the rate for females with a Bachelor degree or higher (9 deaths per 100,000 population).
• The difference in female death rates between the lowest and highest education groups was 16 deaths per 100,000 population.
• If all Australians aged 25–74 had the same diabetes death rate as people with a Bachelor degree or higher in 2011–12, the total diabetes death rate would have declined by 57%, and there would have been 3,700 fewer deaths.
Diabetes
0
20
40
60
50
30
10
Secondary or lower Diploma, certificate Bachelor degree or higher
Per 100,000
Highest educational attainment
Males Females

26 Indicators of socioeconomic inequalities in cardiovascular disease, diabetes and chronic kidney disease
Diabetes mortality by housing tenure
Figure 3.5: Diabetes mortality, persons aged 25 and over, by housing tenure and sex, 2011–12
Notes1. Rates are age-standardised to the 2001 Australian population.2. Includes diabetes as either an underlying or associated cause of death.3. Includes persons living in occupied private dwellings only.Source: AIHW analysis of ABS Death Registrations to Census linked data set; Table S11.
Inequalities in 2011–12• The diabetes death rate for males aged 25 and over in rented dwellings (140 deaths per 100,000
population) was 1.57 times as high as the rate for males in owned dwellings (89 deaths per 100,000 population) (Figure 3.5).
• The difference in male death rates between those in rented and owned dwellings was 51 deaths per 100,000 population.
• The diabetes death rate for females aged 25 and over in rented dwellings (79 deaths per 100,000 population) was 1.80 times as high as the rate for females in owned dwellings (44 deaths per 100,000 population).
• The difference in female death rates between those in rented and owned dwellings was 35 deaths per 100,000 population.
• If all Australians aged 25 and over who occupied rented dwellings had the same diabetes death rate as those in owned dwellings in 2011–12, the total diabetes death rate would have declined by 15%, and there would have been 1,500 fewer deaths.
Diabetes
0
50
100
150
125
75
25
Rented Owned
Per 100,000
Housing tenure
Males Females

27Indicators of socioeconomic inequalities in cardiovascular disease, diabetes and chronic kidney disease
4 Chronic kidney diseaseThe kidneys filter and remove waste from the blood. Kidneys can be permanently damaged by acute kidney injury, or progressively damaged from chronic conditions such as high blood pressure or poorly controlled high blood glucose levels.
Kidney disease occurs when the nephrons (functional units inside the kidney that filter the blood) are damaged. When a person has evidence of kidney damage and/or reduced kidney function for longer than 3 months, this is referred to as chronic kidney disease, or CKD.
CKD is often called a ‘silent disease’, as up to 90% of kidney function can be lost before symptoms appear. As a result, many people are unaware that they have the condition. However, simple tests of a person’s urine and blood can identify most cases of CKD when the disease is in its early stages, enabling treatment to prevent or slow down its progression.
CKD is usually categorised into 5 stages according to the level of kidney function, or evidence of kidney damage. In stage 5, known as end-stage kidney disease (ESKD), patients usually need kidney replacement therapy (KRT) in the form of dialysis or kidney transplant.
Although CKD is common, it is potentially preventable as many of its risk factors—including type 2 diabetes, high blood pressure, tobacco smoking and overweight and obesity—are modifiable.
Box 4.1: How common is chronic kidney disease?
An estimated 1.7 million Australians aged 18 and over (10%) had biomedical signs of CKD in 2011–12, based on measured data from the ABS 2011–12 Australian Health Survey. The vast majority (97%) showed early signs of the disease (stages 1–3) (AIHW 2017).
The estimated prevalence of CKD was similar for men and women (10% for both). The risk of CKD increases rapidly with age, affecting around 2 in 5 (42%) people aged 75 and over.
In 2014 there were around 23,000 people with treated ESKD: 54% of patients were on dialysis, while 46% were living with a functioning kidney transplant. There were around 5,100 new cases of ESKD in Australia in 2013, which equates to around 14 new cases per day. Of these, around 50% were receiving KRT (AIHW 2018a).
Overview of findings on socioeconomic inequalities in chronic kidney diseaseThis overview summarises findings for the indicators of socioeconomic inequalities in CKD which follow. Where data allow, trends over time are evaluated.
Prevalence• The prevalence of CKD increases with increasing socioeconomic disadvantage.
• Males aged 18 and over living in the lowest socioeconomic areas in 2014–15 had a prevalence of CKD that was 1.68 times as high as the prevalence for males in the highest socioeconomic areas (Figure 4.1).
• Although the estimated prevalence for females in the lowest socioeconomic areas was higher than for females in the highest socioeconomic areas, the difference was not statistically significant.
• Males in the lowest socioeconomic areas in 2016 had a rate of treated ESKD that was 1.52 times as high as for males in the highest socioeconomic areas (Figure 4.2). The disparity was greater for females, at 1.78 times as high.
CKD

28 Indicators of socioeconomic inequalities in cardiovascular disease, diabetes and chronic kidney disease
• If all Australians had the same treated ESKD rate as people in the highest socioeconomic areas in 2016, the total treated ESKD rate would have declined by 38% and there would have been 8,300 fewer people needing kidney replacement therapy.
Mortality• There are large socioeconomic inequalities in CKD death rates.
• The CKD death rate for males in the lowest socioeconomic areas in 2016 was 1.64 times as high as the rate for males in the highest socioeconomic areas, when CKD was assessed as either an underlying or associated cause of death (Figure 4.3). The equivalent disparity for females was 1.75 times as high.
• If all Australians had the same CKD death rate as people in the highest socioeconomic areas in 2016, the chronic kidney disease death rate would have declined by 36%, and there would have been 4,800 fewer deaths.
• If all Australian aged 25–74 had the same CKD death rate as those with a Bachelor degree or higher in 2011–12, the total CKD death rate would have declined by 44%, and there would have been almost 2,000 fewer deaths.
• Inequalities in the CKD death rate by highest education level in 2011–12 (RII = 0.97 for males and 1.03 for females) were greater than by socioeconomic area in 2011 (0.39 for males and 0.58 for females).
Male and female inequalities• The CKD death rate for females in the lowest socioeconomic areas in 2016 was 1.75 times as high as
for females in the highest socioeconomic areas, wheras the rate for males was 1.64 times as high (Figure 4.3). Similarly, the CKD death rate for females in rented housing in 2011–12 was 1.46 times as high as for females in owned housing, compared with 1.36 times as high for males (Figure 4.6).
• There is a different pattern when CKD mortality is assessed by income and education level. Males in the lowest income group had a CKD death rate 2.05 times as high as males in the highest income group in 2011–12, compared with 1.45 times as high for females (Figure 4.4). Males with secondary education or lower had a CKD death rate 2.05 times as high as males with a Bachelor degree or higher in 2011–12, similar to the disparity among females which was 2.08 times as high (Figure 4.5).
CKD and CVD inequalities• Generally, inequalities in CKD mortality are greater than inequalities in CVD mortality.
• The relative index of inequality (RII) for mortality by socioeconomic area in 2016 was 0.64 for CKD, compared with 0.45 for CVD. For mortality in 2011–12, the RII by income group was 0.47 for CKD and 0.39 for CVD, by education group 0.82 for CKD and 0.85 for CVD, and by housing tenure 0.72 for CKD and 0.65 for CVD.
Changes in inequalities• Inequalities in the prevalence of treated ESKD narrowed slightly between 2011 and 2016. For both
males and females, the absolute difference in prevalence fell (63 to 48 per 100,000 for males, 50 to 38 per 100,000 for females). Relative measures also indicate less inequality; for males the rate ratio declined from 1.74 in 2011 to 1.52 in 2016, and the RII declined from 0.65 to 0.42. For females, the rate ratio declined from 1.96 in 2011 to 1.78 in 2016, and the RII declined from 0.80 to 0.57.
• Area-based inequalities in CKD mortality increased between 2001 and 2016. For both males and females, there were absolute increases in the rate difference—from 17 to 35 per 100,000 for males, and from 14 to 25 per 100,000 for females. Relative measures also indicate growing inequality—the RII for males rose from 0.27 to 0.59, and for females from 0.36 to 0.67.

29Indicators of socioeconomic inequalities in cardiovascular disease, diabetes and chronic kidney disease
Chronic kidney disease by socioeconomic area
Figure 4.1: Chronic kidney disease, persons aged 18 and over, by socioeconomic area and sex, 2011–12
Notes1. Rates are age-standardised to the 2001 Australian population.2. Confidence intervals are provided in this report for rates and ratios which have been derived from survey data (See
Appendix B). I = 95% confidence interval. We can be 95% confident that the true value is within this confidence interval. Source: AIHW analysis of ABS 2014; Table S12.
Inequalities in 2011–12• Based on measured data from the ABS 2011–12 Australian Health Survey, the estimated prevalence
of chronic kidney disease for males living in the lowest socioeconomic areas (13.9%) was 1.68 times as high as the prevalence for males in the highest socioeconomic areas (8.3%) (Figure 4.1).
• The estimated prevalence of chronic kidney disease for females in the lowest socioeconomic areas was similar to the prevalence for females in the highest socioeconomic areas. There was no statistically significant difference between the 2 groups.
• If all Australians had the same prevalence as people in the highest socioeconomic areas, the total chronic kidney disease prevalence would have declined by 7% and there would have been 109,000 fewer people with chronic kidney disease in 2011–12.
CKD
0
5
10
15
20
Group 1 (lowest) Group 2 Group 3 Group 4 Group 5 (highest)
Per cent
Socioeconomic area
Males Females

30 Indicators of socioeconomic inequalities in cardiovascular disease, diabetes and chronic kidney disease
Treated end-stage kidney disease by socioeconomic area
Figure 4.2: Treated end-stage kidney disease prevalence, by socioeconomic area and sex, 2016
Notes1. Rates are age-standardised to the 2001 Australian population.2. Includes Australians in the ANZDATA Registry who received KRT (dialysis or kidney transplant).Source: AIHW analysis of Australia and New Zealand Dialysis and Transplant Registry; Table S13.
Inequalities in 2016• The prevalence of treated ESKD for males living in the lowest socioeconomic areas (140 per 100,000
population) was 1.52 times as high as the prevalence for males in the highest socioeconomic areas (92 per 100,000 population) (Figure 4.2).
• The difference in male treated ESKD prevalence between the lowest and highest socioeconomic areas was 48 per 100,000 population.
• The treated ESKD prevalence for females in the lowest socioeconomic areas (89 per 100,000 population) was 1.75 times as high as the rate for females in the highest socioeconomic areas (51 per 100,000 population).
• The difference in female treated ESKD prevalence between the lowest and highest socioeconomic areas was 38 per 100,000 population.
• If all Australians had the same treated ESKD prevalence as people in the highest socioeconomic areas in 2016, the total treated ESKD prevalence would have declined by 38%, and there would have been 8,300 fewer people needing kidney replacement therapy.
CKD
0
50
100
150
125
75
25
Group 1 (lowest) Group 2 Group 3 Group 4 Group 5 (highest)
Per 100,000
Socioeconomic area
Males Females

31Indicators of socioeconomic inequalities in cardiovascular disease, diabetes and chronic kidney disease
Changes in inequalitiesWith just 2 data points for 2011 and 2016, trends in inequalities in treated ESKD between socioeconomic areas cannot be assessed. However, inequalities in 2011 can be compared with inequalities in 2016 (Table 4.1).
For males:
• the prevalence ratio (lowest/highest socioeconomic group) decreased from 1.74 in 2011 to 1.52 in 2016.
• the absolute difference in prevalence (lowest – highest socioeconomic group) decreased from 63 per 100,000 population in 2011 to 48 per 100,000 population in 2016.
• the relative index of inequality (a measure of inequality across all socioeconomic groups) decreased from 0.65 in 2011 to 0.42 in 2016.
• the population attributable fraction (PAF) (the percentage of total cases avoided if all groups had the same rate as the least disadvantaged group) increased from 25.2% in 2011 to 32.6% in 2016.
For females:
• the prevalence ratio (lowest/highest socioeconomic group) decreased from 1.96 in 2011 to 1.75 in 2016.
• the absolute difference in prevalence (lowest – highest socioeconomic group) decreased from 50 per 100,000 population in 2011 to 38 per 100,000 population in 2016.
• the relative index of inequality (a measure of inequality across all socioeconomic groups) decreased from 0.80 in 2011 to 0.57 in 2016.
• the population attributable fraction (PAF) (the percentage of total cases avoided if all groups had the same rate as the least disadvantaged group) increased from 28.8% in 2011 to 42.7% in 2016.
Table 4.1: Summary measures of inequalities in treated end-stage kidney disease prevalence, by socioeconomic area and sex, 2011 and 2016
2011 2016
Males
Prevalence ratio (lowest/highest) 1.74 1.52
Prevalence difference (lowest – highest) 63 48
Relative index of inequality (RII) 0.65 0.42
Population attributable fraction (PAF) 25.2% 32.6%
Females
Prevalence ratio (lowest/highest) 1.96 1.75
Prevalence difference (lowest – highest) 50 38
Relative index of inequality (RII) 0.80 0.57
Population attributable fraction (PAF) 28.8% 42.7%
Source: AIHW analysis of Australia and New Zealand Dialysis and Transplant Registry; Table S13.

32 Indicators of socioeconomic inequalities in cardiovascular disease, diabetes and chronic kidney disease
Chronic kidney disease mortality by socioeconomic area
Figure 4.3: Chronic kidney disease death rates, by socioeconomic area and sex, 2016
Notes1. Rates are age-standardised to the 2001 Australian population.2. Includes chronic kidney disease as either an underlying or associated cause of death.Source: AIHW National Mortality Database; Table S14.
Inequalities in 2016• The chronic kidney disease death rate for males living in the lowest socioeconomic areas (89 deaths
per 100,000 population) was 1.64 times as high as the rate for males in the highest socioeconomic areas (54 deaths per 100,000 population) (Figure 4.3).
• The difference in male death rates between the lowest and highest socioeconomic areas was 35 deaths per 100,000 population.
• The chronic kidney disease death rate for females in the lowest socioeconomic areas (59 deaths per 100,000 population) was 1.75 times as high as the rate for females in the highest socioeconomic areas (34 deaths per 100,000 population).
• The difference in female death rates between the lowest and highest socioeconomic areas was 25 deaths per 100,000 population.
• If all Australians had the same chronic kidney disease death rate as people in the highest socioeconomic areas in 2016, the chronic kidney disease death rate would have declined by 36%, and there would have been 4,800 fewer deaths.
CKD
0
25
50
75
100
Group 1 (lowest) Group 2 Group 3 Group 4 Group 5 (highest)
Per 100,000
Socioeconomic area
Males Females

33Indicators of socioeconomic inequalities in cardiovascular disease, diabetes and chronic kidney disease
Changes in inequalitiesThere is evidence of growing inequalities in chronic kidney disease mortality between socioeconomic areas (Table 4.2).
For males:
• the rate ratio (lowest/highest socioeconomic group) increased from 1.27 in 2001 to 1.64 in 2016.
• the absolute difference in rates (lowest – highest socioeconomic group) increased from 17 deaths per 100,000 population in 2001 to 35 deaths per 100,000 population in 2016.
• the relative index of inequality (a measure of inequality across all socioeconomic groups) increased from 0.27 in 2001 to 0.59 in 2016.
For females:
• the rate ratio (lowest/highest socioeconomic group) increased from 1.39 in 2001 to 1.75 in 2016.
• the absolute difference in rates (lowest – highest socioeconomic group) increased from 14 deaths per 100,000 population in 2001 to 25 deaths per 100,000 population in 2016.
• the relative index of inequality (a measure of inequality across all socioeconomic groups) increased from 0.36 in 2001 to 0.67 in 2016.
• the population attributable fraction (PAF) (the percentage of total cases avoided if all groups had the same rate as the least disadvantaged group) increased from 31.2% in 2001 to 39.2% in 2016.
Table 4.2: Summary measures of inequalities in chronic kidney disease death rates, by socioeconomic area and sex, 2001 to 2016
2001 2006 2011 2016 Trend
Males
Rate ratio (lowest/highest) 1.27 1.42 1.41 1.64
Rate difference (lowest – highest) 17 27 25 35
Relative index of inequality (RII) 0.27 0.38 0.39 0.59
Population attributable fraction (PAF) 20.4% 29.1% 27.5% 31.8%
Females
Rate ratio (lowest/highest) 1.39 1.47 1.64 1.75
Rate difference (lowest – highest) 14 16 22 25
Relative index of inequality (RII) 0.36 0.54 0.58 0.67
Population attributable fraction (PAF) 31.2% 31.8% 36.8% 39.2%
Favourable trend, Unfavourable trend, No change or trend unclear.
Source: AIHW National Mortality Database; Table S14.

34 Indicators of socioeconomic inequalities in cardiovascular disease, diabetes and chronic kidney disease
Chronic kidney disease mortality by income
Figure 4.4: Chronic kidney disease mortality, by equivalised household income and sex, 2011–12
Notes1. Rates are age-standardised to the 2001 Australian population.2. Includes chronic kidney disease as either an underlying or associated cause of death.3. Includes persons living in occupied private dwellings only.Source: AIHW analysis of ABS Death Registrations to Census linked data set; Table S15.
Inequalities in 2011–12• The CKD death rate for males in the lowest income group (85 deaths per 100,000 population)
was 2.05 times as high as the rate for males in the highest income group (42 deaths per 100,000 population) (Figure 4.4).
• The difference in male death rates between the lowest and highest income groups was 44 deaths per 100,000 population.
• The CKD death rate for females in the lowest income group (41 deaths per 100,000 population) was 1.45 times as high as the rate for females in the highest income group (28 deaths per 100,000 population).
• The difference in female death rates between the lowest and highest income groups was 13 deaths per 100,000 population.
• If all Australians had the same CKD death rate as people in the highest income group in 2011–12, the total CKD death rate would have declined by 43%, and there would have been 3,700 fewer deaths.
CKD
0
25
50
75
100
<$300 per week $300–$599 per week $600–$999 per week $1,000 –$1,499 per week
$1,500 or more perweek
Per 100,000
Income group
Males Females

35Indicators of socioeconomic inequalities in cardiovascular disease, diabetes and chronic kidney disease
Chronic kidney disease mortality by education
Figure 4.5: Chronic kidney disease mortality, persons aged 25–74, by highest educational attainment and sex, 2011–12
Notes1. Rates are age-standardised to the 2001 Australian population.2. Includes chronic kidney disease as either an underlying or associated cause of death.Source: AIHW analysis of ABS Death Registrations to Census linked data set; Table S16.
Inequalities in 2011–12• The CKD death rate for males aged 25–74 with secondary education or lower (34 deaths per
100,000 population) was 2.05 times as high as the rate for males with a Bachelor degree or higher (17 deaths per 100,000 population) (Figure 4.5).
• The difference in male death rates between the lowest and highest education groups was 18 deaths per 100,000 population.
• The CKD death rate for females aged 25–74 with secondary education or lower (18 deaths per 100,000 population) was 2.08 times as high as the rate for females in the highest socioeconomic group (8 deaths per 100,000 population).
• The difference in female death rates between the lowest and highest education groups was 9 deaths per 100,000 population.
• If all Australians aged 25–74 had the same CKD death rate as people with a Bachelor degree or higher in 2011–12, the total CKD death rate would have declined by 44%, and there would have been 1,950 fewer deaths.
CKD
0
10
20
30
40
Secondary or lower Diploma, certificate Bachelor degree or higher
Per 100,000
Highest educational attainment
Males Females

36 Indicators of socioeconomic inequalities in cardiovascular disease, diabetes and chronic kidney disease
Chronic kidney disease mortality by housing tenure
Figure 4.6: Chronic kidney disease mortality, persons aged 25 and over, by housing tenure and sex, 2011–12
Notes1. Rates are age-standardised to the 2001 Australian population.2. Includes chronic kidney disease as either an underlying or associated cause of death.3. Includes persons living in occupied private dwellings only.Source: AIHW analysis of ABS Death Registrations to Census linked data set; Table S17.
Inequalities in 2011–12• The CKD death rate for males aged 25 and over in rented dwellings (133 deaths per 100,000
population) was 1.36 times as high as the rate for males in owned dwellings (98 deaths per 100,000 population) (Figure 4.6).
• The difference in male death rates between those in rented and owned dwellings was 35 deaths per 100,000 population.
• The CKD death rate for females aged 25 and over in rented dwellings (73 deaths per 100,000 population) was 1.46 times as high as the rate for females in owned dwellings (50 deaths per 100,000 population).
• The difference in female death rates between those in rented and owned dwellings was 23 deaths per 100,000 population.
• If all Australians aged 25 and over who occupied rented dwellings had the same CKD death rate as those owned dwellings in 2011–12, the total CKD death rate would have declined by 9%, and there would have been 950 fewer deaths.
CKD
0
50
100
150
125
75
25
Rented Owned
Per 100,000
Housing tenure
Males Females

37Indicators of socioeconomic inequalities in cardiovascular disease, diabetes and chronic kidney disease
5 Gaps and limitationsReducing inequalities in CVD, diabetes and CKD to improve population health across all socioeconomic groups requires reliable evidence about how health and its determinants are distributed across the population. Ongoing monitoring and reporting on trends in health inequalities helps to support policymaking, informs interventions and assists in evaluating progress.
Although this report has provided a number of measures of inequalities in CVD, diabetes and CKD incidence, prevalence and mortality, several gaps and limitations remain.
Data sourcesSample surveys are often used in assessing health inequalities, and frequently include self-reported information. There are challenges in accurately identifying people who have a health condition in surveys based on self-reporting of their conditions. Only 1 recent national survey, the ABS 2011–12 Australian Health Survey, has used biomedical measures to identify persons with diabetes or CKD. Sampling frameworks in surveys can also preclude detailed analysis of population groups, and can introduce uncertainty around estimates derived from the data.
Data availability and analytical constraints limit monitoring and the evidence needed for policy development. The extension of reporting to include variables such as ethnicity, culture and language, social support and the residential environment would provide a more robust picture of socioeconomic position. There is also scope for linking health and welfare data to provide a broader and more comprehensive understanding of the effects of social determinants. Additional longitudinal data would also enable improved monitoring of gaps and gradients in health inequalities.
Individual and area-based dataIndividual data for certain populations are not available in some data sources when used in isolation. For example, the National Mortality Database does not collect data on income, education or occupation, or on other social determinants. Statistical linkage of data sets can provide indicators of both socioeconomic position and health outcome, and allows for better monitoring of social inequalities. This report has used the newly available ABS Death Registrations to Census linked dataset. It has enabled inequalities in mortality to be assessed by individual characteristics such as education, income and housing tenure. Other individual characteristics, such as employment status and occupational group, are less suited for assessing socioeconomic inequalities in mortality, as most deaths are among older people who are no longer engaged in paid work.
Area-based indicators also have drawbacks. The SEIFA Index of Relative Socio-Economic Disadvantage used for some of the analysis in this report is an area-based stratifier based on information collected in censuses. Observations apply to the area level and not to each individual within the area, potentially leading to misclassification of socioeconomic characteristics. Some studies have found that using area-based data rather than individual-level data for socioeconomic characteristics can lead to an underestimate of health inequalities (Korda et al. 2016; Mather et al. 2014). The results in this report supports these findings. Despite these limitations, area-based socioeconomic data are useful for assessing inequalities in health and are more likely to be readily available. This report has included both area-based and individual-level data, and has compared results using both measures.
Reverse causationAlthough the data in this report capture the impact of inequalities on different socioeconomic groups, they do not assess the direction of an association between the social stratifier and the indicator, which may be bi-directional. For example, diabetes mortality was found to be higher among those with lower income levels. While this may be because those who had less income were at an increased risk of developing diabetes, it may also be that having diabetes interfered with their opportunity to earn a higher income.

38 Indicators of socioeconomic inequalities in cardiovascular disease, diabetes and chronic kidney disease
Reducing inequalityThe measurement of health inequalities in this report assumes that the health status of the most advantaged group would be achievable by the other population groups if the social and structural drivers of health inequalities were addressed. For example, the population attributable fraction (PAF) measures the proportion by which an outcome would be reduced in the total population if all population groups had the same rate as the reference group. Future analysis could include multivariable modelling to explore associations between multiple stratifiers and indicators while adjusting for potential confounders.
Underlying causes of inequalityWhile this report documents inequalities in CVD, diabetes and CKD incidence, prevalence and mortality, it does not explore the underlying reasons for these inequalities in detail. Social determinants of health—including income, education, employment and work, housing and homelessness and the built environment—are often highlighted as underpinning many of these inequalities.
Social determinants of health act through complex and multidirectional pathways. Research is focusing on better understanding the causal links between social determinants and health outcomes. Across all key determinants, evaluation of programs and interventions to identify successes in reducing inequalities is important.
Further research on these determinants will provide a broader understanding of the experience of population groups, the relationships between health and welfare, and greater evidence for causal pathways to good CVD, diabetes and CKD health.

39Indicators of socioeconomic inequalities in cardiovascular disease, diabetes and chronic kidney disease
Appendix A: Data sources
ABS 2011–12 Australian Health SurveyThe ABS 2011–12 Australian Health Survey (AHS) combined the existing National Health Survey (NHS) with 2 additional components: a National Nutrition and Physical Activity Survey and a National Health Measures Survey.
The National Health Measures Survey collected voluntary samples from around 11,200 Australian adults and children. Voluntary urine samples were collected from respondents aged 5 and over, and voluntary blood samples from respondents aged 12 and over.
Test results from these samples were used in this report to estimate the prevalence of CKD in the Australian population aged 18 years and over. The prevalence of CKD was derived using a combination of survey participants’ biomedical test results. These tests determined kidney function (estimated glomerular filtration rate, or eGFR) and kidney damage (albumin creatinine ratio, or ACR).
More information can be found in the ABS Australian Health Survey: users’ guide, 2011–13 <http://www.abs.gov.au/ausstats/[email protected]/PrimaryMainFeatures/4363.0.55.001?OpenDocument>.
ABS Death Registrations to Census linked datasetThe ABS, with the support of State and Territory Registrars of Births Deaths and Marriages, has created an information base for research into mortality and health outcomes in Australia by combining death registrations data with data from the 2011 Australian Census of Population and Housing.
The records of individuals whose deaths were registered in 2011–12 have been augmented with personal information obtained from the 2011 Census. The resulting linked dataset allows for a better understanding of health risk factors and inequalities in mortality among individual Australians.
Some 81% of death registration records were correctly matched to census records, however this linkage rate varied across subpopulations. To enhance the representativeness of death outcomes by cause of death, and to compensate for the unequal distribution of the linkage rate across population characteristics, the analysis applied stage 2 weighting.
The linked dataset is used in this report to compare the variation in cardiovascular disease, diabetes and chronic disease death rates across individual measures of socioeconomic position. These individual measures include household equivalised income, highest educational attainment and housing tenure.
These measures were calculated for different populations at risk. For the educational attainment measure, the population at risk was the 2011 usual resident population aged 25 to 74; for the equivalised income measure, the population at risk was persons who were enumerated in a private dwelling on census night in 2011; and for the housing tenure measure, the population at risk was persons aged 25 and over who were enumerated in a private dwelling on census night in 2011.
More information on the ABS Death Registrations to Census linked dataset can be found in ABS 2016b at <http://www.abs.gov.au/ausstats/[email protected]/mf/1351.0.55.058>.

40 Indicators of socioeconomic inequalities in cardiovascular disease, diabetes and chronic kidney disease
AIHW National Mortality DatabaseMortality data in this report were provided by the Registries of Births, Deaths and Marriages, the Coroners and the National Coroners Information System and coded by the ABS. These data are maintained at the Australian Institute of Health and Welfare (AIHW) in the National Mortality Database (NMD).
Registration of deaths is the responsibility of the state and territory Registrars of Births, Deaths and Marriages. Analysis is by year of registration of death. Deaths registered in 2010 that occurred before 2007 for usual residents of Queensland were excluded from the 2010 year of registration data as recommended by the ABS. This is to minimise the impact of late registration of deaths due to recent changes in the timeliness of death registrations in Queensland.
Deaths registered in 2013 and earlier are based on the final version of cause of death data; deaths registered in 2014 are based on the revised version; deaths registered in 2015 and 2016 are based on the preliminary version. Revised and preliminary versions are subject to further revision by the ABS.
The data quality statements underpinning the AIHW National Mortality Database can be found in the following ABS publications:
ABS quality declaration summary for Deaths, Australia (ABS cat. no. 3302.0) <http://www.abs.gov.au/ausstats/abs%40.nsf/mf/3302.0/>
ABS quality declaration summary for Causes of death, Australia (ABS cat. no. 3303.0) <http://www.abs.gov.au/ausstats/abs%40.nsf/mf/3303.0/>
For more information on the AIHW National Mortality Database see Deaths data at AIHW <https://www.aihw.gov.au/about-our-data/our-data-collections/national-mortality-database>.
AIHW National Hospital Morbidity DatabaseThe AIHW National Hospital Morbidity Database (NHMD) is a compilation of episode-level records from admitted patient morbidity data collection systems in Australian hospitals. The data supplied are based on the National minimum data set (NMDS) for Admitted patient care and include demographic, administrative and length of stay data, as well as data on the diagnoses of the patients, the procedures they underwent in hospital and external causes of injury and poisoning.
The purpose of the NMDS for Admitted patient care is to collect information about care provided to admitted patients in Australian hospitals. The scope of the NMDS is episodes of care for admitted patients in all public and private acute and psychiatric hospitals, free-standing day hospital facilities, and alcohol and drug treatment centres in Australia. Hospitals operated by the Australian Defence Force, corrections authorities and in Australia’s off-shore territories are not in scope but some are included.
The counting unit in the NHMD is the ‘separation’, described as ‘hospitalisations’ in this report. ‘Separation’ is the term used to refer to the episode of admitted patient care, which can be a total hospital stay (from admission to discharge, transfer or death) or a portion of a hospital stay beginning or ending in a change of type of care (for example, from acute care to rehabilitation).
Although hospital separations data are a valuable source of information about admitted patient care, they have limitations as indicators of ill health. Sick people who are not admitted to hospital are not counted and those who have more than 1 separation in a reference year are counted on each occasion.
The hospital separations data do not include episodes of non-admitted patient care provided in outpatient clinics or emergency departments. Patients in these settings may be admitted subsequently, with the care provided to them as admitted patients being included in the NHMD.
Data on diagnoses are recorded uniformly using the 9th edition of the International Statistical Classification of Diseases and Related Health Problems, 10th Revision, Australian Modification (ICD-10-AM) (ACCD 2014).
Further information about the NHMD can be found in the Data quality statement: National Hospital Morbidity Database 2014–15: <http://meteor.aihw.gov.au/content/index.phtml/itemId/638202>.

41Indicators of socioeconomic inequalities in cardiovascular disease, diabetes and chronic kidney disease
Australia and New Zealand Dialysis and Transplant RegistryThe Australia and New Zealand Dialysis and Transplant Registry (ANZDATA) collects information to monitor dialysis and transplant treatments from all kidney units in Australia and New Zealand on all patients receiving kidney replacement therapy where the intention to treat is long-term. Cases of acute kidney failure are excluded.
The Registry is coordinated within the Queen Elizabeth Hospital in Adelaide, and compiles data on incidence and prevalence of treated ESKD, complications, comorbidities and patient deaths. All relevant hospitals and related dialysis units participate. Although patients have the option of opting out of having part or all of their data recorded, this rarely happens.
The interpretation and reporting of data from ANZDATA is the responsibility of the AIHW and in no way should be seen as an official policy or interpretation of ANZDATA.
Information about the data quality of ANZDATA can be found in the 40th annual report (ANZDATA 2017), available at: <http://www.anzdata.org.au/v1/report_2017.html>.
National Diabetes Services SchemeThe National Diabetes Services Scheme (NDSS) was established in 1987 and is administered by Diabetes Australia. It is an initiative of the Australian Government to subsidise the supply of diabetes-related products—such as pens and needles to administer insulin, blood glucose test strips and insulin pump consumables—to people who are registered with the scheme.
A diagnosis of diabetes that a health professional has substantiated is required in order to register with, and purchase products through the NDSS. Information on the type of diabetes diagnosed is provided by a doctor or a certified diabetes educator, while the date of diagnosis is provided by the registrant at the time of first registration with the scheme.
The NDSS dataset was used in this report to identify the population with diagnosed diabetes. Not all people with type 1, type 2 or other diabetes types register with the NDSS. However, given the benefits that the NDSS provides to people with diabetes, it is assumed that it captures a high proportion of the diabetes population in Australia.
The ABS 2011–12 Australian Health Survey, which included both measured and self-report data, estimated that for every 4 adults with diagnosed diabetes, there was 1 who was undiagnosed (ABS 2013). It is unknown whether there are socioeconomic inequalities in diabetes prevalence among this undiagnosed population.
Further information about the NDSS can be found in the National (insulin-treated) Diabetes Register 2014 Data Quality Statement <http://meteor.aihw.gov.au/content/index.phtml/itemId/632137>.

42 Indicators of socioeconomic inequalities in cardiovascular disease, diabetes and chronic kidney disease
Appendix B: Methods and classifications
Age-standardised ratesAge-standardisation is a statistical method of removing the influence of age when comparing populations with different age structures—either different populations at 1 time or the same population at different times. Two different methods of age-standardisation can be used: direct and indirect. Direct age-standardisation is used in this report. The Australian estimated resident population as at 30 June 2001 has been used as the standard population.
Disease classificationsInternational Statistical Classification of Diseases and Related Health Conditions
Deaths registered were classified according to ICD-10 codes.
Disease ICD-10 codes
Cardiovascular disease I00–I99
Coronary heart disease I20–I25
Acute myocardial infarction I21
Angina I20
Stroke I60–I64
Diabetes E10, E11, E13, E14, O24.0–O24.4, O24.9
Diabetes, type 2 E11
Chronic kidney disease E10.2, E11.2, E13.2, E14.2, I12, I13, I15.0, I15.1
N00–N07, N11–N12, N14–N15, N18–N19, N25–N28, N391, N392
E85.1, D59.3, B52.0, Q60–Q63, T82.4, T86.1
Source: AIHW National Mortality Database.
Hospitalisations were classified according to ICD-10-AM codes.
Disease ICD-10-AM codes
Cardiovascular disease I00–I99
Coronary heart disease I20–I25
Acute myocardial infarction I21
Angina I20
Stroke I60–64
Diabetes E10, E11, E13, E14, O24.0–O24.4, O24.9
Diabetes, type 2 E11
Chronic kidney disease E10.2, E11.2, E13.2, E14.2, I12, I13, I15.0, I15.1
N00–N08, N11–N12, N14–N16, N18–N19, N25–N28, N391, N392
Q60–Q63, T82.4, T86.1, Z49.0, Z49.1, Z49.2, Z94.0, Z99.2
Source: AIHW National Hospital Morbidity Database.

43Indicators of socioeconomic inequalities in cardiovascular disease, diabetes and chronic kidney disease
Estimating heart attack and stroke eventsCurrently, there are no national registers for calculating the incidence of heart attack or stroke events. The AIHW has developed proxy measures that use unlinked episode based hospital data from the NHMD and deaths data from the NMD to estimate these incidences. As these data are unlinked, algorithms are required to take account of duplicates across the 2 data sets and multiple episodes for the 1 event within the NHMD.
The method for estimating the incidence of heart attack includes both acute myocardial infarction and unstable angina hospitalisations and acute CHD deaths in a given year:
• Number of fatal events: the number of deaths where ‘acute coronary heart disease’ (ICD-10 codes I20–I24) is the underlying cause of death in each calendar year (based on year of registration of death).
• Number of non-fatal events: the number of non-fatal hospitalisations where Acute myocardial infarction (AMI) (ICD-10-AM I21) or Unstable angina (UA) (ICD-10-AM 120.0) are the principal diagnosis; separation mode is not equal to Died or Transferred to another acute hospital, and care type is not equal to New born—unqualified days only or Organ procurement–posthumous or Hospital boarder in each calendar year (based on discharge date from hospital).
The method for estimating stroke events counts acute stroke hospitalisations and stroke deaths in a given year:
• Number of stroke deaths: the number of deaths where Stroke (ICD-10 codes I60–I64) is the underlying cause of death registered in each calendar year.
• Number of acute and non-fatal stroke hospitalisations (first and recurrent stroke events): the number of acute and non-fatal hospitalisations defined as separations where the care type was Acute, Newborn (for separations with at least 1 qualified days) or was Not reported with a principal diagnosis of Stroke (ICD-10-AM codes I60–I64), excluding any separation that had a Mode of admission of Admitted patient transferred from another hospital or Statistical admission: care type change, or had a Mode of separation of Died in each calendar year (based on discharge date from hospital).
More information on the estimation of heart attack and stroke events can be found in <https://www.aihw.gov.au/getmedia/0ce5f234-0abf-41b9-a392-be5dd1e94c54/17034.pdf.aspx?inline=true>.
Measures of inequalityThis report uses several measures to give a fuller understanding of the level of socioeconomic inequality between population groups.
Both absolute and relative measures are used, reflecting different aspects of inequality. Absolute measures indicate the magnitude of inequality, using the measure rate difference in this report. Relative measures compare the relative size of the inequality, using the measures rate ratio, relative index of inequality (RII) and population attributable fraction (PAF) in this report.
Rate difference (absolute inequality): The rate for the group of interest minus the rate for the reference group. A rate difference of greater than 0 indicates that the rate for the group of interest is higher than the rate for the reference group. A rate difference of less than 0 indicates that the rate for the group of interest is lower than the rate for the reference group. A rate difference of 0 indicates that the rate for the group of interest is the same as the rate for the reference group.
Rate ratio (relative inequality): The rate for the group of interest relative to (divided by) the rate for the reference group. A rate ratio of greater than 1 indicates that the rate for the group of interest is higher than the rate for the reference group. A rate ratio of less than 1 indicates that the rate for the group of interest is lower than the rate for the reference group. A rate ratio of 1 indicates that the rate for the group of interest is the same as the rate for the reference group.

44 Indicators of socioeconomic inequalities in cardiovascular disease, diabetes and chronic kidney disease
Relative index of inequality (RII) (relative inequality): The RII describes the gradient of health observed across the disadvantage scale, relative to the mean. It is calculated by regressing the rate for each group on the proportion of the population that has a higher socioeconomic position. An RII of 0 indicates no inequality. Larger values of the RII indicate higher levels of inequality relative to the mean.
The value of RII gives the magnitude of inequality in relation to the mean, in the linear model describing the data: Absolute range = mean x RII.
RII has the advantage in being based on data about the whole population, rather than the extremes of disadvantage. It does, however, assume a linear relationship between the health indicator and disadvantage, and its interpretation is not straightforward.
A useful interpretation of RII is to consider the average change in the health outcome for each disadvantage group. If, for example, the mean mortality rate is 70 per 100,000 and RII = 0.60, this could be interpreted as: with each increasing quintile, the mortality rate increases by 8.4 per 100,000 (i.e. 0.60 x 70/5).
Population attributable fraction (PAF) (relative inequality): The population attributable fraction (PAF) is a relative measure of impact. It is the percentage of total cases that would be avoided if all groups had the same rate as the least disadvantaged group. Large values of the PAF indicate high levels of inequality.
For more information on measures of inequality and their calculation, see Mackenbach & Kunst 1997; Public Health Ontario 2013; Regidor 2004a, 2004b; ScotPHO 2018.
Measures of socioeconomic positionIn this report, 4 measures are used to group the Australian population by socioeconomic position. These measures are the Index of Relative Socio-economic Disadvantage, highest educational attainment, equivalised household income and housing tenure.
Index of Relative Socio-economic Disadvantage The IRSD is 1 of 4 indices compiled by the ABS using information collected in the Census of Population and Housing (ABS 2018). This index represents the socioeconomic conditions of Australian geographic areas by measuring aspects of disadvantage. The IRSD scores each area by summarising attributes of their populations, such as low income, low educational attainment, high unemployment, and jobs in relatively unskilled occupations. Areas can then be ranked by their IRSD score and classified into groups, based on their rank. In this report, 5 groups—or quintiles—were used. Relatively disadvantaged areas have low index values (referred to as ‘lowest group’ in this report), and relatively advantaged areas have high index values (referred to as ‘highest group’ in this report).
The IRSD reflects the overall or average socioeconomic position of the population of an area; it does not show how individuals living in the same area might differ from each other in their socioeconomic position. As the population of many areas covers a broad range of socioeconomic disadvantage, these measures may underestimate the true effect of disadvantage on health.
The IRSD is designed primarily to compare the relative socio-economic characteristics of areas at a given point in time, and not to compare individual areas across time (ABS 2018). There are a number of issues that potentially make longitudinal or time series analysis using indexes from different Census difficult to interpret. To address these, this report makes use of equal groups (e.g. quintiles) rather than ranks or scores.
Further information: <http://www.abs.gov.au/ausstats/[email protected]/mf/2033.0.55.001>.

45Indicators of socioeconomic inequalities in cardiovascular disease, diabetes and chronic kidney disease
Highest educational attainmentLevel of highest educational attainment is classified according to the ABS Australian Standard Classification of Education (ASCED) (ABS 2001). ASCED is a statistical classification for use in the collection and analysis of data on educational activity and attainment.
ASCED classifies education according to 2 elements: Level of education and Field of study. Level of education is a hierarchical classification and comprises 9 broad levels, 15 narrow levels and 64 detailed levels. Field of study refers to the subject matter taught in a course, unit, and modules of study. It is also a hierarchical classification.
ASCED broad level
1 – Postgraduate degree level2 – Graduate diploma and graduate certificate level3 – Bachelor degree level4 – Advanced diploma and diploma level5 – Certificate level6 – Secondary education7 – Primary education8 – Pre-primary education9 – Other education
Source: ABS 2001.
The analysis by highest educational attainment is limited to persons aged 25–74. Younger persons who may still be undertaking educational training are excluded.
Equivalised household incomeEquivalised household income is calculated by summing the personal incomes reported by all household members aged 15 years and over and applying a weighting according to the ‘modified OECD’ equivalence scale. The equivalence factor is built up by allocating points to each person in a household (1 point to the first adult, 0.5 points to each additional person who is 15 years and over, and 0.3 to each child under the age of 15) and then summing the equivalence points of all household members.
In the Death Registrations to Census linked dataset, the grouping was based on income ranges. Analysis was limited to people in occupied private dwellings on census night, and excludes persons in non-private dwellings such as hospitals, aged care facilities and other dwelling types. These exclusions comprised approximately one-third (33%) of total deaths in the linked dataset.
More information on equivalised household income can be found in the ABS National Health Survey Users’ Guide, 2014–15 <http://www.abs.gov.au/AUSSTATS/[email protected]/Latestproducts/4363.0Appendix52014-15?opendocument&tabname=Notes&prodno=4363.0&issue=2014-15&num=&view=>.
Housing tenureHousing tenure describes whether occupied private dwellings are owned, being purchased or rented. In this study, housing tenure was classified according to categories used in the ABS 2011 census (ABS 2011):
‘Owned’—Owned outright, Owned with a mortgage, Other tenure type.
‘Rented’—Real estate agent, State or territory housing authority, Person not in same household, Housing co-operative, community or church group, Other landlord type, Landlord type not stated.

46 Indicators of socioeconomic inequalities in cardiovascular disease, diabetes and chronic kidney disease
Excluded from this analysis are ‘Tenure type not stated’ and ‘Tenure type not applicable’. ‘Tenure type not applicable’ comprises ‘Unoccupied private dwellings’, ‘Non-private dwellings’ (including hospitals and aged care facilities) and ‘Migratory, off-shore and shipping’.
The ABS Death Registrations to Census linked dataset included a substantial proportion of deaths classified as ‘Tenure type not applicable’, equating to 39% of CVD deaths, 37% of diabetes deaths and 34% of CKD deaths in 2011–12.
Significance testing
Confidence intervalsA test of statistical significance indicates how likely an observed difference is due to chance alone. Use of 95% confidence intervals (CIs) is the simplest way to test whether 2 rates are statistically different. CIs describe a span of numbers around an estimate which has a 95% chance of including the true value. Estimates produced using low numbers can be sensitive to small changes in numbers over time and will therefore have wide CIs.
CIs are provided in this report for CKD prevalence rates and ratios which have been derived from survey data. Differences are deemed to be statistically significant if CIs do not overlap with each other (when comparing prevalence rates) or 1.0 (when comparing prevalence ratios).
Direction of trendsThis report includes trend data, where available, to assess whether inequalities in CVD, diabetes and CKD are increasing or decreasing.
No statistical tests were conducted to ascertain the direction of a trend. However, an indication of trend direction is given through the use of the following symbols:
Indicates a favourable trend. The indicator has moved in the desired direction, with 2 consecutive falls in the measure over the period.
Indicates an unfavourable trend. The indicator has moved in the opposite to the desired direction, with 2 consecutive rises in the measure over the period.
Indicates no change or trend unclear. There is no evidence of 2 consecutive rises or falls in the measure over the period.
Underlying and associated causes of deathDeath statistics are often based on the underlying cause of death only—that is, the disease or injury that initiated the train of events leading directly to death, or the circumstances of the accident or violence that produced the fatal injury. Analysis of the underlying cause of death is important because it points to where interventions can be targeted.
Associated causes of death are all causes listed on the death certificate, other than the underlying cause of death. They include the immediate (or direct) cause (the condition that occurred immediately before death or closest to the time of death); any intervening causes; and conditions which contributed to the death but were not related to the disease or condition causing the death.
Analyses using associated causes of death may offer insight into the disease processes occurring at the end of life. A more complete picture of the mortality burden can also be obtained by examining both underlying and associated cause of death.
In this report, CVD cause of death statistics are based on the underlying cause of death only. As diabetes and CKD are more commonly listed as associated causes of death on death certificates, statistics for these 2 causes are based on both the underlying and associated causes of death.

47Indicators of socioeconomic inequalities in cardiovascular disease, diabetes and chronic kidney disease
ReferencesABS (Australian Bureau of Statistics) 2001. Australian Standard Classification of Education (ASCED), 2001. ABS cat. no. 1272.0. Canberra: ABS.
ABS 2011. Census dictionary, Australia 2011. ABS cat. no. 2901.0. Canberra: ABS.
ABS 2013. Australian Health Survey: biomedical results for chronic diseases, 2011–12. ABS cat. no. 4364.0.55.005. Canberra: ABS.
ABS 2014. Microdata: Australian Health Survey, core content—risk factors and selected health conditions, 2011–12, DataLab. ABS cat. no. 4324.0.55.003. Canberra: ABS.
ABS 2015. National Health Survey: first results, Australia, 2014–15. ABS cat. no. 4364.0.55.001. Canberra: ABS.
ABS 2016a. Microdata: Disability, Ageing and Carers, Australia, 2015. ABS cat. no. 4430.0.30.002. Canberra: ABS.
ABS 2016b. Research paper: death registrations to census linkage project—a linked dataset for analysis. ABS cat. no. 1351.0.55.058. Canberra: ABS.
ABS 2018. Census of Population and Housing: Socio-economic Indexes for Areas (SEIFA), 2016. ABS cat. no. 2033.0.55.001. Canberra: ABS.
ACCD (Australian Consortium for Classification Development) 2014. The International Statistical Classification of Diseases and Related Health Problems, 10th Revision, Australian Modification (ICD-10-AM)—9th edn—Tabular list of diseases and Alphabetic index of diseases. Adelaide: Independent Hospital Pricing Authority.
AHMAC (Australian Health Ministers’ Advisory Council) 2017. National Strategic Framework for Chronic Conditions. Canberra: Department of Health.
AIHW (Australian Institute of Health and Welfare): Moon L & Waters A-M 2006. Socioeconomic inequalities in cardiovascular disease in Australia: current picture and trends since the 1990s. Bulletin no. 37. Cat. no. AUS 74. Canberra: AIHW.
AIHW 2014. Cardiovascular disease, diabetes and chronic kidney disease—Australian facts: prevalence and incidence. Cardiovascular disease, diabetes and chronic kidney disease series no. 2. Cat. no. CDK 2. Canberra: AIHW.
AIHW 2016. Australian Burden of Disease Study: Impact and causes of illness and death in Australia 2011. Australian Burden of Disease Study series no. 3. Cat. no. BOD 4. Canberra: AIHW.
AIHW 2017. Chronic kidney disease compendium. Cat. no. WEB 108. Canberra: AIHW.
AIHW 2018a. Australia’s health 2018. Cat. no. AUS 221. Canberra: AIHW.
AIHW 2018b. Cardiovascular disease snapshot. Cat. no. CVD 83. Canberra: AIHW.
AIHW 2018c. Diabetes snapshot. Cat. no. CVD 82. Canberra: AIHW.
ANZDATA (Australia and New Zealand Dialysis and Transplant Registry) 2017. 40th Annual ANZDATA Report. Adelaide: ANZDATA.
Bennett S 1995. Cardiovascular risk factors in Australia: trends in socioeconomic inequalities. Journal of Epidemiology and Community Health 49(4):363–72.
Bennett S 1996. Socioeconomic inequalities in coronary heart disease and stroke mortality among Australian men, 1979–1993. International Journal of Epidemiology 25(2):266–75.
Berkman LF, Kawachi I & Glymour MM (eds) 2014. Social epidemiology. 2nd edition. Oxford: Oxford University Press.

48 Indicators of socioeconomic inequalities in cardiovascular disease, diabetes and chronic kidney disease
Burnley IH 1999. Transitions and inequalities in acute myocardial infarction mortality in New South Wales, 1969–94. Australian and New Zealand Journal of Public Health 23(4):343–51.
Cass A, Cunningham J, Wang Z & Hoy W 2001. Social disadvantage and variation in the incidence of end-stage renal disease in Australian capital cities. Australian and New Zealand Journal of Public Health 25(4):322–6.
Cunningham J 2010. Socio-economic gradients in self-reported diabetes for Indigenous and non-indigenous Australians aged 18–64. Australian and New Zealand Journal of Public Health 34(s1):S18–24.
Department of Health 2015. Australian National Diabetes Strategy 2016–2020. Canberra: Department of Health.
Dobson AJ, Gibberd RW, Leeder SR & O’Connell DL 1985. Occupational differences in ischaemic heart disease mortality and risk factors in Australia. American Journal of Epidemiology 122(2):283–90.
Dutton T, Turrell G & Oldenburg B 2005. Measuring socioeconomic position in population health monitoring and health research. Health inequalities monitoring series number 3. Brisbane: Queensland University of Technology, School of Public Health.
Galobardes B, Lynch J & Smith GD 2007. Measuring socioeconomic position in health research. British Medical Bulletin 81–82:21–37.
Gibberd RW, Dobson AJ, Florey C duVe & Leeder SR 1984. Differences and comparative declines in ischaemic heart disease mortality among subpopulations in Australia, 1969–1978. International Journal of Epidemiology 13(1):25–31.
Glover JD, Hetzel DM & Tennant SK 2004. The socioeconomic gradient and chronic illness and associated risk factors in Australia. Australia and New Zealand Health Policy 1(1):8.
Grace BS, Clayton P, Cass A & McDonald S 2012. Socio-economic status and incidence of renal replacement therapy: a registry study of Australian patients. Nephrology, Dialysis, Transplantation 27(11):4173–80.
Havranek EP, Mujahid MS, Barr DA, Blair IV, Cohen MS, Cruz-Flores S et al. 2015. Social determinants of risk and outcomes for cardiovascular disease—a scientific statement from the American Heart Association. Circulation 132(9):873–98.
Heeley EL, Wei JW, Carter K, Islam MS, Thrift AG, Hankey GJ et al. 2011. Socioeconomic disparities in stroke rates and outcome: pooled analysis of stroke incidence studies in Australia and New Zealand. Medical Journal of Australia 195(1):10–14.
Kavanagh A, Bentley R, Turrell G, Shaw J, Dunstan D & Subramanian SV 2010. Socioeconomic position, gender, health behaviours and biomarkers of cardiovascular disease and diabetes. Social Science & Medicine 71(6):1150–60.
Korda RJ, Soga K, Joshy G, Calabria B, Attia J, Wong D et al. 2016. Socioeconomic variation in incidence of primary and secondary major cardiovascular disease events: an Australian population-based prospective cohort study. International Journal for Equity in Health 15:189.
Mackenbach JP 2015. Socioeconomic inequalities in health in high-income countries: the facts and the options. In: Detels R, Gulliford M, Karim QA & Tan CC (eds). Oxford textbook of global public health. Vol. 1. 6th edn. Oxford: Oxford University Press.
Mackenbach JP & Kunst AE 1997. Measuring the magnitude of socio-economic inequalities in health: an overview of available measures illustrated with two examples from Europe. Social Science & Medicine 44(6):757–71.

49Indicators of socioeconomic inequalities in cardiovascular disease, diabetes and chronic kidney disease
Mather T, Banks E, Joshy G, Bauman A, Phongsavan P & Korda RJ 2014. Variation in health inequalities according to measures of socioeconomic status and age. Australian and New Zealand Journal of Public Health 38(5):436–40.
Page A, Lane A, Taylor R & Dobson A 2012. Trends in socioeconomic inequalities in mortality from ischaemic heart disease and stroke in Australia, 1979–2006. European Journal of Preventive Cardiology 19(6):1281–89.
Public Health Ontario (Ontario Agency for Health Protection and Promotion) 2013. Summary measures of socioeconomic inequalities in health. Toronto, ON: Queen’s Printer for Ontario.
Regidor E 2004a. Measures of health inequalities: part 1. Journal of Epidemiology and Community Health 58(10):858–61.
Regidor E 2004b. Measures of health inequalities: part 2. Journal of Epidemiology and Community Health 58(11): 900–03.
ScotPHO (Scottish Public Health Observatory) 2018. Health inequalities—methodology. Viewed 17 October 2018, <https://www.gov.scot/Topics/Statistics/Browse/Health/TrendHealthOutcome/methodology>.
Taylor R, Chey T, Bauman A & Webster I 1999. Socio-economic, migrant and geographic differentials in coronary heart disease occurrence in New South Wales. Australian and New Zealand Journal of Public Health 23(1):20–26.
Thrift AG, Dewey HM, Sturm JW, Paul SL, Gilligan AK, Srikanth VK et al. 2006. Greater incidence of both fatal and nonfatal strokes in disadvantaged areas: the Northeast Melbourne stroke incidence study. Stroke 37(3):877–82.
Wilkinson R & Marmot M (eds) 2003. Social determinants of health. The solid facts. 2nd edn. Copenhagen: WHO.
Williams ED, Tapp RJ, Magliano DJ, Shaw JE, Zimmet PZ, Oldenburg BF 2010. Health behaviours, socioeconomic status and diabetes incidence: the Australian Diabetes Obesity and Lifestyle Study (AusDiab). Diabetologia 53(12):2538–45.

50 Indicators of socioeconomic inequalities in cardiovascular disease, diabetes and chronic kidney disease
List of tablesTable 2.1: Summary measures of inequalities in heart attack incidence, people aged 25 and over,
by socioeconomic area and sex, 2006 to 2016 ................................................................................ 9
Table 2.2: Summary measures of inequalities in stroke incidence, by socioeconomic area and sex, 2006 to 2016 ...................................................................................................................................... 11
Table 2.3: Summary measures of inequalities in cardiovascular disease death rates, by socioeconomic area and sex, 2001 to 2016 ............................................................................. 13
Table 3.1: Summary measures of inequalities in type 2 diabetes prevalence, by socioeconomic area and sex, 2011 and 2016 ........................................................................... 21
Table 3.2: Summary measures of inequalities in diabetes death rates, by socioeconomic area and sex, 2001 to 2016 ....................................................................................................................... 23
Table 4.1: Summary measures of inequalities in treated end-stage kidney disease prevalence, by socioeconomic area and sex, 2011 and 2016 ........................................................................... 31
Table 4.2: Summary measures of inequalities in chronic kidney disease death rates, by socioeconomic area and sex, 2001 to 2016 ............................................................................. 33
List of figuresFigure 2.1: Heart attack incidence, people aged 25 and over, by socioeconomic area and sex, 2016 ....... 8
Figure 2.2: Stroke incidence, by socioeconomic area and sex, 2016 ........................................................... 10
Figure 2.3: Cardiovascular disease death rates, by socioeconomic area and sex, 2016 .......................... 12
Figure 2.4: Cardiovascular disease mortality, by equivalised household income and sex, 2011–12 ........ 14
Figure 2.5: Cardiovascular disease mortality, persons aged 25–74, by highest educational attainment and sex, 2011–12 ......................................................................................................... 15
Figure 2.6: Cardiovascular disease mortality, persons aged 25 and over, by housing tenure and sex, 2011–12 .............................................................................................................................. 16
Figure 3.1: Type 2 diabetes prevalence, by socioeconomic area and sex, 2016 ......................................... 20
Figure 3.2: Diabetes death rates, by socioeconomic area and sex, 2016 ................................................... 22
Figure 3.3: Diabetes mortality, by equivalised household income and sex, 2011–12 ............................... 24
Figure 3.4: Diabetes mortality, persons aged 25–74, by highest educational attainment and sex, 2011–12 .............................................................................................................................. 25
Figure 3.5: Diabetes mortality, persons aged 25 and over, by housing tenure and sex, 2011–12 ........... 26
Figure 4.1: Chronic kidney disease, persons aged 18 and over, by socioeconomic area and sex, 2011–12 .............................................................................................................................. 29
Figure 4.2: Treated end-stage kidney disease prevalence, by socioeconomic area and sex, 2016 ......... 30
Figure 4.3: Chronic kidney disease death rates, by socioeconomic area and sex, 2016 .......................... 32
Figure 4.4: Chronic kidney disease mortality, by equivalised household income and sex, 2011–12 ........ 34
Figure 4.5: Chronic kidney disease mortality, persons aged 25–74, by highest educational attainment and sex, 2011–12 ......................................................................................................... 35
Figure 4.6: Chronic kidney disease mortality, persons aged 25 and over, by housing tenure and sex, 2011–12 .............................................................................................................................. 36

51Indicators of socioeconomic inequalities in cardiovascular disease, diabetes and chronic kidney disease
Related publicationsThe following AIHW publications relating to health inequalities might also be of interest:
• AIHW 2015. Cardiovascular disease, diabetes and chronic kidney disease—Australian facts: Aboriginal and Torres Strait Islander people. Cardiovascular, diabetes and chronic kidney disease series no. 5. Cat. no. CDK 5. Canberra: AIHW.
• AIHW 2015. Cardiovascular disease, diabetes and chronic kidney disease—Australian facts: Risk factors. Cardiovascular, diabetes and chronic kidney disease series no. 4. Cat. no. CDK 4. Canberra: AIHW.
• AIHW 2014. Cardiovascular disease, diabetes and chronic kidney disease—Australian facts: Morbidity—hospital care. Cardiovascular, diabetes and chronic kidney disease series no. 3. Cat. no. CDK 3. Canberra: AIHW.
• AIHW 2014. Cardiovascular disease, diabetes and chronic kidney disease—Australian facts: Prevalence and incidence. Cat. no. CDK 2. Canberra: AIHW.
• AIHW 2014. Cardiovascular disease, diabetes and chronic kidney disease—Australian facts: Mortality. Cardiovascular, diabetes and chronic kidney disease series no. 1. Cat. no. CDK 1. Canberra: AIHW.
• AIHW 2014. Mortality inequalities in Australia 2009–2011. Bulletin no. 124. Cat. no. AUS 184. Canberra: AIHW.
• AIHW: Moon L & Waters A-M 2006. Socioeconomic inequalities in cardiovascular disease in Australia: current picture and trends since the 1990s. Bulletin No. 17. AIHW Cat. no. AUS 74. Canberra: AIHW.

Stronger evidence, better decisions, improved health and welfare
aihw.gov.au
People who are socioeconomically disadvantaged have, on average, greater levels of cardiovascular disease (CVD), diabetes and chronic kidney disease (CKD). In 2016, males and females living in the lowest socioeconomic areas of Australia had higher prevalence rates of type 2 diabetes and treated end-stage kidney disease; higher heart attack rates; and higher CVD, diabetes and CKD death rates than those living in the highest socioeconomic areas.