india’s national agricultural policy: a...
TRANSCRIPT

1
INDIA’S NATIONAL AGRICULTURAL POLICY: A CRITIQUE
Ramesh Chand∗∗
Agriculture is described as the backbone of Indian economy, mainly because
of three reasons. One, agriculture constitutes largest share of country's national
income though the share has declined from 55 percent in early 1950s to about 25
percent by the turn of the Century. Two, more than half of India’s workforce is
employed in its agriculture sector. Three, growth of other sectors and overall
economy depends on performance of agriculture to a considerable extent. Besides,
agriculture is a source of livelihood and food security for large majority of vast
population of India. Agriculture has special significance for low income, poor and
vulnerable sections of rural society. Because of these reasons agriculture is at the
core of socio economic development and progress of Indian society, and proper
policy for agriculture sector is crucial to improve living standards and to improve
welfare of masses.
1 BROAD CHARACTERISTICS OF AGRICULTURE
Agriculture in India is in the hands of millions of peasant households, a bulk
of which comprise tiny land holdings with preponderance of owner cultivation.
There is hardly any direct government intervention in the production and investment
decisions of the farmers but the government does influence the legal, material and
economic environment in which farmers operate (Vaidyanathan 1996).
Though tremendous progress has been made to exploit irrigation potential in
the country still two third of area under cultivation is unirrigated and there is thus
heavy dependence of production on vagaries of nature i.e. rainfall. Irrigated areas
have experienced sharp increase in productivity level and large part of output at such
farms is for market. On the other hand, productivity in unirrigated areas has remained
∗ Professor and Head, Agricultural Economics Unit, Institute of Economic Growth, Delhi.
2
either stagnant or experienced very small growth and most of the farmers in such
areas produce for subsistence purpose.
At overall level, agricultural growth remained slow (below 3 percent) in the
country. Apart from that, agricultural growth remained confined to a few well
endowed pockets which has created regional disparities.
2 PHASES IN AGRICULTURAL POLICY
There is a close association between agricultural policy followed in the
country and the magnitude and sources of output growth. Based on these,
agricultural policy followed during the last five decades can be broadly distinguished
in 3 phases. A detailed description of policy followed in each phase is given in Rao
(1996) and in this section we have drawn mainly from this paper.
The period from 1950/51 to mid 1960s which is also called pre green
revolution period witnessed tremendous agrarian reforms, institutional changes and
development of major irrigation projects. The intermediary landlordism was
abolished, tenant operations were given security of farming and ownership of land.
Land ceiling acts were imposed by all the states to eliminate large sized holdings and
cooperative credit institutions were strengthened to minimise exploitation of
cultivators by private money lenders and traders (Radhakrishna 1993). Land
consolidation was also affected to reduce the number of land fragments.
Expansion of area was the main source of growth in the pre green revolution
period. The scope for area expansion diminished considerably in the green revolution
period in which growth rate in area was less than half the growth rate in the first
period. Increase in productively became the main source of growth in crop output and
there was significant acceleration in yield growth in green revolution period. The
main source of productivity increase was technological breakthrough in wheat and
rice. The country faced severe food shortage and crisis in early 1960s which forced
the policy makers to realise that continuous reliance on food imports and aid imposes
heavy costs in terms of political pressure and economic instability (Rao 1996) and
there was a desperate search for a quick breakthrough in agricultural production.
One choice before the country was to go for spread of new seeds of high
yielding varieties (HYV) of wheat and rice which were available with CGIAR
3
institutes like CIMMYT and IRRI. Amidst a serious debate the then Government
took bold decision to go for the import and spread of HYV of wheat and rice which
involved use of fertilisers and irrigation. This marked second phase of agriculture
policy in the country. The strategy produced quick results as there was quantum
jump in yield. Consequently, wheat and rice production in a short span of 6 years
between 1965/66 and 1971/72 witnessed an increase of 30 million tonnes which is
168 percent higher than the achievement of 15 years following 1950/51.
The biggest achievement of new agricultural strategy, also known as green
revolution technology, has been attainment of self sufficiency in foodgrains. Since
the green revolution technology involved use of modern farm inputs, its spread led to
fast growth in agro input industry. Agrarian reforms during this period took back
seat while research, extension, input supply, credit, marketing, price support and
spread of technology were the prime concern of policy makers (Rao 1996).
Two very important institutions, namely Food Corporation of India and
Agricultural Prices Commission, were created in this period in the beginning of green
revolution period, to ensure remunerative prices to producers, maintain reasonable
prices for consumers, and to maintain buffer stock to guard against adverse impact of
year to year fluctuations in output on price stability. These two institutions have
mainly benefited rice and wheat crops which are the major cereals and staple food for
the country.
The next phase in Indian agriculture began in early 1980s. While there was
clear change in economic policy towards delicensing and deregulation in Industry
sector, agriculture policy lacked direction and was marked by confusion.
Agricultural growth accompanied by increase in real farm incomes led to emergence
of interest groups and lobbies which started influencing farm policy in the country.
There has been a considerable increase in subsidies and support to agriculture sector
during this period while public sector spending in agriculture for infrastructure
development started showing decline in real term but investments by farmers kept on
moving on a rising trend (Mishra and Chand 1995, Chand 2001). The output growth,
which was concentrated in very narrow pockets, became broad- based and got
momentum. The rural economy started witnessing process of diversification which
resulted into fast growth in non foodgrain output like milk, fishery, poultry,

4
vegetables, fruits etc which accelerated growth in agricultural GDP during the 1980s.
This growth seems largely market driven.
3 RECENT TRENDS
Though green revolution has been widely diffused in irrigated areas
throughout the country, the dryland areas have not seen benefit of technological
breakthrough as witnessed through green revolution technology. Of late, improved
varieties of oilseeds and course cereals have provided some opportunities for
productivity growth in dryland areas. A new phase was started in India’s economic
policy in 1991 that marked significant departure from the past. Government initiated
process of economic reforms in 1991, which involved deregulation, reduced
government participation in economic activities, and liberalization. Though much of
the reforms were not initiated to directly affect agriculture sector, the sector was
affected indirectly by devaluation of exchange rate, liberalisation of external trade and
disprotection to industry. Then came new international trade accord and WTO,
requiring opening up of domestic market. Initially there were strong apprehensions
about the impact of trade liberalisation on Indian agriculture which later on turned out
to be real threat for several commodities produced in the country.
All these changes raised new challenges and provided new opportunities that
required appropriate policy response. Besides, last two decades had witnessed mainly
price intervention that had a very limited coverage, and there was a sort of policy
vacuum. Because of this, there was a strong pressure on the government to come out
with a formal statement of agriculture policy to provide new direction to agriculture
in the new and emerging scenario. In response to this, government of India
announced New Agricultural Policy in July 2000.
4. NEW AGRICULTURAL POLICY AND CHALLENGES IN INDIAN AGRICULTURE
The challenges facing Indian agriculture can be grouped in four categories
relating to (1) growth (2) sustainability (3) efficiency and (4) equity. There are also
other important concerns like food security, livelihood, employment, improvement in
standard of living of agricultural population. Addressing these challenges requires
5
efforts on several fronts like incentive structure, infrastructure, technology, market
development, extension, regulations, input supply, tenancy etc. New agriculture
policy should address above challenges through efforts in abovementioned areas and
also provide direction to the future of agriculture in the country.
The National Agricultural Policy (NAP) document aims to attain output
growth rate in excess of 4 percent per annum in agriculture sector based on efficient
use of resources. It seeks to achieve this growth in a sustainable manner and with
equity. The Policy resolution than describe in detail the strategy and policy
alternatives which are grouped under the following heads:
1. Sustainable agriculture
2. Food and nutrition security
3. Generation and transfer of technology
4. Inputs management
5. Incentive for agriculture
6. Investment in agriculture
7. Institutional structure
8. Risk management
4.1 Growth prospects
Agricultural growth is essential for the sector’s progress and for overall
growth of Indian economy. This growth rate is also a sort of essential condition for
improving living standard of those who are dependent on agriculture. Past growth
experience of Indian agriculture can be seen from Table 1.
The main goal of National Agricultural Policy to achieve growth rate higher
than four percent seems to be formidable task particularly when we look at historical
rate of growth in Indian agriculture. As can be seen from Table 1 long run growth rate
in Indian agriculture in the post Independence period is found to be 2.55 percent per
annum. This growth rate includes contr ibution of technological breakthrough of green
revolution and major expansion in irrigation and in area under cultivation. Out of these
three sources of output growth the scope for expansion of cultivated area is much more
limited in future compared to that experienced in the past. Net cultivated area (NCA)
has become stagnant at 142 million hectares (Table 2) and unless serious efforts are
launched to bring wastelands under cultivation there would be no scope to expand

6
NCA. However cultivated area as such can be expanded by raising more number of
crops on the same piece of land i.e. by raising crop intensity. This expansion depends
heavily on provision of irrigation.
Table 1: Growth rates in GDP and value of output of agriculture and its sub sectors at 1993-94 prices GDP Value of Output
Period Agri. &
alliedAgri-
culture FishingCrop
sectorLive-stock
Fruit & vegetable
Non horti. crops
Decade -wise growth rates 1950-51 to 1959-60 2.71 2.93 5.79 3.06 1.42 0.56 3.441960-61 to 1969-70 1.51 1.27 4.00 1.70 0.41 5.82 1.091970-71 to 1979-80 1.74 1.94 2.90 1.79 3.92 2.88 1.551980/81 to 1989-90 2.95 3.13 5.82 2.47 4.99 2.36 2.481990/91 to 1999/2000 3.23 3.28 5.46 2.99 3.82 5.97 2.26Historic growth rate 1950-51 to 2001-02 2.55 2.66 4.31 2.65 3.12 4.00 2.39Reforms: growth rate 1990/91 to 1995/96 3.15 3.16 7.49 2.65 4.25 4.93 2.131996/97 to 2001/02 1.82 1.75 2.72 1.28 3.47 4.55 0.34 Post WTO growth rate 1990/91 to 1995/96 3.15 3.16 7.49 2.65 4.25 4.93 2.131990/91 to 1996/97 3.64 3.69 7.41 3.22 4.12 5.92 2.591990/91 to 1997/98 3.33 3.35 6.90 2.92 3.95 5.91 2.211990/91 to 1998/99 3.37 3.43 5.90 3.10 3.89 6.14 2.361990/91 to 1999/00 3.23 3.28 5.46 2.99 3.82 5.97 2.261990/91 to 2000/01 2.98 3.01 5.07 2.66 3.76 5.88 1.841990/91 to 2001/02 2.94 2.95 4.96 2.58 3.73 5.78 1.76Source of data: National accounts Statistics, various issues.
According to official estimates, available water resources can provide irrigation
to 140 million hectares area (Tenth Five Year Plan Vol. 2 Ch. 8) which can provide
irrigation to 72 percent of gross cropped area, assuming irrigated crop intensity to be
1.36, as compared to 40 percent area under irrigation at present. Further, productivity of
one hectare of gross irrigated area is reported to be 2.75 times the productivity of
unirrigated area (Dhawan 1994 p. 83). A simple exercise based on this information
reveals that if irrigation potential is fully exploited it would raise present level of output
by 50 percent. This further implies that if the entire irrigation potential is exploited by
the year 2020 it would enable the country to realize annual growth rate of the order of
2.00 percent per annum for two decades. This would require decadal increment in gross

7
irrigated area by 31.8 million hectare, which is more than double the irrigation potential
created during the decade of 1990s. In case the pace of irrigation development is
maintained at the level of decade of 1990s, it would help in attaining only 0.78 percent
growth rate in output.
Table 2: Changes in net and gross cultivated area and area under irrigation: 1950/51 to 1999-00 (Million hectare)
Particular 1950-51 TE
1959-60 TE
1969-70 TE
1979-80 TE
1989-90 TE
1999-00 Actual area: Net sown area 118.8 131.3 138.7 140.6 142.4 142.0Gross sown area 131.9 150.1 161.8 172.3 183.4 191.1Cropping Intensity 111.1 114.3 116.7 122.6 128.8 134.6Net Irrigated area 20.9 23.5 28.8 38.4 46.9 56.0Gross irrigated area 22.6 27.0 35.2 49.1 61.8 76.4Irrigated crop intensity 108.2 114.8 122.3 127.8 131.9 136.3Irrigation ratio: NIA/NCA 17.6 17.9 20.8 27.3 32.9 39.5Incremental area during the previous decade: Net sown area 12.5 7.4 2.0 1.8 -0.4Gross sown area 18.2 11.8 10.5 11.1 7.7Net Irrigated area 2.7 5.3 9.6 8.4 9.2Gross irrigated area 4.5 8.2 13.9 12.7 14.5 Ultimate Irrigation potential 140
This shows that tremendous efforts are needed in development of irrigation in
the country to help attain growth rate stipulated in National agricultural Policy. This
would require very sharp increase in public investments in agriculture, which has
remained either stagnant or followed decline during the last two decades. It would not
be an exaggeration to say that for creating such a magnitude of irrigation potential
would require trebling of public investments in real terms. Second, expansion of
irrigation through conventional means like major irrigation projects is likely to face
resistance from various environmental groups.
Growth rate results presented in Table 1 indicate that among all the five decades
in post independence India, highest growth rate is realized during the decade of 1990s.
This is the result of three factors. Main factor underlying high growth during the last
decade is diversification towards horticultural crops. Horticultural crops showed trend
growth rate close to 6 percent, which helped agriculture sector to attain growth rate of
3.28 percent. Second, the decade of 1990s has witnessed highest expansion in gross

8
irrigated area. Third, favourable terms of trade for agriculture are considered as another
factor for favourable growth during 1990s.
It would also be seen from Table 1, that, after area expansion effect of 1950s,
non horticultural crops never showed growth rate exceeding 2.5 pe rcent. In contrast to
this, horticultural crops, livestock and fishery have shown the potential to grow at the
rate of 4-5 percent for a long time. A simple exercise done by us reveal that due to large
difference in productivity per unit of land a one percent shift in area from non-
horticultural crops to horticultural crops raises overall output of crop sector by 4
percent.
These results and growth rate information presented in Table 1 makes it evident
that to achieve growth rate of four percent in agriculture India needs to follow
diversification of its agriculture extensively alongwith exploitation of its irrigation
potential at a faster rate compared to the past. A slight acceleration in growth rate for
the whole decade of 1990s should not be taken as a sustainable achievement as there
are worrying signs of slowdown in growth rate of almost all the sub sectors of
agriculture during the second half of decade of 1990s.
4.2 Sustainable agriculture
The policy aims to promote technically sound, economically viable,
environmentally non – degrading and socially acceptable use of country’s natural
resources – land, water and genetic endowments. This indeed is a tall order.
Land Resources
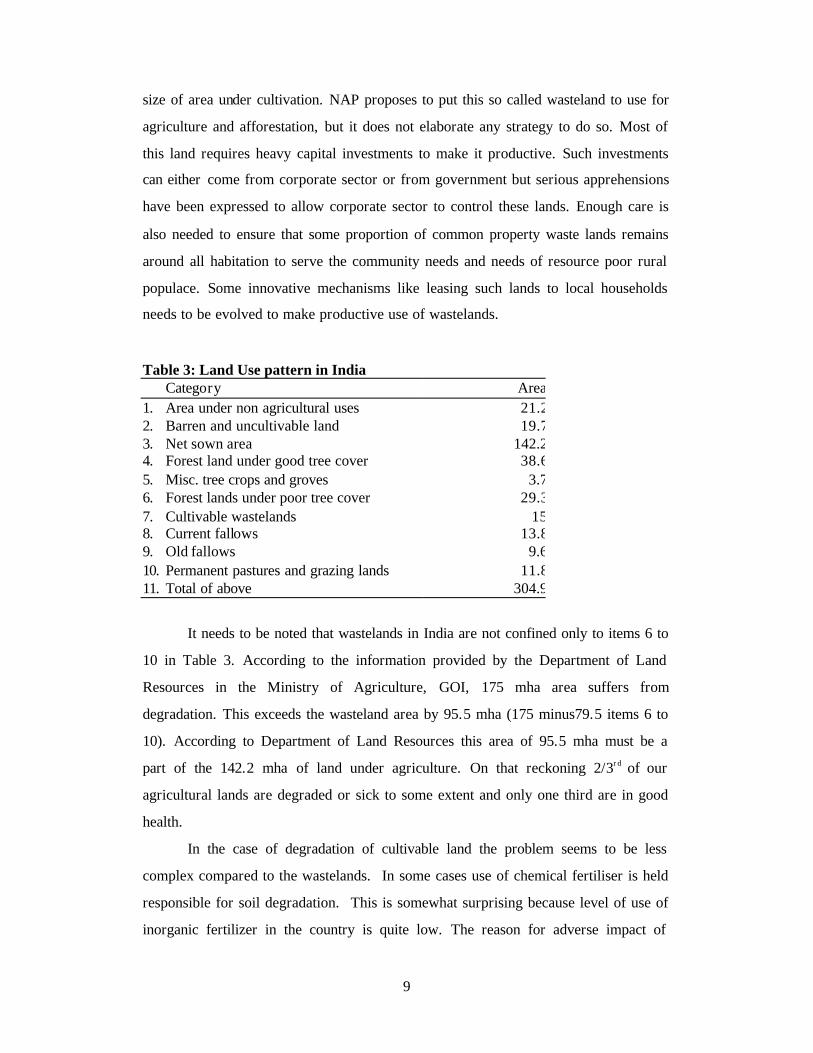
Status of land resources of India is presented in Table 3. Out of 304.9 million
hectare area for which land use information is available item 1 and 2 cannot be
considered for biotic production. This leaves 264 million hectare area that can be
considered for some sort of biotic production. Out of this 142.2 million hectare area
is under cultivation. The challenge relating to this land area is to maintain its fertility
status and protect against degradation due to soil erosion, chemicalisation,
waterlogging and salinisation and alike problems. In the remaining area, sum of items
6 to 10 can be taken to represent maximum wasteland area, assuming forest with poor
cover and permanent pasture and grazing grounds are more or less bereft of
vegetative cover. This comes to 79.5 million hectare which is more than half of the
9
size of area under cultivation. NAP proposes to put this so called wasteland to use for
agriculture and afforestation, but it does not elaborate any strategy to do so. Most of
this land requires heavy capital investments to make it productive. Such investments
can either come from corporate sector or from government but serious apprehensions
have been expressed to allow corporate sector to control these lands. Enough care is
also needed to ensure that some proportion of common property waste lands remains
around all habitation to serve the community needs and needs of resource poor rural
populace. Some innovative mechanisms like leasing such lands to local households
needs to be evolved to make productive use of wastelands.
Table 3: Land Use pattern in India Category Area1. Area under non agricultural uses 21.22. Barren and uncultivable land 19.73. Net sown area 142.24. Forest land under good tree cover 38.65. Misc. tree crops and groves 3.76. Forest lands under poor tree cover 29.37. Cultivable wastelands 158. Current fallows 13.89. Old fallows 9.610. Permanent pastures and grazing lands 11.811. Total of above 304.9
It needs to be noted that wastelands in India are not confined only to items 6 to
10 in Table 3. According to the information provided by the Department of Land
Resources in the Ministry of Agriculture, GOI, 175 mha area suffers from
degradation. This exceeds the wasteland area by 95.5 mha (175 minus79.5 items 6 to
10). According to Department of Land Resources this area of 95.5 mha must be a
part of the 142.2 mha of land under agriculture. On that reckoning 2/3rd of our
agricultural lands are degraded or sick to some extent and only one third are in good
health.
In the case of degradation of cultivable land the problem seems to be less
complex compared to the wastelands. In some cases use of chemical fertiliser is held
responsible for soil degradation. This is somewhat surprising because level of use of
inorganic fertilizer in the country is quite low. The reason for adverse impact of
10
chemical fertilizer in the country does not seem to be because of excessive use but
because of indiscriminate and non-judicious use. The problem can be tackled by
creating awareness among farmers about proper use of fertiliser, and appropriate
price structure for various formulations of fertiliser.
Another healthy way to take advantage of chemical fertilizer is by using them
alongwith organic fertilizer. There is lot of wastage and diversion of valuable animal
dung. Similarly, lots of agricultural bio mass go waste that can be decomposed to
produce organic fertilizer. In some parts of the country like North West India lakhs of
tonnes of rice and wheat straw is disposed off by burning. This not only causes
wastage of biomass but also causes lot of air pollution. Efficient and quick methods
for decomposing such biomass would increase availability of organic matter for
application in agricultural land.
NAP emphasises use of watershed approach to manage land resources.
Watershed approach is also proposed for rainfed agriculture. There are several success
stories related to success of watershed approach which includes some outstanding and
impressive experiences like those seen in Sukhomajri, Ralegaon Sidhi, Adgaon. There
are two aspects of this strategy. One, to protect the inhabitants of fragile eco systems
from acute distress caused by recurring drought. In such cases it is basically a survival
strategy (Hanumantha Rao 2000). It is important to distinguish this strategy from wider
strategy for development of agriculture in dryland or raifed area (Hanumantha Rao op.
cit.) as proposed in the National Agricultural Policy. The success of watershed
approach as a wider strategy for development of rainfed agriculture would require other
ingredients like technology, credit, market and roads, remunerative price environment.
Further, participation of local community is critical for success of watershed approach.
This requires change in capability and incentives of government bureaucracy in
organising communities to take advantage of watershed approac h (Kolavalli and Kerr
2002).
Water Resources
Water resources are becoming extremely scarce as demand for water for
agricultural, industrial and household uses is increasing rapidly. It is often quoted that
future wars would be fought over water and water would be the source of maximum
local conflicts. As India has has only 4 percent of world water resources and 16 percent

11
share in population (Iyer 2001) water scarcity is more acute in the country compared to
world average. The pressure on water resources is increasing with population growth,
urbanisation and improvement in living standard.
According to some scholars availability of ground water for irrigation would
emerge as a critical bottleneck for self sufficiency in foodgrain by the year 2020 as
demand for irrigation would exceed its availability by nearly 30 percent (Chopra and
Golder 2000). Similarly, National Commission for Integrated Water Resource
Development Plan has projected that requirement for irrigation water in India would
grow by more than 50 percent by 2050. Evidence is accumulating that water table in
several states is getting depleted at a fast rate. Based on various assessments it is
concluded that even after fully exploiting available water resources water supply can
match the dema nd only if there is a big improvement in efficiency of irrigation.
In the light of this scenario, National Agricultural Policy announces that
“rational utilization and conservation of the countrty’s abundant water resources willl
be promoted”. It is somewhat surprising that against all evidence of scarcity the NAP
feels water resources are abundant. It seems the importance and implications of
growing stress on water resources are not adequately recognised by the policy. This
requires efforts on several fronts. One, there is a need for creating awareness about the
value of water and its sustainable use. The policy should lead to concrete measures for
conservation of water resources through measures like rainwater harvesting and
groundwater recharging and ens ure judicious use of water. This would require first of
all placing value on water that reflects its opportunity cost. Second, improvement in
water use efficiency is crucial. According to one estimate a 10 percent improvement in
the efficiency of water use would be equivalent to 14 million hectare of gross irrigated
area (Saleth 1996) which is as large as the total irrigation potential created during
whole decade of 1990s. Achieving them would involve addressing property rights in
water, institutions and public policy (pricing etc.).
Plant and Animal Genetic Resources
NAP expresses concern about the narrowing and erosion of India’s plant and
genetic resources in the last few decades. Here two important concerns are missing.
One, NAP does not stress quality improvement in livestock through use of better
quality indigenous germplasm. There is strong fascination in the country for exotic
germplasm, particularly of cattle, at the cost of ignoring rich germplasm of domestic
breeds for improving productivity and quality of livestock. Experience of cross
12
breeding with exotic stocks of cattle is showing its own hazards in some areas where
infertility among cross bred is leading to hordes of stray cattle in the countryside. Two,
there is not enough awareness about breeding aspects in the country. Often same bull
continues to be used in one locality for lifetime which results in inbreeding and genetic
decline. There needs to be some guidelines with Panchayati Raj institutions for taking
care of healthy breeding practices.
4.3 Food and nutrition security
Food and nutritional security has remained central to India’s agricultural and
development policy since Independence. However, importance being accorded to food
and nutrition security has receded during 1990s because of two reasons. One, there was
accumulation of very large stock of grains in government stock after April 1998 which
had posed very serious problem of disposal in domestic and international market. This
has also caused serious burden on state exchequer. If India had not experienced very
severe drought during the year 2002, which caused 14 percent (30 million tonne)
decline in foodgrain production, then country was going to have tough time to clear
excessive stock of grains. Two, all kind of reduction in cereal consumption is being
wrongly attributed to phenomenon of dietary diversification which involves structural
shifts in demand from cereal to horticultural and livestock feed, without distinguishing
between diversification by choice or diversification under distress.
A closer look at the household consumption data and macro data on availability
of cereals for consumption reveals very disturbing trend in food and nutrition security
during 1990s. It is found that per capita energy and protein intake declined ve ry
sharply during 1990s and percent of population getting energy and protein below the
minimum threshold level has increased. This can be seen for rural cultivators and
labour households from the data presented in Table 4 taken from Chand et.al. 2003.
Similar evidence for total rural population is reported by Meenakshi and
Vishawanathan (2003).
Average per capita calorie intake at cultivator households in India during the
year 1983 was 2289 kcal, which increased to 2423 during 1987-88. By the year 1999-
00 calorie intake declined to 2277. Protein intake increased between 1983 and 1987-
88 and declined thereafter. Calorie intake at labour households also dropped sharply
during 1990s.There was a sharp reduction in percent of population consuming less
13
than minimum level of calorie suggested for a healthy person between 1983 and 1987-
88. The process got reversed during the economic reforms. Incidence of
malnourishment (protein deficiency) showed a sharp decline before reforms. With
the intensification of reforms with trade liberalization there was sharp increase in
malnourishment of farm population. According to the estimate for the year 1999-2000
more than 26 percent farm population and more than 45 percent of rural labour are
suffering from energy and protein deficiency.
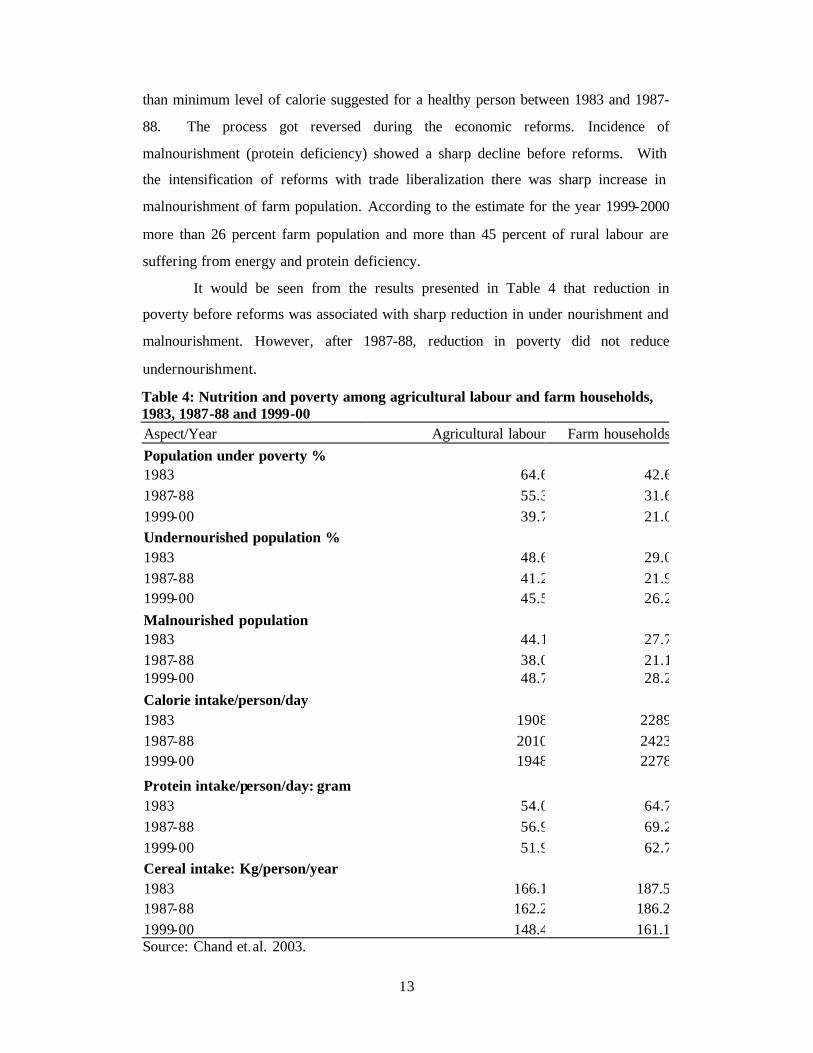
It would be seen from the results presented in Table 4 that reduction in
poverty before reforms was associated with sharp reduction in under nourishment and
malnourishment. However, after 1987-88, reduction in poverty did not reduce
undernourishment.
Table 4: Nutrition and poverty among agricultural labour and farm households, 1983, 1987-88 and 1999-00 Aspect/Year Agricultural labour Farm households
Population under poverty % 1983 64.6 42.61987-88 55.3 31.61999-00 39.7 21.0Undernourished population % 1983 48.6 29.01987-88 41.2 21.91999-00 45.5 26.2
Malnourished population 1983 44.1 27.71987-88 38.0 21.11999-00 48.7 28.2
Calorie intake/person/day 1983 1908 22891987-88 2010 24231999-00 1948 2278
Protein intake/person/day: gram 1983 54.0 64.71987-88 56.9 69.21999-00 51.9 62.7Cereal intake: Kg/person/year 1983 166.1 187.51987-88 162.2 186.21999-00 148.4 161.1Source: Chand et.al. 2003.

14
The patterns in poverty, nutrition and cereal intake show that poverty and
cereal intake plays important role in nutritional security of rural households in India.
These changes also show that high growth rate in output of fruits and vegetables and
livestock products in India during 1990s did not help Indian masses to improve
nutrition. As cereals constitute the major share in the food and the decade of 1990s
witnessed their reduced consumption the net result has been increase in proportion of
population deficit in calorie. Similarly, pulses are the main source of protein in India,
stagnation in their production is the cause of protein deficiency.
There is a strong feeling among some researchers that decline in cereal
consumption in India is the result of structural shifts in demand or dietary
diversification away from cereals caused by changes in life style, tastes and
preferences and it should not be seen as causing adverse effect on nutrition.
However, the decline in cereal consumption during 1990s was much higher than what
was accounted for by dietary diversification (Chand et.al. 2003). The rate of decline
in cereal consumption was small during 1970s and 1980s - the period during which
real prices of cereals were also falling. During 1990s rate of decline in cereal
consumption accelerated by about 70 percent. The reason for this acceleration in the
rate of decline in cereal consumption was sharp increase in real prices of cereals in
the same period. This price increase also led to accumulation of foodgrain in
government. These stocks did not result from growth in foodgrain production but
because of diversion of foodgrain from market and consumption as increase in their
real prices forced consumers to consume less foodgrains (Chand 2003a and Chand et.
al. 2003).
Cereals are the predominant source of calorie and protein for rural masses.
They are also the cheapest source of energy and protein in the country. Due to low
level of per capita income, rural masses are not in a capacity to compensate for
nutritional decline due to decline in cereals by increasing consumption of fruits and
vegetable, milk, meat etc to get adequate nutrition. Thus, prices of cereals play an
extremely important role in determining food and nutrition security of India’s
population. Any increase in real prices of cereals result in their reduced consumption,
which might help in building up grain surplus but is detrimental to household food
security. Main implication of these findings is that growth in food production should

15
not be accompanied by increase in per unit costs. Thus, sustaining nutrition and food
security require reduction in average cost of foodgrain production in real terms. This
necessitates raising food grain production by tapping unexploited potential rather than
offering higher and higher price incentives to already developed regions where
productivity levels are approaching plateau.
4.4 Generation and transfer of technology and input management
NAP calls for according very high priority to evolving location specific and
economically viable improved varieties of agricultural and horticultural crops, livestock
species and aquaculture. There is added emphasis on regionalisation of agricultural
research based on identified agro climatic zones. These priorities and emphasis are
important in a country like India, which has continental diversity and where technology
is the main driver for output growth. But this itself may not be enough. This is evident
from experience of technology generated during last three decades and its adoption at
farmers fields. National Agricultural Research System (NARS) has a very wide
network of research and technology network and there is hardly any agro ecological
pocket which does not have NARS institute or research station. Similarly, annual
reports of ICAR and State Agricultural Universities are replete with achievements in
terms of new varieties in almost all regions. But this has not helped in bridging huge
gap between what is attainable through these technologies and what is actually attained
at farmers field in most of the crops and states. This is evident from the information
presented in Table 5 on yield gap.
The yield gap was measured by taking the percent by which gap between
attainable yield and actual yield exceeds actual yield as under:
[(Attainable yield – Actual yield)/Actual yield] * 100
Attainable yield refers to the yield in national demonstration plot at farmers’
field when improved technology and management were used alongwith optimum level
of inputs. These yields at various sites were then compared with actual yield in the
region. In all the states there is large yield gap in all the crops for which yield gap
information was available. Even in agriculturally advance state like Punjab actual yield
of paddy can be raised by 87 percent using already existing improved technology. In
most of the crops technologies are available to double the actual yield. The purpose of
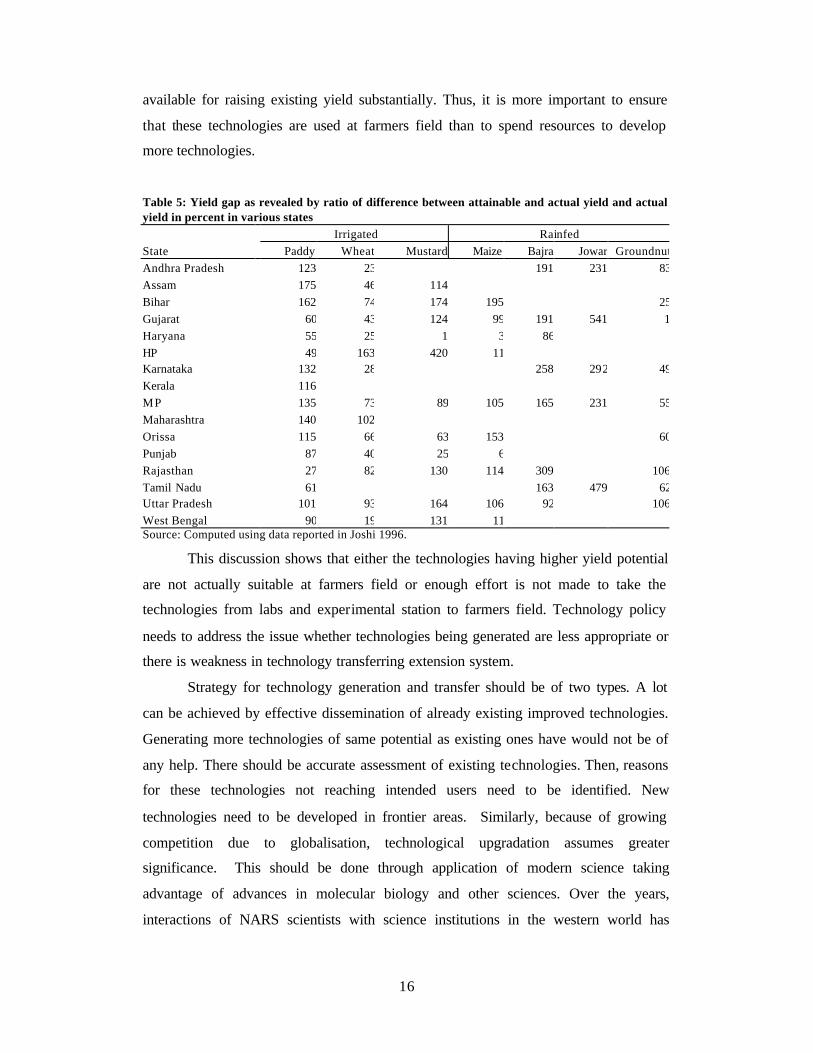
presenting yield gap (Table 5) is to demonstrate that improved technologies are already
16
available for raising existing yield substantially. Thus, it is more important to ensure
that these technologies are used at farmers field than to spend resources to develop
more technologies.
Table 5: Yield gap as revealed by ratio of difference between attainable and actual yield and actual yield in percent in various states
Irrigated Rainfed State Paddy Wheat Mustard Maize Bajra Jowar GroundnutAndhra Pradesh 123 23 191 231 83Assam 175 46 114 Bihar 162 74 174 195 25Gujarat 60 43 124 99 191 541 1Haryana 55 25 1 3 86 HP 49 163 420 11 Karnataka 132 28 258 292 49Kerala 116 MP 135 73 89 105 165 231 55Maharashtra 140 102 Orissa 115 66 63 153 60Punjab 87 40 25 6 Rajasthan 27 82 130 114 309 106Tamil Nadu 61 163 479 62Uttar Pradesh 101 93 164 106 92 106West Bengal 90 19 131 11 Source: Computed using data reported in Joshi 1996.
This discussion shows that either the technologies having higher yield potential
are not actually suitable at farmers field or enough effort is not made to take the
technologies from labs and experimental station to farmers field. Technology policy
needs to address the issue whether technologies being generated are less appropriate or
there is weakness in technology transferring extension system.
Strategy for technology generation and transfer should be of two types. A lot
can be achieved by effective dissemination of already existing improved technologies.
Generating more technologies of same potential as existing ones have would not be of
any help. There should be accurate assessment of existing technologies. Then, reasons
for these technologies not reaching intended users need to be identified. New
technologies need to be developed in frontier areas. Similarly, because of growing
competition due to globalisation, technological upgradation assumes greater
significance. This should be done through application of modern science taking
advantage of advances in molecular biology and other sciences. Over the years,
interactions of NARS scientists with science institutions in the western world has

17
weakened. This needs to be reversed to enable our scientists to benefit from advance
knowledge originating in western institutes.
Harnessing benefit of technology generation requires well developed system for
sales and distribution of seeds and plant propagation material. Till now public sector
dominates multiplication and supply of seed and plant propagation material but it is
highly inadequate to meet the emerging and growing needs and demand. There are also
reports of some decay in public system distribution of seeds etc. on account of several
reasons. The advantage of this is being taken by unscrupulous private trade. There is a
need to promote competition in seed sector by encouraging large scale private sector
participation in seeds business.
4.5 Incentive for agriculture
Agricultural policy repeats the policy concerns echoed in the beginning of green
revolution to provide favourable economic environment for promoting farm
investments through (1) removal of distortions in the incentives (2) improvement in
terms of trade with manufacturing (3) external and domestic market reforms. This is
most important area for policy actions. The document states only the intention but does
not elaborate how it would be achieved. Some reforms which government has initiated
in this area are (a) liberalisation of land lease market (b) proposal to change regulation
to promote contract farming and private markets.
Liberalisation of land lease market has been quite misunderstood in India. It is
taken to imply that it would lead to transfer of land from small and marginal farmers to
big farmers and also adversely affect interest of tenants. Reality is just opposite of this.
It is the small and marginal farmers who lease in and lease out much more than large
farmers. Also, the need for leasing in land is much greater at small and marginal
farmers to make their holdings viable. Land lease laws in the country are such that if
there is legal or documentary evidence of leased in land, the lessor can face problem in
evicting the lessee. Because of this, the landowners, who have land to lease out, either
do not lease out his/her land for fear of loosing control over it or tenancy is totally
concealed. Because of this, most of the small and marginal farmers are deprived of
raising the size of their operational holdings when they cant lease in. When they lease-
in in a concealed manner they cant get advantage of credit etc. Similarly, large number
of small and marginal farmers who do not find farming viable and find some other
attractive vocation, but do not want to sold their land, avoid renting out land. This way,
18
because of adverse legal implications of leased land market, small and farmers are
sufferers in several ways. The fears related to security of already existing tenants due to
liberalisation of land lease market are also misplaced as their interest can be
safeguarded by exempting them from the new regulation.
Government has already initiated measures to amend Agricultural Produce
Market Committee Acts. This is a step in the right direction. Government needs to
move fast on this. As it is very difficult to reach consensus on such reforms, the states
coming forward to undertake such reforms should be encouraged. Essential
commodities act has already been amended. Though restrictions on inter state
movement of farm produce have been removed much remains to be done to improve
efficiency of road transport.
Liberalisation of external trade requires policies to deal with volatile nature of
international prices. Impact of volatility on imports can be regulated through
appropriate tariffs but maintaining export poses serious problem. Price stabilisation
funds for exports can help to maintain export at the times of low international prices.
SPS issues would assume greater importance in future. India needs to formulate SPS
guidelines for all the products. It is better to segregate produce for domestic market and
export purposes as early as possible.
Incentive to agriculture should be provided by promoting competitive trade.
These incentives should be consistent with demand side factors. Due to lot of regional
variations, national level terms of trade often conceals regional story. There is a need to
monitor TOT at regional level and to ensure that agricultural incentives promote
regional equity.
4.6 Investments in agriculture
The purpose of investments in agriculture is to generate capital in the form of
infrastructure, improvement in quality of natural resources and assets, and creation of
productive assets for promoting long run growth and improving efficiency in
production and marketing. This investment in any sector comes from two sources viz.
public and private. While public investment is meant mainly to create infrastructure,
private investment is used mainly for assets formation and for improvement in quality
of existing assets. Traditional agriculture and agriculture in underdeveloped countries is
generally starved of investment resources because private capital is deterred by the risk
involved in agriculture (Schultz, 1964) and institutional investment has also been
19
meagre (Shonfield, 1960). Therefore, special efforts and attention are required to direct
and induce public and private investments in agriculture in underdeveloped countries.
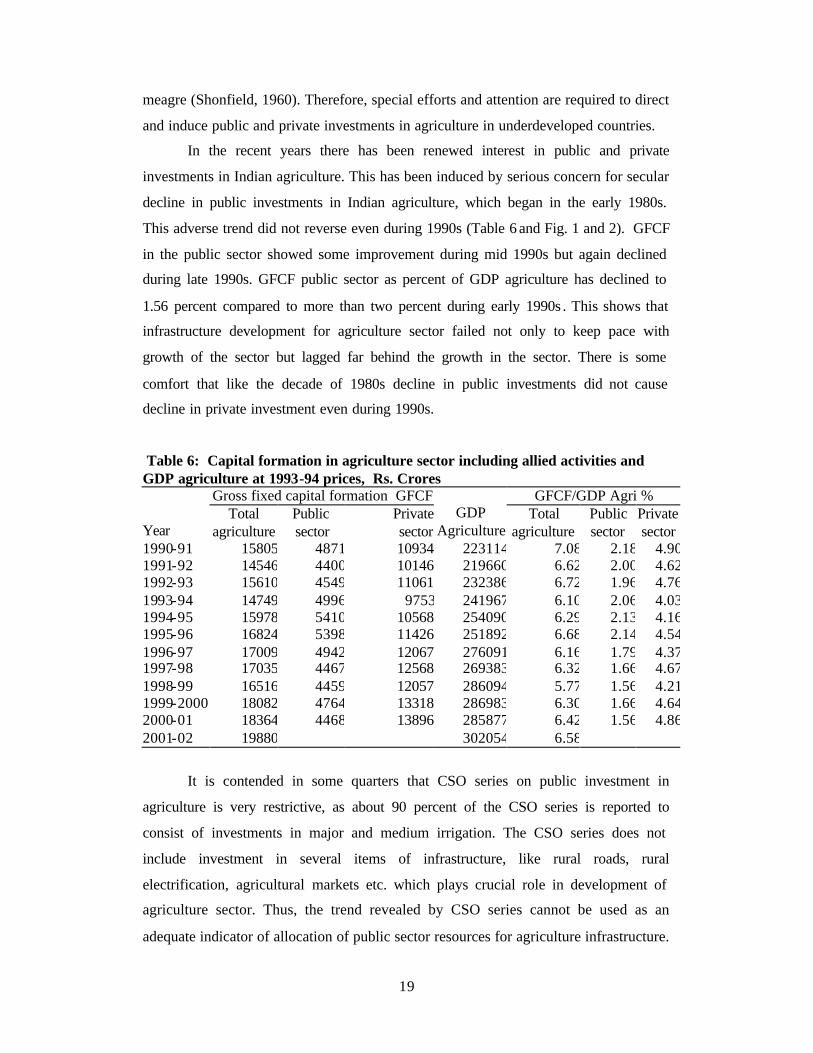
In the recent years there has been renewed interest in public and private
investments in Indian agriculture. This has been induced by serious concern for secular
decline in public investments in Indian agriculture, which began in the early 1980s.
This adverse trend did not reverse even during 1990s (Table 6 and Fig. 1 and 2). GFCF
in the public sector showed some improvement during mid 1990s but again declined
during late 1990s. GFCF public sector as percent of GDP agriculture has declined to
1.56 percent compared to more than two percent during early 1990s . This shows that
infrastructure development for agriculture sector failed not only to keep pace with
growth of the sector but lagged far behind the growth in the sector. There is some
comfort that like the decade of 1980s decline in public investments did not cause
decline in private investment even during 1990s.
Table 6: Capital formation in agriculture sector including allied activities and GDP agriculture at 1993-94 prices, Rs. Crores Gross fixed capital formation GFCF GFCF/GDP Agri %
Year Total
agriculture Public sector
Private sector
GDP Agriculture
Total agriculture
Public sector
Private sector
1990-91 15805 4871 10934 223114 7.08 2.18 4.901991-92 14546 4400 10146 219660 6.62 2.00 4.621992-93 15610 4549 11061 232386 6.72 1.96 4.761993-94 14749 4996 9753 241967 6.10 2.06 4.031994-95 15978 5410 10568 254090 6.29 2.13 4.161995-96 16824 5398 11426 251892 6.68 2.14 4.541996-97 17009 4942 12067 276091 6.16 1.79 4.371997-98 17035 4467 12568 269383 6.32 1.66 4.671998-99 16516 4459 12057 286094 5.77 1.56 4.211999-2000 18082 4764 13318 286983 6.30 1.66 4.642000-01 18364 4468 13896 285877 6.42 1.56 4.862001-02 19880 302054 6.58
It is contended in some quarters that CSO series on public investment in
agriculture is very restrictive, as about 90 percent of the CSO series is reported to
consist of investments in major and medium irrigation. The CSO series does not
include investment in several items of infrastructure, like rural roads, rural
electrification, agricultural markets etc. which plays crucial role in development of
agriculture sector. Thus, the trend revealed by CSO series cannot be used as an
adequate indicator of allocation of public sector resources for agriculture infrastructure.

20
However studies by individual researchers (Chand 2001) and by Committee set up
Government of India (GOI 2003) to examine this issue show that even when public
investments in various heads meant for agriculture like rural roads, electrification,
markets etc is taken into account there is a decline in importance accorded to
infrastructure development for agriculture sector.
National Agriculture Policy acknowledges this problem and proposes to
rechannelise available resources from support measures towards asset formation.
However, first three years since the announcement of NAP show that support measures
have reached higher proportion and public investment continues to decline or remain
stagnant.
4.7 Institutional structure
NAP advocates land reforms by focusing on consolidation of holdings,
redistribution of surplus/waste land among landless, tenancy reforms, development of
lease market and recognition of women’s rights in land. Other areas listed for policy
attention are private sector participation through contract farming, assured markets for
crops especially for oilseeds, cotton and horticultural crops, increased flow of
institutional credit, strengthening and revamping of cooperative credit system.
Out of these, some policy concerns like land lease market have already been
discussed at length in section 4.5 above. Land consolidation has assumed greater
importance due to large scale fragmentation of land holdings due to division of
inherited property and certain other factors. Division of land parcels into smaller pieces
scattered over space has become so complex that their consolidation by revenue
authority, as witnessed during first two decades of planned development in some states,
would not help much but would leave it free to revenue officials to use their authority
to show favours and disfavours. The best way to encourage land consolidation would
be to encourage mutual transfers of land by providing incentives like complete waiving
or nominal stamp duty in land transactions that lead to land consolidations.

21
GFCF in Agri: 1991 to 2002
0
5000
10000
15000
20000
25000
1990-91
1991-92
1992-93
1993-94
1994-95
1995-96
1996-97
1997-98
1998-99
1999-00
2000-01
2001-02
Year
Rs.
cro
re TotalPublicPrivate
GFCF as percent of GDP agri.: 1991-2002
0.00
1.00
2.00
3.00
4.00
5.00
6.00
7.00
8.00
1990
-91
1991
-92
1992
-93
1993
-94
1994
-95
1995
-96
1996
-97
1997
-98
1998
-99
1999
-00
2000
-01
2001
-02
GFC
F/G
DP
ratio Total
PublicPrivate

22
In the case of cooperatives, it has been emphasised time and again to reduce or
rationalise government control over these institutions. However, no concrete measures
have been taken so far. NAP focus mainly on credit delivery role of cooperatives,
whereas, these institutions have much bigger role to play in Indian agriculture in terms
of organising small and marginal farmers in activities relating to production, marketing
and processing.
There is lot of debate and pressure to consider institutional reforms for
sustainable agricultural development and poverty alleviation. It is being proposed to
involve people in management of infrastructure like irrigation and to go far
participatory management of common pool resources like water, forest and common-
lands. Strangely, NAP is silent on these important institutional issues.
A large number of agricultural holdings are managed by women farmers.
Empowering these women through right in land has been a very difficult proposition as
it involves changes in legislation and in most cases consent of other family members
particularly male members. A much easier way out to improve women’s access to
technology is to ensure that land records show cultivation under women’s name where
they actually manage the farm. This would avoid complications involved in transferring
property rights but give recognition to women in terms of title to cultivation. As the
information about crop cultivated on each field and name of the cultivator is recorded
each season it is very easy to recognise women’s status as farmer. This can be achieved
by instructing revenue officials to follow factual position regarding cultivation title.
Subsequently, this should be supported by recognition of wome n as a farmer for
availing all facilities like credit etc. Similarly, while undertaking distribution of surplus
land/wasteland the title should recognise rights of male as well as female.
4.7 Risk management and management reforms
Price fluctuation and natural calamities are recognised as main factor for
imparting instability to condition of farmers. NAP suggests Agriculture Insurance
Scheme covering all farmers and all crops throughout the country with built in
provision for insulating farmers from financial distress. Other measures suggested
under this are (1) enhancing flood proofing and drought proofing through (2) ensuring
remunerative prices through announcement of MSP and (3) future trading in agriculture
products.

23
Risk proofing in agriculture through insurance is a very complicated process.
Covering all crops and all farmers through this seems to be gigantic, rather ambitious
task. Technological and infrastructural solutions are more appropriate in the Indian
circumstances.
Announcement of MSP in itself does not ensure that farmers get remunerative
price or price above the ceiling level. Obviously, ensuring that farmers do not receive
price below MSP requires some mechanism to buy produce if market price happens to
be lower than MSP. This mechanism exists only in a few states and for a few crops.
Because of this, some regions have benefited too much where government procure
produce and some got nothing for same crops, from system of MSP (Chand 2003b). It
is also not feasible to guarantee MSP by making procurement of produce by official
agencies in the event of fall in market prices below MSP everywhere and for all the
crops. Therefore, alternatives like deficiency price payment, as suggested by some
studies (Chand 2003a) needs to be used to make MSP effective over large number of
crops and over large region.
Future trading is being allowed in more and more agricultural products in India
with a view to minimize price fluctuations and for hedging price risk. It is difficult to
conjecture about the impact of future trading in reducing price risk for farmers because
basis of future trading itself is price fluctuation. Second, success of future trading
would require that government intervention does not influence normal course of price.
Thus, future trading and government intervention in influencing behaviour of prices
through MSP and issue prices would not go together. Therefore some clear policy is
needed on price intervention and future trading.
Under the management reforms, proposals like moving away from schematic
approach to macro management approach and working out effective partnership
between the Centre and States are worth implementing.
5. FURTHER SUGGESTIONS
The document on National Agricultural Policy released by Government of India
in July 2003 contains set of policy intentions of government. In order to implement
those intentions a concrete and time bound action plan was needed but that is missing.
The document is quite comprehensive in expressing what ought to be done in
agriculture, This is a first step in giving policy direction. The subsequent step is, how
and when policy goals and objectives would be achieved. In most of the cases the NAP
24
is silent on this, nor, there is any follow up document on this. This is the reason that in
more than three and half years after release of NAP no serious action is initiated on
most of the aspects. It is highly desirable to prepare action plans at the Centre and at the
State level in quantitative terms to implement the new policy agenda in a time bound
framework. For instance, to achieve 4 percent annual growth rate in agriculture certain
planning and strategy has to be there on how much growth in each crop/enterprise in
various states is visualised. How much growth this would require in inputs, irrigation,
credit etc. There is no such follow up action plan and it is assumed that setting goals
with change in overall policy environment would automatically help in achieving the
goals enshrined in new policy. Besides action plan on quantifiable goals, a time
schedule for change in qualitative policy aspects like changes in regulations is also
needed.
Achieving the goal of high growth (more than 4 percent) through efficient use
of resources and promoting sustainability and equity would require area specific
strategies. Past experience shows that this can be achieved by promoting area specific
specialisation taking into account the groundwater status, soil health and other micro
characteristics. This often results in diversification at country level. The advantages of
specialisation pockets are (i) it is useful in harvesting advantages of scale economy and
(ii) it is easy and less costly to develop infrastructure to boost one or few commodities,
rather than many commodities.
Raising productivity in already agriculturally advanced regions would involve
more cost in terms of inputs compared to underdeveloped regions as the developed
regions are at a higher level on the production frontier. Since the domestic supply
would be facing competition from imports, the emphasis should be on increase in
productivity in a cost effective manner. This, in turn, require paradigm shift from
output growth or maximising production to efficient growth. The twin goal of
increase in productivity and efficiency can be achieved by harnes sing potential of
underdeveloped regions and through development of specialisation pockets. The focus
must shift to area specific enterprises as has been the case of dairying in Gujarat,
rice-wheat in Punjab, apple in sub-temperate West Himalayan region, grapes in Nasik
region of Maharashtra, mangoes in Rayalseema region of Andhra Pradesh.
Large scope exists for raising productivity of most of the crops by ensuring that
improved technologies already developed in various states are adopted by farmers.
25
Efforts in technology generation go waste if it is not disseminated to end users. This
requires rigorous efforts on extension front. NAP should evolve ways and means to
strengthen existing extension mechanism and involve NGOs, panchayats and private
sector in extension activities. Beside technology, shift in crop pattern from low value to
high value offers vast scope for output growth.
Irrigation is vital resource for raising agricultural output but strain on water
resources is growing. This requires adoption of improved irrigation technologies that
improves efficiency of water use. New policy should provide effective incentive for
adoption of drip, sprinklers and other water efficient technologies.
NAP should give due importance to people’s participation in management of
natural resources and in organization of production and marketing activities.
Competitive global liberalisation has thrown new and formidable challenge to
compete with international technologies. Facing this challenge would require vigorous
efforts in domestic R&D. Some countries have very effectively applied tools of
biotechnology to raise yield, reduce cost of production, and improve quality. India
needs to learn from the experience of such countries and should encourage new yield
enhancing and cost reducing technologies without getting bogged down in the debates
on transgenics and genetically modified products.
There is no mention of Organic farming in NAP. Organic farming offers an
alternative method pf production that can be suitably exploited to benefit some segment
of farmers.
There are frequent reports of pesticides and chemical residues beyond safe
limits in various foods. The main reason for this is indiscriminate use of agricultural
chemicals. Farmers need to be educated about proper use of various agro-chemicals.

26
REFERENCES Chand Ramesh (2001). Emerging Trends and Issues in Public and private Investments in Indian Agriculture: a Statewise Analysis, Indian Jn. of Agril. Economics, vol. 56 No.2, 161-184, April – June 2001. Chand Ramesh (2003a). Government Intervention in Foodgrain Markets in the Changing Context, Policy Paper 19, National Centre for Agricultural Economics and Policy Research, New Delhi. Chand Ramesh (2003b). Minimum Support Price in Agriculture: Changing Requirements, Economic and Political Weekly, V.38 (29):3027-3028, July 19, 2003. Chand Ramesh, P. Kumar and Sapna Sinha (2003). Impact of Agricultural Trade and Related Reforms on Domestic Food Security in India, Report of the study done for FAO Rome, Institute of Economic Growth, Delhi, November. Chopra Kanchan and Bishawanath Goldar (2000). Sustainable Development Framework for India: The Case of Water Resources (Mimeo), Institute of Economic Growth, Delhi. Dhawan B.D. (1994). Irrigation in India’s Agricultural Development, p. 83, Commonwealth Publishers, New Delhi. Government of India (2003), Report of the Committee on Capital Formation in Agriculture, Directorate of Economics and Statistics, Ministry of Agriculture, New Delhi. Hanumantha Rao CH (2000). Watershed Development in India: Recent Experience and Emerging Issues, Economic and Political Weekly, Vol. 35 No. 45, 3943-3948, November 4. Iyer Ramasamy R. (2001). Water: Charting a Course for Future -I, Economic and Political Weekly, Vol. 36 No. 13, 1115 – 1122, March 31. Joshi S. N. (1996). Yield Gap Analysis in Agro –Climatic Sub Regions, in D.N. Basu and S. P. Kashyap (Ed.) Agro Climatic Regional Planning in India, Vol. II, Themes and Case Studies , Concept Publishing Company, New Delhi. Kolavalli Shashi L. and John Kerr (2002). Mainstreaming participatory Watershed Development, Economic and Political Weekly, Vol. 37 No. 3, 225-242, January 19. Meenakshi J. V. and Brinda Vishwanathan (2003). Calorie Deprivation in Rural India, 1983 – 1999/2000, Economic and Political Weekly , January 25, 2003 pp. 369 – 375. Mishra S. N. and Ramesh Chand (1995). Private and Public Capital Formation in Indian agriculture: Comments on Complementarity Hypothesis and Others, Economic and Political Weekly , V. 30(24): A-64 - A-79, June 24, 1995.
27
Radhakrishna R (1993). Indian Agriculture: Growth, Employment and Equity, in Tapas Majumdar (ed) Nature, Man and the Indian Economy, Oxford University Press, Delhi. Rao V.M (1996). Agricultural Development with a Human Face, Economic and Political Weekly, 31(26): A-50 – A-62, June 29. Saleth R. M. (1996). Water Institutions in India: Economics, Law and Policy, Commonwealth Publisher, New Delhi. Schultz T. W. (1964). Transforming Traditional Agriculture, Yale University Press, New Haven, CT. Shonfield A. (1960). Attack on World Poverty, Random House, New York, 1960. Vaidyanathan A. (1996). Agricultural Development: Imperatives of Institutional Reforms, Economic and Political Weekly, 31(35/37): 2451-2458, September 1996.