india infoline group
TRANSCRIPT
IIFL Group’s Quarterly Results for Q1FY14
July 23, 2013
India Infoline Group
I: IIFL Group Performance review Q1FY14
II: IIFL (NBFC) Performance review
Annexure I: Corporate overview
III: IIFL Other Businesses review
Annexure II: Industry update
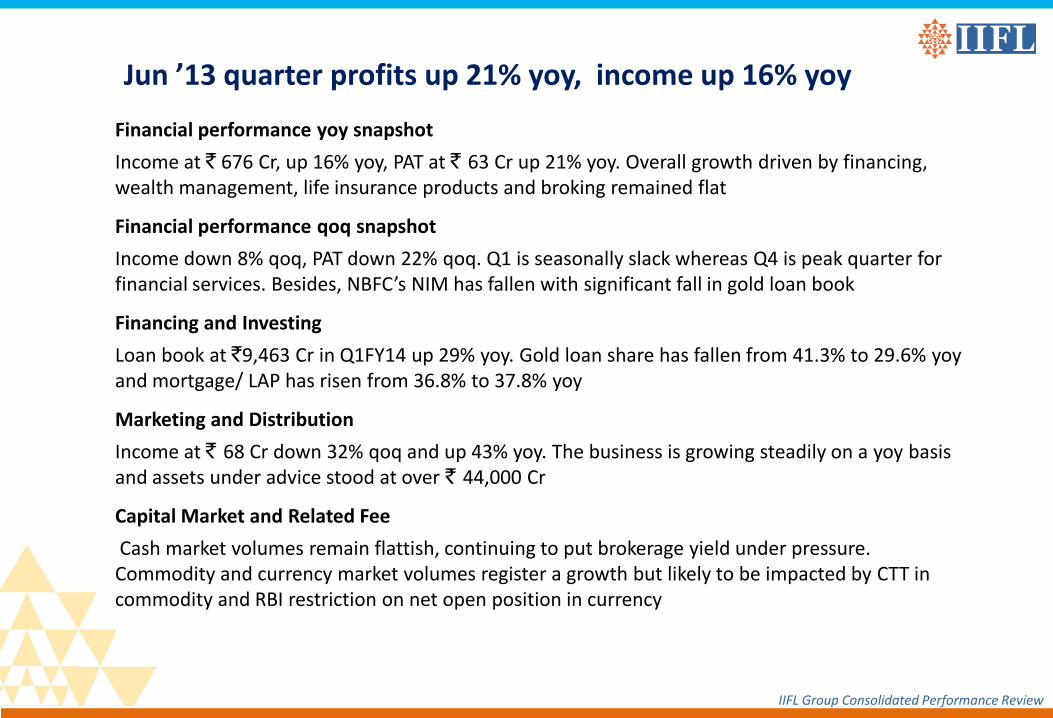
Financial performance yoy snapshot
Income at ` 676 Cr, up 16% yoy, PAT at ` 63 Cr up 21% yoy. Overall growth driven by financing, wealth management, life insurance products and broking remained flat
Financial performance qoq snapshot
Income down 8% qoq, PAT down 22% qoq. Q1 is seasonally slack whereas Q4 is peak quarter for financial services. Besides, NBFC’s NIM has fallen with significant fall in gold loan book
Financing and Investing
Loan book at `9,463 Cr in Q1FY14 up 29% yoy. Gold loan share has fallen from 41.3% to 29.6% yoy and mortgage/ LAP has risen from 36.8% to 37.8% yoy
Marketing and Distribution
Income at ` 68 Cr down 32% qoq and up 43% yoy. The business is growing steadily on a yoy basis and assets under advice stood at over ` 44,000 Cr
Capital Market and Related Fee
Cash market volumes remain flattish, continuing to put brokerage yield under pressure. Commodity and currency market volumes register a growth but likely to be impacted by CTT in commodity and RBI restriction on net open position in currency
Jun ’13 quarter profits up 21% yoy, income up 16% yoy
IIFL Group Consolidated Performance Review
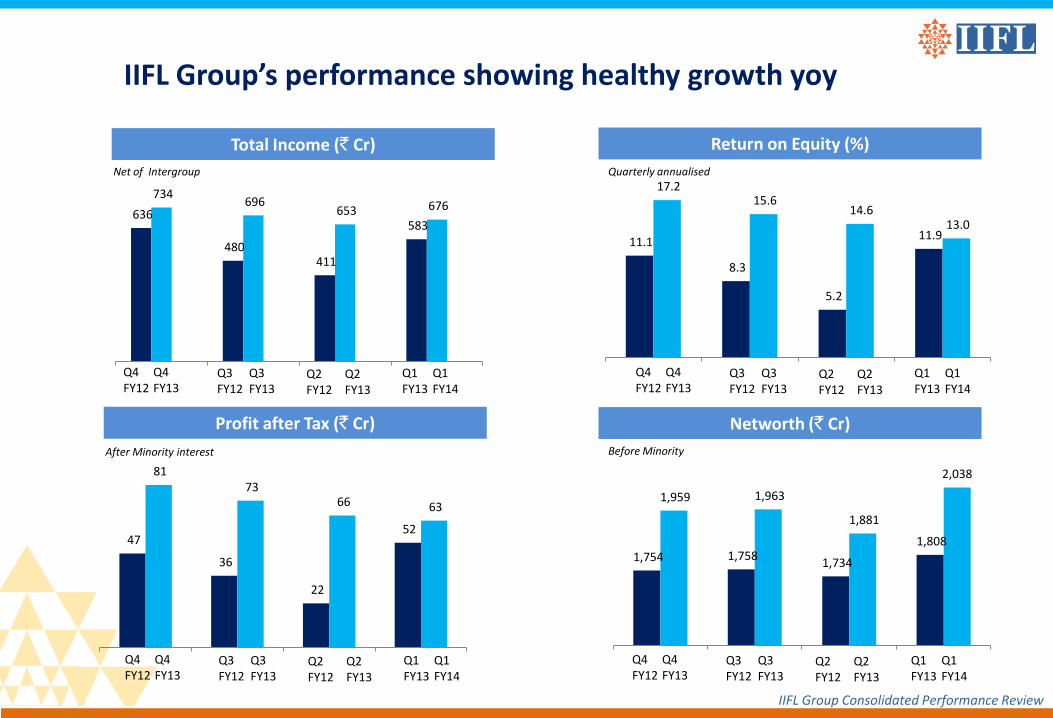
IIFL Group’s performance showing healthy growth yoy
Return on Equity (%)
Networth (` Cr)
IIFL Group Consolidated Performance Review
Before Minority
Quarterly annualised
After Minority interest
Profit after Tax (` Cr)
Total Income (` Cr)
Net of Intergroup
636
480 411
583
734 696
653 676
Q4 FY12
Q4 FY13
Q3 FY12
Q3 FY13
Q2 FY12
Q2 FY13
Q1 FY13
Q1 FY14
47
36
22
52
81 73
66 63
Q4 FY12
Q4 FY13
Q3 FY12
Q3 FY13
Q2 FY12
Q2 FY13
Q1 FY13
Q1 FY14
1,754 1,758 1,734
1,808
1,959 1,963
1,881
2,038
Q4 FY12
Q4 FY13
Q3 FY12
Q3 FY13
Q2 FY12
Q2 FY13
Q1 FY13
Q1 FY14
11.1
8.3
5.2
11.9
17.2 15.6
14.6 13.0
Q4 FY12
Q4 FY13
Q3 FY12
Q3 FY13
Q2 FY12
Q2 FY13
Q1 FY13
Q1 FY14
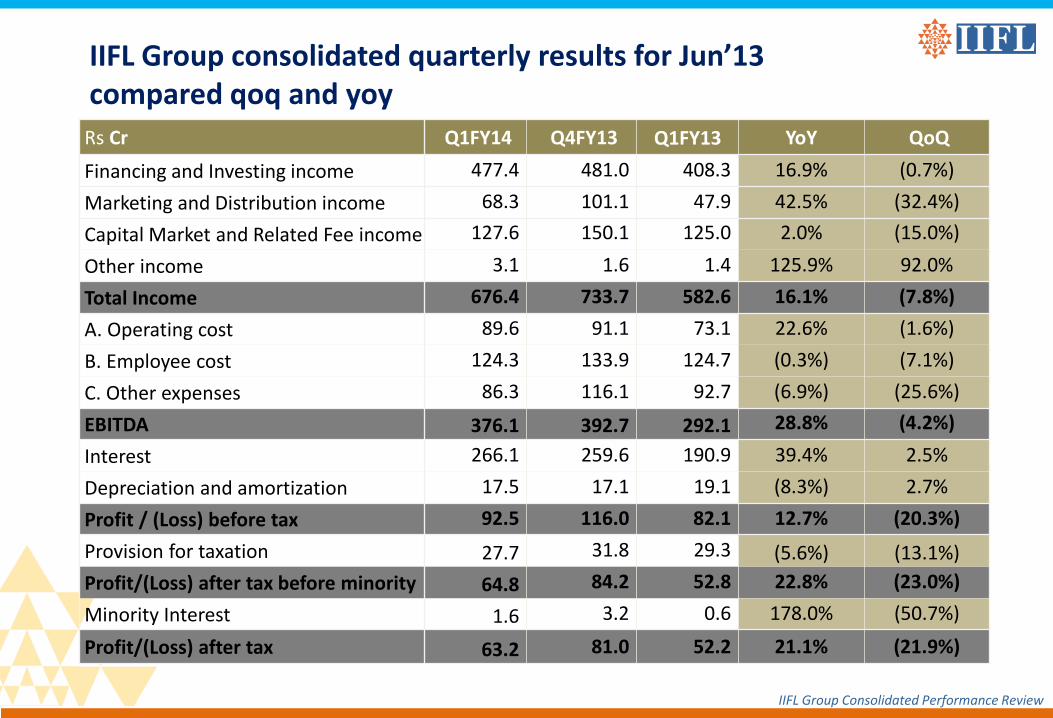
Rs Cr Q1FY14 Q4FY13 Q1FY13 YoY QoQ
Financing and Investing income 477.4 481.0 408.3 16.9% (0.7%)
Marketing and Distribution income 68.3 101.1 47.9 42.5% (32.4%)
Capital Market and Related Fee income 127.6 150.1 125.0 2.0% (15.0%)
Other income 3.1 1.6 1.4 125.9% 92.0%
Total Income 676.4 733.7 582.6 16.1% (7.8%)
A. Operating cost 89.6 91.1 73.1 22.6% (1.6%)
B. Employee cost 124.3 133.9 124.7 (0.3%) (7.1%)
C. Other expenses 86.3 116.1 92.7 (6.9%) (25.6%)
EBITDA 376.1 392.7 292.1 28.8% (4.2%)
Interest 266.1 259.6 190.9 39.4% 2.5%
Depreciation and amortization 17.5 17.1 19.1 (8.3%) 2.7%
Profit / (Loss) before tax 92.5 116.0 82.1 12.7% (20.3%)
Provision for taxation 27.7 31.8 29.3 (5.6%) (13.1%)
Profit/(Loss) after tax before minority 64.8 84.2 52.8 22.8% (23.0%)
Minority Interest 1.6 3.2 0.6 178.0% (50.7%)
Profit/(Loss) after tax 63.2 81.0 52.2 21.1% (21.9%)
IIFL Group consolidated quarterly results for Jun’13 compared qoq and yoy
IIFL Group Consolidated Performance Review
I: IIFL Group Performance review Q1FY14
II: IIFL (NBFC) Performance review
Annexure I: Corporate overview
III: IIFL Other Businesses review
Annexure II: Industry update
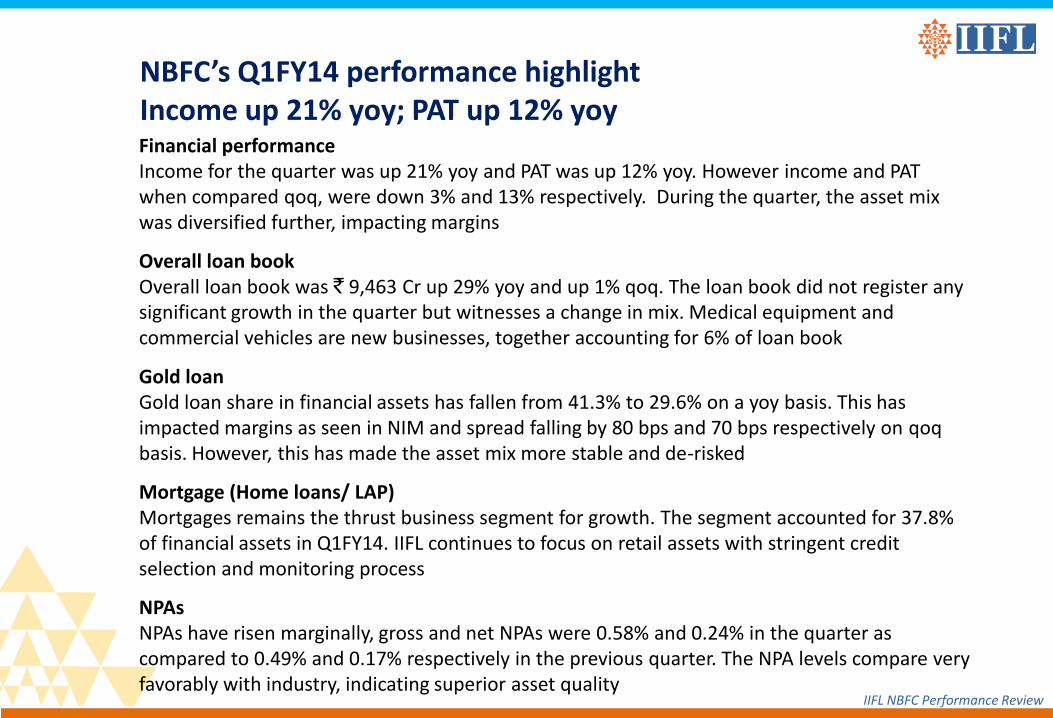
Financial performance Income for the quarter was up 21% yoy and PAT was up 12% yoy. However income and PAT when compared qoq, were down 3% and 13% respectively. During the quarter, the asset mix was diversified further, impacting margins
Overall loan book Overall loan book was ` 9,463 Cr up 29% yoy and up 1% qoq. The loan book did not register any significant growth in the quarter but witnesses a change in mix. Medical equipment and commercial vehicles are new businesses, together accounting for 6% of loan book
Gold loan Gold loan share in financial assets has fallen from 41.3% to 29.6% on a yoy basis. This has impacted margins as seen in NIM and spread falling by 80 bps and 70 bps respectively on qoq basis. However, this has made the asset mix more stable and de-risked
Mortgage (Home loans/ LAP) Mortgages remains the thrust business segment for growth. The segment accounted for 37.8% of financial assets in Q1FY14. IIFL continues to focus on retail assets with stringent credit selection and monitoring process
NPAs NPAs have risen marginally, gross and net NPAs were 0.58% and 0.24% in the quarter as compared to 0.49% and 0.17% respectively in the previous quarter. The NPA levels compare very favorably with industry, indicating superior asset quality
IIFL NBFC Performance Review
NBFC’s Q1FY14 performance highlight Income up 21% yoy; PAT up 12% yoy
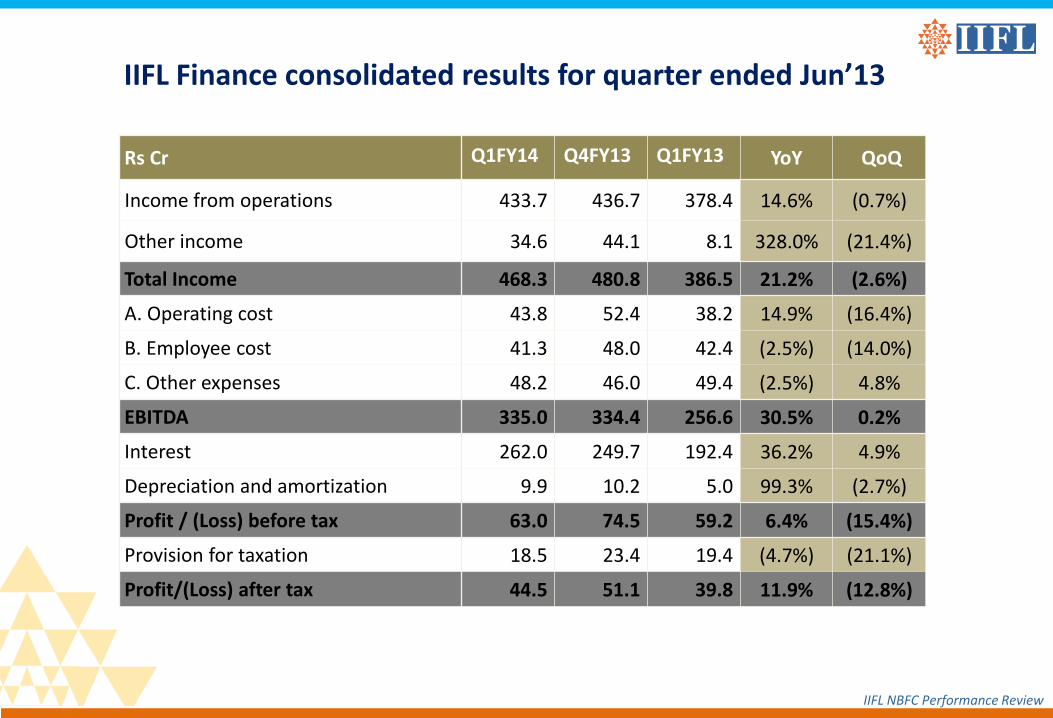
IIFL Finance consolidated results for quarter ended Jun’13
Rs Cr Q1FY14 Q4FY13 Q1FY13 YoY QoQ
Income from operations 433.7 436.7 378.4 14.6% (0.7%)
Other income 34.6 44.1 8.1 328.0% (21.4%)
Total Income 468.3 480.8 386.5 21.2% (2.6%)
A. Operating cost 43.8 52.4 38.2 14.9% (16.4%)
B. Employee cost 41.3 48.0 42.4 (2.5%) (14.0%)
C. Other expenses 48.2 46.0 49.4 (2.5%) 4.8%
EBITDA 335.0 334.4 256.6 30.5% 0.2%
Interest 262.0 249.7 192.4 36.2% 4.9%
Depreciation and amortization 9.9 10.2 5.0 99.3% (2.7%)
Profit / (Loss) before tax 63.0 74.5 59.2 6.4% (15.4%)
Provision for taxation 18.5 23.4 19.4 (4.7%) (21.1%)
Profit/(Loss) after tax 44.5 51.1 39.8 11.9% (12.8%)
IIFL NBFC Performance Review
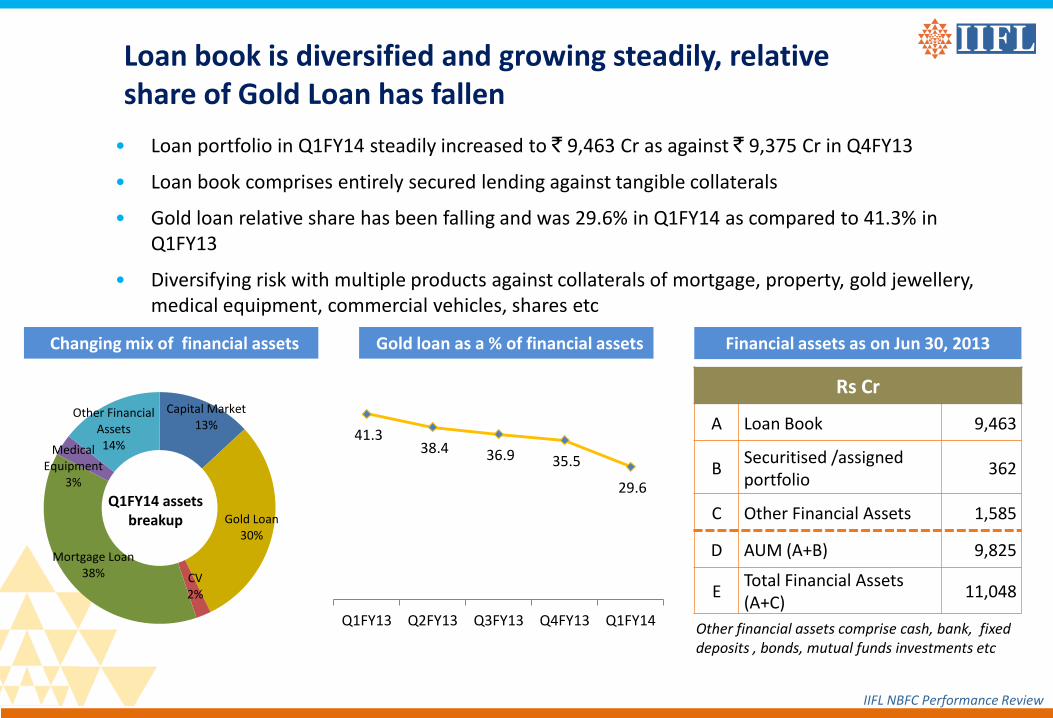
• Loan portfolio in Q1FY14 steadily increased to ` 9,463 Cr as against ` 9,375 Cr in Q4FY13
• Loan book comprises entirely secured lending against tangible collaterals
• Gold loan relative share has been falling and was 29.6% in Q1FY14 as compared to 41.3% in Q1FY13
• Diversifying risk with multiple products against collaterals of mortgage, property, gold jewellery, medical equipment, commercial vehicles, shares etc
Loan book is diversified and growing steadily, relative share of Gold Loan has fallen
IIFL NBFC Performance Review
Changing mix of financial assets Financial assets as on Jun 30, 2013
Rs Cr
A Loan Book 9,463
B Securitised /assigned portfolio
362
C Other Financial Assets 1,585
D AUM (A+B) 9,825
E Total Financial Assets (A+C)
11,048
Other financial assets comprise cash, bank, fixed deposits , bonds, mutual funds investments etc
Gold loan as a % of financial assets
Q1FY14 assets breakup
41.3 38.4 36.9 35.5
29.6
Q1FY13 Q2FY13 Q3FY13 Q4FY13 Q1FY14
Capital Market 13%
Gold Loan 30%
CV 2%
Mortgage Loan 38%
Medical Equipment
3%
Other Financial Assets 14%
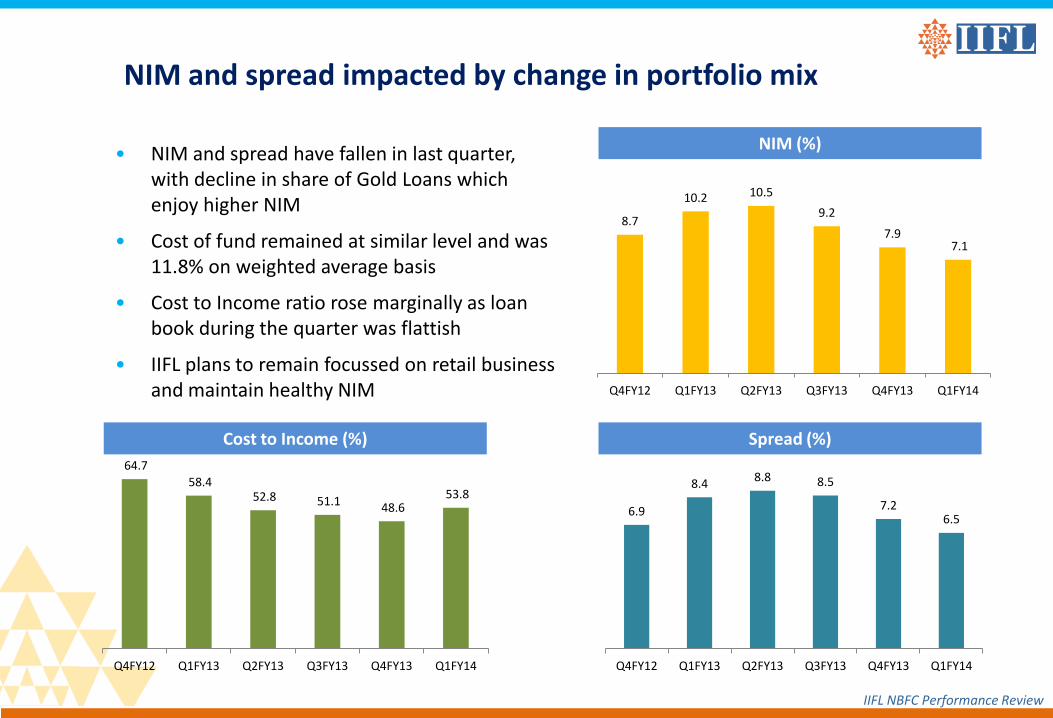
• NIM and spread have fallen in last quarter, with decline in share of Gold Loans which enjoy higher NIM
• Cost of fund remained at similar level and was 11.8% on weighted average basis
• Cost to Income ratio rose marginally as loan book during the quarter was flattish
• IIFL plans to remain focussed on retail business and maintain healthy NIM
NIM and spread impacted by change in portfolio mix
NIM (%)
Spread (%)
IIFL NBFC Performance Review
6.9
8.4 8.8 8.5
7.2 6.5
Q4FY12 Q1FY13 Q2FY13 Q3FY13 Q4FY13 Q1FY14
8.7
10.2 10.5
9.2
7.9 7.1
Q4FY12 Q1FY13 Q2FY13 Q3FY13 Q4FY13 Q1FY14
Cost to Income (%)
64.7
58.4 52.8 51.1 48.6
53.8
Q4FY12 Q1FY13 Q2FY13 Q3FY13 Q4FY13 Q1FY14
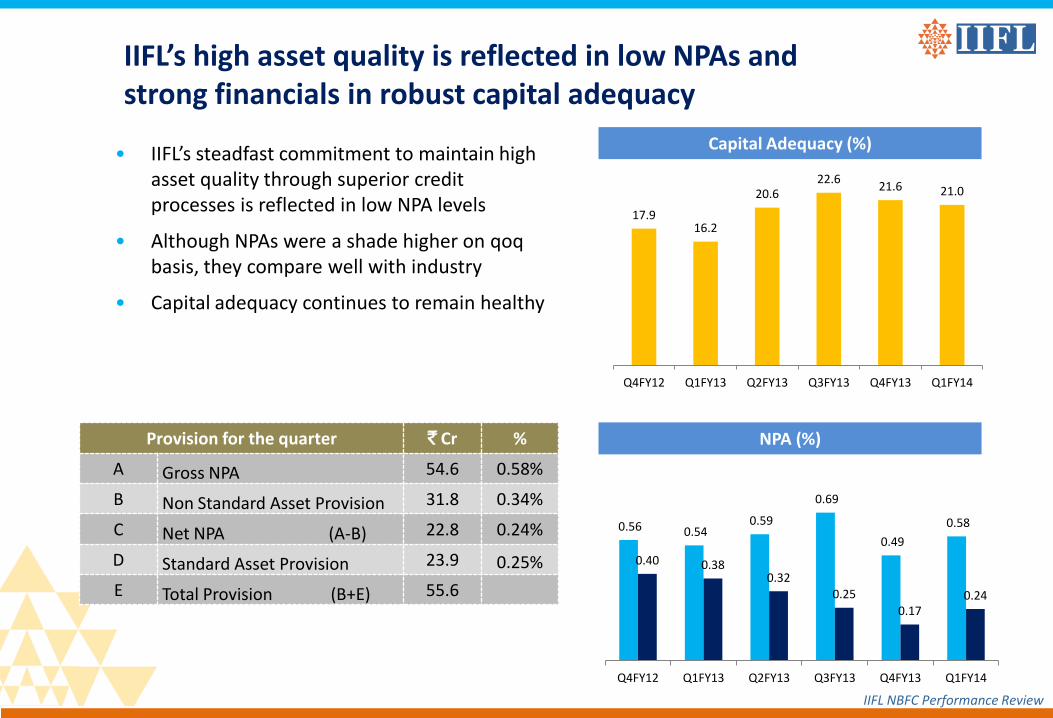
• IIFL’s steadfast commitment to maintain high asset quality through superior credit processes is reflected in low NPA levels
• Although NPAs were a shade higher on qoq basis, they compare well with industry
• Capital adequacy continues to remain healthy
IIFL’s high asset quality is reflected in low NPAs and strong financials in robust capital adequacy
Capital Adequacy (%)
NPA (%)
IIFL NBFC Performance Review
Provision for the quarter ` Cr %
A Gross NPA 54.6 0.58%
B Non Standard Asset Provision 31.8 0.34%
C Net NPA (A-B) 22.8 0.24%
D Standard Asset Provision 23.9 0.25%
E Total Provision (B+E) 55.6
17.9 16.2
20.6 22.6
21.6 21.0
Q4FY12 Q1FY13 Q2FY13 Q3FY13 Q4FY13 Q1FY14
0.56 0.54 0.59
0.69
0.49
0.58
0.40 0.38 0.32
0.25
0.17 0.24
Q4FY12 Q1FY13 Q2FY13 Q3FY13 Q4FY13 Q1FY14
12
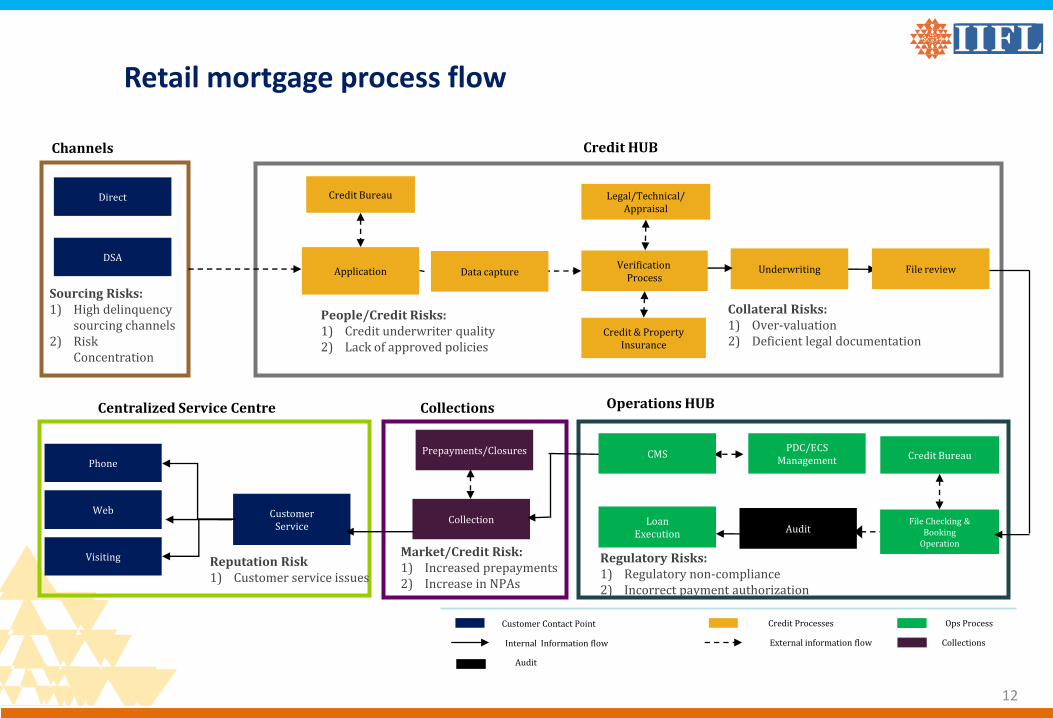
Customer Service
Collection
Prepayments/Closures Phone
Web
Visiting
Credit Bureau
Legal/Technical/ Appraisal
Credit & Property Insurance
Channels
Direct
DSA
Application
Credit Bureau
Credit HUB
Centralized Service Centre Collections
PDC/ECS Management
File Checking & Booking
Operation
Loan Execution
Data capture Underwriting
Operations HUB
Audit
CMS
Internal Information flow External information flow
Customer Contact Point Credit Processes Ops Process
Collections
Audit
Sourcing Risks: 1) High delinquency
sourcing channels 2) Risk
Concentration
Collateral Risks: 1) Over-valuation 2) Deficient legal documentation
Regulatory Risks: 1) Regulatory non-compliance 2) Incorrect payment authorization
Market/Credit Risk: 1) Increased prepayments 2) Increase in NPAs
Reputation Risk 1) Customer service issues
Verification Process
File review
People/Credit Risks: 1) Credit underwriter quality 2) Lack of approved policies
Retail mortgage process flow
13
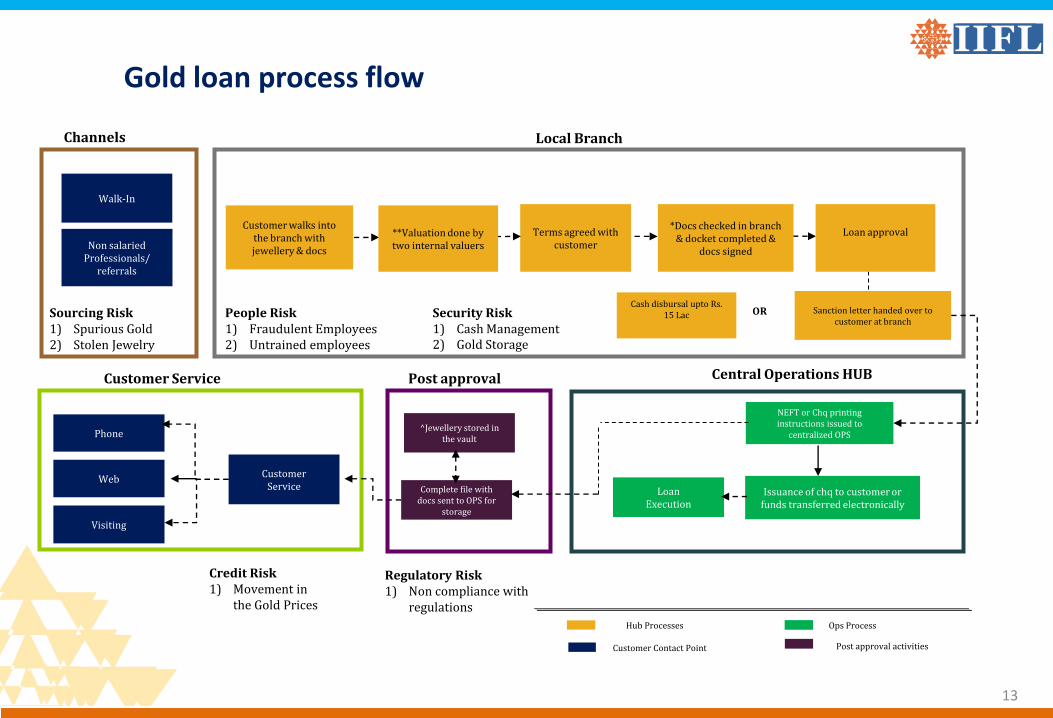
Customer Service Complete file with
docs sent to OPS for storage
^Jewellery stored in the vault
Phone
Web
Visiting
NEFT or Chq printing instructions issued to
centralized OPS
Customer Service Post approval
Issuance of chq to customer or funds transferred electronically
Loan Execution
Central Operations HUB
Cash disbursal upto Rs. 15 Lac
Local Branch
Terms agreed with customer
Channels
Walk-In
Non salaried Professionals/
referrals
Sanction letter handed over to customer at branch
Customer walks into the branch with jewellery & docs
**Valuation done by two internal valuers
*Docs checked in branch & docket completed &
docs signed
Loan approval
OR
Customer Contact Point
Hub Processes Ops Process
Post approval activities
Sourcing Risk 1) Spurious Gold 2) Stolen Jewelry
People Risk 1) Fraudulent Employees 2) Untrained employees
Security Risk 1) Cash Management 2) Gold Storage
Credit Risk 1) Movement in
the Gold Prices
Regulatory Risk 1) Non compliance with
regulations
Gold loan process flow
14
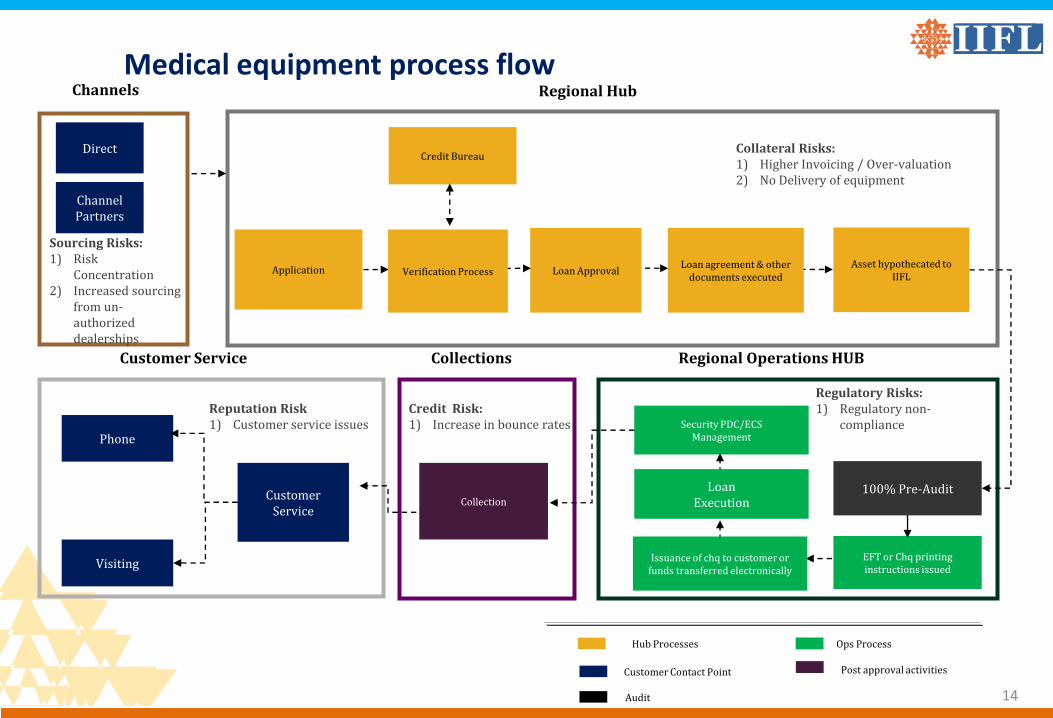
Customer Service
Collection
Phone
Visiting EFT or Chq printing instructions issued
Customer Service Collections
Security PDC/ECS Management
Regional Operations HUB
Regional Hub
Loan Approval
Channels
Direct
Channel Partners
Application Verification Process Loan agreement & other
documents executed Asset hypothecated to
IIFL
Credit Bureau
100% Pre-Audit
Issuance of chq to customer or funds transferred electronically
Loan Execution
Customer Contact Point
Hub Processes Ops Process
Post approval activities
Audit
Sourcing Risks: 1) Risk
Concentration 2) Increased sourcing
from un-authorized dealerships
Collateral Risks: 1) Higher Invoicing / Over-valuation 2) No Delivery of equipment
Regulatory Risks: 1) Regulatory non-
compliance Credit Risk: 1) Increase in bounce rates
Reputation Risk 1) Customer service issues
Medical equipment process flow
II: IIFL Group Performance review Q1FY14
III: IIFL (NBFC) Performance review
Annexure I: Corporate overview
III: IIFL Other Businesses review
Annexure II: Industry update
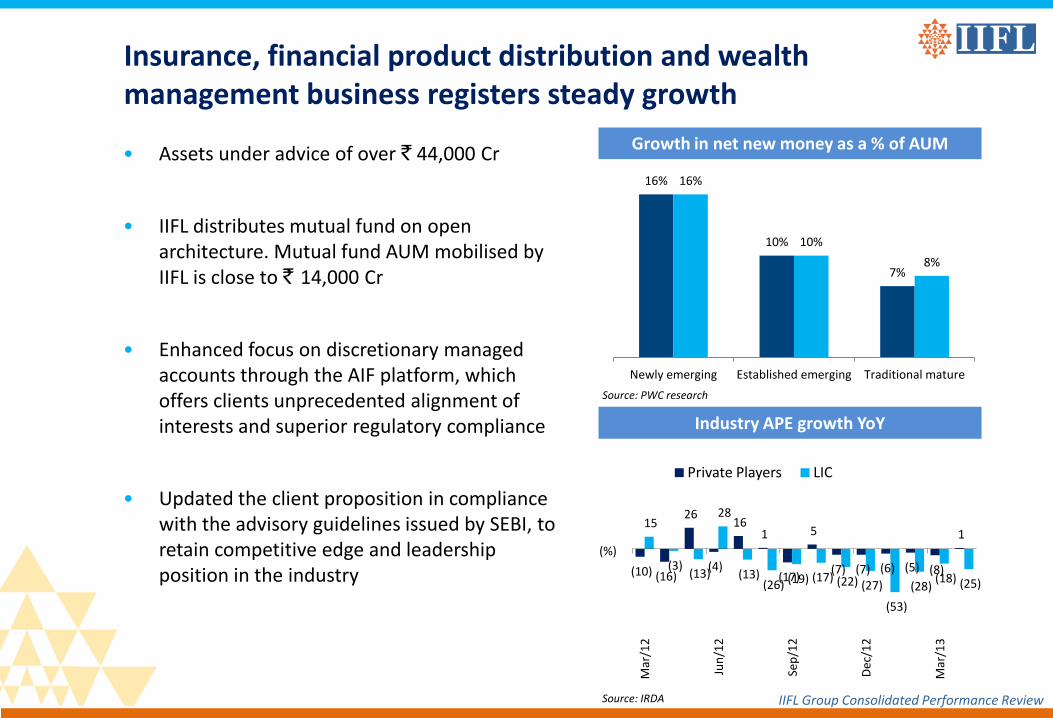
• Assets under advice of over ` 44,000 Cr
• IIFL distributes mutual fund on open architecture. Mutual fund AUM mobilised by IIFL is close to ` 14,000 Cr
• Enhanced focus on discretionary managed accounts through the AIF platform, which offers clients unprecedented alignment of interests and superior regulatory compliance
• Updated the client proposition in compliance with the advisory guidelines issued by SEBI, to retain competitive edge and leadership position in the industry
Insurance, financial product distribution and wealth management business registers steady growth
Growth in net new money as a % of AUM
Industry APE growth YoY
IIFL Group Consolidated Performance Review
(10) (16)
26
(4)
16 1
(17)
5
(7) (7) (6) (5) (8)
1 15
(3) (13)
28
(13) (26) (19) (17) (22) (27)
(53)
(28) (18) (25)
Mar
/12
Jun
/12
Sep
/12
Dec
/12
Mar
/13
(%)
Private Players LIC
16%
10%
7%
16%
10%
8%
Newly emerging Established emerging Traditional mature
Source: PWC research
Source: IRDA
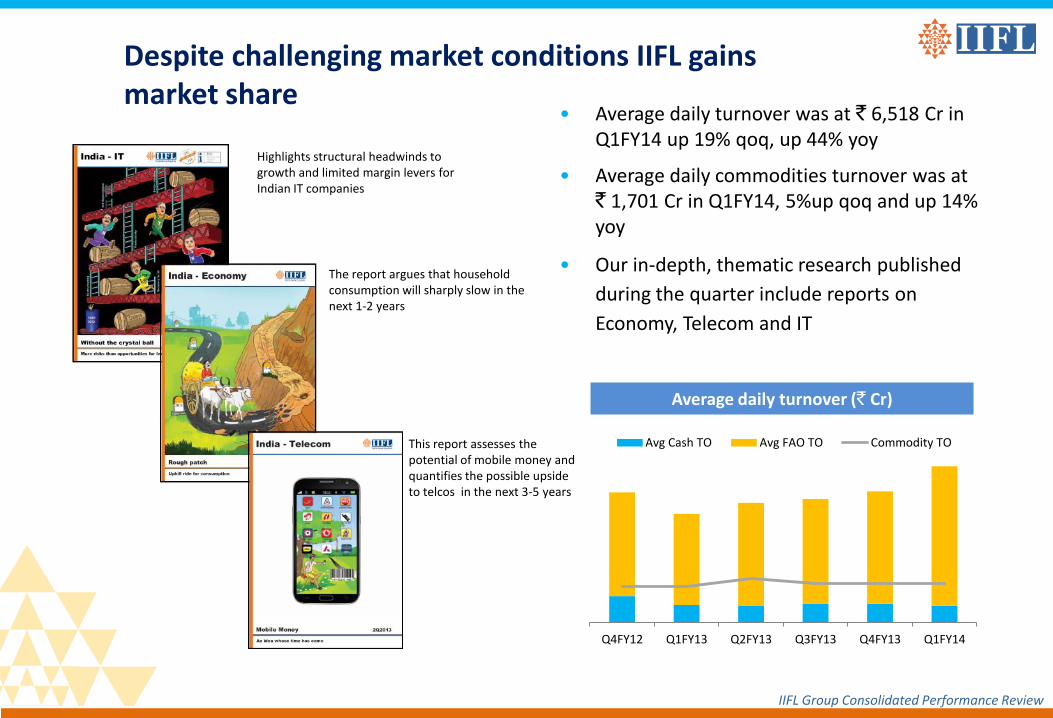
• Average daily turnover was at ` 6,518 Cr in Q1FY14 up 19% qoq, up 44% yoy
• Average daily commodities turnover was at ` 1,701 Cr in Q1FY14, 5%up qoq and up 14% yoy
• Our in-depth, thematic research published
during the quarter include reports on
Economy, Telecom and IT
Despite challenging market conditions IIFL gains market share
Average daily turnover (` Cr)
IIFL Group Consolidated Performance Review
Q4FY12 Q1FY13 Q2FY13 Q3FY13 Q4FY13 Q1FY14
Avg Cash TO Avg FAO TO Commodity TO
Highlights structural headwinds to growth and limited margin levers for Indian IT companies
The report argues that household consumption will sharply slow in the next 1-2 years
This report assesses the potential of mobile money and quantifies the possible upside to telcos in the next 3-5 years
II: IIFL Group Performance review Q1FY14
III: IIFL (NBFC) Performance review
Annexure II: Industry update
Annexure I: Corporate overview
III: IIFL Other Businesses review
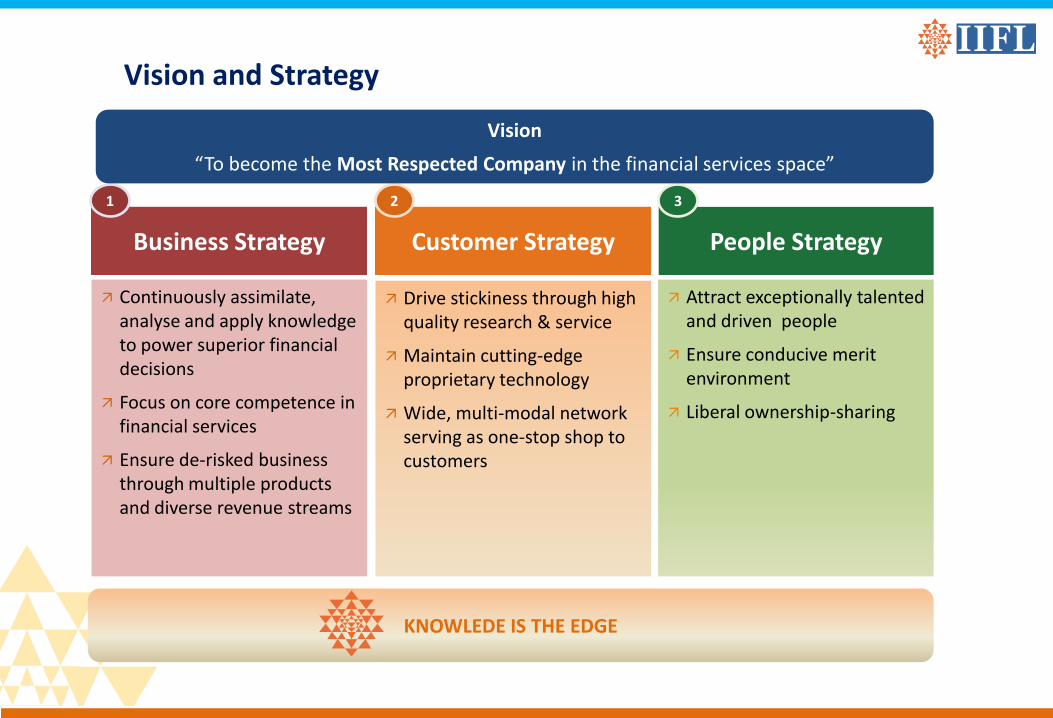
Customer Strategy
2
Drive stickiness through high quality research & service
Maintain cutting-edge proprietary technology
Wide, multi-modal network serving as one-stop shop to customers
Business Strategy
1
Continuously assimilate, analyse and apply knowledge to power superior financial decisions
Focus on core competence in financial services
Ensure de-risked business through multiple products and diverse revenue streams
People Strategy
3
Attract exceptionally talented and driven people
Ensure conducive merit environment
Liberal ownership-sharing
Vision
“To become the Most Respected Company in the financial services space”
KNOWLEDE IS THE EDGE
Vision and Strategy
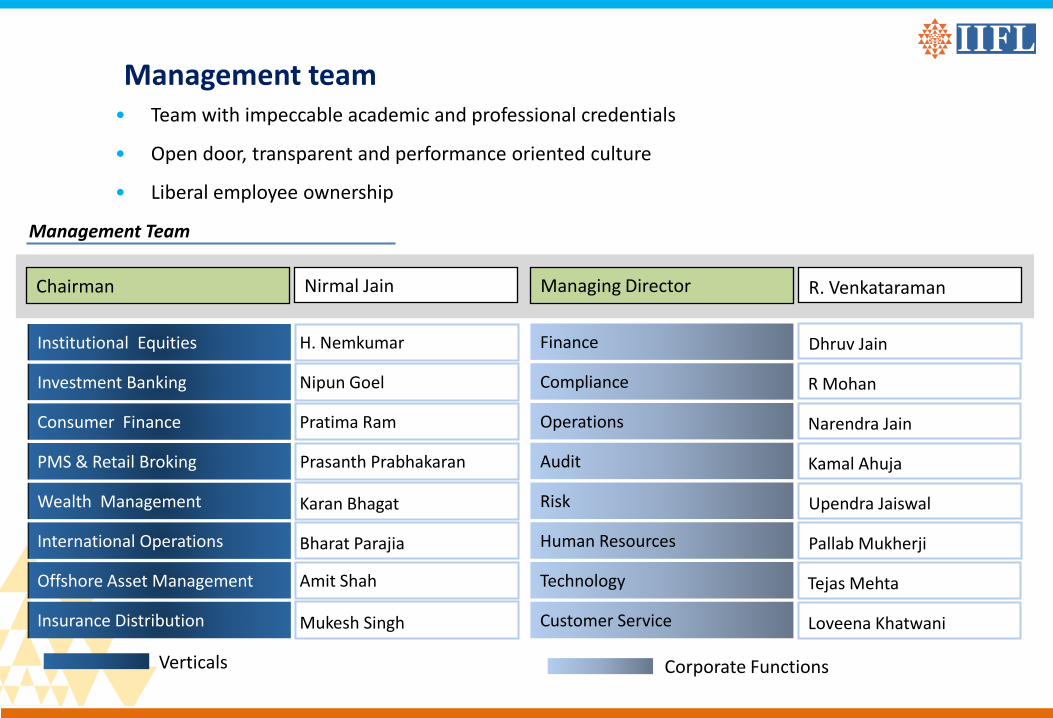
• Team with impeccable academic and professional credentials
• Open door, transparent and performance oriented culture
• Liberal employee ownership
Management team
Corporate Functions Verticals
Management Team
Chairman Nirmal Jain Managing Director R. Venkataraman
Institutional Equities
Investment Banking
Consumer Finance
PMS & Retail Broking
Wealth Management
International Operations
H. Nemkumar
Pratima Ram
Prasanth Prabhakaran
Karan Bhagat
Bharat Parajia
Finance
Compliance
Operations
Audit
Human Resources
Dhruv Jain
R Mohan
Narendra Jain
Kamal Ahuja
Pallab Mukherji
Offshore Asset Management Amit Shah
Insurance Distribution Mukesh Singh
Risk Upendra Jaiswal
Nipun Goel
Technology
Customer Service
Tejas Mehta
Loveena Khatwani
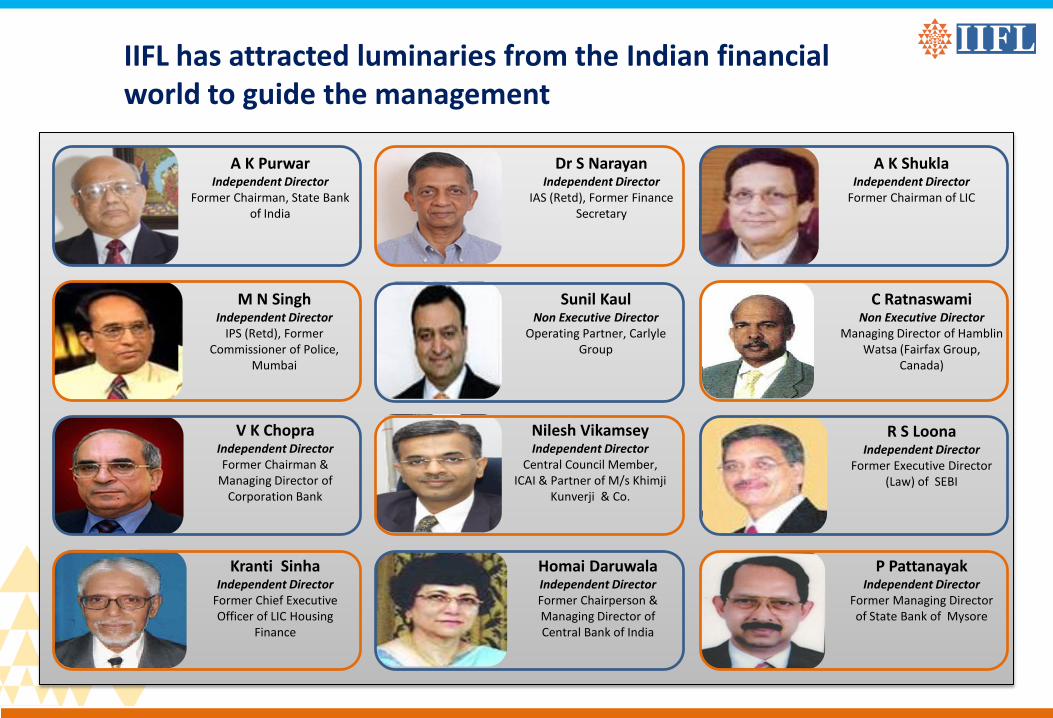
A K Purwar Independent Director
Former Chairman, State Bank of India
Nilesh Vikamsey Independent Director
Central Council Member, ICAI & Partner of M/s Khimji
Kunverji & Co.
Kranti Sinha Independent Director
Former Chief Executive Officer of LIC Housing
Finance
M N Singh Independent Director
IPS (Retd), Former Commissioner of Police,
Mumbai
Sunil Kaul Non Executive Director
Operating Partner, Carlyle Group
C Ratnaswami Non Executive Director
Managing Director of Hamblin Watsa (Fairfax Group,
Canada)
V K Chopra Independent Director Former Chairman &
Managing Director of Corporation Bank
Dr S Narayan Independent Director
IAS (Retd), Former Finance Secretary
R S Loona Independent Director
Former Executive Director (Law) of SEBI
A K Shukla Independent Director
Former Chairman of LIC
Homai Daruwala Independent Director Former Chairperson & Managing Director of Central Bank of India
P Pattanayak Independent Director
Former Managing Director of State Bank of Mysore
IIFL has attracted luminaries from the Indian financial world to guide the management
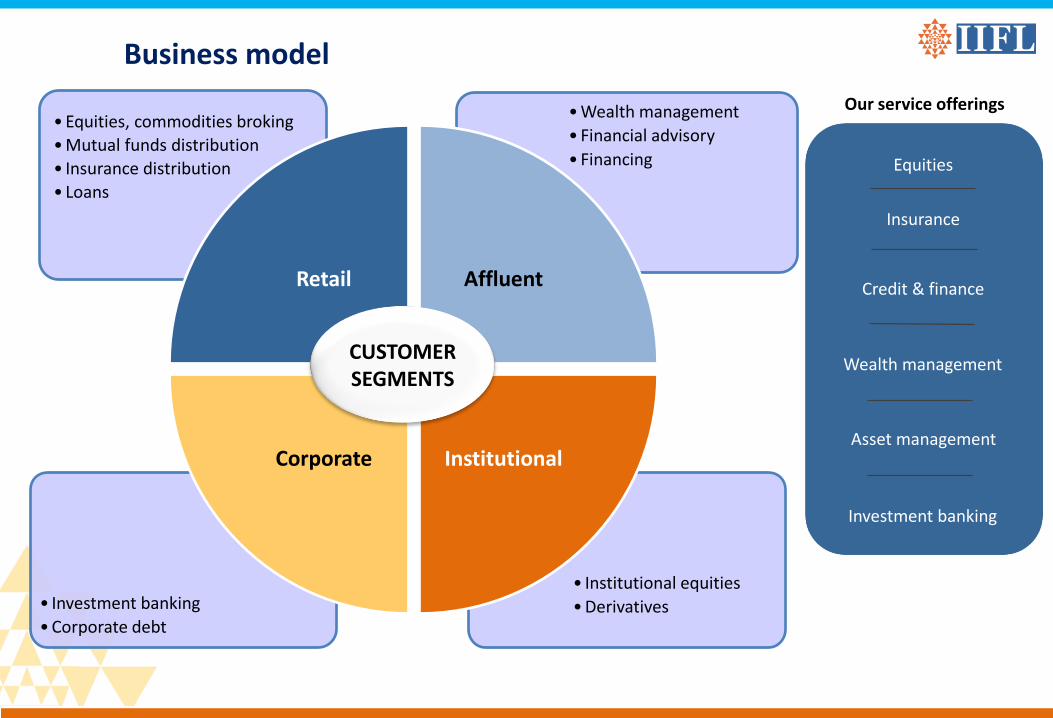
• Institutional equities
• Derivatives • Investment banking
• Corporate debt
• Wealth management
• Financial advisory
• Financing
Retail Affluent
Institutional Corporate
CUSTOMER SEGMENTS
Our service offerings
Equities
Insurance
Credit & finance
Wealth management
Asset management
Investment banking
• Equities, commodities broking
• Mutual funds distribution
• Insurance distribution
• Loans
Business model
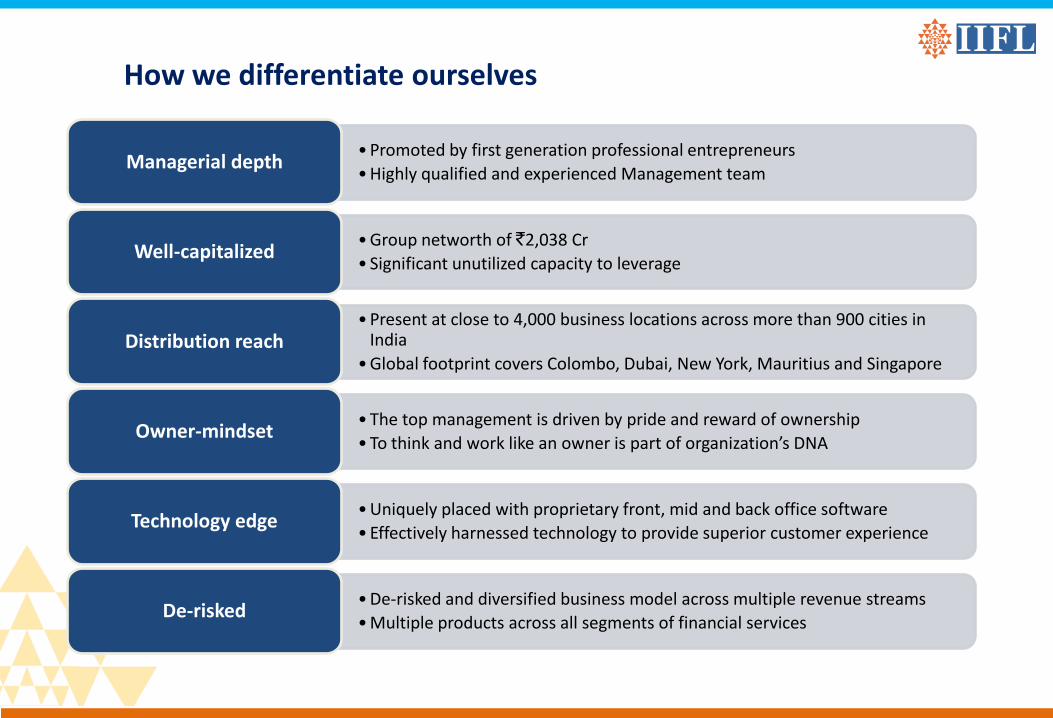
How we differentiate ourselves
• Promoted by first generation professional entrepreneurs
• Highly qualified and experienced Management team Managerial depth
• Group networth of `2,038 Cr
• Significant unutilized capacity to leverage Well-capitalized
• Present at close to 4,000 business locations across more than 900 cities in India
• Global footprint covers Colombo, Dubai, New York, Mauritius and Singapore Distribution reach
• The top management is driven by pride and reward of ownership
• To think and work like an owner is part of organization’s DNA Owner-mindset
• Uniquely placed with proprietary front, mid and back office software
• Effectively harnessed technology to provide superior customer experience Technology edge
• De-risked and diversified business model across multiple revenue streams
• Multiple products across all segments of financial services De-risked
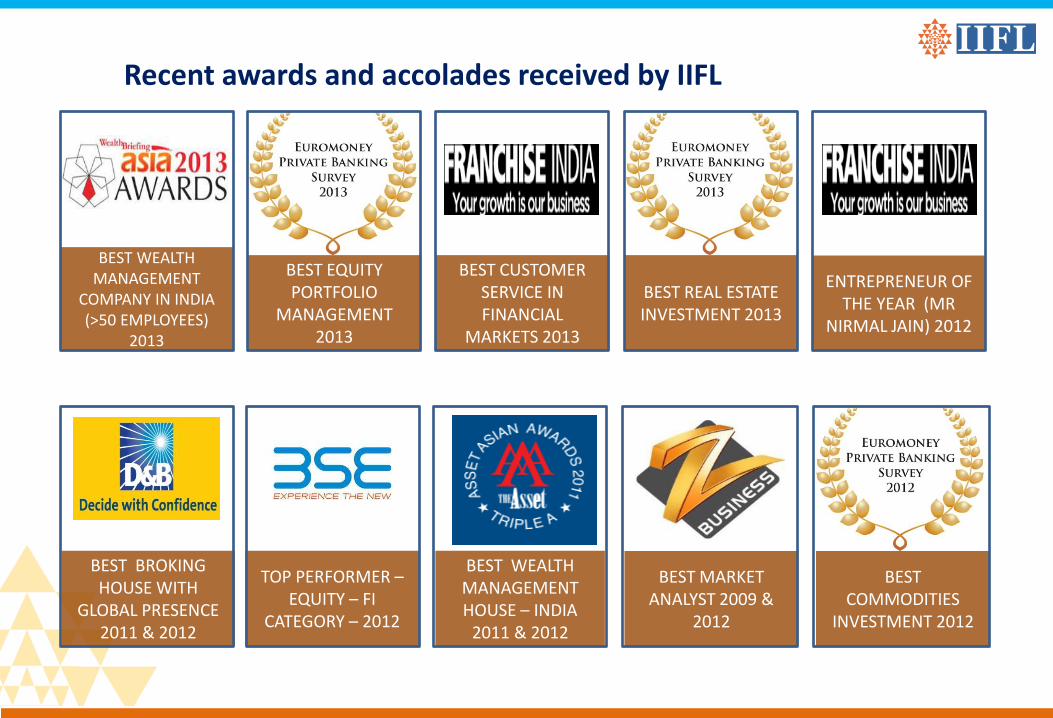
Recent awards and accolades received by IIFL
BEST WEALTH MANAGEMENT HOUSE – INDIA
2011 & 2012
BEST BROKING HOUSE WITH
GLOBAL PRESENCE 2011 & 2012
ENTREPRENEUR OF THE YEAR (MR
NIRMAL JAIN) 2012
TOP PERFORMER – EQUITY – FI
CATEGORY – 2012
BEST WEALTH MANAGEMENT
COMPANY IN INDIA (>50 EMPLOYEES)
2013
BEST CUSTOMER SERVICE IN FINANCIAL
MARKETS 2013
BEST MARKET ANALYST 2009 &
2012
BEST COMMODITIES
INVESTMENT 2012
BEST REAL ESTATE INVESTMENT 2013
BEST EQUITY PORTFOLIO
MANAGEMENT 2013
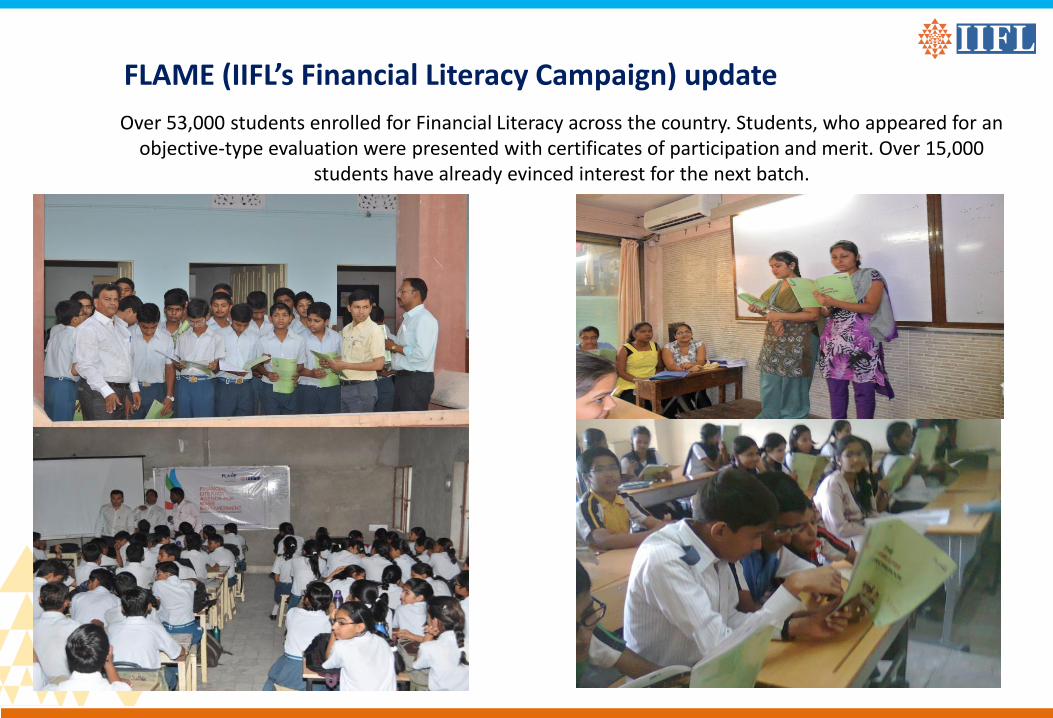
Over 53,000 students enrolled for Financial Literacy across the country. Students, who appeared for an objective-type evaluation were presented with certificates of participation and merit. Over 15,000
students have already evinced interest for the next batch.
FLAME (IIFL’s Financial Literacy Campaign) update
I: IIFL Group Performance review Q1FY14
Annexure I: Corporate overview
Annexure II: Industry update
II: IIFL (NBFC) Performance review
III: IIFL Other Businesses review
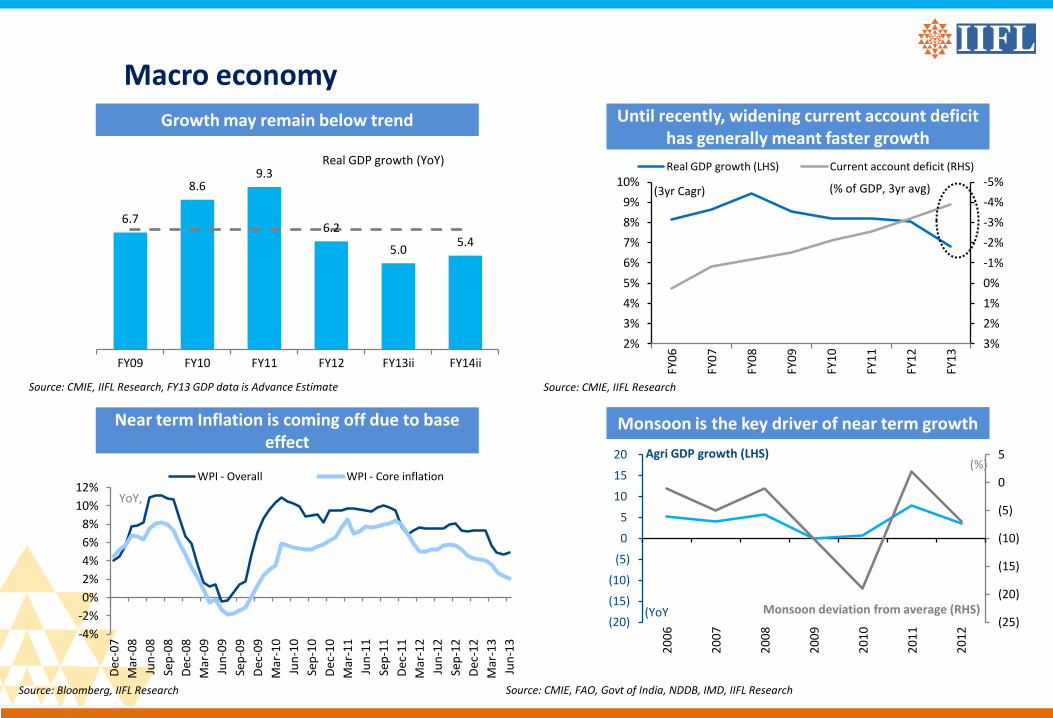
Macro economy Until recently, widening current account deficit
has generally meant faster growth
Monsoon is the key driver of near term growth
Growth may remain below trend
Near term Inflation is coming off due to base effect
(25)
(20)
(15)
(10)
(5)
0
5
(20)
(15)
(10)
(5)
0
5
10
15
20
20
06
20
07
20
08
20
09
20
10
20
11
20
12
(YoY
(%) Agri GDP growth (LHS)
Monsoon deviation from average (RHS)
6.7
8.6 9.3
6.2
5.0 5.4
FY09 FY10 FY11 FY12 FY13ii FY14ii
Real GDP growth (YoY)
Source: CMIE, IIFL Research, FY13 GDP data is Advance Estimate Source: CMIE, IIFL Research
Source: Bloomberg, IIFL Research Source: CMIE, FAO, Govt of India, NDDB, IMD, IIFL Research
-5%
-4%
-3%
-2%
-1%
0%
1%
2%
3% 2%
3%
4%
5%
6%
7%
8%
9%
10%
FY0
6
FY0
7
FY0
8
FY0
9
FY1
0
FY1
1
FY1
2
FY1
3
Real GDP growth (LHS) Current account deficit (RHS)
(3yr Cagr) (% of GDP, 3yr avg)
-4%
-2%
0%
2%
4%
6%
8%
10%
12%
Dec
-07
Mar
-08
Jun
-08
Sep
-08
Dec
-08
Mar
-09
Jun
-09
Sep
-09
Dec
-09
Mar
-10
Jun
-10
Sep
-10
Dec
-10
Mar
-11
Jun
-11
Sep
-11
Dec
-11
Mar
-12
Jun
-12
Sep
-12
Dec
-12
Mar
-13
Jun
-13
WPI - Overall WPI - Core inflation
YoY,
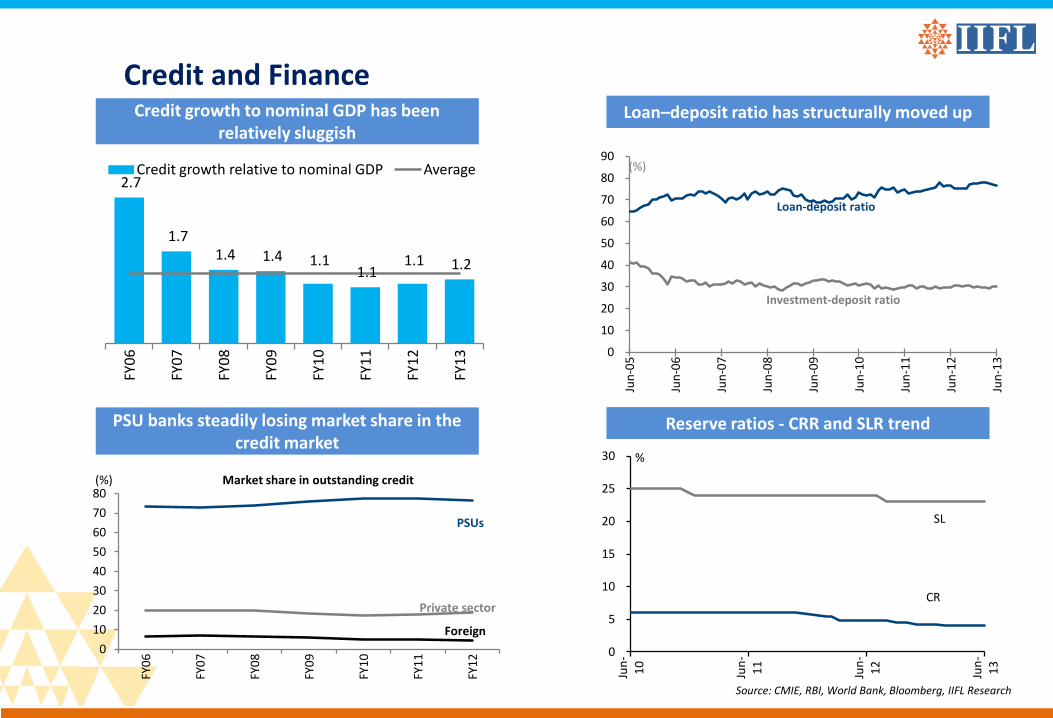
Credit and Finance Loan–deposit ratio has structurally moved up
Reserve ratios - CRR and SLR trend
Credit growth to nominal GDP has been relatively sluggish
PSU banks steadily losing market share in the credit market
2.7
1.7 1.4 1.4 1.1
1.1 1.1 1.2
FY0
6
FY0
7
FY0
8
FY0
9
FY1
0
FY1
1
FY1
2
FY1
3
Credit growth relative to nominal GDP Average
0
10
20
30
40
50
60
70
80
FY0
6
FY0
7
FY0
8
FY0
9
FY1
0
FY1
1
FY1
2
Market share in outstanding credit
PSUs
Private sector
Foreign
(%)
0
5
10
15
20
25
30
Jun
-1
0
Jun
-1
1
Jun
-1
2
Jun
-1
3
%
SL
CR
0
10
20
30
40
50
60
70
80
90
Jun
-05
Jun
-06
Jun
-07
Jun
-08
Jun
-09
Jun
-10
Jun
-11
Jun
-12
Jun
-13
(%)
Investment-deposit ratio
Loan-deposit ratio
Source: CMIE, RBI, World Bank, Bloomberg, IIFL Research
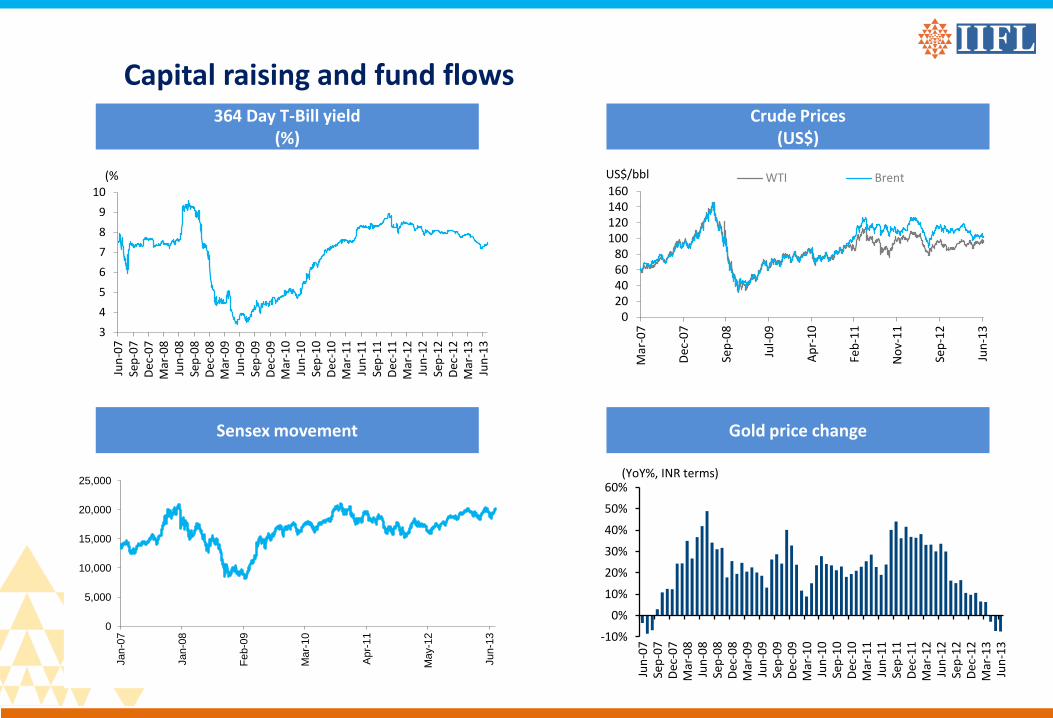
Capital raising and fund flows Crude Prices
(US$)
Gold price change
364 Day T-Bill yield (%)
Sensex movement
0
5,000
10,000
15,000
20,000
25,000
Jan-0
7
Jan-0
8
Fe
b-0
9
Mar-
10
Apr-
11
May-1
2
Jun-1
3
-10%
0%
10%
20%
30%
40%
50%
60%
Jun
-07
Se
p-0
7
Dec
-07
M
ar-0
8
Jun
-08
Se
p-0
8
Dec
-08
M
ar-0
9
Jun
-09
Se
p-0
9
Dec
-09
M
ar-1
0
Jun
-10
Se
p-1
0
Dec
-10
M
ar-1
1
Jun
-11
Se
p-1
1
Dec
-11
M
ar-1
2
Jun
-12
Se
p-1
2
Dec
-12
M
ar-1
3
Jun
-13
(YoY%, INR terms)
3
4
5
6
7
8
9
10
Jun
-07
Se
p-0
7
Dec
-07
M
ar-0
8
Jun
-08
Se
p-0
8
Dec
-08
M
ar-0
9
Jun
-09
Se
p-0
9
Dec
-09
M
ar-1
0
Jun
-10
Se
p-1
0
Dec
-10
M
ar-1
1
Jun
-11
Se
p-1
1
Dec
-11
M
ar-1
2
Jun
-12
Se
p-1
2
Dec
-12
M
ar-1
3
Jun
-13
(%
0 20 40 60 80
100 120 140 160
Mar
-07
Dec
-07
Sep
-08
Jul-
09
Ap
r-1
0
Feb
-11
No
v-1
1
Sep
-12
Jun
-13
WTI Brent US$/bbl
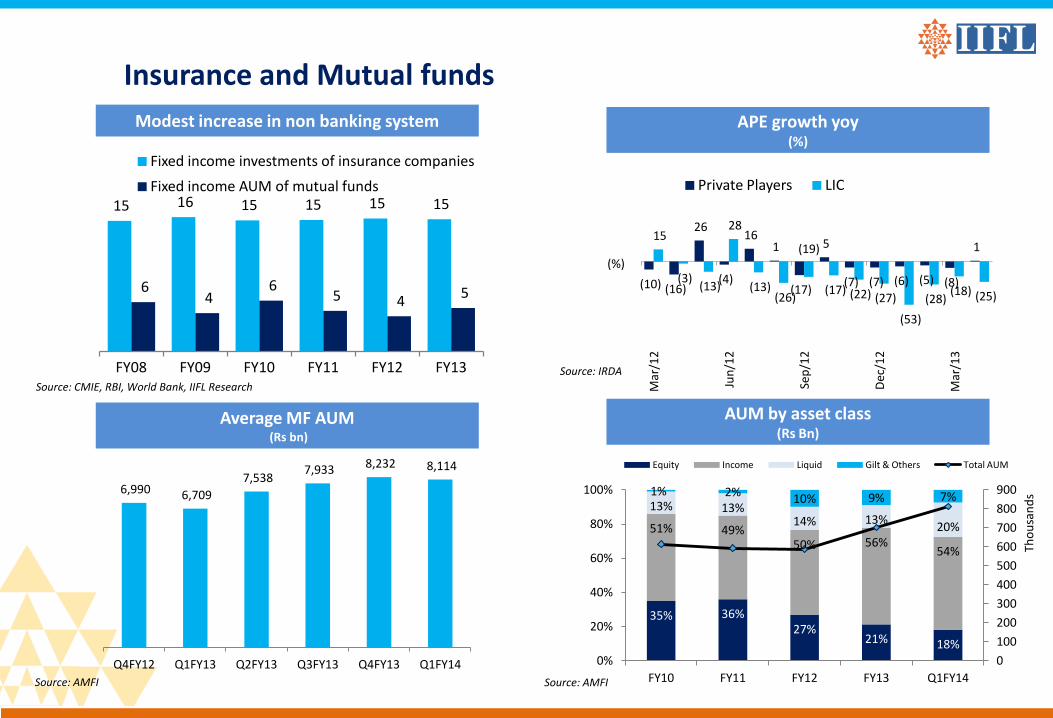
Insurance and Mutual funds
APE growth yoy (%)
AUM by asset class (Rs Bn)
Modest increase in non banking system
Average MF AUM (Rs bn)
15 16 15 15 15 15
6 4
6 5 4
5
FY08 FY09 FY10 FY11 FY12 FY13
Fixed income investments of insurance companies
Fixed income AUM of mutual funds
Source: IRDA
Source: AMFI Source: AMFI
Source: CMIE, RBI, World Bank, IIFL Research
35% 36% 27%
21% 18%
51% 49% 50% 56%
54%
13% 13% 14% 13%
20%
1% 2% 10% 9% 7%
0
100
200
300
400
500
600
700
800
900
0%
20%
40%
60%
80%
100%
FY10 FY11 FY12 FY13 Q1FY14
Tho
usa
nd
s
Equity Income Liquid Gilt & Others Total AUM
(10) (16)
26
(4)
16 1
(17)
5
(7) (7) (6) (5) (8)
1 15
(3) (13)
28
(13) (26)
(19)
(17) (22) (27)
(53)
(28) (18) (25)
Mar
/12
Jun
/12
Sep
/12
Dec
/12
Mar
/13
(%)
Private Players LIC
6,990 6,709
7,538 7,933 8,232 8,114
Q4FY12 Q1FY13 Q2FY13 Q3FY13 Q4FY13 Q1FY14
Thank you
Published in July 2013 © India Infoline Ltd 20013-14. India Infoline Ltd. All rights reserved. Regd. Off: IIFL House, Sun Infotech Park, Road No. 16V, Plot No.B-23, Thane Industrial Area, Wagle Estate, Thane – 400604. Tel.: +(91 22)4007 7000 Fax: 2685 0451. This report is for information purposes only and does not construe to be any investment, legal or taxation advice. It is not intended as an offer or solicitation for the purchase and sale of any financial instrument. Any action taken by you on the basis of the information contained herein is your responsibility alone and India Infoline Ltd (hereinafter referred as IIL) and its subsidiaries or its employees or directors, associates will not be liable in any manner for the consequences of such action taken by you. We have exercised due diligence in checking the correctness and authenticity of the information contained herein, but do not represent that it is accurate or complete. IIL or any of its subsidiaries or associates or employees shall not be in any way responsible for any loss or damage that may arise to any person from any inadvertent error in the information contained in this publication. The recipients of this report should rely on their own investigations. IIL and/or its subsidiaries and/or directors, employees or associates may have interests or positions, financial or otherwise in the securities mentioned in this report.