india - emerging healthcare destination - vfinal-1
TRANSCRIPT
6th World Medical Tourism Congress India, Potential Healthcare Destination
A Value Perspective
S Premkumar Group CEO, Apollo Hospitals Group

Historical Cost Analysis of US Products & Services
Source: http://www.thepeoplehistory.com/70yearsofpricechange.html, http://link.springer.com/chapter/10.1007%2F978-3-642-69855-2_42#page-1, http://www.foodtimeline.org/foodfaq5.html#restaurant , www.eia.gov , http://www.census.gov/construction/nrs/pdf/uspricemon.pdf
1980
Average cost of home
2013 $ 105,000
$ 22,500
Average cost of cardiac
surgery in India
$ 3000
?
Average cost of car
$ 7,200
$ 28,000
$ 76,425
$ 260,500
Cost of a Gallon on gas
$ 1.19
$ 3.29
Cost of Coke
$ 0.89
$ 1.99
Cost of a loaf of bread
$ 0.50
$ 2.79
Average cost of cardiac surgery in US
2

Cost Reduction despite
Steep Inflationary pressures | Exchange rate variations
Over a period of 30 Years (1983 – 2013)
Historical Cost Analysis of US Products & Services
Plus..
While..
Average Cost of Cardiac Surgery in India
$2900!
$3000
2013
1983
3 Source: http://in.reuters.com/article/2010/06/25/india-fuel-reforms-idINSGE65209520100625. www.tradingeconomics.com
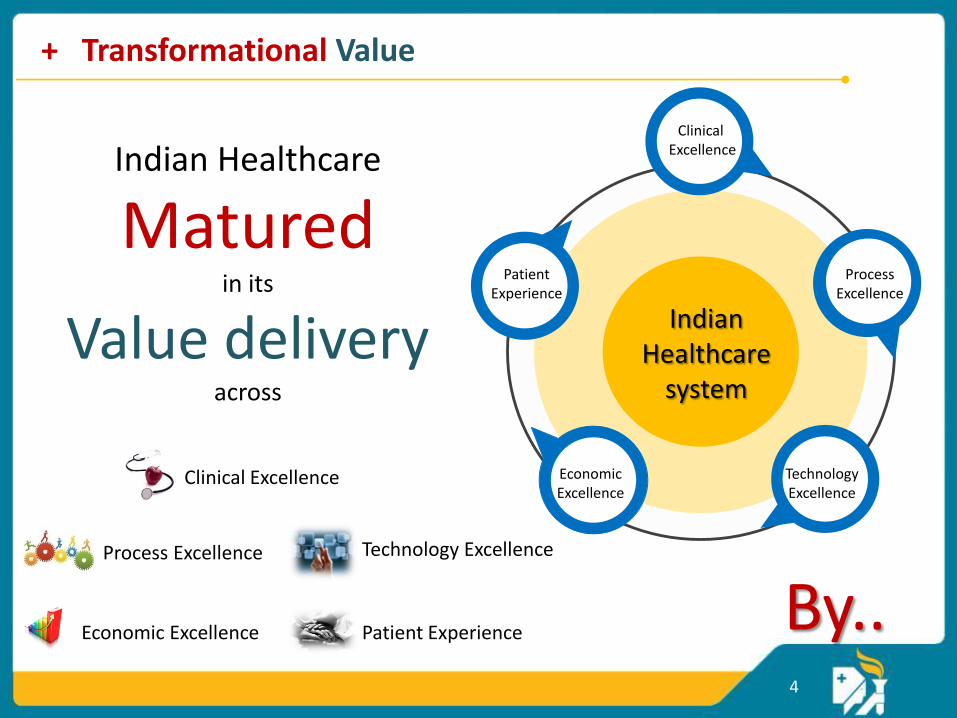
Indian Healthcare
Matured in its
Value delivery across
Clinical Excellence
Process Excellence
Technology Excellence
Economic Excellence
Patient Experience
Indian Healthcare
system
+ Transformational Value
By.. 4
Economic Excellence
Technology Excellence
Patient Experience
Process Excellence
Clinical Excellence

1983
Below the best On-par with the best On-par/Better than the Best
..Aligning with the World’s BEST Clinical Outcomes!!!
2013
5

Thus…
6

India becoming the Preferred Destination for Medical Tourism
7
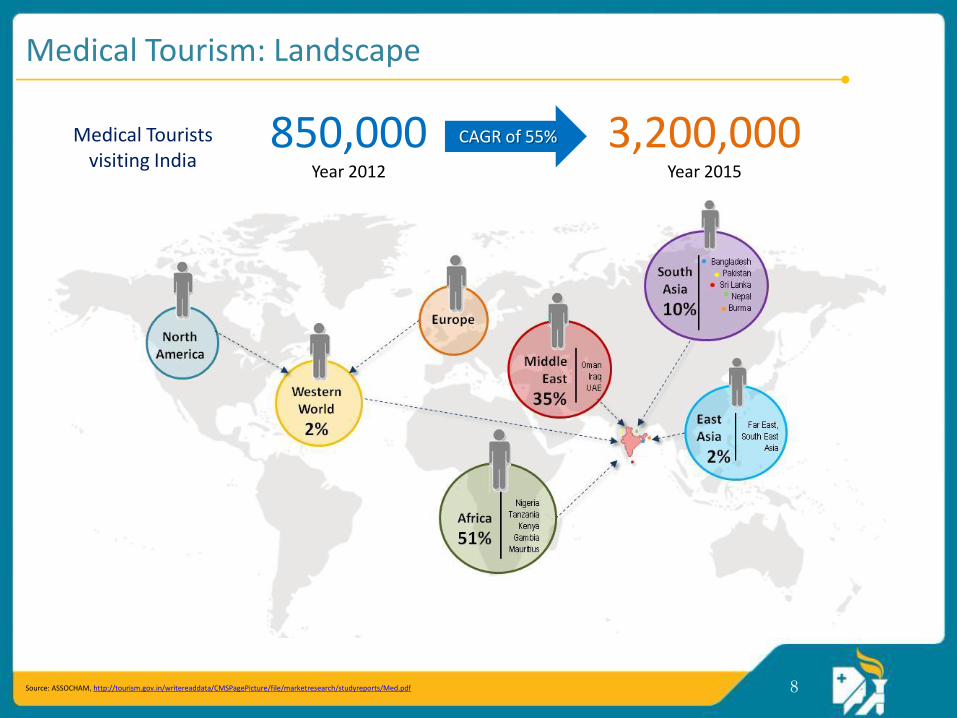
850,000 Year 2012
3,200,000 Year 2015
Medical Tourists visiting India
CAGR of 55%
Source: ASSOCHAM, http://tourism.gov.in/writereaddata/CMSPagePicture/file/marketresearch/studyreports/Med.pdf
Medical Tourism: Landscape
8

Is there an
Industry model of Scaled Maturity to
Serve the West?
9

Nascent to Mature An Example of Transformational Model
10
IT/ITES Industry

Opportunity Size
Investment
Infrastructure
Talent
Engagement Model
Employment
Growth in BFSI, Telecom, Retail & Aviation
IT Sector revenue - $2 Billion GDP Contribution – 0.62% (1994-95)
0.12 Million IT professionals (1994-95)
2.8 Million IT professionals (2011-12), 8.9M Indirect job creation
Low-level design, coding & maintenance Services
Re-engineering & Conversion projects
On-site & Off-shore model matures
End-to-End projects Integrated Outsourcing (ADM +BPO+
Infrastructure)
Increased skin in the game
Outcome based engagement models
Time & Material Cost Arbitrage Projects Business Outcome basis Transaction based
776 Engineering colleges
3393 Engineering colleges National Skill Development
(10 Million trained by 2012) Private training
(NIIT, APTECH, SSI)
Airport modernization
STPI/SEZ Zones (45/52 STPI parks in Tier II/III cities)
Significant development across Telecom, Transports, Power,
Hotels & Townships
Pre Y2K Y2K T&M Total Outsourcing Transformation
Up to 1996 1997-2000 2001 - 2005 2005 - 2010 From 2010….
Industry Maturity Time Line
Cross functional industry movement
IT / ITES Industry Life Cycle – Maturity Journey
High Private sector investments with conducive business reforms by Government, Tax SOPS
Low spending on Science, Technology &
Communication
Sector revenue - $101 Billion (2.7% of global market share),
GDP Contribution – 7.5% (2011-12)
Source: NASSCOM report 2012, Planning commission of India, Information Technology in India: Present Status and Future Prospects for Economic Development – By Sanjay K Singh, Indian Information technology industry: Past, Present & Future & A tool for national development
11

Is Healthcare the Next IT?
12
Arguably yes…

Opportunity Size
Investment
Infrastructure
Talent
Market Addressal
Employment
Public Healthcare Small & Medium Hospitals Corporate Hospitals Medical Tourism Globalization
15+ JCI Accredited hospitals 12 Beds, 0.6 Doctors, 1.3 Nurses (Per 1000 population) Significant leverage of
Medical Technology
1980s-2000 2000 - 2012 Vision 2020
Industry Maturity
Finishing School 335 Medical colleges
45629 Doctors per year
Limited number of Government medical and nursing colleges
Established nursing/ paramedical colleges
Primary & Secondary Care Hub & Spoke for tertiary care
First corporate tertiary care hospital (Clinical outcomes focused)
Management of Global hospitals
Preferred Medical tourism destination
2.96 Million Healthcare professionals (1997-98)
10 Million Doctors, Nurses & other healthcare professionals (2011-12)
Rise of NCDs/Lifestyle diseases, Growth in Medical Tourism
Sector revenue - $10 Billion Mostly Government driven
Sector revenue - $79 Billion GDP Contribution – 4.1% (2011-12)
Healthcare Industry Life Cycle – Maturity Measurement
Time Line
No JCI/NABH Accreditation – Predominantly government run
Spending - 82% Private & 18% Public Predominantly
Government spending Liberalization & Tax exemption (Private insurance)
Private investment in
Healthcare
Source: MCI India Annual report 2012, Indian Nursing council annual report, Planning commission of India, Healthcare in India – Emerging market report by PWC, IBEF report on Indian healthcare (2011)
13
Major presence of Accredited hospitals
2 Million additional beds
Projected revenue $280 Billion By 2020
Predominantly Private sector spending
600 new Medical colleges 1500 new Nursing colleges
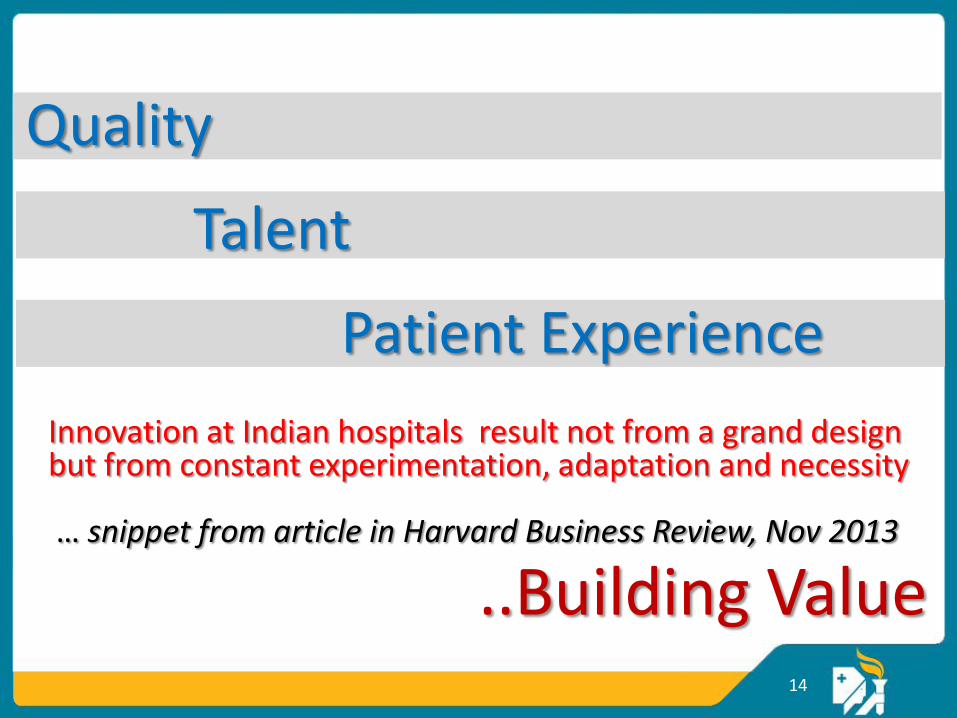
Innovation at Indian hospitals result not from a grand design but from constant experimentation, adaptation and necessity … snippet from article in Harvard Business Review, Nov 2013
14
Quality
Talent
Patient Experience
..Building Value

Source: http://tourism.gov.in/writereaddata/CMSPagePicture/file/marketresearch/studyreports/Med.pdf
‘Mark of Excellence’ standard for AYUSH Hospitals & Wellness
centers
Joint Commission International (JCI) accredited Hospitals with Standard
Clinical Governance Tools
National Accreditation Body of Hospitals (NABH)
with High Standard Operating procedures & Excellence
15+ 30+ 200+
International & National Accreditation of Hospitals
Instills Confidence in patients in terms of Quality standardization
Expectations mapping indicates Quality of Treatment
at the pre-procedural and procedural stage as the primary concern for
Medical travelers
Building Quality: Accreditation & Process Improvement
15

Building Quality: Quality Benchmarking : The Apollo Way ! ACE 25
Process Standardization & Improvement through
Six-Sigma, 5S Kaizen process
A Comprehensive Dashboard to monitor
Clinical parameters
Continuous Quality Improvement in Key Success Factors that
drives Clinical outcomes
A Quality Benchmarking Scorecard to stay ahead
of the World’s Best
CABG mortality rate ALOS of stroke cases in ICU
ALOS 1 Year Survival Rate For
Liver Transplants
TKR complication rate
Kt/V Measurement Avg Urea Reduction Ratio in Hemodialysis patients
ALOS post angioplasty
ALOS Post Renal Transplant
ALOS for large bowel resection
ALOS Post Microdisctomy ALOS Post TURP
ALOS Modified Radical Mastectomy
Medication Errors
Door to Thrombolysis Time in Ischemic Stroke in ER
Surgical Site Infection Rate Catheter-related UTI
Ventilator Associated Pneumonia
16 Note: The respective brands are the Copyright owners of all the logos and images

Minimally Invasive | Faster Recovery | Shorter Hospital Stay Better Clinical outcome | Simplifies Complex surgeries |
Safe, accurate & Precise
Localize radiation dosage| Superior dose distribution | Fewer side effects | Spares healthy surrounding tissues
Robotic Surgery across multiple specialties
Proton Beam Therapy for Cancer Treatment
Building Quality: Technology Excellence
Source: Internal data
Tomorrow’s Technology for Today’s care
17

Procedure USA India Thailand Singapore
Coronary artery bypass surgery $70,000-133,000 $7,000 $22,000 $16,300
Bypass surgery with heart valve replacement
$75,000-140,000 $9,500 $25,000 $22,000
Hip replacement $33,000-57,000 $7,200 $12,700 $12,000
Knee replacement $30,000-53,000 $7,200 $11,500 $9,600
Hip Resurfacing $50,000 $7,000 $16,000 $12,100
Prostate surgery (TURP procedure) $10,000-16,000 $3,600 $4,400 $5,300
Kidney Transplant Up to $ 150,000 $14000 $36,421-$37,397
Liver Transplant Up to $315,000 $55,000 $300,000
Note: U.S. charges are Average RAC rates. Indian prices are average prices (incremental/loaded costs are excluded)
Physician and certain other fees are generally excluded. Prices at non-U.S. hospitals are all-inclusive other than for Panama, which does not include surgeon’s fee. Only data from Joint Commission International accredited hospitals considered.
Competitive Economic Advantage on a Global Map
achieved through
Infrastructure | Technology | Talent | Process | Clinical Outcomes
Economic Excellence
Source: http://www.indianmedicaltravelassociation.com/India-Cost-Advantage.php 18
360° Patient Experience
19

Service Excellence
TENDER LOVING CARE IS THE WAY TO SERVE
VOICE OF CUSTOMERS LISTENING & ACTING TO
FEEDBACK IS THE WAY TO SERVE
BETTER
DISNEY EXPERIENCE PHILOSOPHY
@ HOSPITALS IN ENSURING SAFE &
COMFORTABLE STAY
20

360°
Patient
Experience
US Shore Home Healthcare Partners
Door-to-Door Concierge
Translator
Service (if required)
Best in Class
Clinical Outcomes
with TLC
Comfortable
Suites
Rehabilitation
Center
International
Cuisine
Care giver
Engagement
Counseling &
Follow-up through
Tele-Health
Service Excellence in Patient Experience
21

CAUTION!!!
22

To deliver the Best..
Selecting the Key Expertise Areas for the Medical value travelers
Non-Emergency | Elective Procedures Category
Specialty
Orthopedics Cardiac Sciences Functional Neurosurgery
Urology Gastroenterology
23
Presence of an On-shore partner for
“First-Mile & the Back-Home Mile”
Is Critical Treatment execution in India
Patient returns home
1 2
3
4 5
Patient Travels to India
Home health & Pre-operative Care
Post-operative Care & Rehabilitation
6 Continues engagement with Physician to
Tele Health
23

Hence…
24

Cross border & Offshore expertise offer a significant opportunity for Medical value travel
USA Outbound Patient flow
@ 1.6 million in 2012 with a significant 35% growth rate
over a 10-year projection (2007-17)
USA Outbound Patient flow
Opportunity Realization
Health plans to incentivize Medical travel
Collaboration with Accredited partners in leveraging Globalization
Deliver First-mile & Back-Home mile experience through On-shore partner
Creating Win-Win equation for all stakeholders
Need for Innovation in business models and service delivery
The Opportunity Ahead…
Forbes report on Medical tourism 22 Oct 2013, Deloitte – Medical Tourism – Consumers in search of value, Deloitte – Medical Tourism – Update and Implication
Desirability (Market)
Viability (Business)
Feasibility (Financial)
Operability (Regulatory)
Sustainability (Growth)
25

• Over 2200 Admissions
• Over 40,000 footfalls
• 3000 Emergency Cases
• 800 Major Surgeries
• 40 Cardiac Surgeries
• 700 Dialysis
• Over 60,000 Laboratory Tests
• 2-3 Organ Transplants
• Over 6000 Outpatient Volumes
• 800 CT Scans/ 400 MRI’s
A DAY AT
APOLLO HOSPITALS
• 30 years of Holistic Healing
• Touched 33 million lives
• 1200+ Transplants in 2012 (World’s Busiest Center
of Excellence for Solid organ Transplants)
• Pioneered Health checks - 8.5 million people
benefitted
• 155,000+ Heart Surgeries
• Over 10,000 Joint Replacements
• Patients from 120 countries
• First Liver Transplant in Children & Adults
• First Multi-Organ Transplant
• Over 8000 Kidney Transplants (Best Clinical
Outcomes)
BEING PATIENT-CENTRIC IS NOT A
GOAL, IT IS THE CORE OF OUR
EXISTENCE. TENDER LOVING CARE IS
OUR WAY OF LIFE
APOLLO HOSPITALS, INTRODUCED CLINICAL
EXCELLENCE IN THE INDIAN HEALTHCARE
LEXICON.
26

27
Departure Arrival
Thank You!
Apollo Hospitals have recorded equivalent or better outcomes than the international standards for medical complications associated with knee, coronary and prostrate as well as for infections relating to operating theatres
and catheters …..HBR November 2013 ( Delivering World -class Healthcare, Affordably )