india automotive industry scenario 2020 report - a small ... · 8 although suzuki motor corporation...
TRANSCRIPT

Automotive Intelligence Research Series
India Automotive Industry
Scenario 2020 Report
- A Small Car Focus -
Prof. Dr. Roger Moser Asia Connect Center, University of St.Gallen & IIM Bangalore
Christian Kuklinski Automotive Institute for Management, EBS Business School

i
Content
Content ....................................................................................................................................... i Figures ...................................................................................................................................... iii
Tables ........................................................................................................................................ iii
1 India: THE Market for Small Cars? .................................................................................. 1
2 Methodology ..................................................................................................................... 4
3 Quantitative Results: The Perspective of (Re)Action .................................................... 8
3.3 Curtailing the PEST-Environment ............................................................................ 8
3.4 Anticipating the Industry Stakeholders’ Behavior ................................................ 11
4 Scenario Development for the Political Environment of India’s (Small Car) Automotive Industry in 2020 ....................................................................................... 17
4.1 Political Environment Scenarios ............................................................................ 17
4.2 Reduced Tax Rates for Small Cars in 2020 (PP1) ................................................. 21 4.2.1 Analysis of the Industry Expert’s Arguments on Projection PP1
(Reduced Tax Rates) ........................................................................................... 21
4.2.2 Roadmap for Projection PP1 (Reduced Tax Rates) ............................................ 23
4.3 Harmonization of Emission Standards (PP2) ........................................................ 25
4.3.1 Analysis of Expert’s Argument on Projection PP2 ............................................. 26 4.3.2 Roadmap for Projection PP2 ............................................................................... 27
5 Scenario Development for the Economic Value Chain of India’s (Small Car) Automotive Industry in 2020 ....................................................................................... 30
5.1 Economic Value Chain Scenarios ............................................................................ 30
5.2 Foreign Dominance of the Market (VP1) ............................................................... 34 5.2.1 Analysis of Expert’s Argument on Projection VP1 ............................................ 34
5.2.2 Roadmap for Projection VP1 .............................................................................. 37
5.3 OEMs and their Exclusive Supplier Networks (VP2) ............................................ 39 5.3.1 Analysis of Expert’s Argument on Projection VP2 ............................................ 40 5.3.2 Roadmap for Projection VP2 .............................................................................. 42
6 Scenario Development for the Social Environment of India’s (Small Car) Automotive Industry in 2020 ............................................................................................................ 44
6.1 Social Environment Scenarios ................................................................................ 44
6.2 Green Society (SP1) ................................................................................................. 48 6.2.1 Analysis of Expert’s Argument on Projection SP1 ............................................. 49
6.2.2 Roadmap for Projection SP1 ............................................................................... 50
6.3 Reasonable Cars (SP2) ............................................................................................ 52 6.3.1 Analysis of Expert’s Argument on Projection SP2 ............................................. 53
6.3.2 Roadmap for Projection SP2 ............................................................................... 54
7 Scenario Development for the Technological Infrastructure of India’s (Small Car) Automotive Industry in 2020 ....................................................................................... 57
7.1 Technological Infrastructure Scenarios ................................................................. 57
7.2 Local High-Tech Engineers (IP1) ............................................................................ 61 7.2.1 Analysis of Expert’s Argument on Projection IP1 .............................................. 62 7.2.2 Roadmap for Projection IP1 ................................................................................ 64
7.3 Mobility Infrastructure (IP2) .................................................................................. 66 7.3.1 Analysis of Expert’s Argument on Projection IP2 .............................................. 67 7.3.2 Roadmap for Projection IP2 ................................................................................ 68
8 References ....................................................................................................................... 71
Contact Information ............................................................................................................... 72
Appendix A .............................................................................................................................. 73
Correlation Analysis: Industry Environment and Stakeholder Projections ................. 73
ii
Appendix B .............................................................................................................................. 74
Crossroad Events ................................................................................................................ 74
Appendix C .............................................................................................................................. 77
(Re)action Strategies .......................................................................................................... 77
Appendix D .............................................................................................................................. 79
Industry Stakeholder Projections: Consensus Analysis .................................................. 79
Customers ........................................................................................................................ 79
Suppliers .......................................................................................................................... 80
Industry / OEMs .............................................................................................................. 81
Government ..................................................................................................................... 82
Society 84

iii
Figures
Figure 1: Study approach for “Scenario 2020 Report” ....................................................................................... 3 Figure 2: PEST-Industry Environment Projections: Probability and Impact ......................................... 11 Figure 3: Industry Stakeholder Projections: Probability and Impact........................................................ 16 Figure 4: Political Environment Scenario Matrix ............................................................................................... 18 Figure 5: Consensus Analysis for “Reduced Tax Rates” Projection PP1 ................................................... 21 Figure 6: Influences on Political Industry Environment Projection 1 (PP1) .......................................... 23 Figure 7: Consensus Analysis for “Harmonization of Emissions” Projection PP2 ............................... 25 Figure 8: Influences on Political Industry Environment Projection (PP2) ............................................. 28 Figure 9: Economic Value Chain Scenario Matrix .............................................................................................. 31 Figure 10 : Consensus Analysis for “Foreign Dominance” Projection VP1 ............................................. 34 Figure 11: Influences on Economic Value Chain Projection (VP1) ............................................................. 37 Figure 12 : Consensus Analysis for “Exclusive Supplier Networks” Projection VP2 .......................... 39 Figure 13: Influences on Economic Value Chain Projection (VP2) ............................................................. 42 Figure 14: Social Environment Scenario Matrix ................................................................................................. 45 Figure 15: Consensus Analysis for “Green Society” Projection SP1 ........................................................... 48 Figure 16: Influences on Social Industry Environment Projections (SP1) .............................................. 51 Figure 17: Consensus Analysis for “Reasonable Cars” Projection SP2 ..................................................... 53 Figure 18: Influences on Social Industry Environment Projection (SP2) ................................................ 55 Figure 19: Technological Infrastructure Scenario Matrix .............................................................................. 58 Figure 20: Consensus Analysis for “Local High-Tech Engineers” Projection IP1 ................................. 61 Figure 21: Influences on Technological Infrastructure Projection (IP1) ................................................. 64 Figure 22: Consensus Analysis for “Mobility Infrastructure” Projection IP2......................................... 66 Figure 23: Influences on Technological Infrastructure Projection (IP2) ................................................. 68 Figure 24: Industry Environment and Stakeholder Projections: Probability and Impact ..... Fehler! Textmarke nicht definiert. Figure 25: Industry Environment and Stakeholder Projections: Probability and Consensus .......................................................................................................................... Fehler! Textmarke nicht definiert.
Tables
Table 1: Industry Environment Projections: Overview Quantitative Results........................................ 10 Table 2: Industry Stakeholder Projections: Overview Quantitative Results .......................................... 15 Table 3: Political Environment Scenarios: Consequences for Industry Stakeholders........................ 20 Table 4: Political Industry Environment Projection PP1................................................................................ 21 Table 5: Political Industry Environment Projection PP2................................................................................ 25 Table 6: Economic Value Chain Scenarios: Consequences for Industry Stakeholders ....................... 33 Table 7: Economic Industry Environment Projection VP1 ............................................................................ 34 Table 8: Economic Industry Environment Projection VP2 ............................................................................ 39 Table 9: Social Environment Scenarios: Consequences for Industry Stakeholders ............................ 47 Table 10: Social Industry Environment Projection SP1 .................................................................................. 48 Table 11: Social Industry Environment Projection SP2 .................................................................................. 52 Table 12: Technological Infrastructure Scenarios: Consequences for Industry Stakeholders ....... 60 Table 13: Technological Industry Environment Projection IP1 .................................................................. 61 Table 14: Technological Industry Environment Projection IP2 .................................................................. 66

1
1 India: THE Market for Small Cars?
Over the last two decades, India has received increased attention from Western firms as a large
country (3,3 Mio. km2) with a huge population (over 1.1 bn. people), and an impressive
economic development in the last few years.1 2 In particular, India’s consumer market is highly
attractive for Western firms as private consumption as well as the savings of private households
have risen substantially in recent years.
However, in order to be successful in India, product offerings need to be specifically designed for
the Indian market. With respect to small cars, the majority of consumers may emphasize rather a
car’s functionality (e.g., number of persons to fit in and flat front space for the placement of
religious figures) than safety features (such as airbags) or the latest emission reduction
technologies. A further – and major – necessity for local small cars: the purchase price needs to
account for the low average incomes but also fit into the “value for money” paradigm that mostly
influences the Indian mass markets for almost any product. A key challenge for any automotive
company active in the small car segment is therefore to understand what really creates “value”
for potential buyers and “how cheap is cheap enough”. The rather simple approach to build the
cheapest car in the world and wait for the Indian buyers to run for it has turned out to be rather
a wish than reality so far.
In general, the private expenditures for individual transportation have risen at a comparable
rate to overall consumption of private households;3 still, two-wheelers account for most of the
individual transportation purchases (75 % in 2010).4 Combined with the improvement of the
financial situation of private households, an inherent potential for the passenger (small) car
market to gain a higher share in India’s transportation market (16 % in 2010) seems realistic:5
For example, the domestic passenger car sales have more than doubled (138 %) within the past
five years resulting in more than 2.5 mio. units sold in 2010. Besides, the annual exports have
risen by an impressive 173 % – almost half a million passenger cars were exported in 2010.6
At the same time, local production capacities for passenger vehicles in India increased by 147 %
arriving at roughly three million units in 2010.7 However, despite the strong interests of foreign
1 Ministry of Statistics and Program Implementation (MOSPI), 2009. 2 Organization for Economic Co-operation and Development (OECD), 2008. 3 Increase from 2004-2008 in current prices, MOSPI (2009). 4 Society of Indian Automotive Manufacturers (SIAM), 2011. 5 SIAM (2011). 6 Increase from 2004-2010, SIAM (2011). 7 Increase from 2004-2010, SIAM (2011).

2
automotive firms in the Indian market, primarily domestic firms such as Maruti-Suzuki8 and
Tata Motors dominate India’s passenger (small) car market.9
India’s increasing relevance for the global automotive industry requires from local as well as
global decision makers to rethink their strategies for the Indian (small) car market in order to
benefit from the tremendous growth potentials. We have therefore initiated an industry
intelligence research program to support decision makers of automotive companies in their
strategy development for the Indian (small) car market. In its essence, the program develops
scenarios for India’s automotive industry future with an emphasis on the small car segment as
well as industry dynamics analyses to better understand the impact and interdependences
among relevant formal and informal institutions for the Indian automotive industry. The insights
of this “Scenario 2020 Report” are based on an extensive Delphi-study carried out with local
automotive industry experts in India in 2010/2011. The experts evaluated 20 projections for the
year 2020: eight Industry Environment Projections comprising ideas for future political,
(economic) value chain, social and (soft/hard technological) infrastructure (PEST) environments
and twelve Industry Stakeholder Projections serving as a foundation to outline behaviors of
industry stakeholders that affect the future PEST environment of India’s automotive industry
(emphasis on the small car segment).
The remainder of this “Scenario 2020 Report” is structured as follows. First, the Delphi
methodology as applied in the study is briefly explained. Second, an overview of the examined
projections is provided and the quantitative results of the Delphi survey are discussed. Third, the
scenarios are developed by matching the two Industry Environment Projections related to each
PEST environment explaining potential consequences for the industry’s stakeholders based
upon an expert-workshop held on the IIM Bangalore campus in 2010. Then, each Industry
Environment Projection is analyzed referring to probability of occurrence, impact on and
desirability for the Indian automotive industry. Afterwards, potential effects on each Industry
Environment Projection are outlined by drawing on the Industry Stakeholder Projections.
8 Although Suzuki Motor Corporation holds a 54 % equity stake of Maruti Suzuki India Ltd. (MSIL) Maruti-Suzuki is rather perceived by the authors and many experts as a domestic company (MSIL, 2011). 9 Passenger Vehicle market shares in 2008: Maruti Suzuki 46 % and Tata Motors 16.5%, SIAM (2009).

3
Figure 1: Study approach for “Scenario 2020 Report”
The “Scenario 2020 Report” is intended to support senior executives and corporate strategy
managers in the development or re-evaluation of their current plans for India’s (small car)
automotive industry. This “Scenario 2020 Report” primarily serves as input for further workshop
discussions among the experts in automotive companies to analyze and identify necessary
actions to be taken: Be prepared for the future of “Incredible India”.

4
2 Methodology
Heraclitus noted approximately 2.500 years ago: “panta rhei” (everything flows). His conception
characterizes the world as a dynamic and complex environment, continuously undergoing a
process of change. In today’s globalized world, the future seems even more uncertain than ever:
Hardly anybody is able to grasp a sharp picture of how tomorrow will look like – especially not
with respect to mobility challenges in emerging markets like India. This is what makes the future
not only interesting, but also challenging. However, every challenge also provides a chance for
those who master this challenge better than others – and this is where our “Scenario 2020
Report” intends to support senior executives as well as corporate strategy managers.
Especially in emerging markets such has India, the perceived uncertainty regarding future
developments is high. This may be due to the strong economic growth, the changing society, and
the way domestic institutions frame the “rules of the game” (North, 1990: 3) for these markets
(Khanna & Palepu, 1997). This is particularly challenging for senior executives: they are
responsible not only for the tactical but also for the long-term planning and need to take various
and diverse possible influences into account that may be of relevance prior to their occurrence:
Strategic and operational flexibility as key competitive factors in markets like India.
Scenario planning is a commonly accepted method to identify possible futures that need to be
considered by strategic planning (Alsan, 2008). To develop sound scenarios, this study draws on
the Delphi method and expert discussions. The Delphi method is suitable for the collection of
both qualitative and quantitative data on projections for possible futures and has gained a solid
reputation for collecting disputed expert opinions (Nielsen & Thangadurai, 2007). Capturing
disputed judgments as well as interpreting qualitative data is imperative for this study’s
character: it explores the uncertain.
The Delphi method is a multi-level group-based information-sharing survey tool (Czinkota &
Ronkainen, 2005). The application of the Delphi method is structured in three main phases
(Nielsen & Thangadurai, 2007):
1. Identification of relevant topics and issues.
2. Sharing of perspectives based upon each participant’s experiences.
3. Analysis and synthesis of the shared knowledge and perspectives.
For this report, an extensive desk research was first completed to identify relevant topics.
Second, the topics identified were further evaluated and modified during interviews with several
industry experts. Last, the affirmed topics were merged into twenty projections: Eight Industry
Environment Projections, structured along the political, (economic) value chain, social and
(soft/hard technology) infrastructure environment (PEST); and twelve Industry Stakeholder

5
Projections, structured along relevant stakeholders (customers, suppliers, OEMs/competitors,
government and the society at large). The Industry Environment Projections curtail the future
environment along the PEST framework and the Industry Stakeholder Projections delineate
potential stakeholder activities that may influence the Industry Environment Projections’
occurrence.
Two Industry Environment Projections represent each PEST environment and two Industry
Stakeholder Projections examine each stakeholder group. An additional Industry Stakeholder
Projection was integrated in the survey for the Government of India and the automotive
suppliers based on the significant impact identified for those two stakeholder groups on the
future industry environment.
The Delphi tool used in the study allowed then the 43 participating industry experts to assess
the projections, share their reasoning with other experts, review the other experts’ arguments,
and reconsider their own assessments. The experts rated the 20 projections regarding the
probability of occurrence (0-100 %), impact on the industry (5 point Likert-Scale) and
desirability for the industry (5 point Likert-Scale) and underlined their assessment with
individual statements.
The Industry Environment Projections were evaluated based on both the experts’ quantitative
and qualitative assessment. Correlation analyses revealed interrelations between Stakeholder
and Industry Environment Projections to enable the development of a “Roadmap” for each
Industry Environment Projection. Besides, all expert statements were analyzed and consolidated
for each projection to provide for a sound fundament for further interpretation and evaluation.
The two Industry Environment Projections for each PEST environment were matched and four
scenarios developed for each environment. Each of the 16 scenarios developed were presented
and evaluated with regards to potential consequences for the five stakeholder groups during a
workshop with 25 industry experts on the campus of IIM Bangalore. In addition, each expected
probability of occurrence of a scenario was rated and important events between 2011 and 2020
were identified (back-casting).

6
GETTING STARTED:
A Guide to Understand the Quantitative Results of Delphi Studies
The results of Delphi studies contain both quantitative data (experts’ assessments on
probabilities, impact, and desirability) and qualitative data (arguments of the experts why there
is a high/low probability, impact or desirability). While the evaluation of the qualitative data is
based on the content analysis of the written expert statements, the evaluation of the quantitative
data requires some additional information in order to interpret the figures on probability,
impact and desirability correctly.
Probability
The purpose of Delphi studies – as conducted – is in this study’s context to increase
transparency on the future business environment of a specific industry (segment) in India. In
such a context, projections where each industry expert either agrees on 90%+ or 10%-
probabilities are easy to interpret and use but will unfortunately not result in an opportunity to
gain insights that might lead to future competitive advantages. Projections that are so clear with
respect to their probabilities can be considered common knowledge in the industry. It is
therefore more important to understand the relative distribution of the expert judgments
between 0% and 100% probability.
This is why we display in this report always the probability and the degree of consensus among
the experts as a first indicator for what a 65% or 42% probability actually means. If there is a
high degree of consensus for a specific probability among the experts it is quite useful to look at
their qualitative arguments to understand why they believe in a relatively high or low
probability. If there is a high degree of dissent among the experts we further need to evaluate
whether this is due to a “flat” distribution of the probability opinions between 0% and 100% or
whether there are, for example, two culminations around 10% probability and around 90%
probability and then evaluate which specific arguments the two groups of experts use to justify
their rather low or high probability assessment.
Impact
The impact of a projection is important to ensure that the assessed projections are relevant for
the future industry development. In combination with the probability value it is possible to
illustrate which projections have a high impact and either a very low or very high probability.
Those projections with a very high probability need to be seriously considered for the further
strategy development process while the high impact/very low probability projections need to be
treated in such a way that the company should at least have a pre-defined (re)action strategy in
case it actually becomes true.

7
Desirability
The desirability of a projection is relevant to evaluate as prior research has shown that
projections with a high desirability are prone to be biased in their probability value. In short,
projections with a high desirability tend to display in general a higher probability due to
psychological reasons which are beyond the scope of this short introduction to discuss. As the
bias in this study is only minimal we have not recalculated the probability values as they are
more efficient to interpret this way.

8
3 Quantitative Results: The Perspective of (Re)Action
The analysis framework is primarily based on the PEST analysis for the Industry Environment
Projections and the stakeholder concept for the Industry Stakeholder Projections. This section
introduces the twenty projections (8 Industry Environment Projections and 12 Industry
Stakeholder Projections) evaluated by local industry experts and offers first quantitative insights
as a basis for the scenario development in Section 4.
3.3 Curtailing the PEST-Environment
In the following, each of the two Industry Environment Projections along the political, economic,
social, and technological environment are described and the quantitative results of the Delphi
are outlined (cf. Table 1, Figure 2).
Political
Environment
India’s future political environment is examined with respect to
Government subsidies for small car purchases and intensified
emission regulations. Whereas the first projection reflects a
significantly reduced Goods & Service Tax (GST) rate (PP1) and
therefore as support for industry growth, the second projection
renders fortified CO2 emission regulations across India – even
comparable to European standards (PP2) and is therefore rather
seen as a hindrance for further industry growth.
Economic Value Chain
Environment
The (economic) value chain environment for India’s automotive
industry is assessed by two projections as well. On the one hand,
the dispersion of market shares among domestic and foreign
OEMs is accounted for (VP1) to identify the future major players.
On the other hand, an OEM’s relationship with suppliers is
depicted by posting an optional integration of domestic suppliers
into a supplier network that is accessible for one OEM exclusively
(VP2) to better understand how the relationships between buyers
and suppliers are primarily characterized.

9
Social Environment
The projections on India’s social environment comprise
tendencies that influence purchasing behavior in the small car
segment. The first projection concerns the society’s
environmental awareness and the demand for low-emission
vehicles (SP1) to integrate the general view of the society on the
analyzed subject; the second projection refers to car buyers’ cost-
awareness and the relevance of prices for consumers’ purchasing
decisions (SP2) to reflect the direct purchasing behavior of the
most important customer group for the automotive industry in
India.
Technological
Infrastructure
Environment
The (soft/hard technological) infrastructure environment accounts
for India’s education system (“soft technology”) and mobility
infrastructure (“hard technology”). The former aspect concerns
the availability of local engineers (graduates from India’s
universities) and their familiarity with advanced automotive
technologies (IP1) – as the soft infrastructure of India in the
context of this study. The latter aspect picks up on the
transportation infrastructure development, especially referring to
road construction (IP2) to account for the hard infrastructure in
this study’s context.
Table 1 illustrates the quantitative results for the PEST Industry Environment Projections
assessed in terms of probability, consensus among the experts, impact on and desirability for the
Indian small car industry. Additionally, the right column depicts the utilized markers for Figure
2.
Overall, the average impact (3.5) as well as desirability (3.4) of the projections is rated high.
Although the industry experts vary strongly in their assessments (Consensus Distance: Ø 30.9),
four out of the eight Industry Environment Projections are considered at least likely (Probability
> 50%). The Delphi participants’ lack of a common opinion regarding any Industry Environment
Projection indicates a high degree of uncertainty about future industry developments and
affirms the relevance of such studies for senior executives.

10
No Industry Environment Projections Probability Consensus Impact Desirability Symbol
Po
liti
cal
1
(PP1) “Harmonization of Emissions” in 2020: The GST for small cars in India is a third of the tax rate for all other kinds of passenger cars.
46% 32.5 3.4 3.3
■
Unlikely Strong Dissent
High High
2
(PP2) “Reduced Tax Rates” in 2020: The emission regulations in all regions of India are the same as in Europe.
47% 30 3.4 3.6
Unlikely Strong Dissent
High High
Eco
no
mic
Va
lue
Ch
ain
3
(VP1) “Foreign Dominance” in 2020: Foreign automotive OEMs have more than a 75% market share of the small car segment in India.
58% 40 3.3 2.9
▲
Likely Very Strong
Dissent High Medium
4
(VP2) “Exclusive Supplier Networks” in 2020: Each automotive OEM has its proprietary domestic supplier network in India.
52% 35 3.5 3
Likely Strong Dissent
High Medium
So
cia
l
5
(SP1) “Green Society” in 2020: Small cars are only socially accepted as a means of transportation if they fulfill the strictest emission standards in India.
44% 20 3.4 3.5
∆
Unlikely Moderate Consensus
High High
6
(SP2) “Reasonable Cars” in 2020: The only buying criteria for small cars in India is their “TCO” (Total Cost of Ownership = Purchase Cost + Maintenance Cost – Resale Value).
59% 25 3.4 2.9
Likely Moderate
Dissent High Medium
Te
chn
olo
gic
al
Infr
ast
ruct
ure
7
(IP1) “Local High-Tech Engineers” in 2020: The education system in India provides sufficient engineers with advanced innovation capabilities in automotive core technologies (engine, materials, etc.).
54% 42.5 4 4
□
Likely Very Strong
Dissent High High
8
(IP2) “Mobility Infrastructure” in 2020: The development of new small car concepts for India and major transportation infrastructure development projects in India are strongly aligned.
48% 22.5 3.5 3.7
Unlikely Moderate
Dissent High High
Table 1: Industry Environment Projections: Overview Quantitative Results
The average probability of the Industry Environment Projections is 51%. The occurrence of SP2
(“Cheap Cars”) is considered the most likely among the assessed projections (cf. Figure 2)
whereas the second societal Industry Environment Projection SP1 (“Green Society”) is considered
the least likely. Yet, since the Impact of both projections on the industry is rated equally (3.4),
both aspects should be kept in mind for long-term planning.

11
Industry Environment Projections
Mobility
Infrastructure
Red
uce
d
Tax
Rat
es
Har
mo
niz
atio
n
of
Em
issi
on
s
Foreign Dominance
Exclusive Supplier
NetworksGreen Society Reasonable Cars
Local High-Tech
Engineers
3,0
3,2
3,4
3,6
3,8
4,0
4,2
40% 45% 50% 55% 60%
Probability
Imp
act
Figure 2: PEST-Industry Environment Projections: Probability and Impact
The impact of each Industry Environment Projection is well above 3.0 which further confirms the
relevance of the selected projections during the desktop research and initial expert interviews
(cf. Figure 2). The projection IP1 seems to form an exception since the capabilities of India’s
engineering graduates can be expected to substantially contribute to India’s development
beyond a country of mere assemblers – India might become a market hub for the global small
car industry.
3.4 Anticipating the Industry Stakeholders’ Behavior
The applied industry stakeholder approach includes five groups: Customers, Suppliers,
OEMs/Competitors, the Government of India and India’s Society at large. Each stakeholder
group is addressed by at least two Industry Stakeholder Projections. Due to particular interest in
the development of the domestic automotive supplier industry and the considerable influence of
the Government of India (GOI) on India’s future, an additional Industry Stakeholder Projection
examines each of these two stakeholder group’s activities.
In the following, the Industry Stakeholder Projections are described and the quantitative results
of the Delphi study are outlined (cf. Table 2, Figure 3). All Industry Stakeholder Projections were
developed in a structured approach that ensures that those stakeholder behaviors are evaluated,
which are supposed to have the strongest impact on the evaluated Industry Environment
Projections in total.

12
Customers
The Indian customer’s perspective is examined by two
aspects which have a high momentum in current
discussions, too. The first projection refers to customers’
education in terms of traffic / car safety. This ties strongly
in with today’s traffic situation in India (CuP1). The second
projection refers to an increased usage of public
transportation as an alternative to individual
transportation in metropolitan areas and Tier 1-3 cities
(CuP2).
Suppliers
The domestic automotive supplier industry projections
account for three major aspects: fragmentation of the
supplier market with respect to the number of competitors;
motivation for preferring specific OEMs; and technological
know-how. The first dimension deliberates whether the
domestic automotive supplier industry has gone through a
consolidation process by the year 2020 in order to achieve
necessary economies of scale (SuP1). This projection may
also indicate increased financial resources for Research and
Development activities (R&D) among others. Whether or
not suppliers make effective use of financial resources and
invest continuously into technological upgrading is the
focus of the third projection, which refers to the Indian
suppliers’ technological competitiveness on international
level (SuP3). The second projection accounts for domestic
suppliers’ internationalization strategies to profit from an
OEM’s international positioning unveiling global growth
potentials (SuP2).
OEMs / Competitors
The OEMs / competitor perspective extends the R&D topic
beyond firm / private efforts and accounts for the potential
of public–private “Research Centers of Excellence” for
automotive technologies (CoP1). Moreover, a strong market
segmentation referring to particular products for clearly
differentiated consumer groups (e.g., some customers may
particularly desire innovative environmental technologies)
and its possible implications are incorporated in the second
projection for this stakeholder group (CoP2).

13
The Government
of India
Potential actions from the Government of India (GOI) are not
only partially in line with the suppliers’ and OEMs’ Industry
Stakeholder Projections, but may be seen as the institutional
way to fortify necessary or desirable developments. The first
projection focuses on incentives for exports by tax reductions
(GoP1). The second projection considers fortified
environmental standards with respect to production and the
lifecycle of a small car (GoP2). The third projection accounts
for public transportation considerations and considers
innovative multimodal transportation systems especially for
metropolitan areas (GoP3).
India’s Society
The frame of India’s Society as a stakeholder is delineated by
an economic component as well as an environmental
component. Whereas the former confines labor market
characteristics – in particular wages of blue-collar workers
(SoP1) – the latter pictures the relevance of environmental
awareness in particular to one’s choice of transportation
(SoP2).
In comparison to the quantitative results of the Industry Environment Projections, the average
probability (48 %), impact (3.5) and desirability (3.5) of the Industry Stakeholder Projections do
not differ substantially for any of the five stakeholder groups (cf. Table 2).
However, the experts have a much lower average consensus distance (Ø 19.6). This delivers
additional implications for the accurate design of roadmaps regarding stakeholder activities (cf.
PEST Roadmaps in the upcoming Chapters 4-7) as one may further elaborate each Stakeholder
Projection’s probability and consensus (cf. Appendix D).

14
No Industry Stakeholder Projections Probability Consensus Impact Desirability Symbol
Cu
sto
me
rs
9
(CuP1) “Safety Perception” in 2020: More than 90% of the current and potential buyers of small cars in India perceive their safety to other passenger cars as equal.
53% 10 3.4 3.4
Likely Strong
Consensus High High
10
(CuP2) “Public Transport” in 2020: Current or potential buyers of small cars in India perceive in 90% of the Metros and Tier1-3 Cities in India public transportation as a convenient alternative.
46% 30 3.7 3.6
Unlikely Strong Dissent
High High
Su
pp
lie
rs
11
(SuP1) “Supplier Consolidation” in 2020: The domestic automotive supplier base (Tier 1-3) has gone through a substantial consolidation process increasing the average turnover of a supplier compared to 2010 by the factor 4.
59% 20 3.6 3.7
▲
Likely Moderate Consensus
High High
12
(SuP2) “Focus: Export Opportunities” in 2020: Domestic automotive suppliers in India prefer foreign automotive OEMs operating in India over domestic OEMs due to higher global market volumes and potential growth opportunities.
53% 17.5 3.3 3.1
Likely Strong
Consensus High High
13
(SuP3) “Technological Upgrading” in 2020: Domestic automotive suppliers in India invest continuously into their technological upgrading and are technologically at par with their European, US or Japanese competitors.
48% 20 3.6 3.8
Unlikely Moderate Consensus
High High
Ind
ust
ry/
OE
Ms 14
(CoP1) “Centers of Excellence” in 2020: The automotive associations in India and the GOI have established public-private partnerships to establish research centers of excellence for all major automotive technology areas.
54% 15 3.7 3.9
∆
Likely Strong
Consensus High High
15
(CoP2) “Differentiated Customers” in 2020: All OEMs selling small cars in India are serving clearly differentiated consumer groups.
37% 25 3.2 2.9
Unlikely Moderate
Dissent High Medium

15
Go
ve
rnm
en
t
16 (GoP1) “Export Promotion” in 2020: The GOI provides 100% tax deductions on export profits.
44% 25 3.7 3.2
■
Unlikely Moderate
Dissent High High
17
(GoP2) “Environmental Organizations” in 2020: The GOI has established a powerful governmental organization that regulates all environmental matters of the production and consumption life cycle of small cars.
49% 20 3.5 3.4
Unlikely Moderate Consensus
High High
18
(GoP3) “Integrated Transport” in 2020: The GOI is actually implementing a total mobility strategy integrating individual and public transportation as well as related infrastructure investments.
42% 20 3.5 3.7
Unlikely Moderate Consensus
High High
So
cie
ty
19
(SoP1) “Labor Laws” in 2020: The Indian society has accepted that more flexible labor laws support the economic growth of the country in general and increased wealth of blue-collar workers in particular.
48% 12.5 3.5 3.3
◊
Unlikely Strong
Consensus High High
20
(SoP2) “Pollution Attitude” in 2020: The Indian society is very sensitive towards any kind of pollution through individual or corporate mobility requirements.
41% 20 3.3 3.6
Unlikely Moderate Consensus
High High
Table 2: Industry Stakeholder Projections: Overview Quantitative Results
In sum, the experts rated the Industry Stakeholder Projections’ probability within a relatively
large range (cf. Figure 3). Also within some stakeholder groups, the experts’ assessments varied
strongly among the corresponding Industry Stakeholder Projections. According to the Delphi
results, experts expect “Differentiated customers” (CoP2) to have neither a high impact nor a
high probability which indicates a lower priority for strategic planning. Yet, increasing efforts in
technological upgrading – which may be concentrated in public-private automotive research
“Centers of Excellence” (CoP1) – seems to be attended by India’s path towards a small car
market hub.

16
Industry Stakeholder Projections
Supplier
Consolidation
Technology
Investments
Pollution Attitude
Differentiated
Customers
Safety Perception
Public Transport
Focus: Export
Opportunities
Centers of ExcellenceExport Promotion
Integrated Transport
Lab
or L
aws
Environmental
Organisations
3,0
3,2
3,4
3,6
3,8
35% 40% 45% 50% 55% 60% 65%
Probability
Imp
act
Figure 3: Industry Stakeholder Projections: Probability and Impact

17
4 Scenario Development for the Political Environment of India’s (Small Car) Automotive Industry in 2020
The political environment is examined referring to GST tax reductions through the Government
of India (GOI) and stricter emission regulations. The first projection concerns a significantly
reduced Goods & Services Tax (GST) rate particularly for the small cars. The latter projection
expects emission regulations across India similar to European standards. At first, both political
projections are matched to create four scenarios for the political environment based on the
input from the scenario development workshop on IIM Bangalore campus. Then, each Industry
Environment Projection is analyzed separately, integrating the various qualitative comments of
the experts and subsequently analyzing why each projection is expected to occur/not to occur in
its respective ‘Roadmap’.
4.1 Political Environment Scenarios
The two Political Environment Projections are combined as two axes in a coordinate system to
sketch four potential scenarios for the political environment of the automotive industry in 2020.
While the x-axis was used to consider the occurrence (right-end) and non-occurrence (left-end)
of the first projections, the y-axis represented the occurrence (upper-end) and non-occurrence
(lower-end) of the corresponding second projection. Each of the four scenarios was jointly
developed and evaluated with regard to its probability of occurrence and potential
consequences for the five industry stakeholder groups during a workshop with local industry
experts on the campus of IIM, Bangalore.
Figure 4 illustrates four scenarios derived from matching the two Industry Environment
Projections for the political environment. According to the Delphi participants’ assessment of the
two Political Environment Projections, the “Costly & Dirty” scenario is the most probable to occur
– both projections were considered improbable. However, in a discussion of the study’s results
with industry experts, the scenarios “Green & Affordable” and “Cheap & Dirty” were rated with a
relatively higher probability to occur (30-40 %). Table 3 summarizes the main results of the
expert discussion and the main consequences of each scenario on the small car industry’s
stakeholders.

18
PP
2: “
Ha
rmo
niz
ati
on
of
Em
issi
on
s”
Hig
h
SCENARIO 1
20% Probability
“GREEN & EXPENSIVE”
SCENARIO 2
30-40% Probability
”GREEN & AFFORDABLE” L
ow
SCENARIO 3
10% Probability
“COSTLY & DRITY”
SCENARIO 4
30-40% Probability
”CHEAP AND DIRTY”
Low High PP1: “Reduced Tax Rates”
Figure 4: Political Environment Scenario Matrix

Scenarios for the Political Environment affecting the (Small Car) automotive industry in India 2020
19
Emission regulations are the same all over India following European standards and small cars are NOT fiscally preferred.
Customers A differentiation between urban and rural car buyers (or any other differentiation) is
necessary. The promotion of small cars will be difficult due to the required higher investments into
low-emission technology. Many low-income buyers might rather invest into other forms of mobility.
Social benefits from the status of owning a “Green” car might be gained for some buyer groups.
Customers have to face higher operating and maintenance costs. Suppliers The harmonized emission standards will require more investments into technology. Higher investments into clean technologies will increase the export potential for the
affected suppliers. OEMs Foreign OEMs have an advantage as they already own the necessary technologies while
domestic players might have higher R&D costs. However, many domestic players have access to the required technologies via collaborations or acquisitions.
All OEMs need to develop only one combined small car strategy for India and the Western markets.
The current collaboration level of OEMs and Associations in India will increase. The application of harmonized standards will improve the global image of the Indian
automotive industry. OEMs will have lower margins as R&D and other related costs to higher emission
standards will not be transferred to consumers. Government The Government of India can set a positive signal towards the global community by
pushing forward the harmonization of emission standards at a high level. On the other hand, the Government of India drives prices up in rural areas through the harmonization, which might not be understood by the rural population.
The Government of India will have to invest significantly to provide the required infrastructure, especially regarding the provision of the suitable petrol/diesel etc.
Society The ecological environment will benefit in the long-run through less emissions. The transportation infrastructure will be negatively affected through slowly growing
numbers of cars on the road leading to even more congestions especially in the urban areas. Moreover, the general availability of cheap small cars will make it even harder to further develop and promote public transportation in urban and rural areas.
Emission regulations are the same all over India following European standards and small cars are fiscally preferred.
Customers A differentiation between urban and rural car buyers (or any other differentiation) is
necessary. The promotion of small cars through tax benefits might only be marginal due to the
required higher investments into low-emission technology. Social benefits from the status of owning a “Green” car might be gained for some buyer
groups. Customers have to face higher operating and maintenance costs. Suppliers The harmonized emission standards will require more investments into technology. Reduced GST (and other taxes) are unlikely to significantly benefit suppliers. Higher investments into clean technologies will increase the export potential for the
affected suppliers. OEMs Foreign OEMs have an advantage, as they already own the necessary technologies while
domestic players might have higher R&D costs. However, many domestic players have access to the required technologies via collaborations or acquisitions.
All OEMs need to develop only one combined small car strategy for India and the Western markets.
The current collaboration level of OEMs and Associations in India will increase. The application of harmonized standards will improve the global image of the Indian
automotive industry while the reduced taxes will lead to higher sales of small cars leading to improved economies of scale
Government Decrease of tax revenues due to lower taxes for small cars might be partially
compensated by the higher number of small cars sold. The Government of India can set a positive signal towards the global community by
pushing forward the harmonization of emission standards at a high level. On the other hand, the Government of India drives prices up in rural areas through the harmonization which might not be understood by the rural population.
The Government of India will have to invest significantly to provide the required infrastructure, especially regarding the provision of the suitable petrol/diesel etc.
Society The ecological environment will benefit in the long-run through less emissions. The transportation infrastructure will be negatively affected through even higher
numbers of cars on the road leading to even more congestions especially in the urban areas. Moreover, the availability of cheap small cars will make it even harder to further develop and promote public transportation in urban and rural areas.

Scenarios for the Political Environment affecting the (Small Car) automotive industry in India 2020
20
Emission regulations in India are NOT following the higher European standards and small cars are fiscally NOT preferred.
Customers The demand for small cars is not specially promoted. Smaller consumer groups in urban areas might offer a niche for low-emission cars in
India. Suppliers The lower emission standards do not require additional investments into clean
technology development nor force domestic suppliers into collaborations with foreign players.
The missing investments into clean technologies will keep suppliers away from exporting to Western markets but might lead to interesting business opportunities in South-East Asia.
OEMs OEMs, if they want to export as well and increase their economies of scale, will have to
handle their operations with two different standards – the “Indian” and the “Western (e.g. European)” emission norms. This creates severe challenges to the supply chain, operations and supplier network management that might neutralize the benefits from the increased economies of scale.
All OEMs need to develop then different small car strategies for the high-emissions mass market in India and maybe South-East Asia, the low-emissions driven Western markets and the low-emission niche market in India.
In the short-to mid-term the margins and sales volume in India will be more attractive but the lower investments into technologies will affect the technological competitiveness of domestic OEMs in the long run.
Government Tax revenues stay stable and fuel the Government of India’s bank account. The Government of India faces significant pressure from the global community and
domestic “green” interest groups to follow “Western (e.g. European)” standards. Society The ecological environment will get affected in the long-run through more emissions. The transportation infrastructure will be slowly negatively affected through the
growing number of cars.
Emission regulations in India are NOT following the higher European standards and small cars are fiscally preferred.
Customers The promotion of small cars through tax benefits will lead to increased demand
especially in rural or semi-urban areas because consumers have the lowest possible buying and operating/maintenance costs.
Smaller consumer groups in urban areas might offer a niche for low-emission cars in India.
Suppliers The lower emission standards do not require additional investments into clean
technology development nor force domestic suppliers into collaborations with foreign players.
The missing investments into clean technologies will keep suppliers away from exporting to Western markets but might lead to interesting business opportunities in South-East Asia.
Reduced GST (and other taxes) are unlikely to significantly benefit suppliers. OEMs OEMs, if they want to export as well and increase their economies of scale, will have to
handle their operations with two different standards – the “Indian” and the “Western (e.g. European)” emission norms. This creates severe challenges to the supply chain, operations and supplier network management that might neutralize the benefits from the increased economies of scale.
All OEMs need to develop then different small car strategies for the high-emissions mass market in India and maybe South-East Asia, the low-emissions driven Western markets and the low-emission niche market in India.
In the short-to mid-term the margins and sales volume in India will be more attractive but the lower investments into technologies will affect the technological competitiveness of domestic OEMs in the long run.
Government Decrease of tax revenues due to lower taxes for small cars might be partially
compensated by the higher number of small cars sold. The Government of India faces significant pressure from the global community and
domestic “green” interest groups to follow “Western (e.g. European)” standards. The Government of India sets clear focus on cheap individual mobility despite the
existing traffic congestion problems and the impact on the ecological environment. Society The ecological environment will get affected in the long-run through more emissions. The transportation infrastructure will be negatively affected through even higher
numbers of cars on the road leading to even more congestions especially in the urban areas. Moreover, the availability of cheap small cars will make it even harder to further develop and promote public transportation in urban and rural areas.
Table 3: Political Environment Scenarios: Consequences for Industry Stakeholders

21
4.2 Reduced Tax Rates for Small Cars in 2020 (PP1)
The industry experts rate the average probability of the “Reduced Tax Rates” projection at 46 %
(cf. Table 4): the Government of India is not expected to implement a reduced Goods & Services
Tax (GST) rate for small cars. The experts are at odds regarding this judgment. Impact and
desirability are both considered high.
No Industry Environment Projections Probability Consensus Impact Desirability
1 (PP1) 2020: The GST for small cars in India is
a third of the tax rate for all other kinds of passenger cars
46% 32.5 3.4 3.3
Unlikely Strong Dissent
High High
Table 4: Political Industry Environment Projection PP1
The consensus analysis reveals that the experts slightly converge with their probability ratings
towards 40-60 % (cf. Figure 5) and two out of five experts do not expect the “Reduced Tax
Rates” projection to occur.
Reduced Tax Rates
0%
10%
20%
30%
40%
50%
60%
0% < 20% 20% < 40% 40% < 60% 60% < 80% 80% → 100%
Probability
Delp
hi P
art
icip
an
ts
Figure 5: Consensus Analysis for “Reduced Tax Rates” Projection PP1
4.2.1 Analysis of the Industry Expert’s Arguments on Projection PP1 (Reduced Tax Rates)
(PP1) 2020: The GST (Goods & Service Tax) for small cars in India is a third of the tax rate for all
other kinds of passenger cars
A reduced Goods & Service Tax (GST) exclusively for small cars is considered rather unlikely
(Probability 46 %), but with a strong dissent among experts (Consensus Distance: 32.5).

22
Probability
Given that the small car market in India is expected to continuously experience high compound
annual growth rates (CAGRs), the experts do not expect any governmental support in terms of
reduced tax rates to further boost this industry. Moreover, since a main idea of the GST is to
implement a single tax rate along several consumption areas and products, the Government of
India (GOI) does, according to the experts, not consider an exclusive treatment of small cars as
feasible. In addition, a reduced GST would most probably influence not only new car purchases,
but the domestic resale-market, too. The consequences of such a market intervention are highly
insecure and will probably lead to negative side effects that have not been considered yet.
However, the implementation of a reduced tax rate for a limited time frame of 5 years with a
moderate tax reduction (less than one third) might propel the industry according to some
experts. The GOI could benefit from additional tax revenues from the small car market since the
increase in demand could be high in both rural and urban areas. Therefore, a tax reduction could
balance or even increase total tax revenues due to higher sales volumes of small cars. Moreover,
subsidies via a reduced GST also support the automotive industry to achieve higher volumes and
might thereby increase affordability of small cars for a larger percentage of the Indian
population and make their domestically produced cars more competitive in other markets.
Another positive side effect of a reduced GST for small cars in 2020 is the potential motivation
for consumers to purchase car models with comparable lower fuel-consumption per mile.
Thereby, potential shortages in fuel imports can be counteracted proactively as well as overall
CO2 emissions per mile may be reduced. However, detailed calculations with respect to fuel
savings through cars with smaller engines as compared to the increased number of cars have to
be executed in the future.
Impact
According to some experts, a reduced tax rate for small cars can have a positive impact on a
sustainable industrial growth of India’s economy. The impact on the industry is thus considered
high among experts – especially manufacturers of small cars are expected to benefit significantly
from the reduced GST. Furthermore, the increase in new car registrations and total car
penetration rate in India is assumed to induce a further step for the development of the
domestic automotive industry’s competitiveness to finally aim for the international market.
Desirability
Since the GOI’s vision is to become a small car market hub, a reduced GST is highly desirable. An
implementation supports not only further growth of the small car segment but also affordability
for consumers. As mentioned, there might even be a positive environmental impact since small
cars have comparable lower emissions than large sedans.

23
4.2.2 Roadmap for Projection PP1 (Reduced Tax Rates)
Figure 6 illustrates the influences of different Industry Stakeholder Projections on the Industry
Environment Projection PP1 “GST Reduction” based on significant correlations identified by the
quantitative analysis using SPSS (cf. Appendix A). The potential influences on PP1 are structured
along the five stakeholder groups (Government, Customers, Suppliers, Industry, and Society).
Each arrow’s color in Figure 6 indicates the influence in respect of the Industry Environment
Projection’s probability (green for enabling; yellow for hindering).
PP1: 2020: The Government of India (GOI) has introduced a reduced GST for small cars.
An Analysis why it is unlikely to happen (PP1 Probability: 46 %)
Figure 6: Influences on Political Industry Environment Projection 1 (PP1)
Projections involved Enabling: SuP2, CoP1, GoP1 Hindering: CuP1, SuP3, GoP2, GoP3, SoP2 The following analysis is based on a quantitative correlation analysis as well as qualitative content
analysis between the Industry Environment Projection PP1 and all other projections of the study.
The roadmap draws on both the experts’ input and additional desktop research.

24
New car registrations in India experience impressive CAGRs and especially in metropolitan
areas the hitherto infrastructure capacity is often insufficient to cope with the rise in traffic. The
GOI (Government of India) is unable to cope adequately with the resulting rise in traffic
congestion and CO2 emissions. As a consequence, the society in the urban areas of India has
become more sensitive towards any kind of pollution (SoP2) and in general prefers to purchase
small cars due to their perceived lower emissions. Furthermore, the insufficient infrastructure
provision negatively affects the transportation sector and, as a result, the economic development
in general. The GOI thus experiences increased pressure especially from the manufacturing and
retail sector to improve the situation.
Therefore, the GOI not only clearly regulates the environmental impact of the production and the
lifecycle management for cars in India (GoP2) to achieve maximum efficiency but also
substantially invests in infrastructure development to alleviate the traffic situation in
metropolitan areas and Tier 1-3 cities (GoP3). In addition, the GOI introduces increased safety
standards for cars to lower the number and severity of traffic accidents as the Indian car buyers
are not sufficiently aware of the relatively low safety standards and features of the popular small
cars (CuP1) – as compared to trucks and buses. These new safety regulations enforce domestic
firms to invest in technological upgrading along the value chain (SuP3). However, the increased
infrastructure investments and the new regulations prove insufficient to manage the traffic and
emission situation in most metros and Tier 1-3 cities. The GOI has to acknowledge that this is
primarily due to the absolute number of cars on the streets. Although small cars produce
relatively lower emissions and may be preferred by many consumers, the GOI is therefore highly
unlikely to subsidize those purchases (PP1).
As a consequence, Indian automotive firms have to comply with new regulations (on
environment & safety). At the same time domestic suppliers are quite successful in technological
upgrading – they even are at par with their international competitors (SuP3). This enables
domestic suppliers to explicitly target foreign OEMs in order to benefit from potential growth
opportunities in the international market (SuP2). The global market seems additionally
attractive, since the GOI has introduced tax deductions on export profits (GoP1) in order to
incentivize domestic firms to compete on international level.
Overall, the GOI has a focus on the long-term competitiveness of the domestic industry – and
even funds public-private research centers to support technological upgrading (CoP1). This
again implies subsidies to support short-term domestic growth of new small car registrations to
be very unlikely (PP1).

25
4.3 Harmonization of Emission Standards (PP2)
The industry experts rate the average probability of the “Harmonization of Emission Standards”
projection at 47% (cf. Table 5): the Government of India is not expected to implement
standardized emission regulations all over India comparable to European norms. The experts
are at odds regarding this judgment. Impact and desirability are both considered high.
No Industry Environment Projections Probability Consensus Impact Desirability
2 (PP2) 2020: The emission regulations in all regions of India are the same as in Europe
47% 30 3.4 3.6
Unlikely Strong Dissent
High High
Table 5: Political Industry Environment Projection PP2
The consensus analysis reveals that the experts slightly converge with their probability ratings
towards 40-60 % (cf. Figure 7) and nearly two out of five experts do not expect the
“Harmonization of Emissions” projection to occur.
Harmonization of Emissions
0%
10%
20%
30%
40%
50%
60%
0% < 20% 20% < 40% 40% < 60% 60% < 80% 80% → 100%
Probability
Delp
hi P
art
icip
an
ts
Figure 7: Consensus Analysis for “Harmonization of Emissions” Projection PP2

26
4.3.1 Analysis of Expert’s Argument on Projection PP2
(PP2) 2020: The emission regulations in all regions of India are the same as in Europe.
A consistent nationwide upgrade of the emission regulations towards European standards is
neither considered probable (Probability: 47 %), nor do experts share a consensus (Consensus
Distance: 30.0) on this aspect.
Probability
A main concern is that the timeframe is too short since the GOI has not even been able to
harmonize the emission norms across the country so far. Besides, emission norms are in many
cases simply not abided to in India. The enormous geographical size makes India rather a
continent than a country, which seems to posit quite a few challenges. For example, fuel quality
also varies considerably among geographical regions.
Moreover, a raise of emission standards induces a rise in purchase prices due to more expensive
low-emission technologies – which the domestic automotive industry is not able to offer yet.
Therefore, the GOI is expected to prevent a harmonization of emission regulations with
European standards even though this might be desirable in terms of environmental protection
and potential increases in tax revenues (by taxing vehicles with higher emissions higher).
According to the experts, the GOI seems to be under pressure by civil and environmental
protection organizations which might lead to a change at least in the policy till 2020: Rising
environmental awareness obligates the GOI to reduce the gap to Euro-Norms at a rapid pace.
This is the opinion of a few experts. Historically, India is behind Europe on emission norms,
which were implemented in 1984 for the first time, followed by specifications for petrol vehicles
in 1991 and for diesel vehicles in 1992. Moreover, the GOI has already enforced emission
standards and aims to follow European standards and test procedures for cars. As of today,
many of the metropolitan cities have implemented Euro 4 and have additionally outlined a road
map for lowering emissions. In the long run, the GOI has no other option but to fortify
environmental regulations since also emerging economies will have to comply with
environmental norms as per WTO agreements. Furthermore, a future scarcity of natural
(energy) resources demands a sustainable perspective, which may also be emphasized by a
much stronger environmental awareness of India’s society.
Impact
In this respect, higher emission norms have a high impact on the vehicle production cost and
technological requirements due to the necessary utilization of advanced low-emission

27
technologies that are currently not yet locally produced. Customers may perceive an increase in
ownership quality although risen purchase prices place additional burdens on the majority of
car buyers that will by far outweigh the perceived contribution to “saving the planet”.
With regard to the domestic automotive industry, emission regulations towards European
standards imply substantial R&D investments at an early stage to achieve technological
upgrading in order to comply and to offer the required components and end products. Since this
may unveil potential growth opportunities in the global market, the GOI is likely to oblige the
domestic industry to invest a remarkable percentage of revenues in R&D – but thereby lowering
domestic firms’ margins for other investments. Domestic automotive firms are required to
change their entire positioning (e.g., product portfolio, manufacturing processes, and marketing
strategies).
The costs of technological development are a major concern for the industry and are estimated
to result in Joint Ventures, Alliances, or Mergers and Acquisitions. On the flipside, alternative
propulsion systems may be additionally promoted by the GOI to support the development of a
technological competitive domestic industry.
Desirability
Nevertheless, this outcome is highly desirable because the continuously increasing car
penetration rate induces more environmental pollution. It is considered essential to reduce
emissions per unit sold – at least. Furthermore, enforcing technological upgrading of the
domestic automotive industry at an early stage will support a positioning in the global car
market with high-quality Indian products.
4.3.2 Roadmap for Projection PP2
Figure 8 illustrates the influences on the “Harmonization of Emissions” Projection based on
significant correlations assessed by quantitative analysis (cf. Appendix A). The potential impacts
on PP2 are structured along the five stakeholder groups (Government, Customers, Suppliers,
Industry, and Society). Each arrow’s color in Figure 8 indicates the influence in respect of the
Industry Environment Projection’s probability (green for enabling; yellow for hindering).
PP2: 2020: The emission regulations in all regions of India are the same as in Europe.
An Analysis why it is unlikely to happen (PP2 Probability: 47 %)

28
Figure 8: Influences on Political Industry Environment Projection (PP2)
Projections involved Hindering: CuP2, SuP3, CoP2, GoP2, GoP3, SoP1; VP2, SP1, IP1, IP2
The following analysis is based on a quantitative correlation analysis as well as qualitative content
analysis between the Industry Environment Projection PP2 and all other projections of the study.
The roadmap draws on both the experts’ input and additional desktop research.
CO2 emissions in India are rising considerably due to the increase of industrial growth and
traffic. In the long-term, this may become a challenging aspect and the Government of India is
likely to experience pressure to take responsibility and implement strict environmental
regulations.
By 2020, the economic growth in India has continued at an impressive pace and has led to an
overall increase in the society’s wealth – but environmental pollution has risen as well. Due to an
early implementation of flexible labor laws, the GOI manages to support not only economic
growth but also the increase of society’s wealth (SoP1). India’s society has become increasingly
aware of environmental pollution and adapts a lifestyle towards a “Green Society” – even the
social acceptance of small cars depends on whether they comply with low-emissions standards

29
or not (SP1). Quite a few consumers are also willing to pay a higher price for a car to fit their
specific requirements via additional features, luxurious extras, fuel-efficiency, or a high safety
standard. Consequently, the small car market is clearly split into a low-cost/high-emission and a
high-cost/low-emission segment (CoP2).
In order to deliver the required high-quality (-technology) components, domestic suppliers have
to invest increasingly in technological upgrading (SuP3). In this context, the GOI realizes the
importance of human capital at an early stage and it ensures that the established education
system provides sufficient engineers to advance the domestic (automotive) industry’s
technological competence (IP1); domestic suppliers are able to succeed in their technological
upgrading and can compete on an international level (SuP3).
However, some of the domestic suppliers may lack financial capabilities and are tempted to
benefit from a strong integration into a foreign OEM’s domestic supplier network with respect to
technological spill-overs (VP2). In parallel, the considerable growth of the small car market has
intensified an overall shortage in resources; and the GOI acknowledges that this situation should
be improved by demanding higher efficiency in production and recycling. Besides, pressure from
international organizations has increased. As a result, the GOI implements an organization to
assure overall efficiency of production and life cycle of small cars – additionally regulating the
environmental impact (GoP2).
Furthermore, the GOI starts implementing a multi-modal passenger transportation system
(GoP3) and increases infrastructure investments (IP2) to ensure sufficient transportation
capacity required for further economic growth. Especially in metropolitan areas, inhabitants
benefit from these infrastructure investments. They perceive public transportation increasingly
as a convenient alternative to car ownership (CuP2).
Still, the GOI has so far been primarily driven by economic interests and not by society’s
environmental interests. The implementation of strict emission regulations is rather seen as a
hindrance for economic development and the GOI does not consider drastic steps required to
protect the environment – such as raising the emission regulations to European standards (PP2).

30
5 Scenario Development for the Economic Value Chain of India’s (Small Car) Automotive Industry in 2020
The economic perspective of the small car industry in India is examined in the light of the
market structures on OEM and supplier level. The first projection evaluates a dominant position
of foreign OEMs in the Indian small car market, whereas the second projection refers to the
establishment of proprietary domestic supplier networks. At first, both Value Chain Projections
are matched to create four scenarios for the economic value chain based on the input from the
scenario development workshop on IIM Bangalore campus. Then, each projection is analyzed
separately, integrating the various qualitative comments of the experts and subsequently
analyzing why each projection is expected to occur/not to occur in its respective ‘Roadmap’.
5.1 Economic Value Chain Scenarios
The two Value Chain Projections are combined as two axes in a coordinate system to sketch four
potential scenarios for the economic value chain of the automotive industry in 2020. While the x-
axis was used to consider the occurrence (right-end) and non-occurrence (left-end) of the first
projections, the y-axis represented the occurrence (upper-end) and non-occurrence (lower-end)
of the corresponding second projection. Each of the four scenarios developed was presented and
evaluated with regard to its probability of occurrence and potential consequences for the five
industry stakeholder groups during a workshop with local industry experts on the campus of
IIM, Bangalore.
Figure 9 illustrates four scenarios derived from matching the two Industry Environment
Projections for the economic perspective. According to the Delphi participants’ assessment of the
two Value Chain Projections, the “Foreign Rules & Exclusive Supply Chains” scenario is the most
probable to occur – both projections were considered probable. The likelihood of this scenario
was confirmed in a discussion of the study’s results with industry experts during the scenario
development workshop on IIM Bangalore campus (Probability for this scenario: 30-40 %),
followed by the scenarios “Exclusive Indian Clubs” and “Best-in-Class & Chance-for-All” being
rated with a lower probability to occur (15-20 %). Yet, it is recommended to consider the strong
dissent in the experts’ assessments especially for Industry Environment Projection VP2 (cf. Figure
12). Table 6 summarizes the main results of the expert discussion and the main consequences of
each scenario on the small car industry’s stakeholders.

31
VP
2: “
Ex
clu
siv
e S
up
pli
er
Ne
two
rks”
Hig
h
SCENARIO 1
15-20% Probability
“EXCLUSIVE INDIAN CLUBS”
SCENARIO 2
30-40% Probability
”FOREIGN RULES & EXCLUSIVE SUPPLY
CHAINS” L
ow
SCENARIO 3
10-20% Probability
“THE INDIAN WAY”
SCENARIO 4
15-20% Probability
”BEST-IN-CLASS & CHANCE FOR ALL”
Low High VP1: “Foreign Dominance”
Figure 9: Economic Value Chain Scenario Matrix

Scenarios for the Economic Value Chain affecting the (Small Car) automotive industry in India 2020
32
Foreign Automotive OEMs DO NOT dominate (< 25% market share) the Indian (small) car market and supply chains are proprietary.
Customers • Customers have a limited choice of products and features with respect to globally
advanced technologies. • The dominance of Indian OEMs makes the design and production of more India-specific
cars a viable business resulting in good “value for money” offers but not at the most advanced technological levels.
• The proprietary supply chains reduce price competition among suppliers making “value-for-money” are relatively more costly affair for customers.
Suppliers • Suppliers are strongly bound to “their” OEMs following them into the different
segments and markets that they cover. • There are no incentives for any significant investments into innovation (R&D) tying the
suppliers to the standardized components level where only high volumes are globally competitive. All other specific R&D for “their” OEMs will be financed through them and hence their Intellectual Property.
• Development of Indian supplier base depends completely on success of Indian OEMs in other markets such as South-East Asia.
OEMs • OEMs have a strong control over their proprietary supply networks influencing
technology and other investments at suppliers. The competition is rather limited to value-chain vs. value-chain making many suppliers vulnerable to mistakes made at OEMs regarding the selection of markets and models.
• The proprietary supply chains make it easier to invest into advanced quality control and risk management processes.
• Indian cars are globally not perceived as high-end making it difficult for Indian OEMs to offer luxury cars also in other markets (not considering the buy of already established brands such as Rover)
Government • The strong focus on the Indian market neglects the strong export potential for the
Indian automotive supplier industry especially in low volume-high customization market segments that are on the rise due to a stronger diversification of mobility needs and power/fuel alternatives. The Government of India provides substantial support for joint R&D projects to develop a strong supplier base at the systems level at par with global standards.
Society • The Indian society benefits from a wide network of automotive suppliers in India
offering similar products and consequently offering a lot of jobs. However, these jobs are not well paid due to lower productivity/value added than the job opportunities with a strong export market focus.
Foreign Automotive OEMs dominate (>75% market share) the Indian (small) car market and supply chains are proprietary.
Customers • Customers have faster access to cars with technology/quality at global standards. • Customers are keen to buy foreign brands as they offer more prestige at any price level. • The proprietary supply chains allow a clearer product/brand differentiation. Suppliers • The dependence (risk) of suppliers on a few OEMs per supply chain will increase. • Volume growth for highly efficient and quality-oriented suppliers is limited. • Technological development and investments depend on strategy of the supply chain
which is dominated by the respective OEMs. OEMs • Danger of creating complacency among OEMs towards the suppliers in their supply
chains. • Foreign OEMs dominating the market face potential resistance from the Swadeshi (self-
sufficiency) movement. • The uncertain technological environment (e.g. fuels, power train etc.) creates a strong
dependency on a few suppliers in the proprietary supply chain resp. increase the risk NOT to have the access to THE supplier providing THE technological lead.
• The foreign dominance of OEMs in India has degraded the Indian OEMs to explore rather markets in South-East Asia and the niche markets in rural and urban India.
Government • The Government of India benefits from the technology import and investments of
foreign OEMs into supplier development. • The Government of India also faces resistance from India-focused interest parties and
has to defend themselves why they have not provided enough support for indigenous OEMs.
Society • The Indian society benefits from a faster access to technology but might not develop the
required skills and capabilities to sustainably develop real “engineering research” competences at a globally competitive level.

Scenarios for the Economic Value Chain affecting the (Small Car) automotive industry in India 2020
33
Foreign Automotive OEMs DO NOT dominate (< 25% market share) the Indian (small) car market and supply chains are NOT proprietary.
Customers • Customers have a limited choice of products and features with respect to globally
advanced technologies. • The dominance of Indian OEMs makes the design and production of more India-specific
cars a viable business resulting in good “value for money” offers but not at the most advanced technological levels.
• The mixed supply chains create a certain level of brand diffusion similar to the recent issue of the Skoda Supreme vs. different Audi models.
Suppliers • Cost leadership strategies among suppliers dominate leading to a rat race towards
minimal margins. • Low margins prohibit any significant investments into innovation (R&D) tying the
suppliers to the standardized components level where only high volumes are globally competitive.
• Development of Indian supplier base depends completely on success of Indian OEMs in other markets such as South-East Asia.
OEMs • OEMs are in constant competition for the most competitive suppliers to create superior
value chains. However, most competitive is primarily connected to lowest cost making it difficult to leverage India as a global hub for small cars.
• The risk exposure regarding Tier 2 and Tier 3 suppliers in terms of constant quality is relatively high. Support in case of financial or technical problems for a single supplier is difficult as many competitors benefit from any engagement.
• Indian cars are globally not perceived as high-end making it difficult for Indian OEMs to offer luxury cars also in other markets (not considering the buy of already established brands such as Rover)
Government • The strong focus on the Indian market neglects the strong export potential for the
Indian automotive supplier industry especially in low volume-high customization market segments that are on the rise due to a stronger diversification of mobility needs and power/fuel alternatives. The Government of India provides substantial support for joint R&D projects to develop a strong supplier base at the systems level at par with global standards.
Society • The Indian society benefits from a fast access to technology but needs to improve its
project/process management capabilities as well as its ability to create advanced technological innovations.
Foreign Automotive OEMs dominate (>75% market share) the Indian (small) car market and supply chains are NOT proprietary.
Customers • Customers have faster access to cars with technology/quality at global standards and
can chose from a broader range of features for their cars. • Customers are keen to buy foreign brands as they offer more prestige at any price level. • The mixed supply chains create a certain level of brand diffusion similar to the recent
issue of the Skoda Supreme vs. Audi models. Suppliers • Highly competitive suppliers can grow relatively fast and link with different OEM
“groups” improving their cost situation through economies of scale and innovation investments through the diversification of risks.
• Indian suppliers will separate in two groups. Group 1 rather believes in the business potential of Indian OEMs. Group 2 rather believes in the business potential of foreign OEMs. Given the strong export potential group 2 is significantly larger. Group 1 focuses rather on smaller volumes but higher margins while group 2 bets on high volumes and accepts lower margins due to the global competition.
• Suppliers need to be more proactive in integrating/learning from best practices – management methods as well as technologies – than in proprietary supply chains.
OEMs • OEMs are in constant competition for the most competitive suppliers to create superior
value chains. • The risk exposure regarding Tier 2 and Tier 3 suppliers in terms of constant quality is
relatively high. Support in case of financial or technical problems for a single supplier is difficult as many competitors benefit from any engagement.
• Foreign OEMs are dominating the market but face potential resistance from the Swadeshi (self-sufficiency) movement.
• The foreign dominance of OEMs in India has degraded the Indian OEMs to explore rather markets in South-East Asia and the niche markets in rural and urban India.
Government • The lower costs in car production due to more competition results in more cars sold and
are likely to result in higher tax revenues. • The Government of India also faces resistance from India-focused interest parties and
has to defend themselves why they have not provided enough support for indigenous OEMs.
Society • The Indian society benefits from a fast access to technology but needs to improve its
project/process management capabilities as well as its ability to create advanced technological innovations.
Table 6: Economic Value Chain Scenarios: Consequences for Industry Stakeholders

34
5.2 Foreign Dominance of the Market (VP1)
The industry experts rate the average probability of the “Foreign Dominance” projection at 58 %
(cf. Table 7): foreign OEMs are expected to dominate the small car market in India. The experts
are at odds regarding this judgment. Impact on the industry is considered high, while
desirability is perceived as moderate.
No Industry Environment Projections Probability Consensus Impact Desirability
3 (VP1) 2020: Foreign automotive OEMs have more than a 75% market share of the small
car segment in India
58% 40 3.3 2.9
Likely Very Strong
Dissent High Medium
Table 7: Economic Industry Environment Projection VP1
The consensus analysis reveals that the majority of experts rated the probability above 60 % (cf.
Figure 10). However, one third of the experts assessed the “Foreign Dominance” probability at
40-60% while only one out of ten experts does not expect the projection to occur.
Foreign Dominance
0%
10%
20%
30%
40%
50%
60%
0% < 20% 20% < 40% 40% < 60% 60% < 80% 80% → 100%
Probability
Delp
hi P
art
icip
an
ts
Figure 10 : Consensus Analysis for “Foreign Dominance” Projection VP1
5.2.1 Analysis of Expert’s Argument on Projection VP1
(VP1) 2020: Foreign automotive OEMs have more than a 75 % market share of the small car segment in India
Industry experts consider it probable (58 %) that foreign automotive OEMs will dominate the
small car market in India but vary strongly in their assessment (Consensus Distance: 40.0).
Before starting the analysis it needs to be stated here that the experts disagreed in their
evaluation whether the JV between Maruti and Suzuki is to be seen as an Indian or a foreign

35
company. There exists the argument that Maruti-Suzuki is primarily perceived by the customers
as domestic company while other experts have argued that the 54 % majority of Suzuki makes it
a foreign company. Due to the fact that Maruti-Suzuki is a major player, the evaluation needs to
be done carefully.
Probability
In general, foreign firms are considered to further increase their shares in the Indian small car
market. Their advanced technologies are expected to contribute to acquisitions of additional
market shares, because the domestic automotive industry is neither geared for creative designs,
nor technologically as mature as companies from industrialized countries. Besides, the general
technological disadvantage of Indian firms indicates a declining entry-rate of new domestic
players.
In this respect, domestic OEMs have to re-consider their product development process: In spite
of not testing their products at the customers’ expense, they might consider to conduct pre-tests
before launching new models. This might increase domestic OEMs’ image since their technology
reputation is currently considered as disadvantageous to foreign OEMs. In addition, a
reconfiguration of development processes might accelerate technological development.
According to the experts this is a major challenge for most domestic automotive companies
(except for TATA).
Technological upgrading will become even more challenging as foreign OEMs have started
developing and designing small cars in India - for India. Foreign automotive firms invest in India
to produce small cars because they have realized that India has an emerging middle class with a
growing demand for small cars and the potential to export to nearby markets. Multinational
enterprises (MNEs) such as Ford, Hyundai, GM, Fiat, Suzuki, Honda, and Hyundai offer – or have
expressed strong interests to offer – low-priced small cars designed for India in India. Foremost
Toyota, Nissan, and VW are expected to become big players in the small car segment in India.
Especially since India’s attractiveness as a location to produce goods for exports has risen,
foreign OEMs (Chinese, Japanese, and European) consider setting up large manufacturing
facilities. India is more and more strategic relevant as a hub for small car development and
production.
However, even though foreign OEMs intend to fulfill the specific requirements of Indian
consumers, they still have a long way to go. For example, the large rural markets are yet to be
penetrated and foreign OEMs have to considerably reduce their value-creation costs in order to
profit not solely from demand in metropolitan areas. Therefore, the Tata Nano is expected to
dominate the small car segment in the upcoming three to five years if the current problems are
overcome. Besides, Indian OEMs like Tata and Maruti(-Suzuki) will continue to be the major

36
players in the mass volume market in the entry level segment and even new players such as
Bajaj and Mahindra are considered to gain prominence in the future. According to some of the
experts they will have a significant share of the small car market. In the long run. Some experts
also clearly state that the domestic automotive industry will upgrade their (technological)
competencies and will significantly increase their competitiveness – some of them already profit
from their pan-India presence in comparison to foreign OEMs’ distribution networks.
Impact
A strong presence of foreign OEMs will have a high impact on the Indian automotive industry
because of intensified competition, an increase in demand for advanced technologies, and,
consequently, a continuous focus of the Indian industry on R&D. Domestic firms may profit from
potential technological spill-overs, especially in the areas of safety, low emission, and high fuel-
efficiency – the automotive supplier industry being the major beneficiary.
Foreign firms are expected to not introduce the latest innovative technology in India but rather
to invest substantially in manufacturing facilities and thereby create employment opportunities:
Foreign OEMs are expected to seriously consider leveraging their production capacities in India
and thereby additionally strengthen domestic demand.
Desirability
The desirability of this outcome is moderate. A fact that does not come unexpected as the
majority of experts is of Indian origin working for domestic companies. To ensure their future
position in the small car market, domestic automotive firms are expected to invest substantial
efforts to achieve technological upgrading. If the GOI additionally encourages foreign players to
invest in India – to leverage additional employment opportunities especially also including
export – technological competition might be intensified for domestic firms even more.
According to the experts, Indian consumers will benefit from technological innovations
developed by foreign OEMs through: global technology specifically designed for India. Small car
buyers will be able to choose from a large range of additional features. Changing consumer
preferences and requirements might lead to rising profit margins in the high volume market,
and consequently increase India’s overall attractiveness for foreign OEMs – some experts argue.
India may consequently develop towards a small car R&D and production hub characterized
rather by high-end technologies than by low quality or solely high volumes.
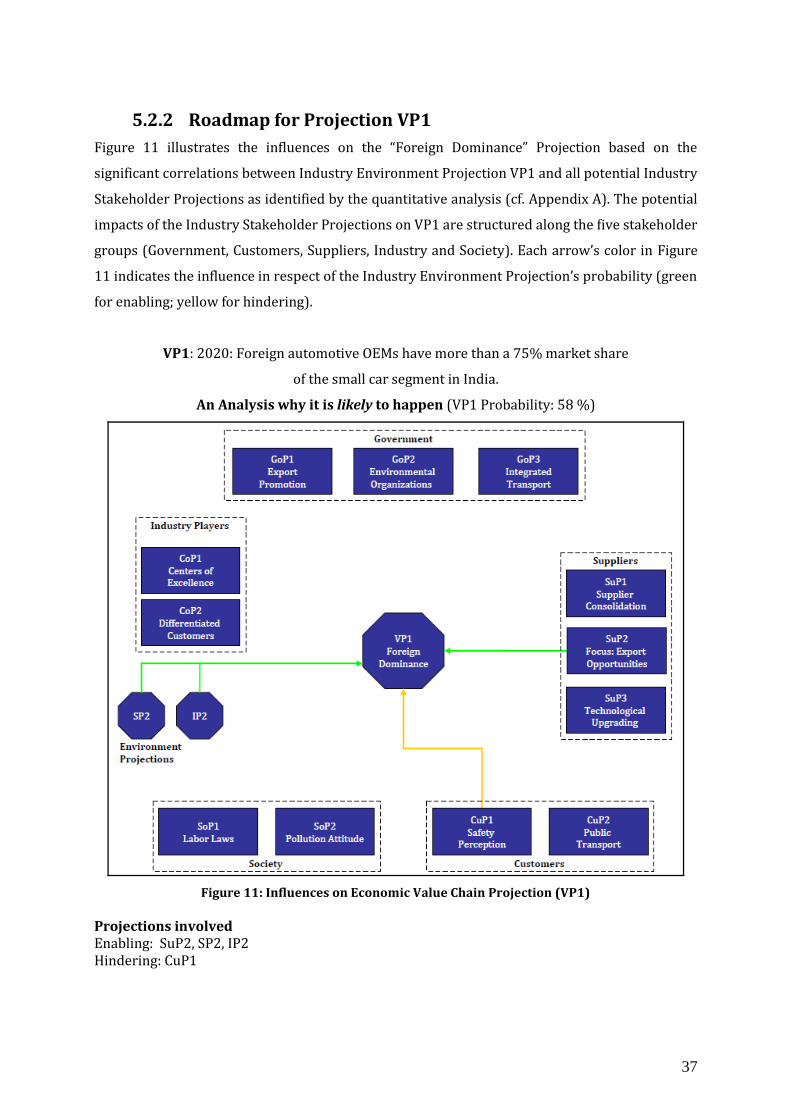
37
5.2.2 Roadmap for Projection VP1
Figure 11 illustrates the influences on the “Foreign Dominance” Projection based on the
significant correlations between Industry Environment Projection VP1 and all potential Industry
Stakeholder Projections as identified by the quantitative analysis (cf. Appendix A). The potential
impacts of the Industry Stakeholder Projections on VP1 are structured along the five stakeholder
groups (Government, Customers, Suppliers, Industry and Society). Each arrow’s color in Figure
11 indicates the influence in respect of the Industry Environment Projection’s probability (green
for enabling; yellow for hindering).
VP1: 2020: Foreign automotive OEMs have more than a 75% market share
of the small car segment in India.
An Analysis why it is likely to happen (VP1 Probability: 58 %)
Figure 11: Influences on Economic Value Chain Projection (VP1)
Projections involved Enabling: SuP2, SP2, IP2 Hindering: CuP1
38
The following analysis is based on a quantitative correlation analysis as well as qualitative content
analysis between the Industry Environment Projection VP1 and all other projections of the study.
The roadmap draws on both the experts’ input and additional desktop research.
Today, the main purchasing criteria for small car buyers in India are vehicle price and
functionality rather than vehicle safety or emissions: Customers have a tendency to relinquish
additional safety and environmental features for a lower purchase price. This may be due to the
fact that consumers are not well informed on safety and environmental issues – or they leave
this to the gods.
In 2020, Indian consumers might be still not well informed in terms of traffic safety or emission
standards. For example, the majority of small car buyers are expected to perceive the safety of
small cars comparable to large passenger cars (CuP1). Thus, Indian consumers may still question
why to pay an extra charge for higher safety standards of foreign OEMs’ small cars.
Nonetheless, the Government of India (GOI) has adapted to the rising number and severity of
traffic accidents. On the one hand, the GOI invests substantially in the transportation
infrastructure (IP2) to enhance its capacity as a counter measurement to crowded roads and
traffic congestion. On the other hand, the GOI implements higher safety standards for small cars
in order to alleviate severity of traffic accidents (CuP1). Consequently foreign OEMs benefit as
they already possess the safety technologies demanded (and comply with tighter emission
standards) – if the Indian car buyer is willing to pay for it.
With the Indian consumers’ main purchasing criterion shifting away from solely purchase prices
to “Total Cost of Ownership” (TCO = Purchase Cost + Maintenance Cost – Resale Value), many
have realized that foreign cars do have an attractive TCO in comparison to domestic brands
(SP2), despite higher initial prices.
Equally, the domestic supplier industry has realized foreign OEMs competitiveness and
attractiveness: They prefer foreign OEMs since they want to benefit from their technological
know-how as well as their high global market volumes and potential growth opportunities
(SuP2). Thus, foreign OEMs possess a convenient bargaining position and benefit from attractive
prices for domestic suppliers’ components.
Altogether, foreign OEMs are likely to dominate the small car market in India (VP1).

39
5.3 OEMs and their Exclusive Supplier Networks (VP2)
The industry experts rate the average probability of the “Exclusive Supplier Networks”
projection at 52 % (cf. Table 8): OEMs are expected to have proprietary domestic supplier
networks in India. The experts are at odds regarding this judgment. Impact on the industry is
considered high, while desirability is perceived as moderate.
No Industry Environment Projections Probability Consensus Impact Desirability
4 (VP2) 2020: Each automotive OEM has its proprietary domestic supplier network in
India
52% 35 3.5 3
Likely Strong Dissent
High Medium
Table 8: Economic Industry Environment Projection VP2
The consensus analysis reveals that the experts slightly converge with their Probability ratings
towards 40-60 % (cf. Figure 12). Yet, almost every second expert assessed the probability of
“Exclusive Supplier Networks” at above 60 % while one out of four experts does not expect the
projection to occur.
Exclusive Supplier Networks
0%
10%
20%
30%
40%
50%
60%
0% < 20% 20% < 40% 40% < 60% 60% < 80% 80% → 100%
Probability
Delp
hi P
art
icip
an
ts
Figure 12 : Consensus Analysis for “Exclusive Supplier Networks” Projection VP2

40
5.3.1 Analysis of Expert’s Argument on Projection VP2
(VP2) 2020: Each automotive OEM has its proprietary domestic supplier network in India
The experts expect OEMs to have proprietary domestic supplier networks in India (Probability
52 %), although they are at odds regarding this judgment (Consensus Distance: 35.0) - meaning
that many either argue for a very low or rather high probability.
Probability
According to the Delphi study participants, the paradigm to „buy, where you build, where you
sell” is considered to become an inherent part of foreign OEMs’ strategies in India. In general,
most OEMs have a regular set of suppliers, today, and first tendencies towards exclusive OEM-
supplier bondages can be observed: Especially Hyundai, Honda, and Toyota encourage their own
dedicated suppliers from their other production locations to enter the Indian market. Given that
Indian suppliers do not have the resources to cope with the testing needs requested by foreign
OEMs – there are only few independent testing facilities with sufficient integrity – supplier
integration seems quite inevitable referring to aspects of technological competence and
intellectual property rights (IPR).
From a supplier’s perspective, having an exclusive relationship between OEMs and suppliers
may sound convincing, as well: The OEM ensures its suppliers commercial viability to increase
the attractiveness of remaining exclusively within the proprietary supplier network. As the
experts argue, especially for foreign OEMs such a proprietary supplier network supports
safeguarding IPR. Otherwise, foreign OEMs’ reservations to share critical proprietary technology
with suppliers may remain high.
On the other hand, many experts provide arguments against such a case. From an OEM’s
perspective, they argue, tighter supplier integration might still imply risks since access to
technological know-how, and hence IPRs, are trusted to the complete domestic supplier
network. It rather seems attractive for an OEM to benefit from suppliers’ higher volumes. And
the car component industry strongly thrives on its volumes. No supplier is considered to tie up
with one OEM exclusively, because such relationship results in high costs due to limited
volumes. Besides, the insufficient volumes of a single OEM in India indicate low profit margins
for his upstream value chain partners. Consequently, OEMs may consider sharing suppliers in
order to enhance economies of scale, thereby reducing procurement costs for the whole industry
in India.
Moreover, the domestic industry has a high capacity for component production and domestic
players show large efforts in their technological development. Therefore, the domestic supplier
industry regards commitments to exclusive relationships as potential restrictions for any future

41
endeavors. As most experts argue, the strategy is rather to have a wider customer base to reduce
potential business risks than to reduce flexibility and to risk a loss of competitiveness.
Except for a few foreign players (mainly Korean and Japanese), most OEMs (domestic and
foreign) are therefore not expected to depend on proprietary supply networks – most suppliers
will be global players or fast growing domestic entities.
Impact
The overall impact of exclusive OEM-supplier relationships on the automotive industry in India
is considered high: Domestic suppliers will have to consider Joint Ventures or technology
licensing to ensure commercial viability, although licensing implies immediate increases in
expenses. Domestic firms with an exclusive focus on India will be under duress since they lack
the financial capabilities for the required investments as well as to ensure sufficient efforts in
R&D on their own – the domestic supplier industry is expected to go through a consolidation
process.
Other experts argue that with OEMs not being reluctant to risk high initial efforts for the
development of exclusive suppliers, they will benefit from assured supply of high quality
components. As a consequence of the mutual dependency, both parties will develop trust in each
other and will be committed to the exclusive relationship. If the suppliers remain viable over
time, they are assumed to become strong partners and will add considerable value to the OEM’s
future growth.
On the flipside, suppliers would strongly depend on their OEM’s success: A decrease in the
OEM's sales volume would have a direct impact on the performance of the associated domestic
supply network. Furthermore, OEMs would earn a convenient bargaining position and could
gain beneficial procurement terms for high quality components.
Desirability
The desirability of this Industry Environment Projection is moderate. At first glance, primarily
OEMs seem to benefit from a proprietary supplier network. The exclusive relationship
encourages strong bondages on both sides and increases suppliers’ motivation to deliver
components with a consistent quality. In return, suppliers claim to be responsible for a large
range of an OEM’s procurement parts in order to ensure their own growth path. Given that
variations in the quality of supplied components are minimized, OEMs benefit from an
accompanied quality improvement of the manufactured vehicles.
On the flipside, some experts expect a supplier integration to reduce competition among
suppliers and hence hinder the domestic supplier industry from further maturation. An
integration into an OEM’s domestic supplier network is further believed to increase average

42
component prices due to lower volumes which may result in unnecessary expenses – given the
focus is on the domestic market.
Overall, the domestic supplier industry’s consolidation and integration process is expected to
differentiate the “best from the good”, thereby contributing to the potential to export on a global
scale.
5.3.2 Roadmap for Projection VP2
Figure 13 illustrates the influences on the “Exclusive Supplier Networks” Projection based on
significant correlations assessed by quantitative analysis (cf. Appendix A). The potential impacts
on VP2 are structured along the five stakeholder groups (Government, Customers, Suppliers,
Industry, and Society). Each arrow’s color in Figure 13 indicates the influence in respect of the
Industry Environment Projection’s probability (green for enabling; yellow for hindering).
VP2: 2020: Each automotive OEM has its proprietary domestic supplier network in India.
An Analysis why it is likely to happen (VP2 Probability: 52 %)
Figure 13: Influences on Economic Value Chain Projection (VP2)
Projections involved Enabling: GoP1, PP2, SP2, IP2 Hindering: SoP2

43
The following analysis is based on a quantitative correlation analysis as well as qualitative content
analysis between the Industry Environment Projection VP2 and all other projections of the study.
The roadmap draws on both the experts’ input and additional desktop research.
As of now, the number of new car registrations in India is exploding and particularly the small
car market is still expected to experience considerable growth in the years to come. Many firms
continue to enter the market with new or additional models to profit from its growth, resulting
in a market fragmentation.
Inevitable side effects of the rising car penetration rate are traffic congestions and
environmental pollution. Consequently, the Government of India invests in infrastructure
development projects (IP2) and introduces nation-wide emission regulations comparable to the
European standards (PP2).
Whereas the GOI is obliged to do so, the Indian society by itself has become quite sensitive
towards environmental aspects (SoP2). However, referring to the small car market, consumers’
purchase decisions are influenced by rational criteria such as TCO (Total Cost of Ownership)
rather than by low CO2 emissions (SP2) – the latter is seen to induce obligatory additional costs.
Nevertheless, small cars will have to comply with the higher environmental standards in India
and thus require low-emission components. Since domestic firms are not able to supply the
technologies required, integrations into proprietary supplier networks are likely to improve
technological competence (VP2).
The integration into a foreign OEM’s proprietary supplier network is additionally attractive
since the GOI has introduced tax deductions on export profits (GoP1). Integrated domestic firms
may benefit from potential growth opportunities in the international market via the foreign
OEMs or by technological upgrading as they gain technological know-how.
By and large, the GOI’s target is to attract foreign investments and develop India to a small car
market hub while implementing a sustainable mobility strategy.

44
6 Scenario Development for the Social Environment of India’s (Small Car) Automotive Industry in 2020
The social environment is examined with respect to major trends in society as well as relevant
buying criteria for consumers in India. The first projection suggests a strong environmental
awareness of India’s society, which influences purchasing behavior in the small car market,
amongst others. The second projection asserts that the main purchasing criterion in the small
car segment derives from “Total Cost of Ownership” calculations. At first, both social projections
are matched to create four scenarios for the socio-cultural environment based on the input from
the scenario development workshop on IIM Bangalore campus. Then, each Industry Environment
Projection is analyzed separately, integrating the various qualitative comments of the experts
and subsequently analyzing why each projection is expected to occur/not to occur in its
respective ‘Roadmap’.
6.1 Social Environment Scenarios
The two Social Environment Projections are combined as two axes in a coordinate system to
sketch four potential scenarios for the socio-cultural environment of the automotive industry in
2020. While the x-axis was used to consider the occurrence (right-end) and non-occurrence
(left-end) of the first projections, the y-axis represented the occurrence (upper-end) and non-
occurrence (lower-end) of the corresponding second projection. Each of the four scenarios
developed was presented and evaluated with regard to its probability of occurrence and
potential consequences for the five industry stakeholder groups during a workshop with local
industry experts on the campus of IIM, Bangalore.
Figure 14 illustrates four scenarios derived from matching the two Industry Environment
Projections for the social environment. According to the Delphi participants’ assessment of the
two Social Environment Projections, the “Cheap & Mean” scenario is the most probable to occur
since a shift in customers’ preferences towards a reasonable car was assessed ‘likely’ whereas an
increasing environmental consciousness was assessed ‘unlikely’. However, in a discussion of the
study’s results with industry experts during the scenario development workshop on IIM
Bangalore campus, the scenarios “Cheap & Green” and “Green & Ready to Pay” were rated with a
relatively higher probability to occur (30-40 % and 40-50 % respectively). “Green & Ready to
Pay” being the most likely scenario according to the experts’ discussion is astonishing, since it is
the opposite scenario to “Cheap & Mean” (the most probable scenario according to the results of
the Delphi panel). Table 9 summarizes the main results of the experts’ discussion during the
scenario development workshop on IIM Bangalore campus and the main consequences of each
scenario on the small car industry’s stakeholders.

45
SP
2: “
Re
aso
na
ble
ca
rs”
Hig
h
SCENARIO 1
15% Probability
“CHEAP & MEAN”
SCENARIO 2
30-40% Probability
”CHEAP & GREEN” L
ow
SCENARIO 3
10% Probability
“MEAN & EXPENSIVE”
SCENARIO 4
40-50% Probability
”GREEN & READY TO PAY”
Low High SP1: “Green Society”
Figure 14: Social Environment Scenario Matrix

Scenarios for the Social Environment affecting the (Small Car) automotive industry in India 2020
46
Customers’ choice is driven by the lowest price offer only while the Society does NOT focus on the emission level of cars to a large extent.
Customers • Customers focus in their car selection predominately on the lowest cost model. Safety
features or low-emission engines are not decisive criteria. Suppliers • Suppliers are under immense cost pressure as technological advancements are not
honored by customers. • There are no incentives for any significant investments into innovation (R&D) tying the
suppliers to the standardized components level where only high volumes are globally competitive.
OEMs • OEMs face strong cost pressure from customers resulting in low margins. • Global or India-specific Innovations are seldom as consumers to not ask for it nor are
they ready to pay if offered. • Indian cars are globally not perceived as high-end making it difficult for Indian OEMs to
export. Government • The Government of India experiences some pressure from outside regarding the
missing green attitude in India, but does not really perceive this as an actual threat. Society • The Indian society is overflowed with cheap and dirty cars resulting in severe traffic
congestions and increased air pollution levels in the metros and tier 1 cities.
Customers’ choice is driven by the lowest price offer while the Society accepts only low-emission cars.
Customers • Car buyers focus on low TCO for their (small) cars. • Other buying criteria such as safety or low-emissions play a much less important role in
the purchasing decision process. Suppliers • Suppliers experience a strong cost pressure because only low-price components find
their way into the mass market models of the OEMs. • Suppliers experience increasing pressure from different interest groups to reveal their
contribution to low-emission standards in new car models. OEMs • The margins of OEMs are low due to the strong price focus of the major consumer
groups. • OEMs serving different consumer groups in rural and urban areas experience problems
to generate higher margins for their high-end car models. • OEMs NOT being “known” as driven by low-emission standards face potential
resistance from different stakeholder groups such as NGOs, local political parties etc. Government • The Government of India has the choice
A) to put further pressure on OEMs and suppliers regarding low-emission standards and showcase this engagement on the international stage such as Climate Conferences etc.
B) to create a stronger awareness among the Indian population that the cheapest or lowest price for cars is not always the best choice if safety and environment etc. are not considered.
C) to let the market mechanisms decide. Society • A large part of the society considers environmental issues as important but still most
car purchases are made on lowest cost considerations creating tensions within the society.
• Low-emission cars might develop as new status symbols at any income level.
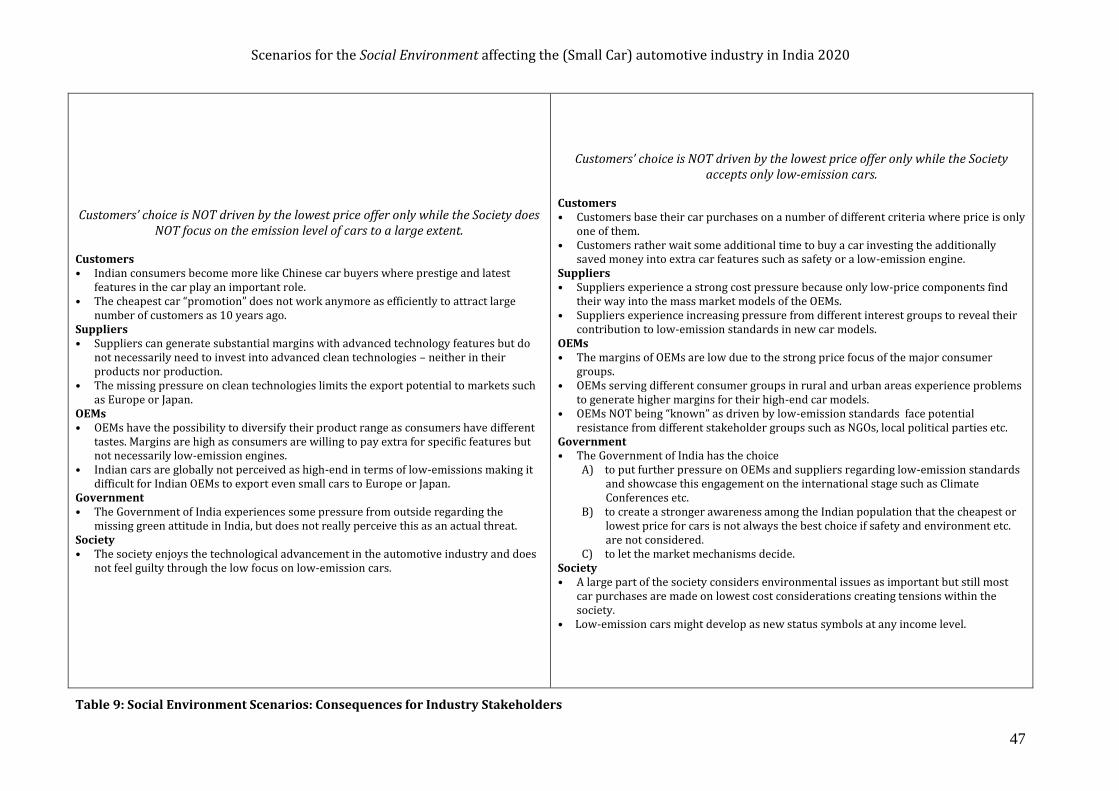
Scenarios for the Social Environment affecting the (Small Car) automotive industry in India 2020
47
Customers’ choice is NOT driven by the lowest price offer only while the Society does NOT focus on the emission level of cars to a large extent.
Customers • Indian consumers become more like Chinese car buyers where prestige and latest
features in the car play an important role. • The cheapest car “promotion” does not work anymore as efficiently to attract large
number of customers as 10 years ago. Suppliers • Suppliers can generate substantial margins with advanced technology features but do
not necessarily need to invest into advanced clean technologies – neither in their products nor production.
• The missing pressure on clean technologies limits the export potential to markets such as Europe or Japan.
OEMs • OEMs have the possibility to diversify their product range as consumers have different
tastes. Margins are high as consumers are willing to pay extra for specific features but not necessarily low-emission engines.
• Indian cars are globally not perceived as high-end in terms of low-emissions making it difficult for Indian OEMs to export even small cars to Europe or Japan.
Government • The Government of India experiences some pressure from outside regarding the
missing green attitude in India, but does not really perceive this as an actual threat. Society • The society enjoys the technological advancement in the automotive industry and does
not feel guilty through the low focus on low-emission cars.
Customers’ choice is NOT driven by the lowest price offer only while the Society accepts only low-emission cars.
Customers • Customers base their car purchases on a number of different criteria where price is only
one of them. • Customers rather wait some additional time to buy a car investing the additionally
saved money into extra car features such as safety or a low-emission engine. Suppliers • Suppliers experience a strong cost pressure because only low-price components find
their way into the mass market models of the OEMs. • Suppliers experience increasing pressure from different interest groups to reveal their
contribution to low-emission standards in new car models. OEMs • The margins of OEMs are low due to the strong price focus of the major consumer
groups. • OEMs serving different consumer groups in rural and urban areas experience problems
to generate higher margins for their high-end car models. • OEMs NOT being “known” as driven by low-emission standards face potential
resistance from different stakeholder groups such as NGOs, local political parties etc. Government • The Government of India has the choice
A) to put further pressure on OEMs and suppliers regarding low-emission standards and showcase this engagement on the international stage such as Climate Conferences etc.
B) to create a stronger awareness among the Indian population that the cheapest or lowest price for cars is not always the best choice if safety and environment etc. are not considered.
C) to let the market mechanisms decide. Society • A large part of the society considers environmental issues as important but still most
car purchases are made on lowest cost considerations creating tensions within the society.
• Low-emission cars might develop as new status symbols at any income level.
Table 9: Social Environment Scenarios: Consequences for Industry Stakeholders

48
6.2 Green Society (SP1)
The industry experts rate the average probability of the “Green Society” projection at 44% (cf.
Table 10): India’s society is not expected to be primarily driven by emission considerations and
other environmental concerns with respect to private transportation. The experts share a
moderate consensus regarding this judgment. Impact and desirability are both considered high.
No Industry Environment Projections Probability Consensus Impact Desirability
5
(SP1) 2020: Small cars are only socially accepted as a means of transportation if they
fulfill the strictest emission standards in India
44% 20 3.4 3.5
Unlikely Moderate Consensus
High High
Table 10: Social Industry Environment Projection SP1
The consensus analysis reveals that the experts converge with their probability ratings towards
40-60 % (cf. Figure 15) and one out of three experts does not expect the “Green Society”
projection to occur.
Green Society
0%
10%
20%
30%
40%
50%
60%
0% < 20% 20% < 40% 40% < 60% 60% < 80% 80% → 100%
Probability
Delp
hi P
art
icip
an
ts
Figure 15: Consensus Analysis for “Green Society” Projection SP1

49
6.2.1 Analysis of Expert’s Argument on Projection SP1
(SP1) 2020: Small cars are only socially accepted as a means of transportation if they fulfill the
strictest emission standards in India
The experts moderately agree (Consensus Distance: 20.0) that a substantial increase of
environmental awareness in India’s society is not probable (Probability 44 %).
Probability
Foremost, the time horizon is too optimistic to derive such a fundamental change in attitude. The
magnitude of this shift can be illustrated by the hitherto insufficient understanding of the actual
objectives and implications of emission standards – especially in rural India.
According to the experts, in an optimistic case India’s society is twofold even in 2020. Only a
small minority is emphasizing low-emissions and other environmentally sensitive issues of
automobiles. That is, the majority of India’s society is not expected to become more
“environment fist- then cost-conscious” within the next decade. Current and potential buyers of
small cars value rather a low purchase price or a fairly good overall performance instead of low-
emission technologies. Main purchase criteria for cars are total costs or customer service; most
customers emphasize a car’s fuel efficiency in their preferences due to lower operating costs.
Moreover, a more “environment first-then-cost conscious” Indian society is unlikely to reflect
upon purchasing behavior since the majority of consumers does not care about social
acceptance.
Consequently, the implementation of strict emission standards by the GOI is regarded as a
necessary first step towards the establishment of the society’s environmental awareness:
According to the Delphi participants, law may take precedence over social preference. And there
is no doubt that the importance of emission standards will be high in order to reduce
environmental pollution.
Still, the steady economic growth of India contributes to an increase of society’s wealth and it is
aspired that people become more sensitive about environmental issues. With the persistent
growth of an educated middle class and high media attention, environmental awareness is
expected to gain momentum.
The experts also agree that environmental consciousness will be higher in urban then in rural
areas. It will be initially effused by the legislative rather than by people-led green initiatives.
Impact
The impact of a green society is considered to be high, because the automotive industry is surely
required to fit costumers’ requirements first. Especially the domestic automotive firms have to

50
continuously invest in R&D, thereby contributing to an improvement of the domestic industry’s
innovativeness and competitiveness.
The use of high-technology components implies a risen purchase price for small cars, too.
However, this may not necessarily be a challenge: Once consumers desire low-emission
technology, they may also accept the higher price – as long as they can afford it. Consequently,
not only the probability of this projection, but also its impact depends strongly upon the
development of society’s wealth.
Desirability
All in all, the outcome of an increased environmental awareness in India is considered as highly
desirable: The necessary compliance with customers’ requirements increases R&D efforts. In
combination with public-private efforts on “high end” research in automotive core technologies,
increasing R&D efforts in environment-friendly technologies is a first sound step in order to
support the Indian automotive industry’s exports and positioning in the global market.
6.2.2 Roadmap for Projection SP1
Figure 16 illustrates the influences on the “Green Society” Projection based on significant
correlations assessed by quantitative analysis (cf. Appendix A). The potential impacts on SP1 are
structured along the five stakeholder groups (Government, Customers, Suppliers, Industry, and
Society). Each arrow’s color in Figure 16 indicates the influence in respect of the Industry
Environment Projection’s probability (green for enabling; yellow for hindering).
SP1: 2020: Small cars are socially accepted as a means of transportation
when fulfilling the strictest emission standards in India.
An Analysis why it is unlikely to happen (SP1 Probability 44 %).

51
Figure 16: Influences on Social Industry Environment Projections (SP1)
Projections involved Enabling: SP2 Hindering: CuP1, CuP2, CoP2, SoP1, SoP2, PP2
The following analysis is based on a quantitative correlation analysis as well as qualitative content
analysis between the Industry Environment Projection SP1 and all other projections of the study.
The roadmap draws on both the experts’ input and additional desktop research.
Although today a main purchase criterion in India is a vehicle’s price, in the long-term
environmental concerns such as low-emissions of a vehicle may rise due to the severity of
environmental pollution especially in metros and larger cities of India.
Until 2020, as a side effect of the rapid economic growth in India, environmental pollution will
have risen and, thereby, increased society’s sensitivity towards emissions caused by traffic
(SoP2). However, the majority of small car buyers is still not willing to pay a higher price for
low-emission technology, but does value extra features or specific brands to a certain extend.
Consequently, OEMs serve differentiated customer groups (CoP2); but the small car market
segment with low-emission technology is of little relevance.

52
The specific requirements of the Indian consumer are reflected by the absent demand of safety
features due to a low perception of safety requirements or differences between small and large
passenger cars (CuP1). Fortified emission regulations in India (PP2) are placing a burden for the
majority of consumers rather than increasing their willingness to pay more for low-emission
technology. Even though this may change over time – and the GOI is likely to implement
minimum safety standards for cars – consumers are still reluctant to pay the higher purchase
price because the majority’s income does not allow for such “unnecessary” features.
In most metropolitan areas, traffic congestions increase due to risen car penetration rates. More
and more people prefer public transportation. This alternative to individual transportation
becomes even more attractive as the GOI starts to invest significantly in public transportation
infrastructure (CuP2).
Despite the ongoing economic growth, the majority of India’s population still belongs to low-
income groups – a high income disparity exists. The flexible labor laws did increase wages and
wealth of employees, but were a drop in the ocean (SoP1). Most people still concern “value-for-
money” as a main purchasing criterion for consumption. Therefore, especially in the small car
segment with buyers having rather low income, TCO (Total Cost of Ownership) play a more
important role (SP2) than costly low-emission technologies (SP1).
6.3 Reasonable Cars (SP2)
The industry experts rate the average probability of the “Reasonable Cars” projection at 59% (cf.
Table 11): India’s customers are expected to be primarily price-driven in their small car
purchases. The experts are moderately at odds regarding this judgment. Impact on the industry
is considered high, while desirability is perceived as moderate.
No Industry Environment Projections Probability Consensus Impact Desirability
6
(SP2) 2020: The only buying criteria for small cars in India is their “TCO” (Total Cost
of Ownership = Purchase Cost + Maintenance Cost – Resale Value)
59% 25 3.4 2.9
Likely Moderate
Dissent High Medium
Table 11: Social Industry Environment Projection SP2
The consensus analysis reveals that almost every second expert assessed the probability of
“Reasonable Cars” at above 60 % and only one out of ten experts does not expect the projection
to occur (cf. Figure 17).

53
Reasonable Cars
0%
10%
20%
30%
40%
50%
60%
0% < 20% 20% < 40% 40% < 60% 60% < 80% 80% → 100%
Probability
Delp
hi P
art
icip
an
ts
Figure 17: Consensus Analysis for “Reasonable Cars” Projection SP2
6.3.1 Analysis of Expert’s Argument on Projection SP2
(SP2) 2020: The only buying criteria for small cars in India is their “TCO” (Total Cost of Ownership
= Purchase Cost + Maintenance Cost – Resale Value)
The industry experts being moderately at odds (Consensus Distance: 25.0) consider TCO to
become the major purchase criterion as highly probable (Probability 59 %).
Probability
Indian customers are and will remain price sensitive – and purchase prices are and will remain
the main purchase criterion for Indians. Prices will continue to significantly influence (new)
buyers’ purchasing decisions, especially in the small car segment, which is regarded the entry
level for car ownership in India. And demand for small cars as a low cost entry option for
potential buyers, as well as for second cars in households, increases as India’s economy
continues to grow.
Yet, consumers’ priorities may shift over time once purchasing power increases. First tendencies
of this potential shift are reflected in the increasing number of sales of mid-sized sedans and in
the emerging trend towards status symbols in general.
Moreover, a large percentage of buyers opt for small cars not solely based on purchase prices.
Especially in metropolitan areas – due to constraints in the road infrastructure – customers are
concerned about a car’s functionality, too: A preference for small cars is higher in large cities
where driving distances are usually not too long. Thus, the scope of rational evaluation criteria
may reach beyond purchase prices. From a simple functional perspective, small cars are
perceived as easier to navigate in the congested roads and their usability is perceived as higher

54
compared to large sedans, according to the participating experts. Other key factors influencing
small car purchases may be safety, design or innovative technologies – even an OEM’s after sales
service network may become of increasing importance for customers.
Two customer segments will split the small car market: The value-for-money seekers and the
money-for-value seekers.
Impact
The impact of such a shift in customer preferences is expected to be high: Given that consumers
do not consider extra investments in latest technology and safety features so far, OEMs have to
offer a competitive high value proposition at low purchase prices in order to attract customers.
According to the experts, the whole automotive industry in India will be characterized not only
by improved quality but also increased cost pressure. Suppliers will be challenged by offering
the required quality components at low costs – and specialize in minimizing production costs.
OEMs will have to figure out creative channels for after-sales service and maintenance in order
to survive the intense competition in which “high value for little money” will have the absolute
competitive edge.
Desirability
TCO to become the main purchase criterion is considered moderately desirable: it may cause
intense price competition among manufacturers. First, lower prices attract the cost-conscious
middle class of India. Secondly, buyers are expected to get a quite attractive value proposition
for a moderate price whereas firms’ margins diminish. Finally, from a social perspective, the
affordability of small cars is supported and solely infrastructure constrains seem to have the
potential of limiting the small car penetration rate in India.
6.3.2 Roadmap for Projection SP2
Figure 18 illustrates the influences on the “Reasonable Cars” projection based on significant
correlations assessed by quantitative analysis (cf. Appendix A). The potential impacts on SP2 are
structured along the five stakeholder groups (Government, Customers, Suppliers, Industry, and
Society). Each arrow’s color in Figure 18 indicates the influence in respect of the Industry
Environment Projection’s probability (green for enabling; yellow for hindering).
SP2: 2020: The only buying criteria for small cars in India is their “TCO” (Total Cost of
Ownership = Purchase Cost + Maintenance Cost – Resale Value).
An Analysis why it is likely to happen (SP2 Probability: 59 %)

55
Figure 18: Influences on Social Industry Environment Projection (SP2)
Projections involved Enabling: SuP2, GoP3, VP1, VP2 Hindering: CuP1, SoP2, SP1
The following analysis is based on a quantitative correlation analysis as well as qualitative content
analysis between the Industry Environment Projection SP2 and all other projections of the study.
The roadmap draws on both the experts’ input and additional desktop research.
As of today, India’s economic growth has been quite remarkable during the last decade.
However, the majority of the population belongs to a low-income group and is quite price driven
in its consumption behavior. With continuing economic growth, hopefully the income disparity
will decrease and India’s society on average becomes wealthier.
With increasing wealth until 2020, India’s society has become quite sensitive about
environmental pollution in respect to lifestyle (SoP2). People even desire to purchase small cars
that fulfill the strictest emission standards (SP1). Nevertheless, foremost the so called “top of the
pyramid” customers (people with high-income) are able to afford the expensive low-emission
technologies whereas the earnings of the majority of Indians are still comparably low due to an

56
adherent high disparity of incomes. Thus, most Indian consumers consider “value-for-money”
still as the most important purchase criterion.
Referring to traffic safety, the Indian consumer may still not be well aware of all the dangers,
resulting in a persistent high number of severe traffic accidents (CuP1). The Government of India
is therefore obliged to introduce stricter safety standards for small cars as a countermeasure.
Consumers have to accept these higher safety standards and the consequently slightly higher
prices – whether they want to pay for an additional airbag or not. Indian consumers may become
even more price sensitive according to some experts.
Since domestic automotive suppliers prefer foreign over domestic OEMs to benefit from
potential growth opportunities on the international market (SuP2), they depend on the foreign
OEMs’ “goodwill” and are likely to become an integrated part of a proprietary supplier network
(VP2). This may be inevitable since foreign OEMs might dominate the huge small car market in
India (VP1). The economies of scale and low prices of domestically produced components enable
OEMs to offer competitive prices on the Indian market and even abroad.
During 2010-2020, the small car segment has experienced high growth rates. On the one hand,
this led to increasing traffic and forced the GOI to invest remarkably in infrastructure in order to
alleviate traffic congestion – especially in metropolitan areas via the integration of public and
private transportation (GoP3). On the other hand, an increasing number of car models are
offered in the Indian small car market to profit from high sales volumes, thereby intensifying
price competition amongst manufacturers. The Indian consumers – the majority not having a
high income – have become used to competitive prices and have realized their advantageous
bargaining position. They still focus on TCO as the major buying criterion (SP2).

57
7 Scenario Development for the Technological Infrastructure of India’s (Small Car) Automotive Industry in 2020
The analysis of the technological perspective focuses on the domestic education system as well
as the transportation infrastructure. The first projection refers specifically to the domestic
engineering capabilities in automotive core technologies with regard to the education system in
India. The second projection concerns the alignment of the transportation infrastructure with
the large small car market in India. At first, both Infrastructure Projections are matched to create
four scenarios for the technological infrastructure based on the input from the scenario
development workshop on IIM Bangalore campus. Then, each projection is analyzed separately,
integrating the various qualitative comments of the experts and subsequently analyzing why
each projection is expected to occur/not to occur in its respective ‘Roadmap’.
7.1 Technological Infrastructure Scenarios
The two Infrastructure Projections are combined as two axes in a coordinate system to sketch
four potential scenarios for the technological environment of the automotive industry in 2020.
While the x-axis was used to consider the occurrence (right-end) and non-occurrence (left-end)
of the first projections, the y-axis represented the occurrence (upper-end) and non-occurrence
(lower-end) of the corresponding second projection. Each of the four scenarios developed was
presented and evaluated with regard to its probability of occurrence and potential consequences
for the five industry stakeholder groups during a workshop with local industry experts on the
campus of IIM, Bangalore.
Figure 19 illustrates four scenarios derived from matching the two Industry Environment
Projections for the technological perspective. According to the Delphi participants’ assessment of
the two Infrastructure Projections, the “Miss the Bus” scenario is the most probable to occur: The
“Local High-Tech Engineers” projection was considered probable whereas the “Mobility
Infrastructure” projection was considered improbable. The discussion of the study’s results with
industry experts on IIM Bangalore campus point to an even darker future: The scenario “Back to
the Dark Ages” is considered the most probable to occur (50-60 %). The alternative three
scenarios “Road to Illiteracy”, “Highway & Education” and “Miss the Bus” were considered to be
rather improbable (Probability of at most 20 % and 30 % respectively). Table 12 summarizes
the main results of the expert discussion and the main consequences of each scenario on the
small car industry’s stakeholders.

58
IP2
: “M
ob
ilit
y I
nfr
ast
ruct
ure
”
Hig
h
SCENARIO 1
20% Probability
“ROAD TO ILLITERACY”
SCENARIO 2
20-30% Probability
”HIGHWAY TO EDUCAITON”
Lo
w
SCENARIO 3
50-60% Probability
“BACK TO THE DARK AGES”
SCENARIO 4
20% Probability
”MISS THE BUS”
Low High
IP1: “Local High-Tech Engineers”
Figure 19: Technological Infrastructure Scenario Matrix

Scenarios for the Technological Infrastructure Environment affecting the (Small Car) automotive industry in India 2020
59
Sufficient engineering talent is NOT available and infrastructure developments are aligned with new car concepts.
Customers • Customers enjoy advanced multi-modal mobility solutions but do not have access to
locally developed innovative products that specifically serve their needs. • Imported technologies result in higher average car purchasing costs at any luxury level. Suppliers • The missing talent puts suppliers at a severe disadvantage in the global competition
game. • There are no local innovations affecting the global image of the Indian supplier industry. • The alignment of the infrastructure development of the GOI with new car concepts
promises interesting opportunities but the missing engineering talent does not allow making full use of it.
OEMs • OEMs in India have not access to sufficient highly talented engineers putting especially
domestic OEMs at a disadvantage globally and in India compared to foreign OEMs. • The collaboration with the Government in developing new car concepts in the context of
existing infrastructure challenges provides interesting export opportunities especially in South-East Asia.
Government • The Government of India is very active in developing and implementing the future
mobility strategy for India but is not able to organize concerted actions for a more industry-related engineering education.
• Employability and hence attractiveness of Indian engineers for the Automotive industry slowly decreases.
Society • Traffic conditions in metros and most Tier 1 and 2 cities are improving. The people have
more freedom and flexibility in commuting between workplace and home. • The missing industry-oriented engineering education provides less job opportunities
for white collar jobs and also leads to attraction of production facilities also affecting the number of blue-collar jobs.
Sufficient engineering talent is available and infrastructure developments are aligned with new car concepts.
Customers • Customers have access to innovative products and enjoy advanced multi-modal
mobility solutions. Suppliers • Suppliers have access to excellent engineering talent at relatively low cost making them
potentially competitive on a global level. • The alignment of the infrastructure development of the GOI with new car concepts
promises interesting new products also for export to other Asian markets. OEMs • OEMs have access to sufficient highly talented engineers at low costs. • Skilled engineers make OEMs in India globally competitive in selected technology areas. Government • The Government of India is very active in developing and implementing the future
mobility strategy for India. Society • Traffic conditions in metros and most Tier 1 and 2 cities are improving. The people
have more freedom and flexibility in commuting between workplace and home.

Scenarios for the Technological Infrastructure Environment affecting the (Small Car) automotive industry in India 2020
60
Sufficient engineering talent is NOT available and infrastructure developments are NOT aligned with new car concepts.
Customers • Missing infrastructure developments make it more and more unattractive to invest
money into an own car – at least in urban areas. • Mobility and commuting becomes a real problem not only in metros. • Missing improvement of engineering education leads to only mediocre cars developed
in India. Suppliers • Suppliers face severe problems in competing globally but also domestically with foreign
suppliers due to missing local engineering talent. • Engineering service providers cannot successfully develop the market offerings up the
value chain and remain as low-cost (low-margins) provider. • Missing engineering talent prevents suppliers from replacing missing infrastructure
investments through advanced technological solutions as additional business. OEMs • OEMs sell less small cars as they are too often stuck in traffic compared to bikes.
Wealthy consumers invest in high-end cars to spend time in traffic as conveniently and effectively as possible.
• Missing engineering talent in India puts domestic OEMs in disadvantage as new products (cars) are technologically inferior to products of foreign OEMs.
Government • The Government of India is not able to find a consensus how to facilitate neither a more
practice/industry-oriented education of engineers nor that is an integrated mobility strategy required for most metros and cities.
• The civil society is putting pressure on the Government to develop new approaches for efficient commuting and inter-city traveling.
Society • The limited mobility intra- and inter-city reduces the attractiveness of most Indian
metros and cities. • High potentials from abroad refrain more and more from moving back to India. • Local traffic congestions and missing technological support lead frequently to local riots
of commuters or highly affected neighborhoods.
Sufficient engineering talent is available and infrastructure developments are NOT aligned with new car concepts.
Customers • Customers have access to advanced technologies in their high-quality cars but spend
most of their time in traffic congestions. • Missing infrastructure developments make it more and more unattractive to invest
money into an own car – at least in urban areas. • Mobility and commuting becomes a real problem not only in metros Suppliers • Suppliers have access to excellent engineering talent at relatively low cost making them
potentially competitive on a global level. • The number of cars sold is decreasing annually making the realization of economies of
scale more difficult. • Engineering service providers benefit from excellent talent pool and create a globally
leading center of excellence. OEMs • OEMs have access to sufficient highly talented engineers at low costs and make OEMs in
India globally competitive in selected technology areas but fear growing resistance towards more individual traffic due to extreme traffic congestions.
Government • The Government of India benefits from advancements in the engineering education but
is still not able to address the infrastructure problems sufficiently. Society • Traffic congestions are very severe even in Tier 2 cities. Living conditions become very
bad in many cities leading to a significant brain drain.
Table 12: Technological Infrastructure Scenarios: Consequences for Industry Stakeholders

61
7.2 Local High-Tech Engineers (IP1)
The industry experts rate the average probability of the “Local High-Tech Engineers” projection
at 54 % (cf. Table 13): India’s education system is expected to provide sufficient engineers with
advanced innovation capabilities for the automotive industry. The experts are at odds regarding
this judgment. Impact and desirability are both considered high.
No Industry Environment Projections Probability Consensus Impact Desirability
7
(IP1) 2020: The education system in India provides sufficient engineers with advanced innovation capabilities in automotive core
technologies (engine, materials, etc.)
54% 42.5 4 4
Likely Very Strong
Dissent High High
Table 13: Technological Industry Environment Projection IP1
The consensus analysis reveals that the experts slightly converge with their probability ratings
towards 40-60 % (cf. Figure 20). Yet, almost every second expert assessed the probability of
“Local High-Tech Engineers” at above 60 % and one out of three experts does not expect the
projection to occur.
Local High-Tech Engineers
0%
10%
20%
30%
40%
50%
60%
0% < 20% 20% < 40% 40% < 60% 60% < 80% 80% → 100%
Probability
Delp
hi P
art
icip
an
ts
Figure 20: Consensus Analysis for “Local High-Tech Engineers” Projection IP1

62
7.2.1 Analysis of Expert’s Argument on Projection IP1
(IP1) 2020: The education system in India provides sufficient engineers with
advanced innovation capabilities
in automotive core technologies (engine, materials, etc.)
The education system is expected to probably (54 %) provide sufficient high-skilled engineers;
however, the expectations among experts are characterized by a very strong dissent (Consensus
Distance: 42.5).
Probability
According to the Delphi study experts, first tendencies towards the development of local human
capital are reflected in foreign OEMs’ strategies: All foreign players have recognized the large
talent pool and have started to establish own R&D facilities in India. Additionally, industry
associations initiated discussions on how to overcome inherent gaps in the educational system
in order to improve local talent development. Moreover, the GOI has acknowledged the
relevance of developing a well-educated work force and demonstrates huge efforts in improving
the education system to strengthen domestic available engineering know-how. The fortified
cultivation of the domestic pool of (engineering) talents further attracts multinational
automotive firms to India. Even foreign universities consider an entry into India, thereby
additionally accelerating necessary adaptations in the educational system. Moreover, the
continuous economic growth of India is expected to result in an overall increase of wealth and
further investments into education.
According to some experts, India has quite a few world-class engineering schools today and
increasingly gains foreign firms’ interest for investments beyond manufacturing facilities. India
may evolve towards a small car market hub with a high attractiveness for manufacturing and
R&D facilities since costs of local design and engineering are estimated to remain relatively low
compared to international levels.
Nevertheless, this outcome is doubted due to the improvable current status of India’s education
system. Experts appraise the education system of India to require a clear reformation in order to
improve its structure. Although the GOI has plans to restructure and improve the education
system, it still requires time and resources in order to establish the capabilities for indigenous
technological development.
Another concern addresses the current employability of graduates. On the one hand, while the
number of engineering graduates is high, only few of those actually fit firms’ requirements –
even for routine jobs. The non-employable graduates often have to take up any kind of job to
ensure their income, even though the job may not be suitable with their actual qualification. On

63
the other hand, the education system in India is classified as being highly stereotyped with no
room for development of innovative ideas in courses. This is illustrated by assessments of local
engineering and research institutes, which are generally criticized to provide neither creative
nor structured solutions for the tasks assigned.
Some experts conclude therefore that unless the educational system completes a drastic change,
availability of sufficient engineering capabilities for research in advanced technologies /
innovation seems difficult to attain.
Impact
The impact of the “Local High-Tech Engineers” Industry Environment Projection is bound to be
high – not only for the automotive industry but also for employment situation and industry
competitiveness in general because it opens new job opportunities in the area of advanced
(automotive) technologies and builds the platform for advanced industry solutions.
The automotive industry in India already collaborates with local academia in order to improve
the quality of engineering education as well as to communicate their specific requirements that
have to be matched by graduates: Experts from the automotive industry invest huge efforts in
the configuration of engineers’ educational curricula. Domestic car manufacturers are even
expected to take initiative by setting up technical schools.
However, some experts argue that the development of local engineering talent strongly depends
on foreign OEMs that import their global experience and technological know-how in order to cut
R&D costs due to lower wages in India. This indicates a potential shortcoming in the medium
term since the innovative design of car components for the Indian market still has to be obtained
from outside India.
In general, an improvement of the educational system and especially a cultivation of local
engineering talents affect other industries in India, too, and thereby support the long-term
development of a competitive economy.
Desirability
The provision of sufficient engineers is considered highly desirable among experts. The
(automotive) industry is expected to invest time and efforts into the establishment of a strong
collaboration with domestic academia and thereby contribute to the improvement of the overall
education system. As a consequence, the automotive industry could gain low-cost engineering
capacities for their global operations and, in turn, create new job opportunities.

64
7.2.2 Roadmap for Projection IP1
Figure 21 illustrates the influences on the “Local High-Tech Engineers” projection based on
significant correlations assessed by quantitative analysis (cf. Appendix A). The potential impacts
on IP1 are structured along the five stakeholder groups (Government, Customers, Suppliers,
Industry, and Society). Each arrow’s color in Figure 21 indicates the influence in respect of the
Industry Environment Projection’s probability (green for enabling; yellow for hindering).
IP1: 2020: The education system in India provides sufficient engineers with advanced
innovation capabilities in automotive core technologies (engine, materials, etc.).
An Analysis why it is likely to happen (IP1 Probability: 54 %)
Figure 21: Influences on Technological Infrastructure Projection (IP1)
Projections involved Enabling: CuP2, SuP1, SuP3, CoP2, GoP2, GoP3, SoP1, PP2 Hindering: GoP1 The following analysis is based on a quantitative correlation analysis as well as qualitative content
analysis between the Industry Environment Projection IP1 and all other projections of the study.
The roadmap draws on both the experts’ input and additional desktop research.

65
The education system in India has developed fairly well in recent years. Especially in the area of
Information Technology, India’s university graduates are increasingly recognized for their
know-how and innovativeness. Yet, in the area of mechanical engineering and other relevant
areas for the automotive industry, huge potential remains to be unveiled in order to support the
development of a competitive domestic manufacturing industry.
Small car buyers have rather clearly differentiated requirements than solely the demand to
move from A to B: Customers are willing to pay for a specific brand, additional features, or
luxury (CoP2). An increasing large customer base is able to afford such additional features for
small cars, because the GOI implemented flexible labor laws, which resulted in an increase of
wealth, especially for hard-working blue-collar workers (SoP1). Consequently, the domestic
automotive industry is forced by customer requirements to put large efforts into R&D.
In the short-term, the GOI is tempted to introduce tax deductions on export profits (GoP1) to
continue ‘flooding’ the international market with low cost (elementary quality) Indian cars. To
compete in the international market in the long-term, domestic automotive suppliers need to
put huge efforts in technological upgrading in order to become technologically at par with their
European, American, or Japanese competitors (SuP3). The financing of the required R&D does
not seems to be the major challenge since the Indian supplier industry has went through a
substantial consolidation process and benefits from an increase in average turnover, economies
of scale and margins (SuP1) – rather the potential shortages of researchers and engineers may
present challenges that ought to be prevented.
Besides, a technological upgrading of the domestic automotive industry becomes mandatory
because the GOI follows a sustainable total mobility strategy to face two major challenges:
environmental pollution and a severe traffic situation. In order to reduce CO2 emissions, the GOI
raises emission regulations to European standards (PP2) and establishes an organization that
regulates all environmental matters regarding production and consumption life cycle of small
cars (GoP2). As a countermeasure for congestion, the GOI invests considerably in infrastructure
projects and even integrates public and individual transportation in metropolitan areas (GoP3).
As a result, public transportation is perceived as a convenient alternative in an increasing
number of cities (CuP2).
The GOI will therefore do everything possible to prevent a possible shortage of the necessary
engineers / engineering skills (IP1).

66
7.3 Mobility Infrastructure (IP2)
The industry experts rate the average probability of the “Mobility Infrastructure” projection at
48 % (cf. Table 14): major infrastructure development projects are not expected to be aligned
with small car concepts to manage the increasing car penetration rate in India. The experts are
moderately at odds regarding this judgment. Impact and desirability are both considered high.
No Industry Environment Projections Probability Consensus Impact Desirability
8
(IP2) 2020: The development of new small car concepts for India and major
transportation infrastructure development projects in India are strongly aligned
48% 22.5 3.5 3.7
Unlikely Moderate
Dissent High High
Table 14: Technological Industry Environment Projection IP2
The consensus analysis reveals that the experts tend with their probability ratings towards 40-
60 % (cf. Figure 22), and one out of four experts does not expect the “Mobility Infrastructure”
projection to occur.
Mobility Infrastructure
0%
10%
20%
30%
40%
50%
60%
0% < 20% 20% < 40% 40% < 60% 60% < 80% 80% → 100%
Probability
Delp
hi P
art
icip
an
ts
Figure 22: Consensus Analysis for “Mobility Infrastructure” Projection IP2

67
7.3.1 Analysis of Expert’s Argument on Projection IP2
(IP2) 2020: The development of new small car concepts for India and major transportation infrastructure development projects
in India are strongly aligned
With a moderate dissent (Consensus Distance: 22.5), a strong alignment of infrastructure
development and small car concepts is considered improbable (Probability 48 %) among
industry experts.
Probability
The experts assume this situation to originate from insufficient coordination efforts between the
agencies that are responsible for transportation infrastructure development. The alignment of
the infrastructure towards small car concepts has a low priority; the focus is expected to lie
rather on a national implementation of rural connectivity or the continuous improvement of
established mass transportation systems. Moreover, the GOI may prioritize the improvement of
the freight traffic infrastructure in order to support economic growth.
Nevertheless, some experts do see the possibility of an alignment of small car concepts and
transportation infrastructure within the next decade – given that the interface between politics
and industry improves. With a continuous economic growth, the strong governmental focus on
(especially freight traffic) infrastructure development becomes a policy imperative. To further
prevent traffic break-downs, the GOI might be encouraged to consider aligning infrastructure
development projects towards new small car concepts. In this context, the GOI is taking first
steps in this direction with the “Automotive Mission Plan”. From a manufacturing industry’s
perspective, a well-established transportation infrastructure seems to be necessary for India to
open up more towards the international market.
Impact
The impact of an alignment between infrastructure and small car concepts is considered to be
high. It contributes remarkably to support the high growth envisaged for the small car market in
India. The underlying logic is convincing: Cars require roads. The increasing car penetration rate
– with a particular growth of the small car segment – requires an increase in infrastructure
capacity in order to reduce or prevent even more traffic congestion. Otherwise, with the roads
being congested due to insufficient infrastructure capacities, the attractiveness for car
ownership and economic investment into affected areas might decrease considerably –
infrastructure is considered to be the key requirement for the small car sector.

68
Desirability
According to the experts, the development of new small car concepts for India and major
transportation infrastructure development projects being aligned is considered highly desirable:
There is a need for the GOI to prioritize infrastructure investment options and thereby ensure an
efficient use of its scarce resources – transportation infrastructure development contributes
substantially to the growth of India’s industry.
7.3.2 Roadmap for Projection IP2
Figure 23 illustrates the influences on the “Mobility Infrastructure” Projection based on
significant correlations assessed by quantitative analysis (cf. Appendix A). The potential impacts
on IP2 are structured along the five stakeholder groups (Government, Customers, Suppliers,
Industry, and Society). Each arrow’s color in Figure 23 indicates the influence in respect of the
Industry Environment Projection’s probability (green for enabling; yellow for hindering).
IP2: 2020: The development of new small car concepts for India and major transportation
infrastructure development projects in India are aligned.
An Analysis why it is unlikely to happen (IP2 Probability: 48 %)
Figure 23: Influences on Technological Infrastructure Projection (IP2)

69
Projections involved Enabling: CuP1, SuP1 Hindering: CuP2, SuP2, SuP3, CoP2, GoP1, GoP2, GoP3, PP2, VP1, VP2 The following analysis is based on a quantitative correlation analysis as well as qualitative content
analysis between the Industry Environment Projection PP1 and all other projections of the study.
The roadmap draws on both the experts’ input and additional desktop research.
The rise in traffic today is almost over-challenging hitherto infrastructure’s capacity. Thus, the
Government of India (GOI) has already increased investments in transportation infrastructure to
prevent a possible hindrance of economic growth due to a break down in the transportation
sector within and between cities.
Traffic congestion remains a severe problem especially in the metropolitan areas. The GOI has
strong hopes on newly implemented innovative transportation approaches that integrate public
and individual transportation (GoP3). Even though cities’ inhabitants increasingly use public
transportation (CuP2), the implemented transportation systems do not prove effective enough
to resolve the challenging traffic situation.
At an early stage, the GOI has realized that CO2 and other car emissions may be a challenging
side effect of the rising car penetration rate. It raised overall emission regulations to the
European level (PP2) and initiated powerful governmental organizations that regulate and
control all environmental matters of the production and consumption life cycle of small cars
(GoP2) – since this market segment exhibits the strongest growth. Although this may indicate a
sustainable strategy towards mobility in the future, the GOI is reluctant to effectively invest in
road infrastructure.
With regard to another major side effect of rising traffic – that is, accidents – the GOI has
implemented increased safety standards for small cars (CuP1). The GOI is highly confident that
this measure will alleviate the number and severity of traffic accidents and therefore does not
intend to invest in infrastructure such as dedicated traffic lanes.
The capacity of the infrastructure is a hindrance for the development of the domestic car market.
Although the GOI is supportive to maintain domestic firms’ increases in sales, the required
infrastructure investments to support car ownership’s attractiveness are postponed. The GOI’s
target is rather to support domestic industry’s competitiveness on the international market.
Hence, the GOI incentivizes exports (GoP1) but does not realize that the main source of revenues
will rely on a stable growth of domestic sales – at least temporarily. Besides, since the domestic
automotive suppliers have gone through substantial consolidation and thereby increased
turnover (SuP1), the GOI sees little necessity to invest immediately in measures to ensure
growth in the domestic small car market segment.

70
Since foreign OEMs dominate the small car segment in India (VP1), the consequences of a
hampered growth for the domestic small car segment (due to an insufficient infrastructure
capacity) induces even higher risks for the domestic automotive industry in terms of assured
growth of revenues. Therefore, domestic suppliers prefer integration in OEMs’ proprietary
supply networks to ensure commercial viability (VP2). In addition, they prefer business with
foreign OEMs to profit from potential growth opportunities in the international market (SuP2)
since forecasts for domestic market growth are not too promising.
Such a development may become a reason for the GOI to engage in infrastructure investment in
order to decrease domestic suppliers’ dependency on foreign OEMs by preventing an early
saturation of the domestic market. But, given the fact that primarily foreign OEMs profit from
the huge small car market (VP1), the GOI may hesitate to invest further into infrastructure just
for the purpose of containing further growth of the automotive sector.
In metropolitan areas, where the roads are quite congested, people usually purchase a small car
only if they truly have to (“My car, my castle”). Consequently, the consumer expects the
purchased car to fulfill his/her individual requirements by offering additional features. This
results in a clearly differentiated market for small cars, with some consumers putting an
emphasis on luxury, quality, safety, a specific brand etc. (CoP2) and others only on “maximum
value-for-minimum money”. To support the required quality (high-technology) components,
domestic automotive suppliers have to invest continuously in their technological upgrading to
become and remain at par with their foreign competitors (SuP3). Whereas the original intend
was to comply with the changing customer requirements of the domestic market, suppliers now
target towards the international market since the long-term growth of the small car market in
India may be hampered by insufficient infrastructure investments (IP2).

71
8 References
Alsan, A., (2008). Corporate Foresight in emerging markets: Action research at a multinational
company in Turkey. Futures, 40 (1), 47-55.
Czintoka, R., Ronkainen, I., A., (2005). A forecast of globalization, international business and
trade: report from a Delphi study. Journal of World Business, 40 (2), 111-123.
Khanna, T., Palepu, K., (1997). Why Focused Strategies May Be Wrong for Emerging Markets.
Harvard Business Review, 75(4), 41-51.
Maruti-Suzuki India Ltd., (2011). Company Profile. http://www.marutisuzuki.com
/sustainability/company-profile.aspx, retrieved on April 29th, 2011.
Ministry of Statistics and Program Implementation (MOSPI), (2009). Statistical Data, India
Statistics. http://mospi.nic.in/, retrieved on April 29th, 2011.
Nielsen, C., Thangadurai, M., (2007). Janus and the Delphi Oracle: Entering the new world of
international business research. Journal of International Management, 13(2), 147-163.
North, D. C., (1990). Institutions, Institutional Change and Economic Performance. Cambridge:
Cambridge University Press.
Organization for Economic Co-operation and Development (OECD), (2008). Countries, Statistical
Profile of India. http://www.oecd.org/, retrieved on April 29th, 2011.
The World Bank, (2009). Data, Country, Profiles. http://www.worldbank.org/, retrieved on April
29th, 2011.
Society of Indian Automotive Manufacturers (SIAM), (2008-2011). Industry Statistics and
Statistics Services. http://www.siamindia.com, retrieved on April 29th, 2011.

72
Contact Information
Prof. Dr. Roger Moser
Assistant Professor of International Management Managing Director, Asia Connect Center (ACC-HSG) University of St. Gallen Visiting & Adjunct Faculty, IIM Bangalore & IIM Udaipur [email protected]
Christian Kuklinski
Doctoral Candidate Automotive Institute for Management (AIM), EBS Business School; Guest Researcher CEIBS Center for Automotive Research (CCAR), China Europe International Business School (CEIBS)

73
Appendix A
Correlation Analysis: Industry Environment and Stakeholder Projections
PP1 PP2 VP1 VP2 SP1 SP2 IP1 IP2
CuP1 Pearson Corr. 0,23 0,18 -0,39** 0,07 0,32* -0,32* -0,09 -0,23 Sig. (2-tailed) 0,14 0,26 0,01 0,63 0,03 0,03 0,57 0,13
CuP2 Pearson Corr. -0,13 0,54** 0,01 0,15 0,35* 0,17 0,54** 0,43** Sig. (2-tailed) 0,42 0,00 0,94 0,33 0,02 0,29 0,00 0,00
SuP1 Pearson Corr. 0,17 0,03 0,20 0,08 -0,05 0,15 0,20 -0,29 Sig. (2-tailed) 0,27 0,84 0,21 0,61 0,75 0,33 0,20 0,06
SuP2 Pearson Corr. -0,32* -0,01 0,29 -0,12 0,17 0,42** -0,11 0,32* Sig. (2-tailed) 0,04 0,94 0,06 0,43 0,27 0,01 0,47 0,03
SuP3 Pearson Corr. 0,26 0,32* 0,16 0,08 0,02 0,14 0,66** 0,32* Sig. (2-tailed) 0,10 0,04 0,32 0,62 0,88 0,38 0,00 0,04
CoP1 Pearson Corr. -0,25 0,01 -0,10 0,03 -0,01 0,06 0,16 0,15 Sig. (2-tailed) 0,10 0,93 0,51 0,85 0,94 0,71 0,32 0,32
CoP2 Pearson Corr. 0,00 0,41** -0,11 0,12 0,46** -0,14 0,29 0,32* Sig. (2-tailed) 0,99 0,01 0,50 0,44 0,00 0,39 0,06 0,03
GoP1 Pearson Corr. -0,22 0,03 0,04 0,25 0,20 0,15 -0,24 0,24 Sig. (2-tailed) 0,15 0,86 0,81 0,10 0,20 0,34 0,12 0,11
GoP2 Pearson Corr. 0,36* 0,50** -0,07 0,07 0,13 0,16 0,51** 0,22 Sig. (2-tailed) 0,02 0,00 0,65 0,63 0,41 0,29 0,00 0,16
GoP3 Pearson Corr. 0,26 0,53** 0,19 0,20 0,14 0,25 0,33* 0,42** Sig. (2-tailed) 0,10 0,00 0,22 0,19 0,36 0,11 0,03 0,00
SoP1 Pearson Corr. -0,10 0,22 -0,13 0,02 0,31* -0,14 0,24 0,12 Sig. (2-tailed) 0,51 0,15 0,42 0,88 0,04 0,38 0,12 0,46
SoP2 Pearson Corr. 0,31* 0,08 -0,13 -0,26 0,55** -0,28 0,08 -0,01 Sig. (2-tailed) 0,04 0,60 0,40 0,09 0,00 0,07 0,62 0,92
*. Correlation is significant at the 0.05 level (two-tailed) **. Correlation is significant a the 0.01 level (two-tailed)

74
Appendix B
Crossroad Events
In addition to the identified stakeholder events and activities which are encompassed by the
Industry Stakeholder Projections, further crossroad events until 2020 were elaborated in the
expert workshops even beyond the 5 stakeholder groups.
Year /
Stake-
holder
Customers Suppliers OEMs Government Society Other
2011
Shortage of Replacement Parts Weak Signals: Increased Number of VOR (Vehicles Off Road)
GST (Goods & Service Tax) Implementation Weak Signals: Political consensus achieved.
2012
Foreign OEMs have >75% Market Share Weak Signals: Foreign players increasing the marketing/sales activities Economic Crisis resulting in OEM bankruptcies Weak Signals: None Industry investing in Plants in Tier-3 Cities Weak Signals: Increasing number of announcements such as in Talegaon or Sanand
Entry of foreign Universities Weak Signals: Government regulations relaxed, increased participation of private sector
Major Discovery of Oil Reserves in different Parts of the World Weak Signals: None
2013
Political Instability and War between India &

75
Pakistan Weak Signals: Current turmoil in Pakistan
2014
Sudden Increase in Steel/Energy Prices Weak Signals: Increased investments in production facilities, growing global economy
Banned 2- & 3- Wheelers inside Cities Weak Signals: Already in place in some cities
Labor Shortage Weak Signals: Existing warnings from industry
Crude Oil Price over $200 Weak Signals: Strong economic developments globally finally reaching peak oil
2015
Customers from Tier-3 Cities become significantly more Affluent Weak Signals: Minor developments already taking place
Consolidation & Competition Weak Signals: Increasing FDI and M&A developments, more innovative products Suppliers building a Cartel Weak Signals: Increased demand for specific products / product groups
Infrastructure Development for CNG (Compressed Natural Gas) Distribution Weak Signals: Increased resource allocations outside Mumbai or Delhi Internal Political Instability / e.g. through 3rd Front coming into Power Weak Signals: High GDP Growth, Social Tensions
Going Green Movement Weak Signals: Increased demand for of public transport and/or car sharing
2016
Customers from South Asian Countries influence Demand for Indian made Cars Weak Signals: First signs of influence already registered
Significant Increase in Steel Prices Weak Signals: Increasing focus on infrastructure development in the country
2017
2018
Higher Percent-age of rural Customers Influence on Scenario(s):
Government restricts FDI Weak Signals: Too strong Dominance of Foreign Players
NGOs forcing the Government to adopt stricter Regulatory

76
probability of sc 1 increases Weak Signals for Event: Increasing per capita income of rural, declining 2w and people carrier sales in rural region: tsunami India moving towards Global (European Emission) Standards Weak Signals: BS-4 (Bharat Stage 4) coming into effect in some cities already
Government imposing Taxation on Ownership of Cars to promote Mass Transport System and decongest the Roads
- Weak Signals: Inability of Government to build necessary road infra-structure
Norms Weak Signals: NGO activists creating awareness and sensitizing people towards green behavior
2019
More Cars per Household Weak Signals: Increase in household income, multiple income households, multiple product offerings from OEMs
2020
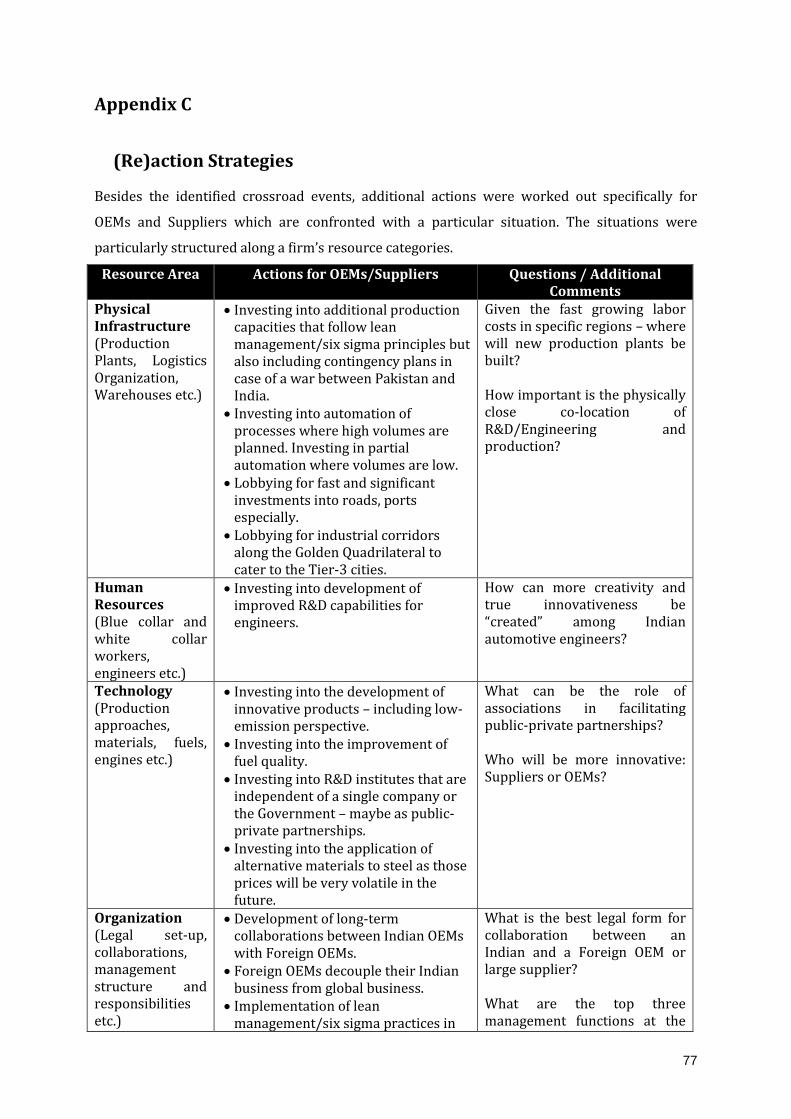
77
Appendix C
(Re)action Strategies
Besides the identified crossroad events, additional actions were worked out specifically for
OEMs and Suppliers which are confronted with a particular situation. The situations were
particularly structured along a firm’s resource categories.
Resource Area Actions for OEMs/Suppliers Questions / Additional Comments
Physical Infrastructure (Production Plants, Logistics Organization, Warehouses etc.)
Investing into additional production capacities that follow lean management/six sigma principles but also including contingency plans in case of a war between Pakistan and India.
Investing into automation of processes where high volumes are planned. Investing in partial automation where volumes are low.
Lobbying for fast and significant investments into roads, ports especially.
Lobbying for industrial corridors along the Golden Quadrilateral to cater to the Tier-3 cities.
Given the fast growing labor costs in specific regions – where will new production plants be built? How important is the physically close co-location of R&D/Engineering and production?
Human Resources (Blue collar and white collar workers, engineers etc.)
Investing into development of improved R&D capabilities for engineers.
How can more creativity and true innovativeness be “created” among Indian automotive engineers?
Technology (Production approaches, materials, fuels, engines etc.)
Investing into the development of innovative products – including low-emission perspective.
Investing into the improvement of fuel quality.
Investing into R&D institutes that are independent of a single company or the Government – maybe as public-private partnerships.
Investing into the application of alternative materials to steel as those prices will be very volatile in the future.
What can be the role of associations in facilitating public-private partnerships? Who will be more innovative: Suppliers or OEMs?
Organization (Legal set-up, collaborations, management structure and responsibilities etc.)
Development of long-term collaborations between Indian OEMs with Foreign OEMs.
Foreign OEMs decouple their Indian business from global business.
Implementation of lean management/six sigma practices in
What is the best legal form for collaboration between an Indian and a Foreign OEM or large supplier? What are the top three management functions at the

78
supplier base. top for an Automotive company?
Marketing / Sales, Brand / Reputation
Investing into a sales and service network.
Which other investments into sales/marketing than extending the distribution and service networks are necessary to prepare for the future? Where is the extension of sales and service networks most important – metros, Tier1/2 or Tier 3 cities?

79
Appendix D
Industry Stakeholder Projections: Consensus Analysis
Customers
CuP1: More than 90% of the current and potential buyers of small cars in India perceive their
safety as comparable to large passenger cars.
Safety Perpception
0%
10%
20%
30%
40%
50%
60%
0% < 20% 20% < 40% 40% < 60% 60% < 80% 80% → 100%
Probability
Delp
hi P
art
icip
an
ts
CuP2: Current or potential buyers of small cars in India perceive in the Metros and Tier 1 Cities
public transport as a convenient alternative.
Public Transport
0%
10%
20%
30%
40%
50%
60%
0% < 20% 20% < 40% 40% < 60% 60% < 80% 80% → 100%
Probability
Delp
hi P
art
icip
an
ts

80
Suppliers
SuP1: The domestic automotive supplier base (Tier 1-3) has gone through a substantial
consolidation process increasing the average turnover of a supplier compared to 2010 by the
factor 4.
Supplier Consolidation
0%
10%
20%
30%
40%
50%
60%
0% < 20% 20% < 40% 40% < 60% 60% < 80% 80% → 100%
Probability
Delp
hi P
art
icip
an
ts
SuP2: Domestic automotive suppliers in India prefer foreign automotive OEMs operating in the
small car segment in India over domestic OEMs due to their higher global market volumes and
potential growth opportunities.
Focus: Export Opportunities
0%
10%
20%
30%
40%
50%
60%
0% < 20% 20% < 40% 40% < 60% 60% < 80% 80% → 100%
Probability
Delp
hi P
art
icip
an
ts

81
SuP3: Domestic automotive suppliers in India invest continuously into their technological
upgrading and are technologically at par with their European, US-American or Japanese
competitors.
Technological Upgrading
0%
10%
20%
30%
40%
50%
60%
0% < 20% 20% < 40% 40% < 60% 60% < 80% 80% → 100%
Probability
Delp
hi P
art
icip
an
ts
Industry / OEMs
CoP1: The automotive associations in India and the GOI (Government of India) have established
public-private partnerships to establish research centers of excellence for all major automotive
technology areas.
Centers of Excellence
0%
10%
20%
30%
40%
50%
60%
0% < 20% 20% < 40% 40% < 60% 60% < 80% 80% → 100%
Probability
Delp
hi P
art
icip
an
ts

82
CoP2: All OEMs in India selling small cars are serving clearly differentiated consumer groups.
Differentiated Customers
0%
10%
20%
30%
40%
50%
60%
0% < 20% 20% < 40% 40% < 60% 60% < 80% 80% → 100%
Probability
Delp
hi P
art
icip
an
ts
Government
GoP1: The GOI provides 100% tax deductions on export profits.
Export Promotion
0%
10%
20%
30%
40%
50%
60%
0% < 20% 20% < 40% 40% < 60% 60% < 80% 80% → 100%
Probability
Delp
hi P
art
icip
an
ts

83
GoP2: The GOI clearly regulates the environmental impact of the production and consumption
life time of small cars in India.
Environmental Organizations
0%
10%
20%
30%
40%
50%
60%
0% < 20% 20% < 40% 40% < 60% 60% < 80% 80% → 100%
Probability
Delp
hi P
art
icip
an
ts
GoP3: The GOI is actually implementing a total mobility strategy integrating individual and
public transportation as well as all related infrastructure investments.
Integrated Transport
0%
10%
20%
30%
40%
50%
60%
0% < 20% 20% < 40% 40% < 60% 60% < 80% 80% → 100%
Probability
Delp
hi P
art
icip
an
ts

84
Society
SoP1: The Indian society has accepted that more flexible labor laws support the economic
growth of the country in general and the increased wealth of blue-collar workers in particular.
Labor Laws
0%
10%
20%
30%
40%
50%
60%
0% < 20% 20% < 40% 40% < 60% 60% < 80% 80% → 100%
Probability
Delp
hi P
art
icip
an
ts
SoP2: The Indian society is very sensitive towards any kind of pollution through individual or
corporate mobility requirements.
Pollution Attitude
0%
10%
20%
30%
40%
50%
60%
0% < 20% 20% < 40% 40% < 60% 60% < 80% 80% → 100%
Probability
Delp
hi P
art
icip
an
ts