index terms— ijser · pdf fileverify if eukaryotic cells like yeast if its dead or...
TRANSCRIPT

International Journal of Scientific & Engineering Research, Volume 6, Issue 11, November-2015 984 ISSN 2229-5518
IJSER © 2015 http://www.ijser.org
Oxidative Degradation of Methylene Blue Using Fenton Reagent
Elegbeleye Oladipo Ayodamope Department of Environmental Science/Engineering, Cyprus international University
Lefkosa , mesin 10,Turkey
Email: [email protected]
Abstract— Methylene Blue dye is an aromatic chemical compound with a molecular formula C16H18N3SCl and has some very distinctive uses in some fields like biology and chemistry. Its uses are diverse as they can be used in paper and pulp industries, leather industries and can also be used for medicinal purposes. This paper focuses on the degradation of methylene blue using Fenton and Oxidative processes and how to remove this dye compound from water solution. The material used, its environmental effect, advantages and recommendations are also discussed.
Index Terms— Degradation, Dye, Hydrogen Peroxide, Fenton, Methylene Blue.
—————————— ——————————
1 INTRODUCTION
Textile industries produce enormous wastes involving various dyes and they are found to have presented serious environmental problems due to the fact that dyes are highly coloured and designed to resist chemical, biochemical and photochemical degradation. Synthetic or manufactured dyes are visible pollutants which are undesirable and poisonous even at trace levels or at very small amount because of its chemistry and appearance. Many dyes are dissolved in water and made water soluble to meet the colour requirements of most fabrics and with the high rate of increase in urbanization and industrialization the rate of removal of trace amounts of toxic and poisonous pollutants in the ppm and ppb range from the industrial wastewater and contaminated groundwater is increasingly and progressively becoming significant and critical. Chemical process industries, such as oil refineries, petrochemical units, dye and dye intermediates manufacturing industries, textile units, paper making industries, pharmaceuticals, cosmetics ,synthetic and manufactured detergents, and tanneries are the typical industries that discharge toxic and poisonous organic compounds at low concentrations to the nearer and closer water bodies, thus making the water polluted and undesirable. It is important and necessary to develop and create novel and cost-effective technologies to treat this wastewater.
1.2 ENVIRONMENTAL FATE
An aggregate of 15% of the world production of dyes is lost during dyeing process and its discharged in textile and fabric effluents (Zollinger, 1991). Frequent users of some these chemicals include paper and pulp manufacturing industries, dyeing of cloth, leather treatment and printing. Most of the solutions being used contain dyes which are released as effluents (Bukallah et al., 2007).The release of coloured wastes into streams does not only affects the aesthetic nature, but this coloured wastes also hinders the transmission of sunlight into streams and therefore slows down photosynthetic activities (Namasivayam et al., 2001). Several methods have been tested for dye removal from the industrial effluents to lessen their impact on the environs. Some of these methods are adsorption which includes organic or inorganic matrices, chemical precipitation, coagulation and electro coagulation. (Lata et al., 2008; Gong et al., 2008; Cheng et al., 2008; Augustine, 2008; Rauf et al., 2008; Xiaofei and Khalil, 2008; Daneshvar et al., 2003) Recent findings on the development of chemical treatment of wastewater have resulted in great improvement in the oxidative decolourisation of organic compounds dissolved in aqueous media.
IJSER

International Journal of Scientific & Engineering Research, Volume 6, Issue 11, November-2015 985 ISSN 2229-5518
IJSER © 2015 http://www.ijser.org
2 LITERATURE REVIEW
2.1 METHYLENE BLUE
Methylene Blue is an heterocyclic chemical compound which is aromatic in nature and its molecular formula is C16H18N3SCl. It is a compound that is very important because of its various uses in unique areas, this areas include biology and chemistry. Methylene blue emerges as a solid, odourless, dark green powder which gives a blue solution when dissolved in water at normal room temperature. The structural form when hydrated has 3 molecules of water per molecule of methylene blue and this particular compound should not be confused with methyl blue nor with the methyl violets which are mostly used as pH indicators. Methylene blue was prepared first in 1876 by a German chest Heinrich Caro (1834-1910). The compound was set up by treating 4-aminodimethylaniline with hydrogen sulphide which as dissolved in hydrochloric acid (HCL), after which oxidation with ferric chloride was done.
Figure 1 preparation of methylene blue
Methylene blue is a very potent and strong cationic dye which absorb light maximally around 670nm. This absorbtion rate depends on many factors which includes protonation and adsorption, to other materials.
Table 1: Absorption of Methylene Blue
Species Absorption peak
Extinction coefficient (dm3/mole·cm)
MB+ (solution) 664 95000
MBH2+ (solution) 741 76000
(MB+)2 (solution) 605 132000
(MB+)3 (solution) 580 110000
MB+ (adsorbed on clay) 673 116000
MBH2+ (adsorbed
on clay) 763 86000
(MB+)2 (adsorbed on clay) 596 80000
(MB+)3 (adsorbed on clay) 570 114000
2.2 USES OF METHYLENE BLUE
Methylene blue is a primarily a basic dye widely utilized for colouring, printing cotton and silk etc. It is likewise useful for medicinal purposes because of its antiseptic properties. it can also be used by paper and pulp manufacturers, it can also be used in in the treatment of leather. 2.3 AN INDICATOR Methylene blue can also be used as a pointer to verify if eukaryotic cells like yeast if its dead or alive. Methylene blue cannot enter and penetrate viable cells when they are alive leaving them unstained. However, if the cells are dead methylene blue will penetrate the cell membrane staining and making the cells blue. Respiration of yeast can be controlled by methylene blue when it picks up hydrogen ions made during this process therefore preventing the yeast cell from using those ions to release energy.
2.4 METHYLENE BLUE IN CHEMISTRY
Methylene blue is widely used as a redox indicator in chemistry mostly analytical chemistry, it’s a pointer that indicates the presence or absence of oxygen. Oxygen-rich environment are said to be oxidizing. Some chemical elements, such as oxygen have very strong affinity for electrons in which they can strip electrons away from the atoms of other
IJSER

International Journal of Scientific & Engineering Research, Volume 6, Issue 11, November-2015 986 ISSN 2229-5518
IJSER © 2015 http://www.ijser.org
elements these are known as oxidizing agents. Methylene blue indicates the presence of oxidizing agents because it is oxidized by these compounds. When electrons are stripped from methylene blue, the molecule gives a blue colouration to the solution showing us a clear sign of a chemical change. Volumetric analysis, makes reaction between Fehling's solution and reducing sugars more visible using methylene blue which are also reagents in redox titrations. This paper discusses the effectiveness of Fe2+ and H2O2 towards oxidative degradation of dye. The initial rate of the degradation of the dye as a function of concentrations of dye, Fe2+ and H2O2 will likewise be reported and accounted for 2.5 OXIDATIVE PROCESSES
This is a procedure in which oxygen is created and caused to combine with other molecules. The oxygen may be used as elemental oxygen, as in air, or in the form of an oxygen-containing molecule which is able to give up all or part of its oxygen. Most oxidations occur with the release of a lot of energy in the form of either heat, power, light or electricity. The extreme effect of oxidation are oxides of the elements involved. These oxidations occur naturally as corrosion, decay and decomposition where by smouldering and burning of matter such as wood, petroleum, and sulphur are used as oxides of the basic and essential elements. The key variables to be considered in any partial oxidation are temperature, pressure, mole ratio of oxidising agent to know whether the substance to be oxidized is to be kept in the liquid or vapour phase, nature of catalyst and reaction time. Only a narrow range of conditions distinctive to each substance being oxidized and each product required will give a reasonable yields. 2.6 FENTON PROCESS H.J.H. Fenton in 1894 discovered Fenton reaction and he stated that Hydrogen peroxide (H2O2 ) could be triggered by ferrous salts (Fe2+) to oxidize tartaric acid . More than 1700 rate constants for OH reactions with organic and inorganic compounds in aqueous solution have been reported in the past few decades there by bringing to lime light the importance of OH reactions. Related reactions with Fenton include Hydrogen peroxide (H2O2) reacting with iron ions to create active oxygen species that oxidize inorganic or organic compounds. In recent past, Fenton reaction was effectively
utilised in the treatment of wastewater process for the removal of harmful organics from wastewater. The traditionally recognized Fenton mechanism is shown below by Eqns. (1)–(9) and its reaction rates were well and correctly reported. Eqn. (1) is recognized as Fenton reaction and this signifies the oxidation of ferrous to ferric ions to degrade H2O2 into hydroxyl radicals. It is generally known as the core of the Fenton chemistry. Moreover, other reactions must be looked into so as to comprehend and understand the entire process. The produced ferric ions can be slowed down by reacting with more hydrogen peroxide to produce again ferrous ion and more or excess radicals as shown in Eqn. (2). This reaction is called Fenton-like reaction which is much slower than Fenton reaction, and allows ferrous salt (Fe2+) to be regenerated in an efficient cyclic mechanism. In Fenton like reaction, aside from ferrous ion regeneration, hydro-peroxyl radicals (.O2H) are formed. The hydro-peroxyl radicals in like manner may attack organic pollutants, but hydroxyl radicals are less sensitive to it. However, it should also be noted that the iron added in small amount acts as a catalyst while H2O2 is continuously used up to produce and generate hydroxyl radicals. Eqns. (2)–(5) characterize the rate limiting steps in the Fenton chemistry since hydrogen peroxide is consumed and ferrous iron is recovered from ferric ion through these reactions. Furthermore Eqns (6)–(9) was said to have occurred during the Fenton process and they are radical–radical reactions or hydrogen peroxide–radical reaction. Breaking down of hydrogen peroxide to molecular oxygen and water occurs In the presence or absence of any organic molecule to be oxidized as shown in Eqn. (10). This reaction lead to abuse of bulk oxidant and thus an unnecessary raise on treatment cost. Eqns. (1)–(9) shows that the Fenton process follows a complex mechanism. The chain initiation reaction activates the occurrence of the creation of desired hydroxyl radical however hydroxyl radicals can be poached by ferrous ions (Eqn. (3)), hydrogen peroxide (Eq. (7)), hydro-peroxyl radicals (Eqn. (9), and/or even may be auto scavenged (Eqn. (6)). The foregoing analysis shows that hydrogen peroxide (H2O2) may act both as radical generator (Eq. (1)) and as scavenger (Eqn. (7)). Hydroxyl radicals may attack organic radicals generated by organics present in the wastewater. Those radicals react with ferrous and ferric ions, as indicated in the equations below. Fenton process can occur out at room temperature and atmospheric pressure. Further more, reagents needed are readily available and they are easy to store and handle, it is safe and
IJSER

International Journal of Scientific & Engineering Research, Volume 6, Issue 11, November-2015 987 ISSN 2229-5518
IJSER © 2015 http://www.ijser.org
they do not cause any damage to the environment. However, two major impediments have been identified. The first is the wastage of oxidants because the radical scavenging effect of hydrogen peroxide (Eq. (7)) and it decomposing itself (Eq. (10)). The second refers to the formation of solid sludge and the continuous loss of iron ions. Quite a number of economic and environmental hindrances have been said to occur with Fenton sludge however, innovations allowing an efficient use of hydrogen peroxide (H2O2) have to be researched. Furthermore, efforts must be made for the regeneration and recovery of iron ions and their subsequent recycle and reuse. Fe2+ + H2O2→Fe3+ + OH- + . OH Eqn 1 Fe3+ + H2O2→ Fe2+ + . O2H + H+ Eqn 2 Fe2+ + . OH → Fe3+ + OH- Eqn 3 Fe2+ + . O2H → HO-
2 Eqn 4 Fe3+ + . O2H → Fe2+ + O2 +H+ Eqn 5 .OH + .OH → H2O2 Eqn 6 .OH + H2O2 → . O2H + H2O Eqn 7
. O2H + . O2H → H2O2 + O2 Eqn 8
. OH + . O2H → H2O + O2 Eqn 9 2 H2O2 → O2 +H2O Eqn 10
MATERIALS AND METHODS 3.1MATERIALS AND CHEMICALS
Methylene blue , FeSO4·7H2O (B.D.H.), H2O2(35% w/v), HCl, NaOH, are all purchased from E. Merck,A.R. or G.R. grades and used as received without any further purification All solutions were made in distilled water. 3.2 METHODS 3.2.1 STOCK SOLUTIONS PREPARATION 50 ppm of dye stock solution were prepared weighing 0.05g methylene blue and diluting it with distilled water to 100ml Likewise 0.993g of FeSO4.7H20 and 1.52ml of Hydrogen peroxide (H2O2) was also prepared in deionised water and diluted up to 100ml
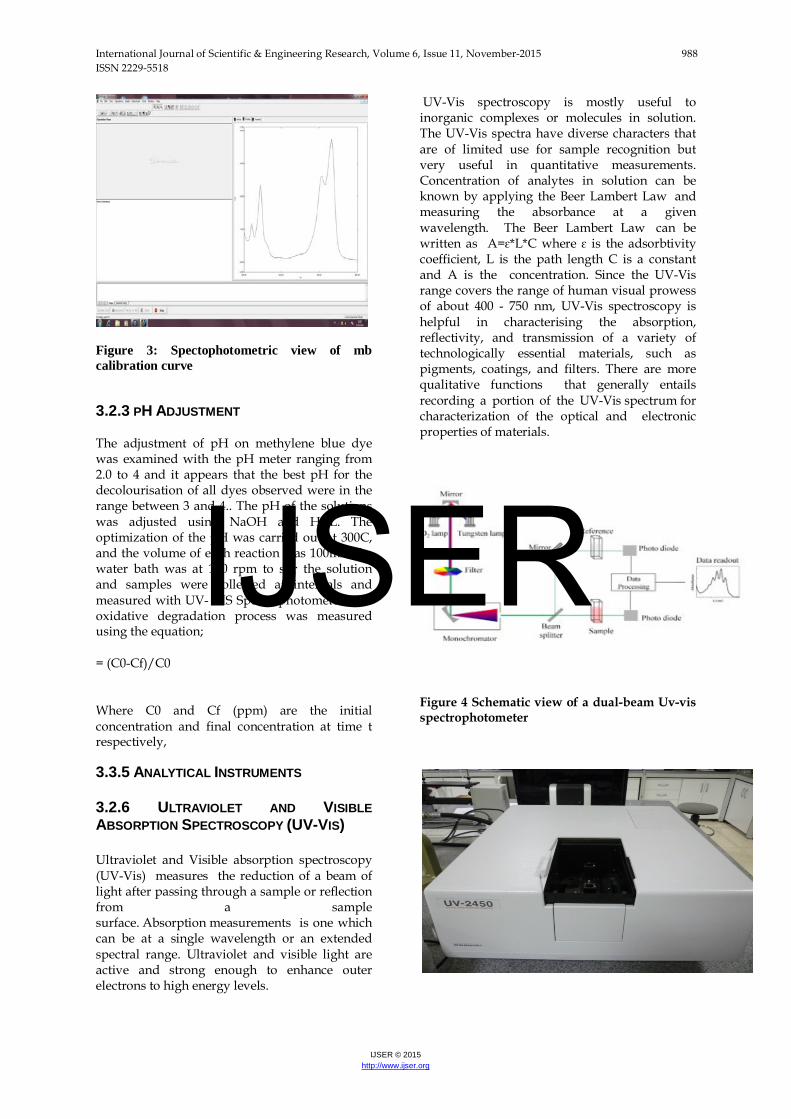
3.2.2 CONCENTRATION MEASUREMENT A calibration curve is a method of determining the concentration of a substance in an unknown sample by comparing the unknown with the set of known concentration which shows how the system response to analytical signal that changes with the change in the concentration of the analyte (the substance to be measured)which is dye in this study. A series of dye stock concentration were prepared to get 1ppm, 1.5ppm, 2ppm, 2.5ppm, 3ppm which are within the ranges of concentrations to be analysed in the unknown samples and are used to get the calibration points as shown in the figure below
Formula to calculate concentrations x=(y- 0.04)/0.107 x= conc y= absorbance
Figure 2 An image of calibration curve used
IJSER
International Journal of Scientific & Engineering Research, Volume 6, Issue 11, November-2015 988 ISSN 2229-5518
IJSER © 2015 http://www.ijser.org
Figure 3: Spectophotometric view of mb calibration curve
3.2.3 PH ADJUSTMENT
The adjustment of pH on methylene blue dye was examined with the pH meter ranging from 2.0 to 4 and it appears that the best pH for the decolourisation of all dyes observed were in the range between 3 and 4.. The pH of the solutions was adjusted using NaOH and HCL. The optimization of the pH was carried out at 300C, and the volume of each reaction was 100ml. The water bath was at 120 rpm to stir the solution and samples were collected at intervals and measured with UV- VIS Spectrophotometer. The oxidative degradation process was measured using the equation;
= (C0-Cf)/C0
Where C0 and Cf (ppm) are the initial concentration and final concentration at time t respectively,
3.3.5 ANALYTICAL INSTRUMENTS 3.2.6 ULTRAVIOLET AND VISIBLE ABSORPTION SPECTROSCOPY (UV-VIS)
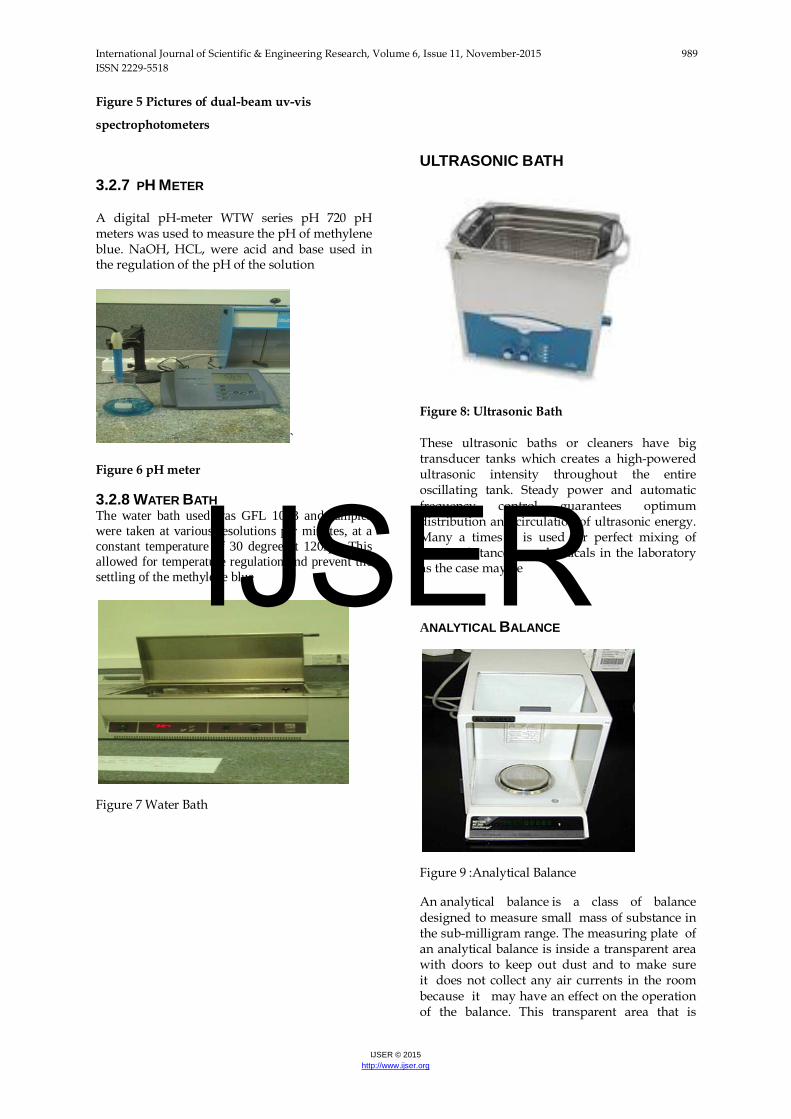
Ultraviolet and Visible absorption spectroscopy (UV-Vis) measures the reduction of a beam of light after passing through a sample or reflection from a sample surface. Absorption measurements is one which can be at a single wavelength or an extended spectral range. Ultraviolet and visible light are active and strong enough to enhance outer electrons to high energy levels.
UV-Vis spectroscopy is mostly useful to inorganic complexes or molecules in solution. The UV-Vis spectra have diverse characters that are of limited use for sample recognition but very useful in quantitative measurements. Concentration of analytes in solution can be known by applying the Beer Lambert Law and measuring the absorbance at a given wavelength. The Beer Lambert Law can be written as A=ɛ*L*C where ɛ is the adsorbtivity coefficient, L is the path length C is a constant and A is the concentration. Since the UV-Vis range covers the range of human visual prowess of about 400 - 750 nm, UV-Vis spectroscopy is helpful in characterising the absorption, reflectivity, and transmission of a variety of technologically essential materials, such as pigments, coatings, and filters. There are more qualitative functions that generally entails recording a portion of the UV-Vis spectrum for characterization of the optical and electronic properties of materials.
Figure 4 Schematic view of a dual-beam Uv-vis spectrophotometer
IJSER
International Journal of Scientific & Engineering Research, Volume 6, Issue 11, November-2015 989 ISSN 2229-5518
IJSER © 2015 http://www.ijser.org
Figure 5 Pictures of dual-beam uv-vis
spectrophotometers
3.2.7 PH METER
A digital pH-meter WTW series pH 720 pH meters was used to measure the pH of methylene blue. NaOH, HCL, were acid and base used in the regulation of the pH of the solution
`
Figure 6 pH meter
3.2.8 WATER BATH The water bath used was GFL 1083 and samples were taken at various resolutions per minutes, at a constant temperature of 30 degree at 120rpm.This allowed for temperature regulation and prevent the settling of the methylene blue
Figure 7 Water Bath
ULTRASONIC BATH
Figure 8: Ultrasonic Bath
These ultrasonic baths or cleaners have big transducer tanks which creates a high-powered ultrasonic intensity throughout the entire oscillating tank. Steady power and automatic frequency control guarantees optimum distribution and circulation of ultrasonic energy. Many a times it is used for perfect mixing of some substances or chemicals in the laboratory as the case may be
ANALYTICAL BALANCE
Figure 9 :Analytical Balance
An analytical balance is a class of balance designed to measure small mass of substance in the sub-milligram range. The measuring plate of an analytical balance is inside a transparent area with doors to keep out dust and to make sure it does not collect any air currents in the room because it may have an effect on the operation of the balance. This transparent area that is
IJSER

International Journal of Scientific & Engineering Research, Volume 6, Issue 11, November-2015 990 ISSN 2229-5518
IJSER © 2015 http://www.ijser.org
enclosed is called a draft shield. The use of a mechanically vented balance safety area, which has distinctively designed acrylic airfoils, permits a smooth turbulence-free airflow that prevents balance fluctuation. Analytical balance measures mass up to as low as 0.1 mg or better still it measures down to 1μg without fluctuations or loss of product. Also, the sample to be measured must be at room temperature to prevent natural convection from forming air currents inside the enclose area causing an error when taking readings. A single pan mechanical substitution balances maintains and keep consistent response throughout the operation. Useful capacity can be achieved by keeping a constant load on the balance beam
CHAPTER 4
4.1 RESULT AND DISCUSSION
In this chapter the results of varying all the parameters used in the oxidation of dye using Fenton reaction are going to be discussed. The effect of temperature, pH, and Fe and H2O2 will be discussed individually.
4.2 AOP EXPERIMENTS
Of all the advanced oxidation processes, the Fenton-like oxidation process was selected as it is advantageous over other technologies to degrade a wide variety of hazardous organics and also this treatment is quite cost-effective. The Fe2+/ H2O2 oxidation has been studied for aqueous dye solutions having dye concentration in the range (10ppm – 30ppm) The concentrations of Fe2+and H2O2 were varied in the range from (1ppm – 4ppm) and (50 – 200ppm), respectively.
4.3 FIRST ORDER REACTION
First Order Reaction is a reaction that depends on the concentration of only one reactant. Mathematically it can be written as C=Ci*exp(-k*t)
T = Time
C = The concentration of the reactant
Ci = The initial concentration of reactant
K = Reaction rate constant which is usually described as the Arrhenius equation
R = The universal gas constant
4.4 EFFECT OF PH
The effect of pH on the degradation or removal of pollutant is one of the most important parameters. pH plays a vital role on the degradation or removal of dye and as the percentage may increase or decreases with increasing ph or vice versa. The removal of dye was carried in the pH range of 2 to 4.
Hcl and NaOH was used to adjust the pH respectively and pH 3 was used as the working range for this experiment at 30oC with the dye concentration set at 10ppm, Fe2+ at 1ppm and H2O2 at 100ppm which were the optimum values. The effect of pH on the degradation of dye is shown below and it can be seen that as the ph increases with time the rate of removal or degradation was also faster and the colour of dye disappears very rapidly given below are the result
Table 2: A Table Showing Time and Ph
Figure 10: A graph showing the effect of pH(experimental conditions include 30OCtemperature, 10ppm dye, 100ppm H2O2 and 1ppm Fe2+)
EFFECT OF pH
0,00
20,00
40,00
60,00
80,00
100,00
120,00
0,00 5,00 10,00 15,00 20,00 25,00 30,00 35,00
TIME
DYE(
%) pH 2
pH 3
pH 4
TIME(min)
0,00
2,00
4,00
8,00
10,00
15,00
18,00
20,00
25,00
30,00
pH 2 100,00 65,00 35,00 30,00 29,00 27,00 25,50 24,00 20,00 17,50
pH 3 100,00 91,67 16,67 6,67 6,00 5,33 4,50 3,83 3,50 3,00
pH 4 100,00 75,00 40,25 19,75 12,75 8,00 7,00 6,25 5,00 3,75 IJSER

International Journal of Scientific & Engineering Research, Volume 6, Issue 11, November-2015 991 ISSN 2229-5518
IJSER © 2015 http://www.ijser.org
4.5 EFFECT OF TEMPERATURE ON DYE Experiments were conducted at four different temperatures between 30oC and 60oC under uniform conditions to examine the effect of temperature on the degradation of aqueous dye solutions. The results below shows that there is a substantial increase in the extent of degradation of the dye when the reaction temperature was raised from 30oC to 45oC. A further increase in the reaction temperature from 45 to 50oC resulted in the increase in the extent of degradation of the dye. Moreover, there was further increase in the rate and extent of degradation of the reaction in the temperature between 50 and 60oC. At higher reaction temperatures, the thermal disintegration of the hydrogen peroxide resulted in the slowing down of its effective concentration towards making hydroxyl radicals, and this is most likely the reason behind lower conversion of the dye at high reaction temperatures.
Table 3: A Table Showing Temperature and Time
Figure 11: A graph showing the effect of temperature (experimental conditions include pH 3, 10ppm dye, 100ppm H2O2 and 1ppm Fe2+) 4.6 EFFECT OF IRON (FE) Fenton chemistry is a well known and its one of the high potential oxidation technologies because it produces a highly reactive specie {OH-}(Fenton 1894; Haber 1934.). Following the equation of the reaction below,
degradation of methylene blue using fenton is being investigated. its is also clear from the equation above that degradation of methylene blue not only follow this reaction but other reaction also play important roles in the degradation. Degradation of methylene blue occurred within 30minutes using fenton process and the degradation of dye was gradual which means the oxidant specie OH which was responsible for the degradation was generated continuously. It was also observed that there was no precipitation of iron hydroxide at the end of the degradation. Addition of Fe alone to the dye solution in the absence of H2O2 was found to have no measurable effect on the oxidation of dye neither was there any change in the degradation or removal of colour in the dye. Therefore it can be said that there is a gradual degradation of dye using Fenton reaction. It was also found out from literature that fenton process works best with the range between 1 and 4. Optimisation was done using four different concentrations which ranges from 1 - 4 mg/l(1, 2, 3 and 4 mg/l) Fe (II) was used to find the optimum dose of Fe(II) for Fenton process. In
EFFECT OF TEMPERATURE
0
20
40
60
80
100
120
0,00 5,00 10,00 15,00 20,00 25,00 30,00 35,00TIME
DYE
(%)
Temp at 30oC
Temp at 45oC
Temp at 50oC
Temp at 60oC
Time (Minutes)
0,00
2,00
4,00
8,00
10,00
15,00
18,00
20,00
25,00
30,00
Temp at 30oC
100,00 97,14 89,29 79,14 72,86 58,14 50,00 42,86 27,86 17,43 Temp at 45oC
100,00 98,46 80,15 54,62 42,00 22,00 15,23 12,15 8,00 6,31 Temp at 50oC
100,00 84,00 18,40 15,60 14,80 14,00 13,20 12,00 10,00 8,80 Temp at 60oC
100,00 70,00 55,00 34,00 30,00 25,00 22,00 21,00 18,00 15,00
IJSER

International Journal of Scientific & Engineering Research, Volume 6, Issue 11, November-2015 992 ISSN 2229-5518
IJSER © 2015 http://www.ijser.org
order to achieve this Dye and H2O2 concentrations was kept constant at 10ppm and
100ppm respectively, Result were given in the graph below. 1mg/l of Fe(II) was chosen because faster elimination occurred at this dosage and dye was degraded completely at 30minutes.Looking at the graph below we can see a considerable trend in the degradation of dye from 9.91 to 0.05ppm that is as the time increase the removal or the rate of degradation of dye increase and from the exponential graph below we could also see the R2 of the graph to be 0.98 therefore as time increases the rate of removal is faster and there was 99% removal this percentage was determined using the equation% Removal= (C0-Cf)/C0 Where C0 and Cf
(ppm) are the initial concentration and final concentration at time t respectively, At the end of 30 minutes, 1mg/l of FeSO4.7H2O degraded 10ppm of dye methylene blue and 100pm of H2O2 Hydrogen peroxide with 99% removal
Table 4: A Table Showing The Effect Of Fe On The Degradation Dye
Figure 12: A graph showing the exponential effect of Fe on the degradation of dye Table 5: A Table showing the conc(ppm) K and R2
4.7 EFFECT OF H2O2 ON DYE DEGRADATION In order to investigate the effect of H2O2 concentration on the degradation kinetics, experiments was conducted at different H2O2concentrations. The H2O2 concentration was varied from 50ppm – 200 ppm at a fixed Fe2+concentration of 1ppm and dye concentration of 10ppm the H2O2 concentration of 100ppm was effective in degrading about 99% of dye in 20 minutes at 30◦C temperature. 100ppm was selected as optimum H2O2 concentration that is efficient for the degradation of the dye. The selection of this optimum concentration is important from the commercial point of view (due to the cost of H2O2). De et al. H2O2 concentration for the breaking down of methylene blue by Fenton’s reagent could be explained as follows. At low H2O2 concentration, the HO• radicals preferentially attack the benzene ring of the organic contaminant present in water. At high H2O2 concentration however, there is a competition between the substrate and H2O2; in
other words, H2O2 in high concentration acts as a scavenger of the highly potent HO• radicals to produce per hydroxyl radical, HO2•
Time 0,00 2,00 4,00 8,00 10,00 15,00 18,00 20,00 25,00 30,00 Effect of Fe2+ removal(1ppm) 100 56,1 45,41 29,57 22 9,69 5,55 3,63 1,21 0,5 Effect of Fe2+ removal(2ppm 100 54,79 44,6 36,73 24,52 18,37 5,55 3,53 1,41 1,21 Effect of Fe2+ removal(3ppm) 100 67 48,34 13,72 4,54 3,63 2,52 1,31 1,01 1,01 Effect of Fe2+ removal(4ppm) 100 46,42 26,84 4,74 3,33 2,32 1,51 1,21 1,11 1,01
concentration in ppm K R2
1 0.17 0.989
2 0.2 0.959
3 0.2 0.941
4 0.28 0.675
IJSER

International Journal of Scientific & Engineering Research, Volume 6, Issue 11, November-2015 993 ISSN 2229-5518
IJSER © 2015 http://www.ijser.org
Overall efficacy of Fe2+ / H2O2 is thus found to be low at relatively higher H2O2concentrations.
H2O2+ HO• = HO2• + H2O
HO2•- H+ + O2•−
Looking at the table below it could be seen that there was effective removal of dye as time increase at 20 minutes withH2O2and the percentage removal was calculated using the equation % Removal= (C0-Cf)/C0 Where C0 and Cf (ppm) are the initial concentration and final concentration at time t respectively, and 99% removal was achieved and the exponential effect was also analysed and the R2 was seen to be at 0.96 all results and tables were given below as analysed
Table 6: A table showing the concentration of dye and H202with Time
Figure 13: Exponential Effective Degradation of 10mg/l of Mb under Various H202 Dosages and 1mg/L of Fe(II)
Table:7 A Table Showing the Exponential Effect of H2O2with its Concentration, K values and R 4.8 EFFECT OF INITIAL DYE CONCENTRATION The influence of various initial dye concentrations on decolourisation efficiency was investigated and the optimum dye concentration was determined. Concentrations of dye solution having 10ppm, 15ppm, 20ppm, 25ppm and 30ppm were separately treated with Fenton reagent solutions and 10ppm was taken as the optimum concentration because there was 99% of removal as shown below
0
2
4
8
10
15
18
20
100,00 40,36 20,48 6,56 5,05 2,32 1,51 0,86
100,00 43,39 10,39 3,53 2,12 1,31 1,01 0,91
100,00 65,79 63,27 57,52 53,78 43,90 38,65 33,91
100,00 68,42 62,26 58,53 52,77 48,13 43,39 38,65
0 2 4 8 10 15 18 20 25 30
Time
Conc of dye10(ppm) 100 80,7 60,5 36,7 28,4 5,4 3,5 2,6 1,6 0,9
Conc of dye15(ppm) 100 78,8 65,7 43,6 33,2 14,7 4,7 2,8 2,4 2,2
Conc of dye20(ppm) 100 55,8 39,6 19,8 11,6 5,0 3,0 2,3 1,8 1,6
Conc of dye25(ppm) 100 56,7 39,9 24,0 19,4 6,4 3,4 2,8 2,4 2,3
Conc of dye30(ppm) 100 53,2 33,0 16,7 11,8 3,7 3,0 2,8 2,6 2,5
concentration in ppm K R2 50 0.04 0.919 100 0.21 0.964 150 0.03 0.879 200 0.22 0.875
IJSER

International Journal of Scientific & Engineering Research, Volume 6, Issue 11, November-2015 994 ISSN 2229-5518
IJSER © 2015 http://www.ijser.org
The result from the graph below shows that there is increase exponentially with time. Therefore it can be seen that there is consistent degradation of dye as the time increases. From the table below the time was taken from 0 to 30 minutes and there was a considerate degradation in the absorbance with time as the time increases. Using the equation % Removal = (C0-Cf)/C0 Where C0 and Ct (ppm) are the initial concentration and final concentration at time t respectively, 99% removal was achieved using the values from the table above therefore we conclude that there was efficient removal of dye after 30 minutes. The exponential effect was also analysed and the result is also given below with its R2 =0.96
Table 8: A table showing the concentration of dye and time
Figure 14: Effect of the exponential effect of dye Table 9:Table showing the conc(ppm) K and R2
The removal of methylene blue was investigated under the following parameters: Effect of pH, Fe2+dose, temperature, and H2O2 concentration. Experiments were carried out with different
initial dye concentrations (10, 15, 20, 25 and 30 ppms) and it was found that degradation efficiency was maximum at 10ppm. The iron dosage was set to 1mg/l after optimizing with (1, 2, 3, and 4 mg/l). The Degradation of methylene blue occurred within 30minutes using fenton process and the degradation of dye was gradual which means the oxidant specie OH which was responsible for the degradation was generated continuously. It was also observed that there was no precipitation of iron hydroxide at the end of the degradation. Similarly, concentration range at of H2O2 (hydrogen peroxide) addition was optimised using (50, 100, 150, and 200 mg/l) and 100 mg/l was selected as an optimum value where maximum dye removal was observed Concentration measurement of dye was done by using visible spectrophotometer at 650nm wavelength. Experiments on temperature were conducted at four different temperatures between 30oC and 60oC under uniform conditions to examine the effect of temperature on the degradation of aqueous dye solutions The result shows that there is substantial increase in the extent of degradation of the dye when the reaction temperature was raised from 30oC to 45oC. A further increase in the reaction temperature from 45 to 50oC resulted in the increase in the extent of degradation of the dye. Moreover, there was further increase in the rate and extent of degradation of the reaction in the temperature between 50oC and 60oC. At higher reaction temperatures, the thermal disintegration of the hydrogen peroxide (H2O2) resulted in the slowing down of its effective concentration towards making hydroxyl radicals, and this is most likely the reason behind lower conversion of the dye at high reaction temperatures. At 30 degrees it there was a linear increase and there was a decrease exponentially from 45 to 60 degrees respectively. The effect of pH on the degradation or removal of pollutant was also considered as is one of the most important parameters and pH plays a vital role on the degradation or removal of dye and as the percentage may increase or decreases with increasing ph or vice versa. The removal of dye was carried in the pH range of 2 to 4. HCl and NaOH was used to adjust the pH respectively and pH 3 was used as the working range for this experiment at 30oC with the dye concentration set at 10ppm, Fe2+ at 1ppm and H2O2 at 100ppm which were the optimum value. Optimum pH was found to be 3.0 where by 99% removal of dye was achieved within 30 minutes CONCLUSIONS
concentration in ppm K R2 10 0.16 0.968 15 0.14 0.943 20 0.16 0.905 25 0.15 0.904 30 0.16 0.798
IJSER
International Journal of Scientific & Engineering Research, Volume 6, Issue 11, November-2015 995 ISSN 2229-5518
IJSER © 2015 http://www.ijser.org
This work focuses on the application of fenton process for the removal of methylene blue, a dye compound from water solution. Fenton process is powerful type of advance oxidation technique and it relies on the addition of iron (II) and H2O2 (hydrogen peroxide) to create free radicals in the medium which causes effective removal of organic contaminants. It is therefore recommended that further studies should be conducted to see the removal of TOC and the remaining toxic effects of the resulting solution. REFERENCE [1] Augustine, E.O., 2008. Biochem. Eng. J. 40, 8–18. [2] Bukallah, S.B., Rauf, M.A., Alali, S.S., 2007. Dyes Pigments 74, 85–87. chemical biodegradability, Water Res. 35 (2001) 1047–1051. [3] Cheng, W., Wang, S., Lu, L., Gong, W., Liu, X., Gao, B., Zhang, H., 2008. Biochem. Eng. J. 39, 538–546. comparison among photocatalysis, Fenton and photo-Fenton processes [4] Daneshvar, N., Ashassi-Sorkhabi, H., Tizpar, A., 2003. Sep. Purif. [5] Gong, R., Sun, J., Zhang, D., Zhang, K., Zhong, K., Zhu, G., 2008. Bioresour. Technol. 99, 4510–4514. [6] H.J.H. Fenton, J. Chem. Soc. 65 (1894) 899. [7] H.J.H. Fenton, Oxidation of tartaric acid in the presence of iron, J. Chem. Soc. Trans. 65 (1894) 899–910. [8] Lata, H., Garg, V.K., Gupta, R.K., 2008. Desalination 219, 250–261.Li, Y.S., 1999. Waste Manage. 19, 495–502. [9] Namasivayam, C., Radhika, R., Suba, S., 2001. Waste Manage. 21,381–387. [10] Rauf, M.A., Bukallah, S.B., Hamour, F.A., Nasir, A.S., 2008.
[11] Xiaofei, X., Khalil, H., 2008. J. Hazard. Mater. 166, 407–414. [12] Zollinger, H., 1991. Color Chemistry Synthesis, Properties and Applications of Chemistry and Pigments, second ed. VCH, Weinheim. ABOUT THE AUTHOR Elegbeleye Oladipo Ayodamope, is currently a PHD student of Evironmental Science in Cyprus International University, Lefkosa, via Mersin 10, Turkey. His research interests is Advance oxidation processing. E-mail:[email protected] IJSER