index of multiple deprivation 2015 borough level results · pdf file1 index of multiple...
TRANSCRIPT

1
Index of Multiple Deprivation 2015 – Borough level results Executive Summary DCLG has recently published the latest Index of Multiple Deprivation (IMD 2015), comprising deprivation scores and National ranks for all LSOAs in England, plus LEP and borough summary results. Since it uses the same methodology and very similar indicators to the previous analyses (in 2007 and 2010), the results are effectively comparable. In general, the results of IMD 2015 are consistent with those of previous IMDs, with no major changes to the pattern and extent of deprivation in the Tees Valley. The Tees Valley still has a high proportion of LSOAs within the national most deprived 10%. Ward level results have been calculated by TVU and summary tables for each borough included in Annex 3. Maps at LSOA and ward level by borough have also been produced and can be found in Annex 4. At the borough level and out of 326 districts nationally, Middlesbrough has the highest proportion of LSOAs within the national most deprived 10% with Hartlepool 10th, Redcar & Cleveland 33rd, Stockton-on-Tees 47th and Darlington 58th. 1 Introduction and Methodology The IMD 2015 uses an identical methodology to previous IMDs, where a wide variety of indicators are combined into seven domains as pictured below. Note that the domains are given different weightings reflecting their perceived impact on the overall IMD measure.
These domains are then combined into overall deprivation scores for each LSOA, which are then
ranked. The indicators used in the IMD 2015 are listed in Annex 1. They are generally similar to
those used in the IMD 2010 and IMD 2007 previously, so as the same methodology is used, the
results are of the three analyses are effectively comparable. As before, results are calculated for
LSOAs within England and summaries of the LSOA results are published at LEP and borough level.
2
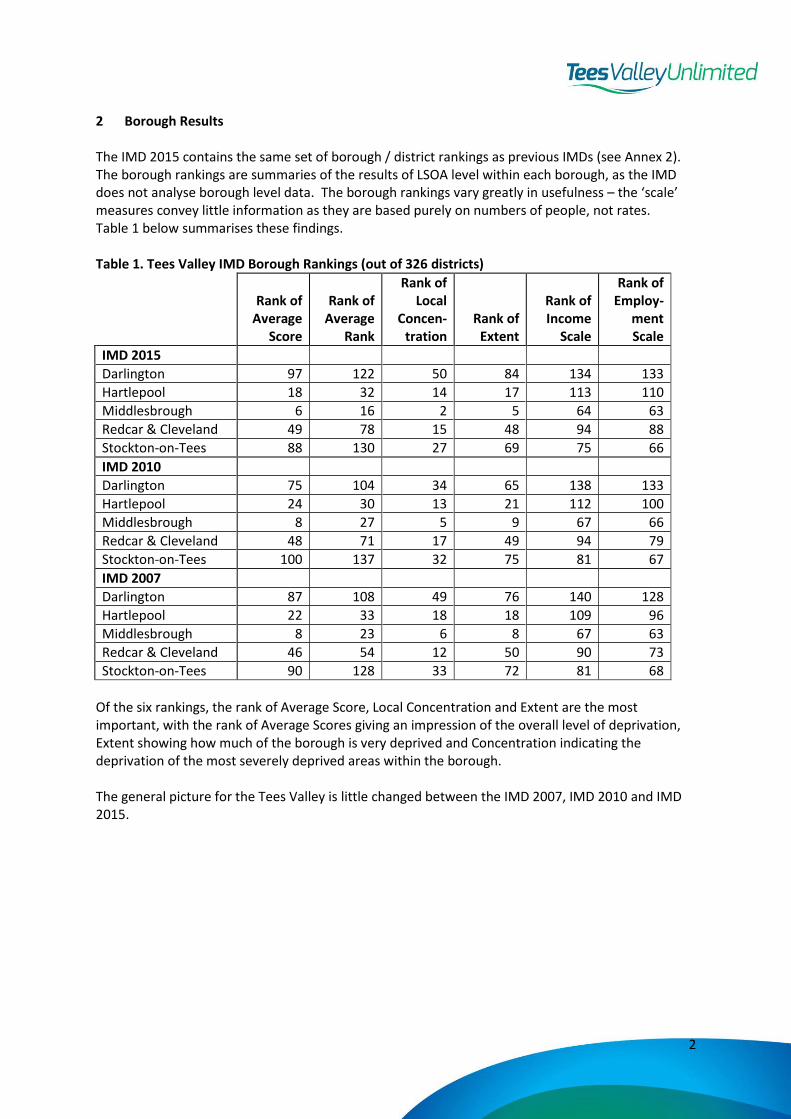
2 Borough Results The IMD 2015 contains the same set of borough / district rankings as previous IMDs (see Annex 2). The borough rankings are summaries of the results of LSOA level within each borough, as the IMD does not analyse borough level data. The borough rankings vary greatly in usefulness – the ‘scale’ measures convey little information as they are based purely on numbers of people, not rates. Table 1 below summarises these findings. Table 1. Tees Valley IMD Borough Rankings (out of 326 districts)
Rank of Average
Score
Rank of Average
Rank
Rank of Local
Concen- tration
Rank of Extent
Rank of Income
Scale
Rank of Employ-
ment Scale
IMD 2015
Darlington 97 122 50 84 134 133
Hartlepool 18 32 14 17 113 110
Middlesbrough 6 16 2 5 64 63
Redcar & Cleveland 49 78 15 48 94 88
Stockton-on-Tees 88 130 27 69 75 66
IMD 2010
Darlington 75 104 34 65 138 133
Hartlepool 24 30 13 21 112 100
Middlesbrough 8 27 5 9 67 66
Redcar & Cleveland 48 71 17 49 94 79
Stockton-on-Tees 100 137 32 75 81 67
IMD 2007
Darlington 87 108 49 76 140 128
Hartlepool 22 33 18 18 109 96
Middlesbrough 8 23 6 8 67 63
Redcar & Cleveland 46 54 12 50 90 73
Stockton-on-Tees 90 128 33 72 81 68
Of the six rankings, the rank of Average Score, Local Concentration and Extent are the most important, with the rank of Average Scores giving an impression of the overall level of deprivation, Extent showing how much of the borough is very deprived and Concentration indicating the deprivation of the most severely deprived areas within the borough. The general picture for the Tees Valley is little changed between the IMD 2007, IMD 2010 and IMD 2015.

3
3 Analysis of LSOA Rankings The proportion of LSOAs within the most deprived 10% nationally can be calculated for all local authorities and ranked, as shown in Table 2 below. These generally show little change with Middlesbrough having the highest proportion of LSOAs in the most deprived 10% in the country. Table 2. Ranks of Percentage of Borough’s LSOAs within most deprived 10%
2015 2010 2007
Darlington 58 45 52
Hartlepool 10 10 14
Middlesbrough 1 1 6
Redcar & Cleveland 33 36 40
Stockton-on-Tees 47 57 62
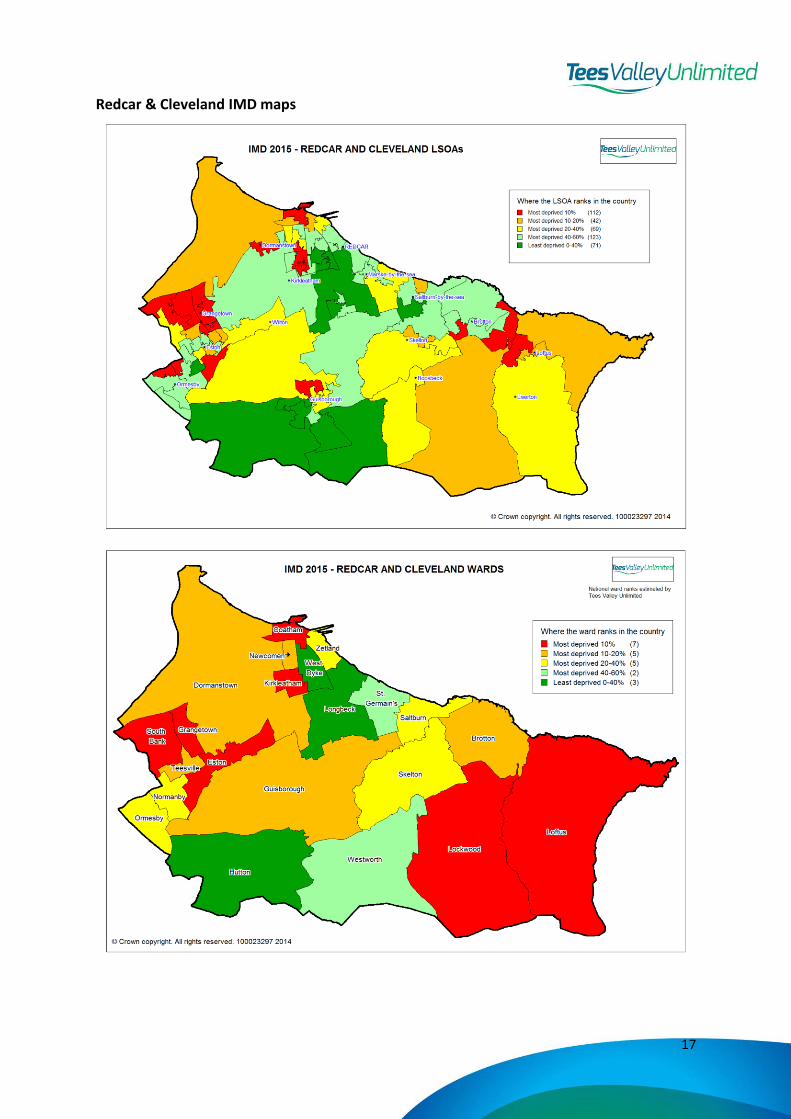
The map below shows the distribution of LSOA scores across Tees Valley. The five bandings - Most deprived 10%, Most deprived 10-20%, Most deprived 20-40%, Most deprived 40-60% and Least deprived 40% - are consistent with those applied in the borough level maps presented in Annex 4.
4
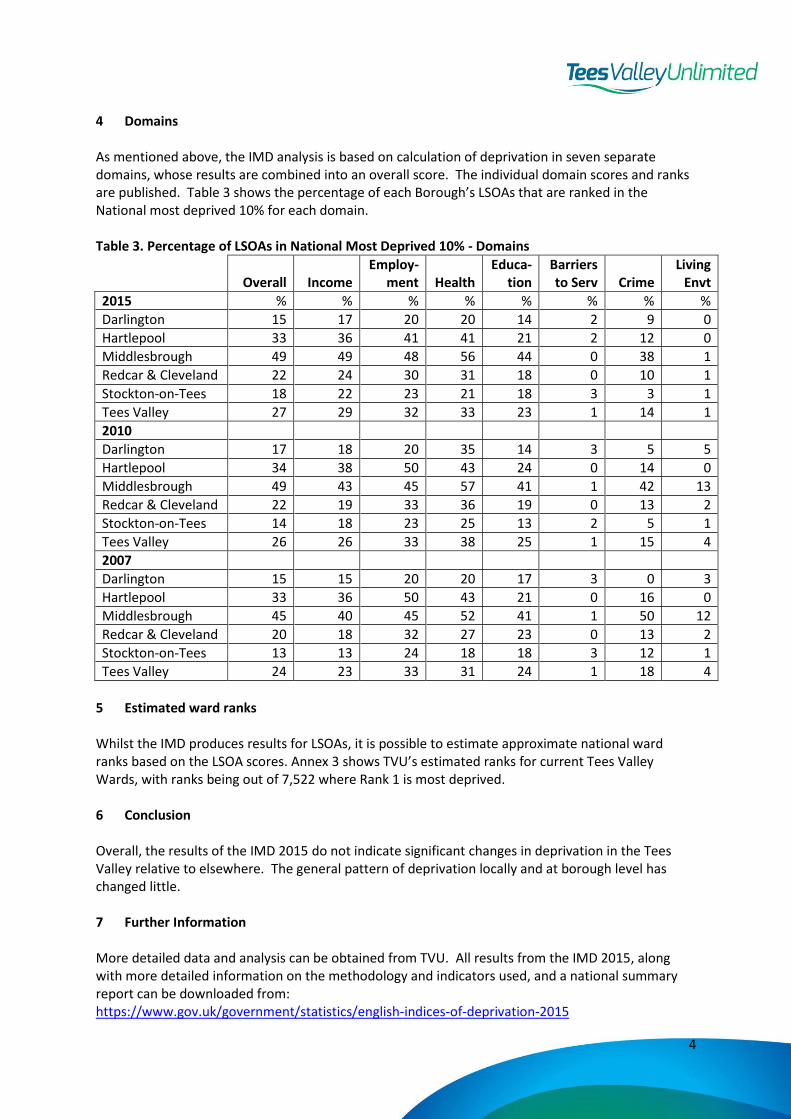
4 Domains As mentioned above, the IMD analysis is based on calculation of deprivation in seven separate domains, whose results are combined into an overall score. The individual domain scores and ranks are published. Table 3 shows the percentage of each Borough’s LSOAs that are ranked in the National most deprived 10% for each domain. Table 3. Percentage of LSOAs in National Most Deprived 10% - Domains
Overall Income Employ-
ment Health Educa-
tion Barriers to Serv Crime
Living Envt
2015 % % % % % % % %
Darlington 15 17 20 20 14 2 9 0
Hartlepool 33 36 41 41 21 2 12 0
Middlesbrough 49 49 48 56 44 0 38 1
Redcar & Cleveland 22 24 30 31 18 0 10 1
Stockton-on-Tees 18 22 23 21 18 3 3 1
Tees Valley 27 29 32 33 23 1 14 1
2010
Darlington 17 18 20 35 14 3 5 5
Hartlepool 34 38 50 43 24 0 14 0
Middlesbrough 49 43 45 57 41 1 42 13
Redcar & Cleveland 22 19 33 36 19 0 13 2
Stockton-on-Tees 14 18 23 25 13 2 5 1
Tees Valley 26 26 33 38 25 1 15 4
2007
Darlington 15 15 20 20 17 3 0 3
Hartlepool 33 36 50 43 21 0 16 0
Middlesbrough 45 40 45 52 41 1 50 12
Redcar & Cleveland 20 18 32 27 23 0 13 2
Stockton-on-Tees 13 13 24 18 18 3 12 1
Tees Valley 24 23 33 31 24 1 18 4
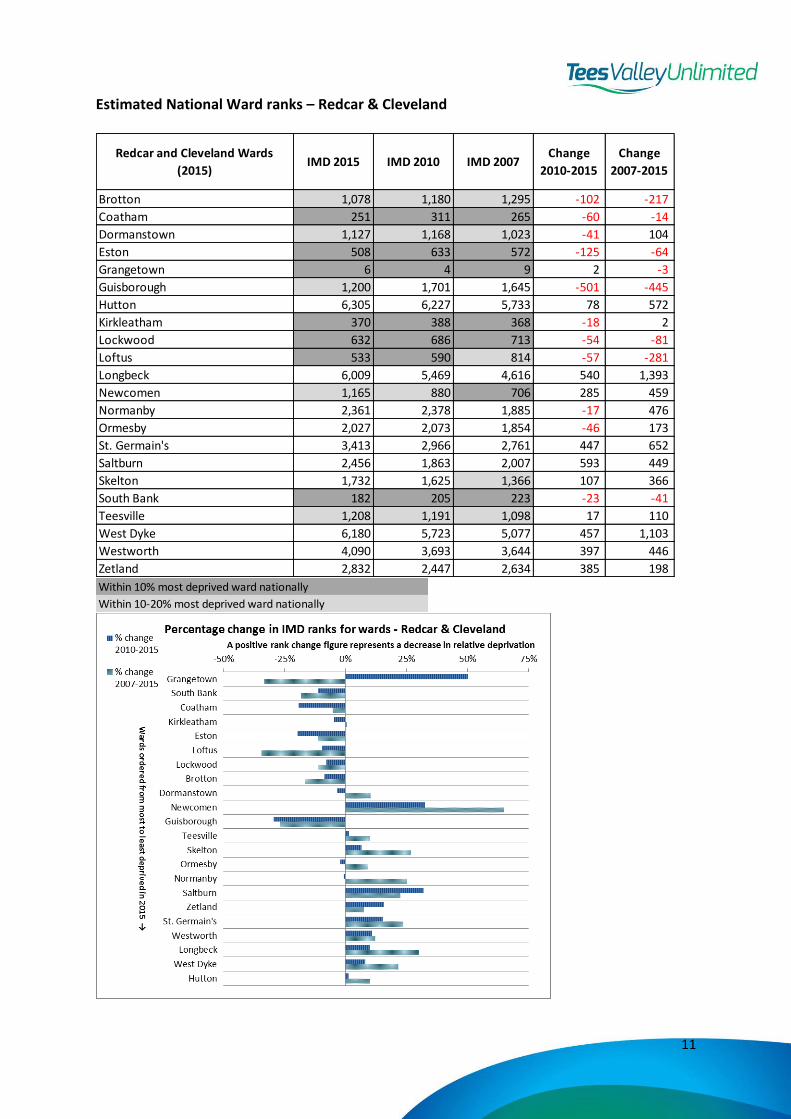
5 Estimated ward ranks Whilst the IMD produces results for LSOAs, it is possible to estimate approximate national ward ranks based on the LSOA scores. Annex 3 shows TVU’s estimated ranks for current Tees Valley Wards, with ranks being out of 7,522 where Rank 1 is most deprived. 6 Conclusion Overall, the results of the IMD 2015 do not indicate significant changes in deprivation in the Tees Valley relative to elsewhere. The general pattern of deprivation locally and at borough level has changed little. 7 Further Information More detailed data and analysis can be obtained from TVU. All results from the IMD 2015, along with more detailed information on the methodology and indicators used, and a national summary report can be downloaded from: https://www.gov.uk/government/statistics/english-indices-of-deprivation-2015
5
Annex 1
Index of Multiple Deprivation 2015 Indicator List
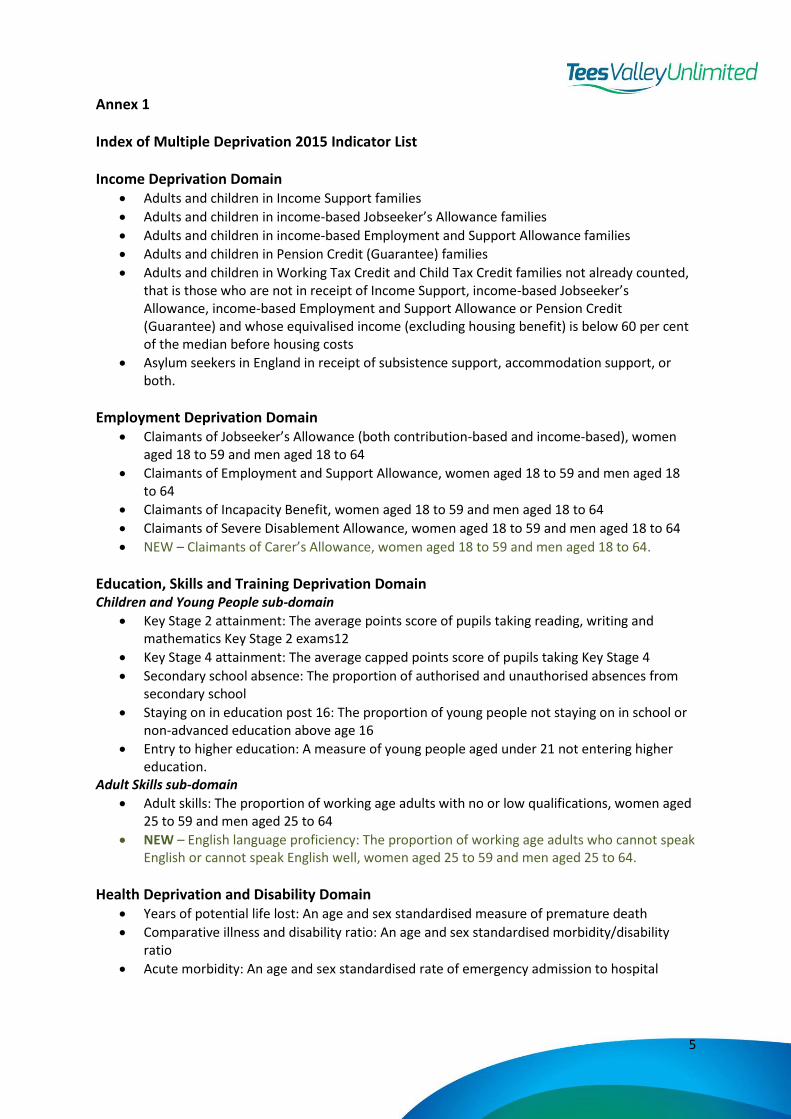
Income Deprivation Domain Adults and children in Income Support families
Adults and children in income-based Jobseeker’s Allowance families
Adults and children in income-based Employment and Support Allowance families
Adults and children in Pension Credit (Guarantee) families
Adults and children in Working Tax Credit and Child Tax Credit families not already counted, that is those who are not in receipt of Income Support, income-based Jobseeker’s Allowance, income-based Employment and Support Allowance or Pension Credit (Guarantee) and whose equivalised income (excluding housing benefit) is below 60 per cent of the median before housing costs
Asylum seekers in England in receipt of subsistence support, accommodation support, or both.
Employment Deprivation Domain Claimants of Jobseeker’s Allowance (both contribution-based and income-based), women
aged 18 to 59 and men aged 18 to 64
Claimants of Employment and Support Allowance, women aged 18 to 59 and men aged 18 to 64
Claimants of Incapacity Benefit, women aged 18 to 59 and men aged 18 to 64
Claimants of Severe Disablement Allowance, women aged 18 to 59 and men aged 18 to 64
NEW – Claimants of Carer’s Allowance, women aged 18 to 59 and men aged 18 to 64.
Education, Skills and Training Deprivation Domain Children and Young People sub-domain
Key Stage 2 attainment: The average points score of pupils taking reading, writing and mathematics Key Stage 2 exams12
Key Stage 4 attainment: The average capped points score of pupils taking Key Stage 4
Secondary school absence: The proportion of authorised and unauthorised absences from secondary school
Staying on in education post 16: The proportion of young people not staying on in school or non-advanced education above age 16
Entry to higher education: A measure of young people aged under 21 not entering higher education.
Adult Skills sub-domain
Adult skills: The proportion of working age adults with no or low qualifications, women aged 25 to 59 and men aged 25 to 64
NEW – English language proficiency: The proportion of working age adults who cannot speak English or cannot speak English well, women aged 25 to 59 and men aged 25 to 64.
Health Deprivation and Disability Domain Years of potential life lost: An age and sex standardised measure of premature death
Comparative illness and disability ratio: An age and sex standardised morbidity/disability ratio
Acute morbidity: An age and sex standardised rate of emergency admission to hospital
6
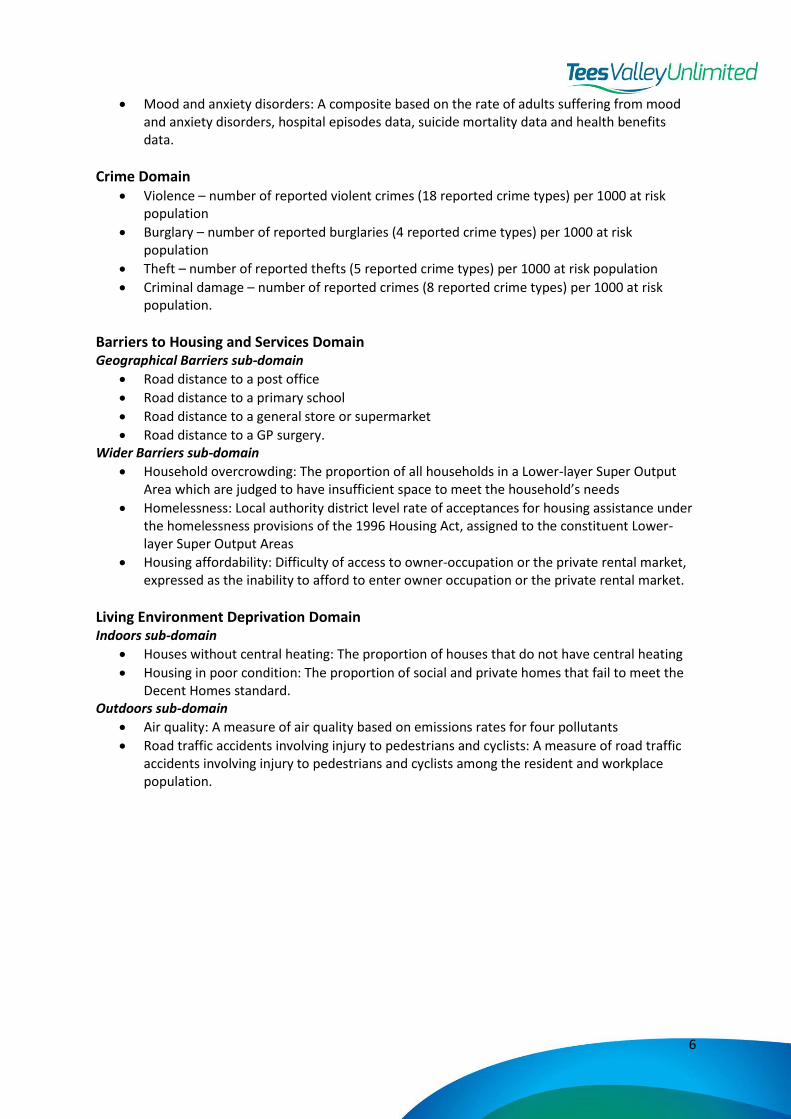
Mood and anxiety disorders: A composite based on the rate of adults suffering from mood and anxiety disorders, hospital episodes data, suicide mortality data and health benefits data.
Crime Domain Violence – number of reported violent crimes (18 reported crime types) per 1000 at risk
population
Burglary – number of reported burglaries (4 reported crime types) per 1000 at risk population
Theft – number of reported thefts (5 reported crime types) per 1000 at risk population
Criminal damage – number of reported crimes (8 reported crime types) per 1000 at risk population.
Barriers to Housing and Services Domain Geographical Barriers sub-domain
Road distance to a post office
Road distance to a primary school
Road distance to a general store or supermarket
Road distance to a GP surgery. Wider Barriers sub-domain
Household overcrowding: The proportion of all households in a Lower-layer Super Output Area which are judged to have insufficient space to meet the household’s needs
Homelessness: Local authority district level rate of acceptances for housing assistance under the homelessness provisions of the 1996 Housing Act, assigned to the constituent Lower-layer Super Output Areas
Housing affordability: Difficulty of access to owner-occupation or the private rental market, expressed as the inability to afford to enter owner occupation or the private rental market.
Living Environment Deprivation Domain Indoors sub-domain
Houses without central heating: The proportion of houses that do not have central heating
Housing in poor condition: The proportion of social and private homes that fail to meet the Decent Homes standard.
Outdoors sub-domain
Air quality: A measure of air quality based on emissions rates for four pollutants
Road traffic accidents involving injury to pedestrians and cyclists: A measure of road traffic accidents involving injury to pedestrians and cyclists among the resident and workplace population.

7
Annex 2 Index of Multiple Deprivation District Rankings
Average of LSOA Scores is the population weighted average of the combined scores for the LSOAs in a local authority district.
Average of LSOA Ranks is the population weighted average of the combined ranks for the LSOAs in a local authority district.
Extent is the proportion of a local authority district’s population living in the most deprived LSOAs in the country.
Local Concentration is the population weighted average of the ranks of a district’s most deprived LSOAs that contain exactly 10% of the local authority district’s population.
Income Scale is the number of people who are Income deprived (NB- Number not proportion).
Employment Scale is the number of people who are Employment deprived (NB- Number not proportion).

8
Annex 3 Estimated National Ward ranks – Darlington
Darlington Wards (2015) IMD 2015 IMD 2010 IMD 2007Change
2010-2015
Change
2007-2015
Bank Top & Lascelles 613 474 623 139 -10
Brinkburn & Faverdale 5,307 4,647 4,978 660 329
Cockerton 1,016 884 956 132 60
College 6,391 4,958 5,074 1,433 1,317
Eastbourne 1,281 649 574 632 707
Harrowgate Hill 4,437 4,071 4,089 366 348
Haughton & Springfield 2,072 2,075 1,981 -3 91
Heighington & Coniscliffe 5,533 5,438 5,157 95 376
Hummersknott 7,221 7,082 7,004 139 217
Hurworth 5,213 4,468 4,834 745 379
Mowden 7,322 6,828 7,021 494 301
North Road 622 574 965 48 -343
Northgate 419 267 438 152 -19
Park East 273 194 290 79 -17
Park West 4,644 3,988 4,079 656 565
Pierremont 2,114 1,783 2,103 331 11
Red Hall & Lingfield 861 930 952 -69 -91
Sadberge & Middleton St. George 5,248 4,535 4,552 713 696
Stephenson 724 466 598 258 126
Whinfield 2,953 2,899 3,024 54 -71 Within 10% most deprived ward nationally
Within 10-20% most deprived ward nationally

9
Estimated National Ward ranks – Hartlepool
Hartlepool Wards (2015) IMD 2015 IMD 2010 IMD 2007Change
2010-2015
Change
2007-2015
Burn Valley 486 661 758 -175 -272
De Bruce 390 293 341 97 49
Fens and Rossmere 2,338 1,797 1,773 541 565
Foggy Furze 1,252 1,153 1,163 99 89
Hart 4,674 4,952 3,475 -278 1,199
Headland and Harbour 137 99 109 38 28
Jesmond 303 274 316 29 -13
Manor House 147 176 172 -29 -25
Rural West 5,935 5,809 5,466 126 469
Seaton 2,529 2,157 2,127 372 402
Victoria 322 324 347 -2 -25
Within 10% most deprived ward nationally
Within 10-20% most deprived ward nationally

10
Estimated National Ward ranks – Middlesbrough
Middlesbrough Wards (2015) IMD 2015 IMD 2010 IMD 2007Change
2010-2015
Change
2007-2015
Acklam 5,438 5,211 3,847 227 1,591
Ayresome 670 581 546 89 124
Berwick Hills & Pallister 27 54 60 -27 -33
Brambles & Thorntree 10 22 23 -12 -13
Central 30 23 30 7 0
Coulby Newham 1,339 1,715 1,546 -376 -207
Hemlington 228 320 276 -92 -48
Kader 4,853 4,821 4,049 32 804
Ladgate 1,188 1,195 1,086 -7 102
Linthorpe 2,767 3,086 2,367 -319 400
Longlands & Beechwood 60 73 72 -13 -12
Marton East 5,614 4,837 3,618 777 1,996
Marton West 6,310 6,447 5,771 -137 539
Newport 38 87 123 -49 -85
North Ormesby 2 7 46 -5 -44
Nunthorpe 7,024 6,992 6,735 32 289
Park 742 1,070 953 -328 -211
Park End & Beckfield 99 164 130 -65 -31
Stainton & Thornton 2,013 2,721 2,575 -708 -562
Trimdon 4,956 5,011 4,445 -55 511
Within 10% most deprived ward nationally
Within 10-20% most deprived ward nationally
11
Estimated National Ward ranks – Redcar & Cleveland
Redcar and Cleveland Wards
(2015)IMD 2015 IMD 2010 IMD 2007
Change
2010-2015
Change
2007-2015
Brotton 1,078 1,180 1,295 -102 -217
Coatham 251 311 265 -60 -14
Dormanstown 1,127 1,168 1,023 -41 104
Eston 508 633 572 -125 -64
Grangetown 6 4 9 2 -3
Guisborough 1,200 1,701 1,645 -501 -445
Hutton 6,305 6,227 5,733 78 572
Kirkleatham 370 388 368 -18 2
Lockwood 632 686 713 -54 -81
Loftus 533 590 814 -57 -281
Longbeck 6,009 5,469 4,616 540 1,393
Newcomen 1,165 880 706 285 459
Normanby 2,361 2,378 1,885 -17 476
Ormesby 2,027 2,073 1,854 -46 173
St. Germain's 3,413 2,966 2,761 447 652
Saltburn 2,456 1,863 2,007 593 449
Skelton 1,732 1,625 1,366 107 366
South Bank 182 205 223 -23 -41
Teesville 1,208 1,191 1,098 17 110
West Dyke 6,180 5,723 5,077 457 1,103
Westworth 4,090 3,693 3,644 397 446
Zetland 2,832 2,447 2,634 385 198
Within 10% most deprived ward nationally
Within 10-20% most deprived ward nationally

12
Estimated National Ward ranks – Stockton-on-Tees
Stockton-on-Tees Wards (2015) IMD 2015 IMD 2010 IMD 2007Change
2010-2015
Change
2007-2015
Billingham Central 1,128 1,268 1,088 -140 40
Billingham East 461 647 668 -186 -207
Billingham North 5,067 5,350 4,901 -283 166
Billingham South 1,359 1,344 1,509 15 -150
Billingham West 6,035 5,523 5,007 512 1,028
Bishopsgarth and Elm Tree 3,141 3,071 3,362 70 -221
Eaglescliffe 6,410 6,501 5,973 -91 437
Fairfield 4,998 4,785 5,130 213 -132
Grangefield 4,960 4,825 4,437 135 523
Hardwick and Salters Lane 232 284 449 -52 -217
Hartburn 6,551 6,667 6,598 -116 -47
Ingleby Barwick East 6,732 7,317 7,261 -585 -529
Ingleby Barwick West 6,812 7,280 7,168 -468 -356
Mandale and Victoria 652 452 401 200 251
Newtown 129 180 203 -51 -74
Northern Parishes 6,302 6,557 6,157 -255 145
Norton North 1,064 989 951 75 113
Norton South 980 1,031 1,101 -51 -121
Norton West 5,958 5,980 5,534 -22 424
Parkfield and Oxbridge 505 592 664 -87 -159
Roseworth 459 768 797 -309 -338
Stainsby Hill 796 870 897 -74 -101
Stockton Town Centre 13 13 12 0 1
Village 1,775 1,435 1,455 340 320
Western Parishes 4,545 4,203 4,061 342 484
Yarm 6,490 6,244 5,576 246 914
Within 10% most deprived ward nationally
Within 10-20% most deprived ward nationally

13
Annex 4 Darlington IMD maps

14
Hartlepool IMD maps

15
Middlesbrough IMD maps

16
17
Redcar & Cleveland IMD maps

18
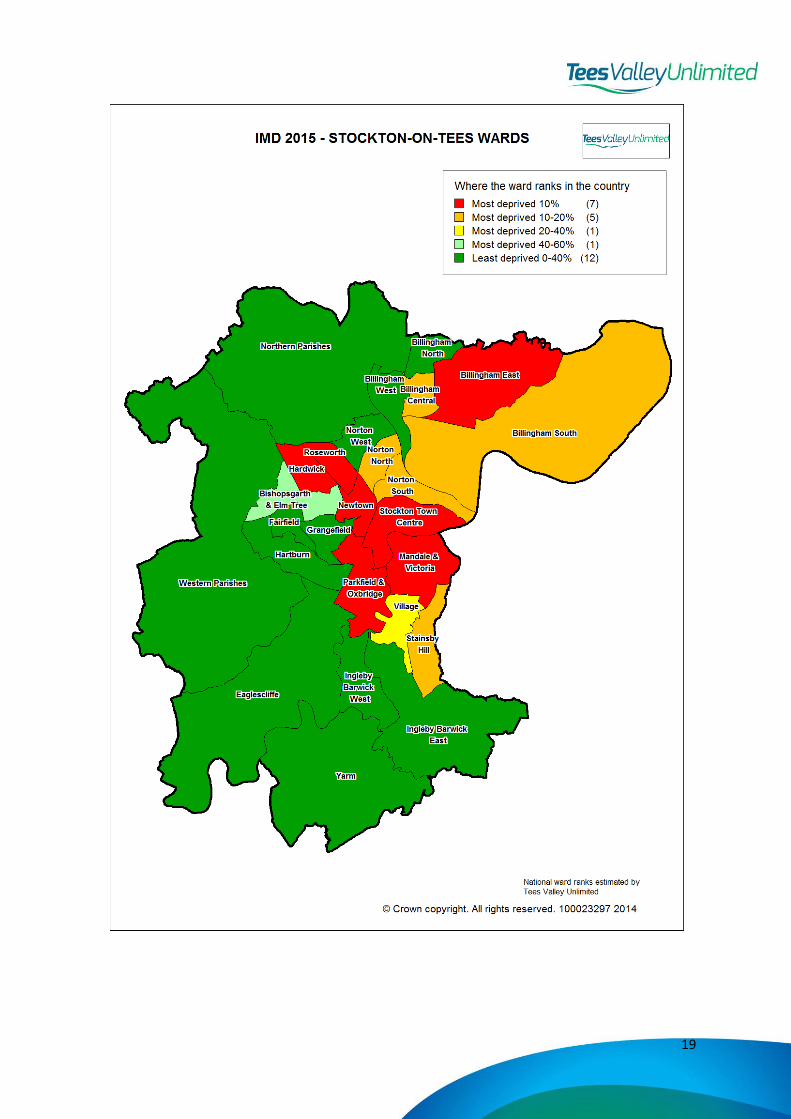
Stockton-on-Tees IMD maps
19