increasing machine utilization using total productive
TRANSCRIPT
INCREASING MACHINE UTILIZATION USING
TOTAL PRODUCTIVE MAINTENANCE IN DIE CAST
MACHINE IN TOY MANUFACTURING COMPANY
By
Sarah Christina Philip
ID No. 004201300048
A Thesis presented to the Faculty of Engineering President
University in partial fulfillment of the requirements of Bachelor
Degree in Engineering Major in Industrial Engineering
2018

THESIS ADVISOR
RECOMMENDATION LETTER
This thesis entitled “Increasing Machine Utilization Using Total
Productive Maintenance in Die Cast Machine in Toy
Manufacturing Company” is prepared and submitted by Sarah
Christina Philip in partial fulfillment of the requirements for the
degree of Bachelor Degree in the Faculty of Engineering has been
reviewed and found to have satisfied the requirements for a thesis fit to
be examined. I therefore recommend this thesis for Oral Defense.
Cikarang, Indonesia, May 9th, 2018
Anastasia Lidya Maukar, S.T.,M.Sc.,M.,T.

DECLARATION OF ORIGINALITY
I declare that this thesis, entitled “Increasing Machine Utilization
Using Total Productive Maintenance in Die Cast Machine in Toy
Manufacturing Company” is to the best of my knowledge and belief,
an original piece of work that has not been submitted, either in whole
or in part, to another university to obtain a degree.
Cikarang, Indonesia, May 9th, 2018
Sarah Christina Philip

INCREASING MACHINE UTILIZATION USING
TOTAL PRODUCTIVE MAINTENANCE IN
DIE CAST MACHINE IN TOY MANUFACTURING
COMPANY
By
Sarah Christina Philip
ID No. 004201300048
Approved by
Anastasia Lidya Maukar, S.T.,M.Sc.,M.,T.
Thesis Advisor
Ir. Andira. M.T.
Head of Industrial Engineering Study Program

ABSTRACT
The purpose of this thesis is to reduce the number of high downtime in a toy
manufacturing company. Previously, the company was evaluated through overall
equipment effectiveness for all the production area and managed to highlight one
area that score lowest, which is the die cast area, with an average score of 54%. The
low availability of die cast impacted negatively on its OEE performance. Thus, to
reduce the high downtime, Total Productive Maintenance is employed through
some of its programs especially the preventive maintenance. The research will
analyze deep-dive to one pilot equipment that has been causing a high downtime to
the area. The research will design a preventive maintenance schedule and other
TPM implementation that focuses on total employee involvement, from top level
management to regular workers, in purpose to improve the overall equipment
effectiveness percentage, but also impacted the company culture to have a lean
thinking. The OEE result after the TPM implementation increased by 18%, from a
5-month average of 54% to 72% in 3 months progress. The increase of high
reliability has an impact to the equipment performance and to high OEE score.
Keywords: Die Cast Machine, Total Productive Maintenance, Preventive Maintenance,
Overall Equipment Effectiveness, Toy Manufacturing Industry.

ACKNOWLEDGMENT
This thesis is done with God’s blessings, The Lord Almighty, Jesus Christ and His
steadfast love towards me. And the endless support and motivations from my
significant others. Therefore, I would like to express my sincere thanks and
gratefulness to:
1. Anastasia Lydia Maukar S.T., M.Sc., M.MT. My thesis advisor who gave
guidance, direction, motivation, inspiration, and recommendation in doing
and accomplishing this thesis.
2. Ms. Ir. Andira, M.T. as the most understanding Head of Study Program of
Industrial Engineering
3. My beloved parents Philip and Jeanne who supports me through their
continuous prayers, guidance, love and tirelessly taught me a great deal
about the ups and downs of growing up.
4. My beloved siblings, Sheila, Sandra, Abe and Stefany who constantly cheer
me up with their life-is-a-peach innocence. Don’t ever grow up!
5. My schatz, mon cher, the fabulous mind reader; Albert Sebastian. Thank
you for the relentless motivation and support. Thank you for always being
here in every moment.
6. LSCO friends and collegues; Haris, Kemal, Wahyu, Putra and Daris, who
gave me chances to try out something new, support my ideas, give me
motivation, direction, and suggestion along my internship period. They are
my second family in heart.
7. My beloved classmates, Industrial Engineering batch 2013-2014, Putri,
Aldino, Antasara, Marsha, Elena, Anita, Egin, Elsa, Shelly, Salbi and Febi.
8. My incredible mentors; Crissy, Igun, Thania, Tomy and Gandi. Thank you
for giving light through all the advices and the insights to my thesis.
9. Others that I cannot mention one by one but always give me motivation.

TABLE OF CONTENT
THESIS ADVISOR RECOMMENDATION LETTER .......................................... i
DECLARATION OF ORIGINALITY ................................................................... ii
ABSTRACT ........................................................................................................... iv
ACKNOWLEDGMENT ......................................................................................... v
TABLE OF CONTENT ......................................................................................... vi
LIST OF FIGURES ............................................................................................... ix
LIST OF TABLES .................................................................................................. x
LIST OF TERMINOLOGIES ................................................................................ xi
CHAPTER I ............................................................................................................ 1
1.1 Problem Background ................................................................................. 1
1.2 Problem Statement ..................................................................................... 2
1.3 Objectives .................................................................................................. 2
1.4 Scope ......................................................................................................... 3
1.5 Assumption ................................................................................................ 3
1.6 Research Outline ........................................................................................ 3
CHAPTER II ........................................................................................................... 5
STUDY LITERATURE .......................................................................................... 5
2.1 Maintenance Management System ............................................................ 5
2.1.1 Maintenance Management Goal ......................................................... 6
2.1.2 Types of Maintenance ........................................................................ 6
2.2 Total Productive Maintenance (TPM) ....................................................... 7
2.2.1 TPM Definition .................................................................................. 8
2.2.2 TPM Components ............................................................................ 11
2.2.3 TPM Metric ...................................................................................... 14
2.3 Machine Reliability ................................................................................. 16
2.4 Distribution Function ............................................................................... 17
2.4.1 Failure Distribution .......................................................................... 17
2.4.2 Cumulative Distribution Function .................................................... 17
2.4.3 Reliability Function .......................................................................... 18
2.4.4 Index of Fit (r) .................................................................................... 18
2.5 Failure Distribution.................................................................................. 19
2.6 Distribution for Measuring Reliability .................................................... 21
2.6.1 Weibull Distribution ........................................................................... 21
2.6.2 Lognormal Distribution ...................................................................... 23
2.6.3 Normal Distribution ............................................................................ 24
2.6.4 Exponential Distribution ..................................................................... 26
2.7 Distribution Identification ....................................................................... 26
CHAPTER III ....................................................................................................... 28
3.1 Research Flowchart ................................................................................. 28
3.1.1 Initial Observation ............................................................................ 29
3.1.2 Problem Identification ...................................................................... 29
3.1.3 Literature Study ................................................................................ 29
3.1.4 Data Collection ................................................................................. 30
3.1.5 Data Analysis ................................................................................... 30
3.1.6 Conclusion and Recommendation .................................................... 31
3.2 Detail Framework .................................................................................... 32
CHAPTER IV ....................................................................................................... 33
DATA COLLECTION AND ANALYSIS ........................................................... 33
4.1 Initial Observation ................................................................................... 33
4.1.1 Machine Description ........................................................................ 33
4.1.2 Flow Process Die Cast and Plastic Injection Molding ..................... 35
4.2 Data Collection ........................................................................................ 36
4.2.1 Current Die Cast Machine Reliability .............................................. 36
4.2.1.1 Overall Equipment Effectiveness ............................................... 36
4.2.1.2 Current Machine Downtime ....................................................... 38
4.2.1.3 Functional Hazard Analysis ........................................................ 43
4.3 Data Calculation ...................................................................................... 45
4.3.1 Machine Reliability .......................................................................... 45
4.3.1.1 Current Machine OEE ................................................................. 46
4.3.1.2 Failure Data of Machine ............................................................. 50
4.3.2 Calculation of Mean Time to Repair (MTTR) and Meant Time to
Failure (MTTF) ......................................................................................... 55
4.3.3 Distribution Identification ................................................................ 57
4.3.4 Maintenance Cost Calculation ......................................................... 59
4.3.4.1 Calculation of Corrective Maintenance Cost (Cf) ...................... 60
4.3.4.2 Calculation of Preventive Maintenance Cost (Cp) ..................... 61
4.3.4.3 Component Replacement Interval Calculation ........................... 63
4.3.4.4 Proposed Preventive Maintenance Schedule .............................. 70
4.4 Data Analysis and Implementation .......................................................... 71
4.4.1 Machine Reliability .......................................................................... 71
4.4.1.1 Component Reliability Comparison ........................................... 71
4.4.1.2 Proposed Preventive Maintenance Scheduling ........................... 73
4.4.1.3 OEE Comparison after TPM Implementation ............................ 73
4.4.1.4 Cost Comparison ......................................................................... 75
4.4.2 TPM Implementation ....................................................................... 76
CHAPTER V ......................................................................................................... 82
CONCLUSION AND RECOMMENDATION .................................................... 82
5.1 Conclusion ............................................................................................... 82
5.2 Recommendation ..................................................................................... 83
REFERENCES ...................................................................................................... 84
APPENDIX ........................................................................................................... 85

LIST OF FIGURES
Figure 2.1 Lean House in Production System ___________________________ 10
Figure 2.2 The Eight Pillars Approach for TPM Implementation (JIPM) _____ 11
Figure 2.3 Typical Life Cycle Bathtub Curve ___________________________ 20
Figure 2.4 Effect of Scale Parameter on Weibull ________________________ 23
Figure 2.5 Lognormal Distribution Curve _____________________________ 24
Figure 2.6 Normal Distribution Curve ________________________________ 26
Figure 3.1 Research Flowchart ______________________________________ 28
Figure 3.2 Research Framework _____________________________________ 32
Figure 4.1 Die Cast Machine in Toy Manufacturing Company _____________ 33
Figure 4.2 4-UP Output Using Mold Combination _______________________ 34
Figure 4.3 Flow Process of Die Cast __________________________________ 35
Figure 4.4 OEE Trend in Production Area for August-December 2017_______ 37
Figure 4.5 Primary Process OEE Trends for August-December 2017 ________ 38
Figure 4.6 Bar Chart of Machine Downtime Issues ______________________ 40
Figure 4.7 Pareto Chart of Machine Downtime _________________________ 41
Figure 4.8 Pareto Chart of Die Cast Machine Failure Occurrences __________ 42
Figure 4.9 Top View of Nozzle initial condition and Nozzle Failure Condition 44
Figure 4.10 Side View of Nozzle initial condition and Nozzle Failure Condition 45
Figure 4.11 Line Chart of Machine A06 OEE Trend for August-December 201750
Figure 4.12 Cost per Unit of Time Replacement Nozzle __________________ 65
Figure 4.13 Cost per Unit of Time Replacement Gripper __________________ 67
Figure 4.14 Cost per Unit of Time Replacement Nipple __________________ 69
Figure 4.15 Nozzle and Gripper Preventive Maintenance Schedule in A06 for
January-March 2018 ______________________________________________ 70
Figure 4.16 Nipple Preventive Maintenance Schedule in A06 for January-March
2018 ___________________________________________________________ 71
Figure 4.17 Reliability Comparison __________________________________ 72
Figure 4.18 OEE Comparison Before and After TPM ____________________ 75
Figure 4.19 Cost Comparison of Current and Proposed Maintenance ________ 76

LIST OF TABLES
Table 2.1 The Impact of TPM in All Aspect ____________________________ 9
Table 2.2 OEE Score Comprehension ________________________________ 16
Table 2.3 World Class OEE Score ___________________________________ 16
Table 2.4 Weibull Distribution Shape Parameter Value ___________________ 21
Table 4.1 Machine Failure Issues and Occurrences ______________________ 39
Table 4.2 Machine’s Downtime Duration ______________________________ 40
Table 4.3 Detail of A06 Machine Failures and Frequency _________________ 42
Table 4.4 Output Report for 28 August 2017 ___________________________ 46
Table 4.5 OEE Calculation Result ___________________________________ 48
Table 4.6 OEE Trend of Machine A06 for August-December 2017 _________ 49
Table 4.7 Failure Time and Repair Finish Time of Nozzle Failure from August-
December 2017 __________________________________________________ 51
Table 4.8 Failure Time and Repair Finish Time of Hose Holder Leaking Failure
from August-December 2017 _______________________________________ 52
Table 4.9 Failure Time and Repair Finish Time of Water Cooling Holder Failure
from September-December 2017 ____________________________________ 54
Table 4.10 MTTR Value of Each Critical Component from August until December
2017 ___________________________________________________________ 55
Table 4.11 MTTF Value of Each Critical Component from August until December
2017 ___________________________________________________________ 56
Table 4.12 TTF Distribution for Each Component _______________________ 57
Table 4.13 TTF Distribution for Each Component _______________________ 59
Table 4.14 Replacement Interval Time of Nozzle _______________________ 63
Table 4.15 Replacement Interval Time of Gripper _______________________ 65
Table 4.16 Replacement Interval Time of Nipple ________________________ 67
Table 4.17 Interval Time of Component Replacement ____________________ 69
Table 4.18 Comparison of Time and Reliability _________________________ 72
Table 4.19 Machine A06 for January-March 2018 _______________________ 73

LIST OF TERMINOLOGIES
Die Casting Die casting, also known as metal casting, is a process of
injecting a metal liquid into a mold that has shaped
cavities.
OEE An abbreviation for Overall Equipment Effectiveness. It is
used as a metric or measurement tool to evaluate the
equipment effectiveness.
TPM Total Productive Maintenance (TPM) is a form of
teamwork between maintenance and production to
improve product quality, reduce wastes, reduce
manufacturing cost and increase equipment availability,
and enhance the sustainability of the company
Nozzle A cylindrical or round sprout at the end of a hose or tube
that is used to control a jet of liquid or gas.
Gripper A media or a tool that grips things or may refer to the tools
for building hand strength, the hand of the robot.
Nipple Something that connects two things together, especially
mechanical component or system.
4-UP 4-UP is a printing expression of designate impressions of
four different images or pattern at the same time.
2-UP 2-UP is a printing expression of designate impressions of
two different images or pattern at the same time.
Hazard A hazard is any source of potential damage, harm or
adverse health effects on something or someone under
certain conditions at work. Basically, a hazard can cause
harm or adverse effects (to individuals as health effects or
to organizations as property or equipment losses).
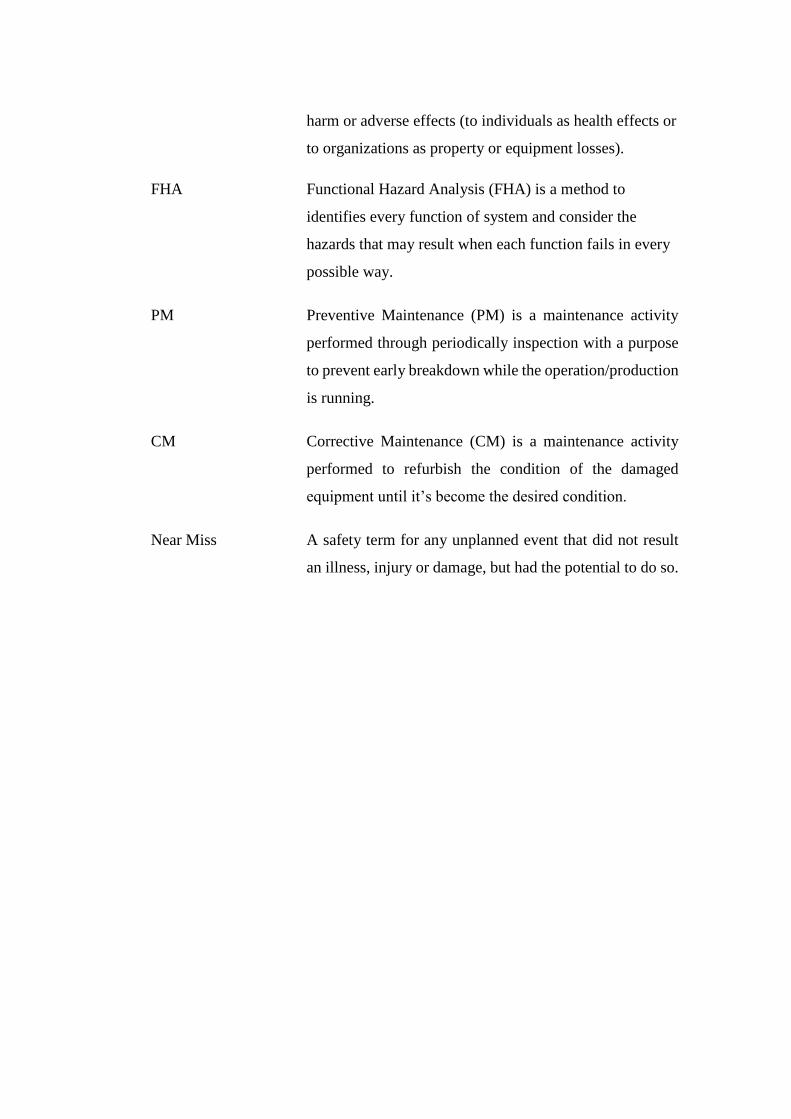
FHA Functional Hazard Analysis (FHA) is a method to
identifies every function of system and consider the
hazards that may result when each function fails in every
possible way.
PM Preventive Maintenance (PM) is a maintenance activity
performed through periodically inspection with a purpose
to prevent early breakdown while the operation/production
is running.
CM Corrective Maintenance (CM) is a maintenance activity
performed to refurbish the condition of the damaged
equipment until it’s become the desired condition.
Near Miss A safety term for any unplanned event that did not result
an illness, injury or damage, but had the potential to do so.
1
CHAPTER I
INTRODUCTION
1.1 Problem Background
The vast progress of technology and globalization has given a significant
development towards the industrial field, such as the involvement of advance
machineries and equipment in production floor and supplier activities. Hence, the
swiftness and result may contribute a good outcome to the organization. To survive
in the business, an organization needs to have a good strategy to maintain their
machines and equipment, because a degrading condition of machine productivity
can give a huge impact to the production process in the organization. Kutucuoglu
et al. (2001) stated that equipment is the major contributor to the performance and
profitability in manufacturing. Therefore, activities that involve in machine
maintenance are essential to prevent sudden production down time.
A lack of in-depth knowledge can cause misunderstandings and result a weak
maintenance in an organization. This failure can generate a relatively low number
of output produce and supply. Hence, to maximize the production output through
efficiency and effectiveness, is by maintaining all the asset through careful and
thorough maintenance management,
The observed company is a multinational toy manufacturing company in Indonesia
which produce dolls and toy cars, famously known around the world. The company
recently established its second plant, which is focused in producing toy cars, with a
wide range of toys, differentiated in shape, theme, machine and raw material. The
company produces numerous of high quality toy car assortments for each of every
theme, and every process is done in the company. The company divided the main
parts into two type of primary process; Die Casting and Injection Molding. Die
casting, producer of the body and chassis parts of the toy car, has 26 machines
which are all identical to one another. To produce high quality parts, die cast
machine must be well-maintained to sustain its good condition, hence the die cast
machine must have an organized maintenance activity.

2
In the last semester of 2017, the average downtime which caused by the broken part
replacement in die cast per shift is 32.397 minutes long, with a cycle time of 8.2
seconds. Hence the machine performance loss is 6.1% output per shift leads to a
total of IDR 12,246,066 per shift. If this period of downtime is not immediately
improved, it could lead to starvation for the next process, because the lack of output
to supply by die cast to its next process, the electrostatic painting. In purpose to
reduce the high downtime, implementing total productive maintenance is mostly
recommended to improve machine reliability. Total Productive Maintenance
(TPM) method is a lean approach that reinforce total employee involvement with
its programs, which include preventive maintenance. Through scheduled
maintenance activities, unplanned breakdown can be prevented, thus could help to
reduce the number of high downtime in die cast. Lean approach has helped world
class manufacturing companies improve productivity through continuous
improvement. Thus, this research will be using the total productive maintenance
(TPM), to achieve maximum equipment effectiveness through employee
involvement and one of the TPM method, which is the OEE. OEE is employed to
measure the equipment performance by highlighting the real problem in the
equipment. Hence, the measurement of OEE is used as the basic for TPM activities.
(Ljunberg, 1998)
1.2 Problem Statement
The background of the problem is for improving die cast machine utilization and
availability as well as decreasing any unplanned equipment downtime.
Which machine failure takes the highest downtime?
What method will be used to reduce the downtime in production floor?
How does the company reduce the downtime?
1.3 Objectives
The main objectives of this research are:
To identify the most affecting factors of downtime
To define the correct method to reduce the downtime
To implement TPM programs to the company

3
1.4 Scope
Due to limited time and resources in doing this project, there will be some scope in
the research, such as:
1. The machine downtime data was collected from August-December 2017,
and its progress was observed in January-March 2018 with current condition
at that time.
2. The gathered data are based on production data, during 3 months of
observation and interviews with the relevant staff
3. The improvement will focus on one of the largest downtime contributor
machine
4. The type of machine observed is LK AVIS-II DC50, die cast machine A06.
1.5 Assumption
An assumption must be made to ensure the method implemented is accurate
All the observed machines are the same type of machine with the same age
and specifications.
Down time is counted only when machine is stopped because of failure, set
up time is not accounted.
The manpower and component price are constant
1.6 Research Outline
Chapter I Introduction
This chapter consists of the problem background, problem
statement, objectives, scopes, and assumptions as
introductory of the project at the company.
Chapter II Literature Study
This chapter delivers theoretical groundings on
Maintenance and Total Productive Maintenance (TPM).
Chapter III Research Methodology
The flow of this final project is explained in this chapter. It
starts from the research objective, literature study, data

4
collection, data calculation, data analysis, conclusion and
recommendation.
Chapter IV Data Collection and Analysis
This chapter consist of data collection from the research,
data calculation and analysis which will support in finding
the solution.
Chapter V Conclusion and Recommendation
This chapter will mention the conclusion as a result of the
entire project, and also the recommendation for future
research.

5
CHAPTER II
STUDY LITERATURE
2.1 Maintenance Management System
The principles of maintaining the condition of an equipment has gone through
various of development in the last three decades. The conventional perspective of
maintenance is to repair a damage or broken component. Hence the understanding
the act of maintenance was limited only to the tasks related to repairing or changing
equipment’s components. This approach is also known as the reactive maintenance,
breakdown maintenance and corrective maintenance.
The role of maintenance then evolves as time goes by and the vast development of
global competition. Maintenance role extends not only in breakdown emergencies
but to all the activities that aims to preserve and cultivate facilities in the same good
condition as it first installation, or the necessary condition to fulfill the production
functions (Gits, 1992). The extension of maintenance responsibility also requires a
proactive task, such as; a large scale inspection (overhaul, routine periodic and
component replacement). In terms to maintain and repair an equipment,
maintenance need to do a few extra activities, these activities include: planned
maintenance, the control of material purchases, staff management and quality
control.
The purpose of implementing this system is to minimize the lost, stabilize the
company’s operational, maximize production output and consistently produce
product with great quality. Maintenance is defined as the activity needed to be done
to maintain the equipment the same as its first installation, so it can continue to run
effectively according to its production capacity. Generally, maintenance
management is the act that relates to planning, organizing, hiring, implementing
program and maintenance control. Maintenance activities aim to optimize the
maintenance performance by increasing the reliability and availability from a

6
system or equipment through planning, organization, hiring management,
observation and good evaluation.
2.1.1 Maintenance Management Goal
(Developing performance indicators for managing maintenance)
The advantage from maintenance activities, according to Terry Wireman, are:
Identifying and implementing cost reduction/ cost saving
Maximizing production on a low cost with a high quality product in the
optimum safety standard
Gathering important information about maintenance cost
Optimizing maintenance resource
Optimizing equipment lifetime
Minimizing the use of energy
Minimizing supply
2.1.2 Types of Maintenance
There are several types of maintenance activities in a company, such as;
1. Breakdown Maintenance
This type of maintenance is executed only when the machine broke down.
There is no expense for preventive maintenance. This condition is only
suitable if there are enough supply of spare parts.
2. Routine Maintenance
Routine maintenance is perform periodically following a repeatable
operation cycle, it can also be in the form of daily maintenance, weekly
maintenance or based on the running hour. The activities that are being done
are sweeping, adjustment, oiling or replacement. This maintenance is to
prevent breakdown and reduce reparation cost.
3. Corrective Maintenance
Corrective maintenance is a maintenance that being perform to refurbish the
condition of the damaged equipment until it’s become the desired condition,
hopefully to increase the equipment productivity. This type of maintenance

7
is performed after failure happens. The formula of corrective maintenance
is expressed with:
𝐶𝑓 = 𝐷 + (𝐶 × 𝐴) + (𝐸 × 𝐶 × 𝐵) (2-1)
Whereas:
A: Maintenance service
B: Production loss Cost
C: Downtime hours
D: Component price/unit
E: Machine Capacity
4. Preventive Maintenance
Preventive maintenance is performed through periodically inspection with
a purpose to prevent early breakdown while the operation/production is
running. Below is the calculation in determining the preventive maintenance
cost:
(2-2)
Whereas:
P = Component price
t = Downtime (hour)
f = Mechanic fare/hour
C = Production Capacity
PL = Production loss/product
5. Predictive Maintenance
Predictive maintenance is performed through forecasting of failure time,
replacement and repairmen equipment before failure. This maintenance is
to foresee the failure that will happen.
2.2 Total Productive Maintenance (TPM)
TPM, which stands for Total Productive Maintenance, was coined by a Japanese
company called Nippon Denso Co Ltd in 1971, from its employee Mr. Seiichi
Nakajima, who later received an honorary award from the Japan Institute of Plant
Maintenance (JIPM) for his contribution towards hundreds of plants in Japan and
𝐶𝑜𝑠𝑡 = 𝑃 + (𝑡 × 𝑓) + (𝐶 × 𝑡 × 𝑃𝐿)

8
became known as the father of TPM and Nippondenso for its best maintenance
practices. Nippondenso was happened to be one of the main supplier of Toyota and
its practice become the important element in Toyota Production System (TPS)
which later be developed.
Nowadays, in strive to be in the loop of the global competition, which becomes
more challenging and evolve swiftly, an organization needs to prepare a reliable
strategy to manage all the resource in the organization correctly, effectively and
efficiently. Just In Time (JIT) and Total Quality Management (TQM) are some of
the strategies that have been implemented around the industrial world, and in these
recent time Total Productive Maintenance exists as one of the reliable tool to
maintain equipment with high quality, strategically. TPM focus on the maintenance
activities and transform it into an important role in business practices. TPM
initiatives help coordinate manufacturing function with other functions in order to
gain continuous benefits.
Total Productive Maintenance (TPM) has three main objectives:
1) Zero product defect
2) Zero unplanned equipment breakdown
3) Zero accident
These objectives can be achieved by doing gap analysis from historical data about
downtime, machine breakdown, product defect, and past accidents.
2.2.1 TPM Definition
TPM, stands for three words that each has a meaning of its own;
(1) Total. Indicates that TPM considers various of aspects and the need of
everybody’s involvement, from the top managements to workers.
(2) Productive. Forces all effort to try to maintain the condition of running
production while minimize the production problems that happens during the
maintenance.

9
(3) Maintenance. Sustain and preserve equipment independently by operator to
keep the equipment in good condition, through cleaning, greasing and
observing it.
The father of TPM, Mr. Seiichi Nakajima, realized that eliminating break downs
will not fully optimize equipment effectiveness, he encouraged the use of
autonomous maintenance, whereas the operator perform day to day activities in his
work station by himself. (Bhadury, 2000). In 1989, the Japan Institute of Plant
Maintenance (JIPM) saw that TPM as a culture that can prevent losses, widely
maximize productivity and it involves everyone in the organization (direct
management to workers) to participate in small groups. (JIPM, 1996). According
to (Chaneski, 2002) TPM is a maintenance management program that aims to
reduce the equipment break down While Besterfield et al. (1999) opinioned which
TPM is a form of good teamwork between maintenance and production to improve
the quality of a product, reduce wastes, reduce manufacturing cost, increase
equipment availability, and enhance the sustainability of the company.
Mobley define TPM as a comprehensive maintenance strategy which based on the
approach of the equipment life cycle that could minimize the break downs, defects
and incidents (Mobley, 2008). TPM involve whoever inside the organization, from
the top level management till the workers and technicians. The purpose is to
increase the availability continuously and prevent the equipment performance to
decline from its maximal effectiveness.
Table 2.1 The Impact of TPM in All Aspect
Measure Impact of TPM
Productivity Reduce the need for intervention
Reduce breakdowns
Quality Potential to reduce tolerance
Control of technology
Reduce start-up loss
Cost Reduce material, spares
Delivery Zero breakdowns predictability
10
Table 2.1 The Impact of TPM in All Aspect (Cont’d)
Measure Impact of TPM
Safety Less unplanned events & intervention
Controlled wear
Morale Better understanding of technology
More time to manage
Environment Closer control of equipment
Less unplanned events/human error
TPM itself is not a maintenance department program or a workshop event to
eliminate a handy worker (maintenance staff or technician). TPM is rather a method
to reach the maximum effectiveness of an equipment through employee
involvements. TPM has three basic principles, which are; to increase the Overall
Equipment Effectiveness, enhance maintenance skill and operations, involve
employees through a small group, closer approach to the employees with basic facts
for continuous improvement.
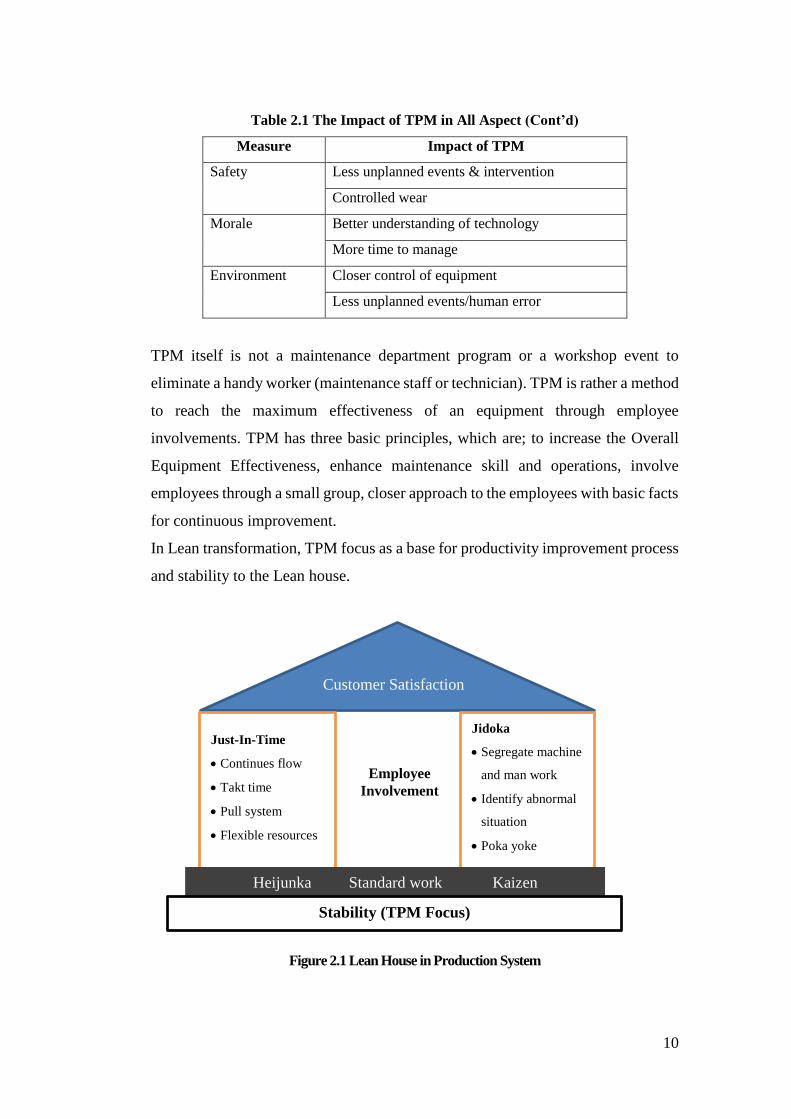
In Lean transformation, TPM focus as a base for productivity improvement process
and stability to the Lean house.
Figure 2.1 Lean House in Production System
Just-In-Time
Continues flow
Takt time
Pull system
Flexible resources
Jidoka
Segregate machine
and man work
Identify abnormal
situation
Poka yoke
Heijunka Standard work Kaizen
Stability (TPM Focus)
Employee
Involvement
Customer Satisfaction
11
The lean house foundation is stability, and above it lies Heijunka, standard work
and Kaizen. The Lean production system house has two founding pillars; Just-in-
Time and Jidoka. Just-in-Time consist of continuous flow, takt time, pull system,
flexible resources. While the Jidoka is all about building a better quality by
decreasing defect, rework and scrap, and most importantly eliminating waste.
Jidoka has several methods that are popular in manufacturing world, such as Andon,
a method to sign if there is a problem so can be resolve quickly, and Poka Yoke,
which is a Japanese term for error proofing in all aspect of manufacturing, customer
service and many more. Lean encourage employee involvement through respect for
people, team building, cross training, supplier relations, resources and many more.
Employee involvement is essential because it increase the moral and skill of
leadership, increasing the organization productivity, identify the SWOT of the
team, and develop the employee to become a problem solver.
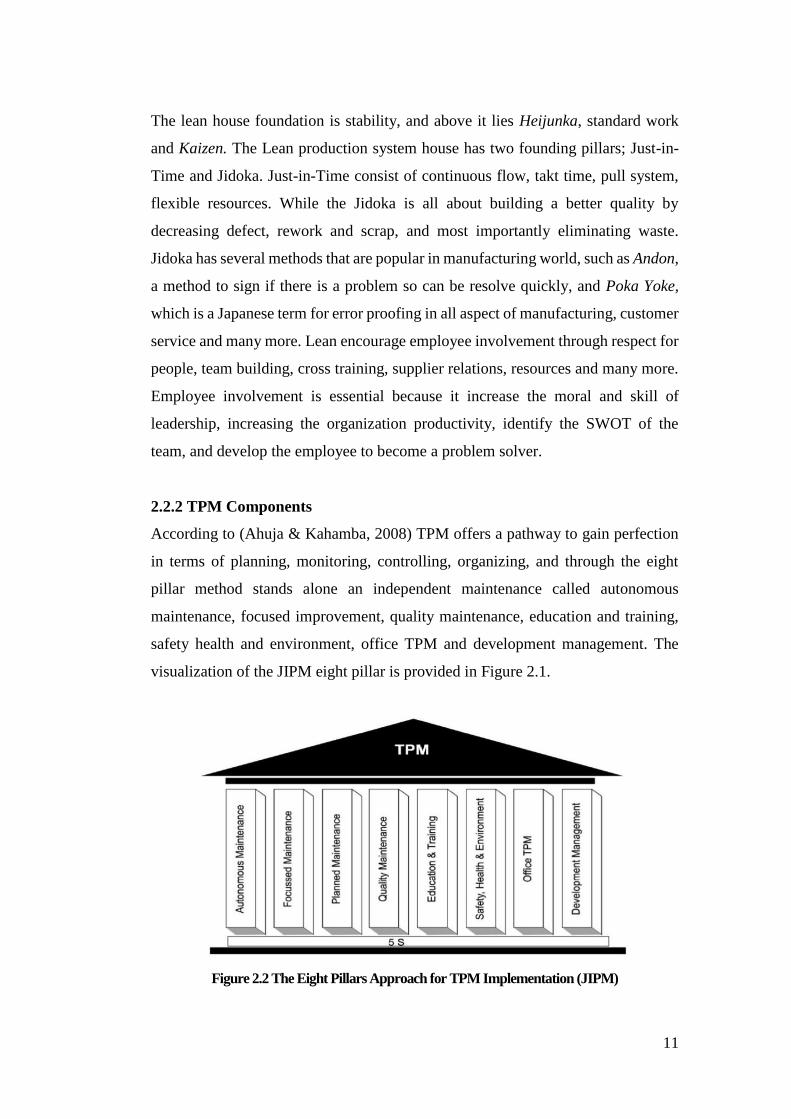
2.2.2 TPM Components
According to (Ahuja & Kahamba, 2008) TPM offers a pathway to gain perfection
in terms of planning, monitoring, controlling, organizing, and through the eight
pillar method stands alone an independent maintenance called autonomous
maintenance, focused improvement, quality maintenance, education and training,
safety health and environment, office TPM and development management. The
visualization of the JIPM eight pillar is provided in Figure 2.1.
Figure 2.2 The Eight Pillars Approach for TPM Implementation (JIPM)
12
An organization that has succeed in implementing TPM always tend to achieve an
outstanding output, especially in reducing the frequency of equipment breakdowns,
minimizing downtime and interruptions, reduce the number of defects, increasing
productivity, cutting unnecessary resources and expenses, presses supplies,
reducing the probability of incident and embrace the role of workers, for example
in terms of suggestions of maintenance and reparations.
(1) 5S
5S stands as the concept of total productive maintenance (TPM) and as the
foundation of the eight pillars. 5S stands for sort out, set in order, shine,
standardize and sustain. The idea of 5S is about organizing the area of work for
efficiency and effectiveness to see the problems which previously gone
unnoticed. To make the problem visible and eliminate it, one must first sort
things properly, eliminate items that are not needed, clean workplace and
equipment thoroughly, organize tools and to help make things simpler, create
a 5S checklist and schedule a periodic audit to sustain a clean and proper
workplace.
(2) Autonomous Maintenance
Autonomous Maintenance aims to develop operator ownership. In other words,
AM is also to help raise the sense of belonging to operator and his work
equipment by performing day to day task and in turn, the operator skills will
improve and abnormality in the equipment will go unnoticed. Autonomous
maintenance program increases maintenance personnel availability for higher-
level tasks.
(3) Focused Maintenance
Focused Maintenance focused to reduce losses in the workplace that
contributes bottleneck to its efficiency. This pillar is about Kaizen, which is a
Japanese word, Kai means change, and Zen means better. Kaizen is where a
small group of people working together to seek incremental improvement in
the process. The people involved in the kaizen team are consist of cross
functional division and hierarchy, in order to easily identify and resolve

13
recurring problems. It is believed that small improvements with great numbers
have more impact than large improvement of small numbers in a company.
(4) Planned Maintenance
This pillar is about schedules maintenance tasks based on predicted and/or
measured failure rates, along with improving the product quality and raising
the output, therefore to raise the machine availability. Planned Maintenance
will significantly reduce unplanned downtime and inventory through better
control of wear and failure-prone parts. Methods that can be used are
Breakdown Maintenance, Preventive Maintenance and Corrective
Maintenance.
(5) Quality Maintenance
This pillar is about providing the customer with a high quality product, by
designing error detection and prevention into production processes. To
eliminate recurring problem (quality defects), a gap analysis must be done by
finding the root cause analysis.
(6) Education and Training
This pillar aimed to fill in the knowledge gaps necessary to achieve TPM goals.
The training and education subjects applied to operators, maintenance
personnel and managers, in purpose to have a multi-skilled work forces without
eliminating the tasks of the maintenance personnel. Maintenance will be taught
the techniques for proactive and preventive maintenance.
(7) Safety, Health and Environment
This pillar aimed to maintain a safe and healthy working environment. Safety,
Health and Environment plays an important role in the plant, as it is focused on
achieving Zero Accident. If this program is implemented, it can help the plant
to eliminate potential health and safety hazards, and eventually, an accident-
free workplace.
(8) Office TPM
This pillar applies TPM techniques to administrative functions. The benefit in
implementing this is the improvement of productivity and efficiency towards
administrative operations by removing procedural hassles and focus on
addressing cost related issues.

14
(9) Development Management
This pillar aimed to avoid repeating the same problem in the system by
minimizing the problem and making use of previous knowledge in developing
the maintenance practices for the new ones.
2.2.3 TPM Metric
TPM has a measuring system to measure its current performance. It was developed
to support TPM initiatives by accurately tracking progress towards achieving
perfect production.
Overall Equipment Effectiveness (OEE)
OEE was proposed by Nakajima (1988) as one of the tool to evaluate the progress
through reparation initiatives as part of TPM philosophy and defined OEE as a
metric or measurement tool to evaluate the equipment effectiveness. OEE strive to
identify area that require resource, production losses and expenses that go
unnoticed. According to Ericsson (1997) OEE gives a significant contribution to
total production cost. OEE is the ground base to measure whether the TPM
implementation has succeed. This loss/ disadvantages is formulated as a function
from a few inclusive integrated components; Availability, Performance and
Quality. Basically, OEE is calculated by multiplying these three components, as
shown below:
(2-3)
Whereas:
1. Availability
Availability accounts the downtime loss, which includes anything that could
stop the production for a long period of time. (Typically a few minutes or
longer). Below is the formula to calculate availability:
𝐴𝑣𝑎𝑖𝑙𝑎𝑏𝑖𝑙𝑖𝑡𝑦 (𝐴) = 𝑂𝑝𝑒𝑟𝑎𝑡𝑖𝑛𝑔 𝑇𝑖𝑚𝑒
𝑃𝑙𝑎𝑛𝑛𝑒𝑑 𝑃𝑟𝑜𝑑𝑢𝑐𝑡𝑖𝑜𝑛 𝑇𝑖𝑚𝑒 (2-4)
𝑂𝐸𝐸 = 𝐴𝑣𝑎𝑖𝑙𝑎𝑏𝑖𝑙𝑖𝑡𝑦 × 𝑃𝑒𝑟𝑓𝑜𝑟𝑚𝑎𝑛𝑐𝑒 𝐸𝑓𝑓𝑖𝑐𝑖𝑒𝑛𝑐𝑦 × 𝑅𝑎𝑡𝑒 𝑜𝑓 𝑄𝑢𝑎𝑙𝑖𝑡𝑦

15
2. Performance
Performance accounts the speed loss, which includes all factor that can cause
the production to run with less than the maximum speed adjusted for running.
𝑃𝑒𝑟𝑓𝑜𝑟𝑚𝑎𝑛𝑐𝑒 (𝑃) = 𝐴𝑐𝑡𝑢𝑎𝑙 𝑂𝑢𝑡𝑝𝑢𝑡÷ 𝑂𝑝𝑒𝑟𝑎𝑡𝑖𝑛𝑔 𝑇𝑖𝑚𝑒
𝐼𝑑𝑒𝑎𝑙 𝑅𝑢𝑛 𝑅𝑎𝑡𝑒 (2-5)
3. Quality
Quality accounts the quality loss/ defect, including all the factor that may
cause the product to not qualify from the given standard, this also applies for
product that requires a rework.
𝑄𝑢𝑎𝑙𝑖𝑡𝑦 = 𝐴𝑐𝑡𝑢𝑎𝑙 𝐴𝑚𝑜𝑢𝑛𝑡−𝐷𝑒𝑓𝑒𝑐𝑡 𝑎𝑚𝑜𝑢𝑛𝑡
𝐴𝑐𝑡𝑢𝑎𝑙 𝑎𝑚𝑜𝑢𝑛𝑡 (2-6)
OEE measures the effect of the 6 big losses, which are (Cudney, 2009)
1. Breakdowns 4. Minor Stoppages
2. Setups and adjustments 5. Quality factors
3. Idling 6. Rework
OEE application can be implemented in various level of manufacturing with
purposes, such as:
1. Benchmarking to measure the early performance in a plant as overall. In this
case the measurement of the current OEE result can be compared to the next
OEE result, hence quantify a level of improvement.
2. An OEE score, which is measured in a line of production, can be used to
compare the performance of the production line in the whole plant, thus
focusing oneself to the worst production line.
3. If the machine operates by itself is the case, an OEE measurement can identify
the bad performance by the machine and then revealed where to focus on the
source of TPM.
16
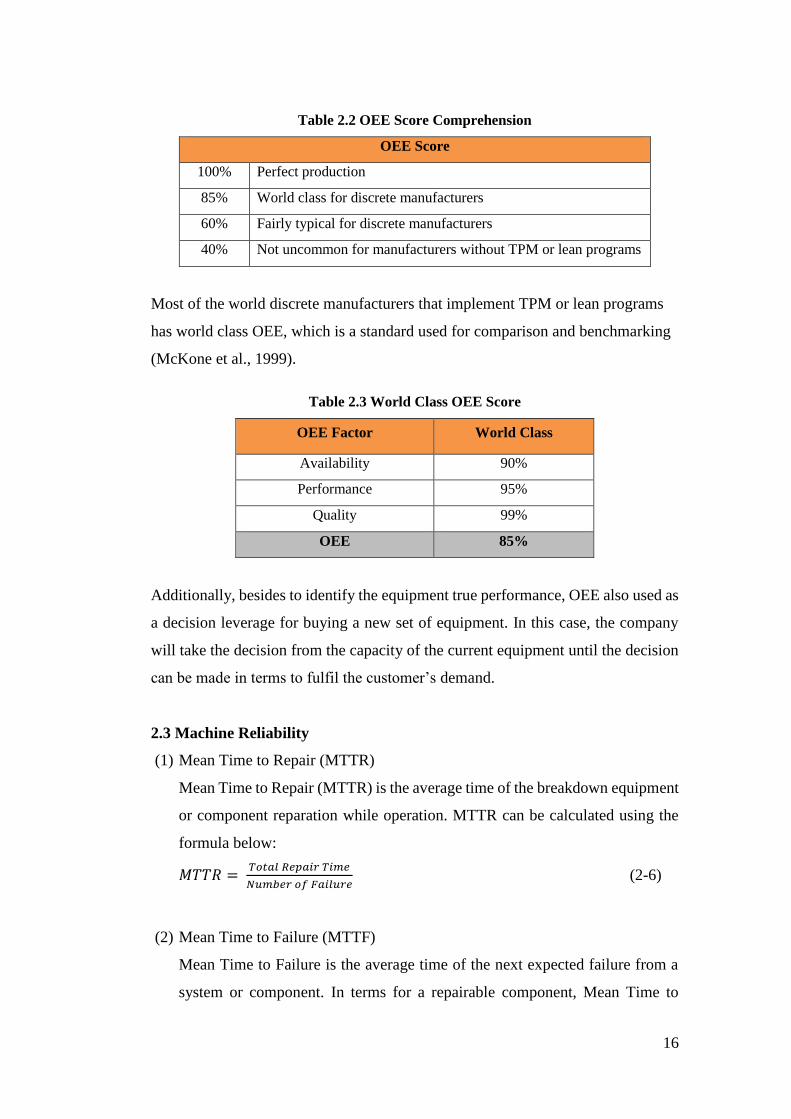
Table 2.2 OEE Score Comprehension
OEE Score
100% Perfect production
85% World class for discrete manufacturers
60% Fairly typical for discrete manufacturers
40% Not uncommon for manufacturers without TPM or lean programs
Most of the world discrete manufacturers that implement TPM or lean programs
has world class OEE, which is a standard used for comparison and benchmarking
(McKone et al., 1999).
Table 2.3 World Class OEE Score
OEE Factor World Class
Availability 90%
Performance 95%
Quality 99%
OEE 85%
Additionally, besides to identify the equipment true performance, OEE also used as
a decision leverage for buying a new set of equipment. In this case, the company
will take the decision from the capacity of the current equipment until the decision
can be made in terms to fulfil the customer’s demand.
2.3 Machine Reliability
(1) Mean Time to Repair (MTTR)
Mean Time to Repair (MTTR) is the average time of the breakdown equipment
or component reparation while operation. MTTR can be calculated using the
formula below:
𝑀𝑇𝑇𝑅 = 𝑇𝑜𝑡𝑎𝑙 𝑅𝑒𝑝𝑎𝑖𝑟 𝑇𝑖𝑚𝑒
𝑁𝑢𝑚𝑏𝑒𝑟 𝑜𝑓 𝐹𝑎𝑖𝑙𝑢𝑟𝑒 (2-6)
(2) Mean Time to Failure (MTTF)
Mean Time to Failure is the average time of the next expected failure from a
system or component. In terms for a repairable component, Mean Time to

17
Failure is the component period of time from which its first usage until failure/
breakdown happen. MTTF formula is as follow:
𝑀𝑇𝑇𝐹 = 𝑇𝑜𝑡𝑎𝑙 𝑈𝑝𝑡𝑖𝑚𝑒 𝑎𝑓𝑡𝑒𝑟 𝑅𝑒𝑝𝑎𝑖𝑟
𝑁𝑢𝑚𝑏𝑒𝑟 𝑜𝑓 𝐹𝑎𝑖𝑙𝑢𝑟𝑒 (2-7)
(3) Mean Time Between Failure (MTBF)
Mean Time Between Failure is the average duration between one component
failure to another. In other words, MTBF shows how reliable the equipment
condition in producing a product. MTBF formula is as follow:
𝑀𝑇𝐵𝐹 = 𝑇𝑖𝑚𝑒 𝐵𝑒𝑡𝑤𝑒𝑒𝑛 𝐹𝑎𝑖𝑙𝑢𝑟𝑒
𝑁𝑢𝑚𝑏𝑒𝑟 𝑜𝑓 𝐹𝑎𝑖𝑙𝑢𝑟𝑒
(2-8)
2.4 Distribution Function
2.4.1 Failure Distribution
Failure distribution is a mathematical expression for equipment failure’s age and
pattern. The characteristics of each equipment failure will impact to the applied
approach to test the suitability and to measure the parameter of failure distribution
function.
Commonly, the character from each machine failure is not the same especially if
operates and treated in different environments. An equipment that has the same
characteristics and has been operated in the same condition may also result a time
gap between different failures.
2.4.2 Cumulative Distribution Function
Cumulative distribution function is a function that describes the probability of
failure before time t. The probability of a system or equipment experiencing failure
in operating before time t, is a function from time which mathematically can be
written as follows:
𝐹(𝑡) ∫ 𝑓(𝑦)𝑑𝑡𝑡
0 𝑓𝑜𝑟 𝑡 ≥ 0 (2-9)
Whereas:
𝐹(𝑡): Cumulative distribution function

18
𝑓(𝑦): Probability density function
𝑡 ∶ time
The ranges of the value of cumulative distribution function lies between 0 ≤𝐹(𝑡) ≤ 1
setting 𝑡 = ∞, then yields F(t) = 1
2.4.3 Reliability Function
Reliability is the probability of a system or component functioning until a certain
amount of time (t) (Ebeling, 1997). The definition of reliability is the probability of
a component operating in a good condition without failure in one period in time (t)
with the set operational condition. Probability density function can be expressed as
such:
𝐹(𝑡) = 𝑃(𝑇 ≤ 𝑡) (2-10)
Whereas:
𝐹(𝑡): The probability of a failure before time T = t (distribution function)
𝑇: Continues random variable that expresses the time of failure
Reliability can be elaborate as follows:
𝑅(𝑡) = 𝑃(𝑇 ≥ 𝑡) (2-11)
Whereas:
𝑅(𝑡): The probability that failure will not happen before time (t) or probability of
failure time is bigger or equal to t.
2.4.4 Index of Fit (r)
In terms of determining which distribution to use to calculate the Mean Time to
Failure (MTTF), Mean Time to Repair (MTTR) and reliability, the process that
needs to be done is to find the value of r for each distribution until the biggest value
of r is obtained and later will be tested again according to the distribution
hypothesis.
19
2.5 Failure Distribution
Failure rate is the number of times a component fails and is denoted by λ and the
failure capacity is characterized with λ(t). An organization may not be able to
determine the frequency of equipment failure, but rather be aware and prepare from
the likelihood of the next failure.
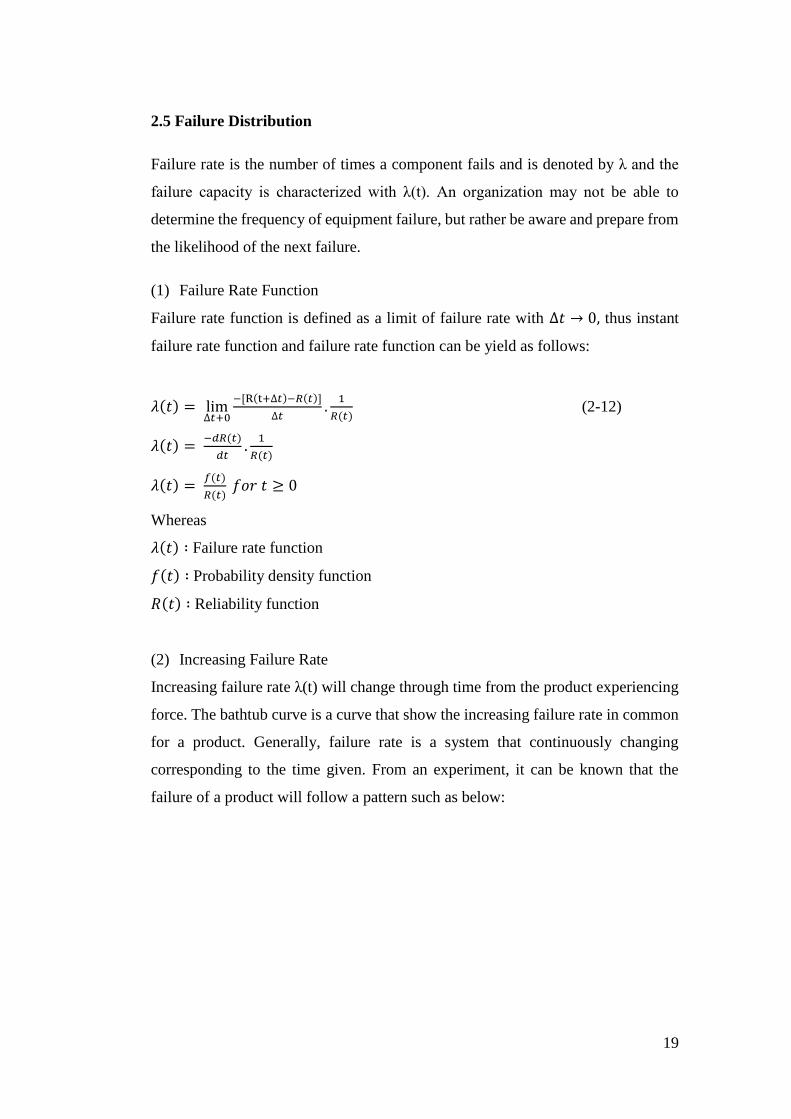
(1) Failure Rate Function
Failure rate function is defined as a limit of failure rate with ∆𝑡 → 0, thus instant
failure rate function and failure rate function can be yield as follows:
𝜆(𝑡) = lim∆𝑡+0
−[R(t+∆𝑡)−𝑅(𝑡)]
∆𝑡.
1
𝑅(𝑡) (2-12)
𝜆(𝑡) = −𝑑𝑅(𝑡)
𝑑𝑡.
1
𝑅(𝑡)
𝜆(𝑡) = 𝑓(𝑡)
𝑅(𝑡) 𝑓𝑜𝑟 𝑡 ≥ 0
Whereas
𝜆(𝑡) ∶ Failure rate function
𝑓(𝑡) ∶ Probability density function
𝑅(𝑡) ∶ Reliability function
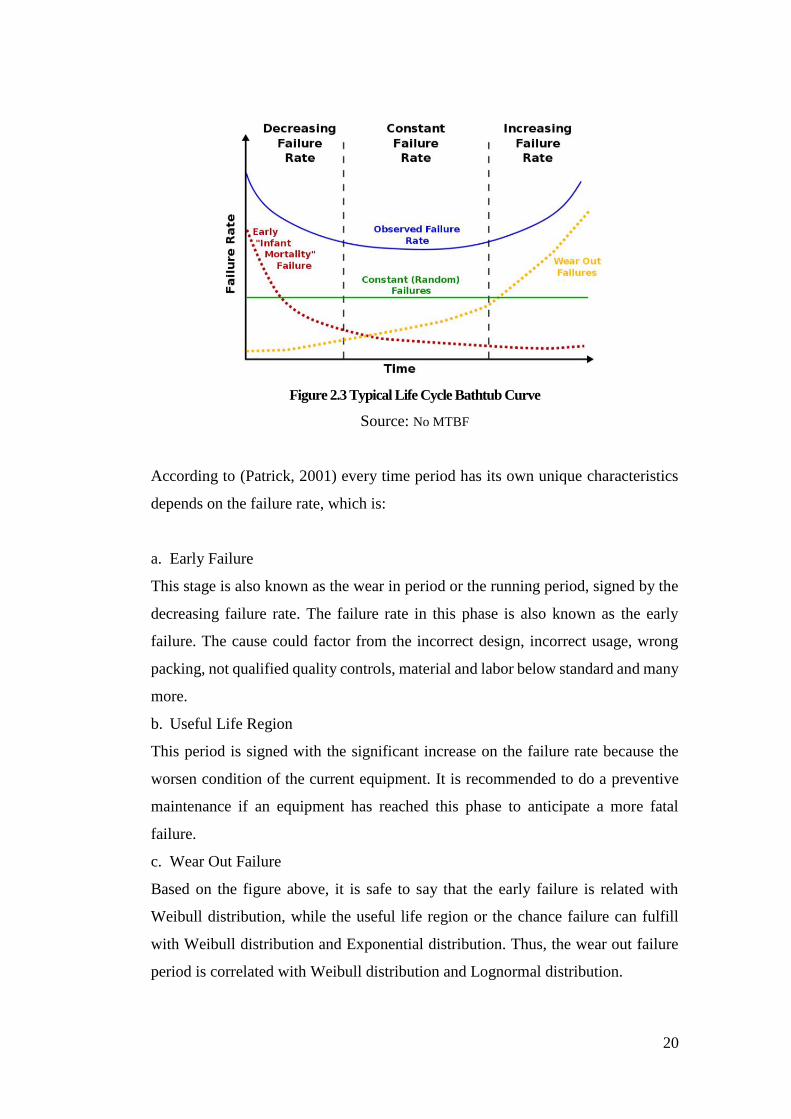
(2) Increasing Failure Rate
Increasing failure rate λ(t) will change through time from the product experiencing
force. The bathtub curve is a curve that show the increasing failure rate in common
for a product. Generally, failure rate is a system that continuously changing
corresponding to the time given. From an experiment, it can be known that the
failure of a product will follow a pattern such as below:
20
Figure 2.3 Typical Life Cycle Bathtub Curve
Source: No MTBF
According to (Patrick, 2001) every time period has its own unique characteristics
depends on the failure rate, which is:
a. Early Failure
This stage is also known as the wear in period or the running period, signed by the
decreasing failure rate. The failure rate in this phase is also known as the early
failure. The cause could factor from the incorrect design, incorrect usage, wrong
packing, not qualified quality controls, material and labor below standard and many
more.
b. Useful Life Region
This period is signed with the significant increase on the failure rate because the
worsen condition of the current equipment. It is recommended to do a preventive
maintenance if an equipment has reached this phase to anticipate a more fatal
failure.
c. Wear Out Failure
Based on the figure above, it is safe to say that the early failure is related with
Weibull distribution, while the useful life region or the chance failure can fulfill
with Weibull distribution and Exponential distribution. Thus, the wear out failure
period is correlated with Weibull distribution and Lognormal distribution.

21
2.6 Distribution for Measuring Reliability
In this research, the distribution scope used in reliability theory is Weibull
distribution, Normal distribution, Lognormal distribution and Exponential
distribution. The reliability theory uses a continues random variable. However, if
the random variable is discrete then the failure is undefined.
2.6.1 Weibull Distribution
Weibull distribution is widely used for breakdown time data in reliability analysis,
especially to calculate the component’s age, because this distribution can be used
for increasing failure rate and decreasing failure rate. Generally, this distribution is
used for mechanical component of machine.
Table 2.4 Weibull Distribution Shape Parameter Value
Value Failure Rate
0 < 𝛽 < 1 Decreasing Failure Rate
𝛽 = 1 Constant Failure Rate
1 < 𝛽 < 2 Increasing Failure Rate
Curve shape is concave
𝛽 = 2 Linier Failure Rate
Rayleigh Distribution
𝛽 < 2 Increasing Failure Rate
Curve shape is convex
1 < 𝛽 < 2 Increasing Failure Rate
Curve shape is symmetric
Normal Distribution
There are two parameter used in Weibull distribution: which are β (Beta), the shape
parameter and θ (Teta), the scale parameter, wherein to assume 𝜃 > 0, 𝛽 > 0, 𝑡 ≥
0 hence the reliability function obtain from Weibull according to Ebeling (1997) :
Probability Density Function
𝑓(𝑡) = 𝛽
𝜃(
𝑡
𝜃)
𝛽−1
𝑒(𝑡𝜃
)𝛽

22
(2-13)
Cumulative Distribution Function
𝐹(𝑡) = 1 − 𝑒−(𝑡𝜃
)𝛽
(2-14)
Reliability Function
𝑅(𝑡) = 𝑒−(𝑡𝜃
)𝛽
(2-15)
Weibull Failure Rate Function
𝜆(𝑡) = 𝑓(𝑡)
𝑅(𝑡)=
𝛽
𝜃(
𝑡
𝜃) 𝛽−1
(2-16)
Cost per Unit of Time
𝐶(𝑡) = (𝐶𝑝 × 𝑅(𝑡) + 𝐶𝑢 [1 − 𝑅(𝑡)]
∫ 𝑅(𝑡)𝑑𝑠𝑡
0
)
(2-17)
Whereas:
𝐶𝑝 = Cost of planned replacement (Preventive)
𝐶𝑢 = Cost of unplanned (Corrective)
𝑅(𝑡) = Reliability function
𝑡 = Preventive maintenance time

23
Figure 2.4 Effect of Scale Parameter on Weibull
Source: Weibull.com
The changing values of the shape parameter (β) shows the failure rate as seen in the
table below. If parameter β (Beta) affects the failure rate, then parameter θ (Teta)
affect the mean of the data pattern.
2.6.2 Lognormal Distribution
Lognormal distribution uses two parameters; s the shape parameter and 𝑡𝑚𝑒𝑑, the
location parameter as a mean of a distribution failure. This distribution has several
types, thus is not uncommon for data with Weibull distribution compatible with the
Lognormal distribution. Reliability function consist in Lognormal distribution
(Ebeling, 1997) is as follows:
Probability Density Function
𝑓(𝑡) =1
𝑠𝑡√2𝜋𝑒 [
1
2𝑠2(𝑙𝑛
𝑡
𝑡𝑚𝑒𝑑)]
(2-18)
Where 𝑠 > 0, 𝑡𝑚𝑒𝑑 > 0 𝑎𝑛𝑑 𝑡 > 0

24
Cumulative Distribution Function
𝐹(𝑡) = 𝜙 (1
𝑠𝑙𝑛
𝑡
𝑡𝑚𝑒𝑑
)
(2-19)
Reliability Function
𝑅(𝑡) = 1 − 𝐹(𝑡) = 1 − ∅ (1
𝑠𝑙𝑛
𝑡
𝑡𝑚𝑒𝑑
)
(2-20)
Failure Rate Function
𝜆(𝑡) = 𝑓(𝑡)
𝑅(𝑡)=
𝜙 (1𝑠
𝑙𝑛𝑡
𝑡𝑚𝑒𝑑)
𝑠𝑡𝑅(𝑡)
(2-21)
Mean Time To Failure
𝑀𝑇𝑇𝐹 = 𝑡𝑚𝑒𝑑. 𝑒
(2-22)
Figure 2.5 Lognormal Distribution Curve
Source: Wikipedia
2.6.3 Normal Distribution
Normal distribution is a widely used distribution function and is suitable for wear-
out phenomena. Where 𝜇 (mean) and 𝜎 (standard deviation) are the distribution
parameters. Since it is still relevant with Lognormal distribution, this distribution is
25
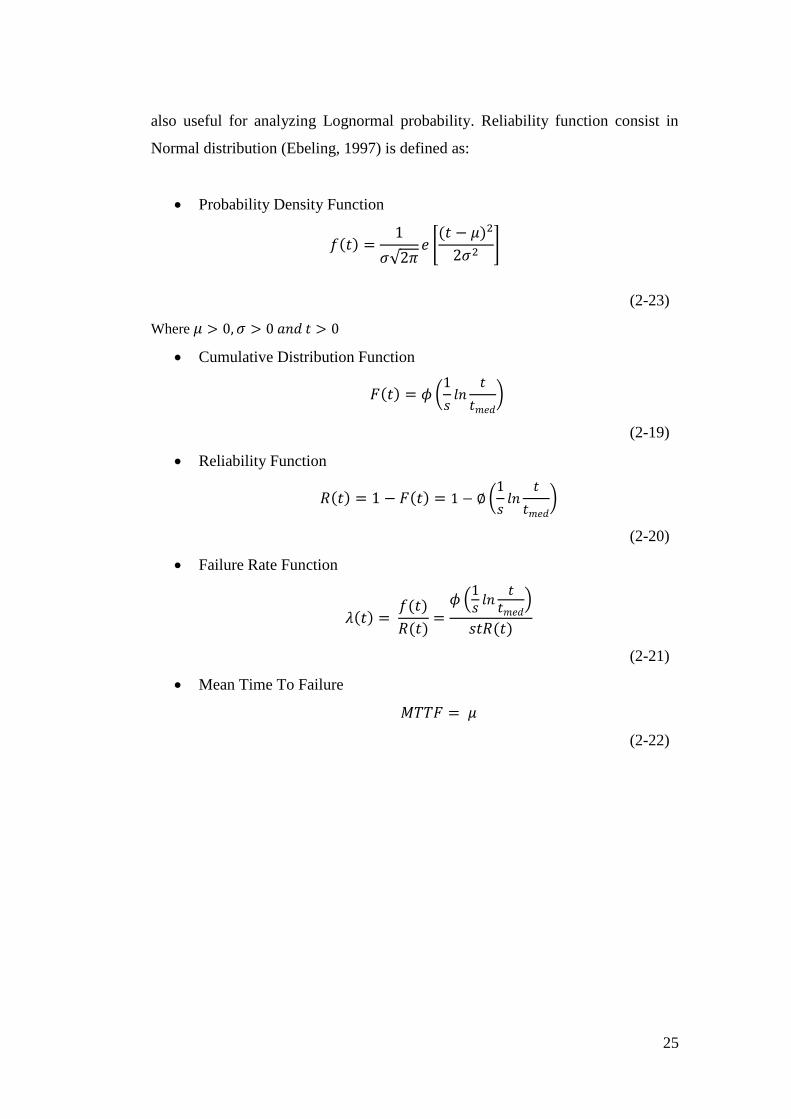
also useful for analyzing Lognormal probability. Reliability function consist in
Normal distribution (Ebeling, 1997) is defined as:
Probability Density Function
𝑓(𝑡) =1
𝜎√2𝜋𝑒 [
(𝑡 − 𝜇)2
2𝜎2]
(2-23)
Where 𝜇 > 0, 𝜎 > 0 𝑎𝑛𝑑 𝑡 > 0
Cumulative Distribution Function
𝐹(𝑡) = 𝜙 (1
𝑠𝑙𝑛
𝑡
𝑡𝑚𝑒𝑑
)
(2-19)
Reliability Function
𝑅(𝑡) = 1 − 𝐹(𝑡) = 1 − ∅ (1
𝑠𝑙𝑛
𝑡
𝑡𝑚𝑒𝑑
)
(2-20)
Failure Rate Function
𝜆(𝑡) = 𝑓(𝑡)
𝑅(𝑡)=
𝜙 (1𝑠
𝑙𝑛𝑡
𝑡𝑚𝑒𝑑)
𝑠𝑡𝑅(𝑡)
(2-21)
Mean Time To Failure
𝑀𝑇𝑇𝐹 = 𝜇
(2-22)

26
Figure 2.6 Normal Distribution Curve
2.6.4 Exponential Distribution
Exponential distribution is used for calculating the reliability of a failure
distribution that has constant failure rate. This distribution has failure rate that is
constant to time, in other words the probability of failure is not dependable to the
equipment’s age. Exponential distribution is relatively the easiest distribution to
when conducting an analysis. The parameter used in exponential distribution is λ,
which show the average failure time. The reliability function in the exponential
distribution (Ebeling, 1997) is defined as:
𝑅𝑒𝑙𝑖𝑎𝑏𝑖𝑙𝑖𝑡𝑦 𝑓𝑢𝑛𝑐𝑡𝑖𝑜𝑛: 𝑅(𝑡) = 𝑒−𝜆𝑡 (2-16)
Where 𝑡 > 0, 𝜆 > 0
2.7 Distribution Identification
By collecting data from downtime history, compatibility of the distribution can be
theoretically in 3 processes, such as:
1. Distribution identification, the formula used are included
2. Assumption of the reliability distribution parameter
3. Display distribution data with Goodness of fit test
The Goodness of Fit test is conduct by comparing the null hypothesis (𝐻0) that
stated the failure date is distributed with a certain distribution and the alternative
hypothesis stated the opposite which is the data is not distributed. The statistic
calculation of this test is based on the sample data of time failure. The result of the
27
calculation will be compared with the critical value earned from the table. If the
result of the statistic calculation is smaller than the critical value obtain from the
minitab calculation then 𝐻0 is accepted, which conclude that the failure data follows
a certain distribution. However if the statistic calculation result is bigger than the
critical value, then the alternative hypothesis (𝐻1) is accepted, meaning that the
failure data is not following a distribution.

28
CHAPTER III
RESEARCH METHODOLOGY
3.1 Research Flowchart
The following section determines the methodology used for analyzing this research.
Figure 3.1 Research Flowchart
Initial Observation
Problem Identification
Literature Study
Data Collection and
Analysis
Conclusion and
Recommendation
Initial Observation
Direct observation of production process
in a toy manufacturing industry
Problem Identification
Current problem identification
Problem and objective identification.
Determination of scopes and assumption
Literature Study
Lean Manufacturing
Total Productive Maintenance
Data Collection and Analysis
All information needed for Die Cast
machine analysis
Machine Performance Analysis
Downtime comparison between method
results
Conclusion and Recommendation
Conclusion based on the calculation and
analysis of the research
Recommendation for company and reader
in improvisation and future reesearch or
development.

29
3.1.1 Initial Observation
The observation is conducted in toy manufacturing company, starting by identifying
the problem. An in-depth understanding about the company process and the
problem is important to have an accurate research and solution to the problem. This
research is start by direct observation to current method and determination of the
suitable method that may create an improvement at the end of this research.
The direct observation is through one of Lean method; Gemba. Gemba is observing
in the production line of what is happening. Other than observation through Gemba
in the line, another way to gain deep comprehension of the problem is by going
through the production data; performance report, output report and find the red
string by analyzing the data.
3.1.2 Problem Identification
After collecting all the necessary data. Furthermore, the research objectives are
constructed in order to keep the research on track and can be accomplished on time:
Address one major loss, based on equipment specific OEE & down time data
Identify every performance aspect and decide one of the die cast machine to be
the improvement’s target
Collect detailed information on symptoms of the problem/ main cause in the
chosen die cast machine
Determine the proper method for improvement
Establish a ground understanding of why the failure in die cast machine
Determine the saving cost the company will get by implementing Total
productive maintenance
The assumption of this model is machine A06, which is the subject to be analyzed,
since that it has a higher downtime during 2017 and Total Productive maintenance
has not been applied in the company before.
3.1.3 Literature Study
Literature study is done as a theoritical base from problem solving to related issue
faced by the company. Literature study is also as the basic of this research

30
execution. The literature study is collected from books, journals, and other
resources to analyze the problem and find the solution to answer the questions. The
explanantion of literature study include:
Maintenance management in general
Lean manufacturing concepts, about the common terms and explanation related
about the method used in this research
Total Productive Maintenance (TPM) and its Implementation
3.1.4 Data Collection
In order complete analyze and complete the research, supporting data has been
collected from the lagging indicators, in regards to analyze and improve the future
process.
The collected lagging indicator that will be analyze are:
Process flow
Output
Machine down time & reparations time historical data
Machine OEE performance
3.1.5 Data Analysis
After collecting all the necessary data, the next step is to identify the root cause
using lean manufacturing tools. Firstly, by selecting the most damaging problem
that have a great impact in decreasing the organization performance and afterwards
do the improvement.
The data that will be identified using lean manufacturing tools are:
Identify the root cause analysis
Identify the problem which contribute highly in affecting the availability
Locate the main problem
Determine the right method for the improvements
Compare the company previous and future performance after the
implementation of the proposed improvements.

31
The steps of the procedure in the data analysis are:
1. Analyzing the current production flow process, maintenance method, ouput
part report, downtime report and performance rate and current expenses the
company spent. The information above is essential to support the research
to analyze and identify the real problem and which has greater impact to the
company performance.
2. Through observation, calculation and analyzation, from interview and the
provided data aims to find the proper and suitable maintenance schedule to
reduce the high downtime in the machine.
3. Compare the current reliability performance with the propose reliability
performance. Propose the implementation for the TPM programs so as to
improve the company overall performance. After 8 months of observation,
the OEE of the observed area before and after TPM Implementations is
being compared. If the improvements succeeded, the company should
develop SOP (Standard Operation Procedure) and WI (Work Instruction) in
order to sustain the good practices.
3.1.6 Conclusion and Recommendation
The last phase of this research consist of conclusion of the improvement. It refers
to the research objectives, how optimal the method achive the objectives. In
addition, the recommendation also includes in this phase. The recommendation is
addressed for both the company and the readers. It is recommended that the
company makes a continuous improvement since there is still limitations in doing
this research.

32
3.2 Detail Framework
In general, the whole research is visually summed up through a brief framework.
Figure 3.2 Research Framework
Preventive Maintenance
Schedule
Initial Observation
Machine Downtime
Problem Identification
Reliability Calculation
Data Collection
OEE performance
Component Failure Data
Time to Failure (TTF) Time to Repair (TTR)
Calculate MTTR and MTTF
Break Down Maintenance Cost
Calculation
Comparison Reliability,
Maintenance Cost
Conclusion &
Recommendation
TPM Programs and
Implementation
OEE Comparison Before
and After TPM

33
CHAPTER IV
DATA COLLECTION AND ANALYSIS
4.1 Initial Observation
The research is done in a company based in Indonesia, Cikarang, specifically in Die
Cast machine, the core activity of the production in the company. Generally, the
company has two main processes; Die Cast and Plastic Injection Molding. Plastic
Injection Molding machine produces the car’s body, interior, wheels and chassis
along with its designated colors using resin as its main material. Meanwhile, the
Die Cast machine, producer of the toy car’s body and chassis, uses Zinc Aluminum
as its raw material. However, die cast process needs to undergo a more complex
sequence of production, hence, the complexity of the flow process makes the die
cast toy car more expensive than the plastic ones. Therefore, improving the
production efficiency at die cast machine will impact greatly to products sales.
4.1.1 Machine Description
The figure below is the die cast machine used in the company production line. The
company has 26 identical die cast machines, but for now only 15 are actively
running. As a new factory, the company choose die cast and several other machines
by referring to other factories that produce the same products, HW toy cars. The die
cast machine is believed to have a high safety standard, low defective rate, high
reliability and operating efficiencies.
Figure 4.1 Die Cast Machine in Toy Manufacturing Company

34
Figure 4.2 4-UP Output Using Mold Combination
The die cast machines use two types of mold, the 2-UP and the 4-UP. The 2-UP
mold means the mold has 2 cavities, which a single shot from the machine can
produce 2 parts, while the 4-UP mold can produce 4 up to 8 different parts. The
machines that uses 2-UP has a cycle time of 6-7 seconds/shot and the 4-UP machine
has a cycle time of 8-10 second/shot.
Nevertheless, currently die cast machine in the company that uses 4-UP only use
the mold with 4 cavities. The die cast machine that is being observed in this research
uses 4-UP molds. An example of a 4-UP mold output is shown in Figure 4.2 below.

35
4.1.2 Flow Process Die Cast and Plastic Injection Molding
Figure 4.12 below is the complete summary of Die Cast process using a flow
process chart, which commonly used as a symbolic representation of process
activities in the work piece. Die cast process undergo a longer process than plastic
injection molding. The plastic injection molding process is a lot shorter, after the
machine produce the part, it will henceforth to the tampo process. And if it, the die
cast parts, passes the QC inspection without a flash, and it will go forward to the
assembly and packout.
Figure 4.3 Flow Process of Die Cast
Nevertheless, for the die cast part (body/chassis) is formed from the die cast
machine and will be degated (separated) from the runner by an auto degating
machine. Afterwards all the part will be put inside an air pocket chamber to separate
the air pocket that still sticks with the part and will be smoothened with media
stones in wet tumbling with a massive vibration to create a friction between the
Raw material ingot
(Zn Al) store
Furnace, high
pressure die casting
machine
Auto-Degating
Air Pocket
Separator
Wet Tumbling
QC
Inspection Reclaim Trimming
ESP
Tampo
Plating
Finished Goods
store
Assembly &
Packout
Delivery
Not Pass Pass
36
stones to the die casted parts. The part will be checked by the quality control, if the
product is defect it will be compile and later will be processed in reclaim, which is
an area to reform the part by melting it and form it back into a bar of ingot (die cast
raw material ZnAl). However, if it passes the QC, it will continue to Electrostatic
painting, where the parts will be painted according to each of the design.
Additionally, plating is a process to make the die cast part look shiny and clean.
After those process, the die cast part will be delivered to Tampo, for the cars
decoration and painting and later will be assemble in Assembly and Packout area
and will be stored in the finished goods store which later will be distributed to the
company’s customers.
4.2 Data Collection
The data collection in this research generally consist of a brief summary of the
company machines data and the problem that will be resolved.
4.2.1 Current Die Cast Machine Reliability
Current machine reliability performance counted from the percentage of Overall
Equipment Effectiveness (OEE) and the number of downtime occurred. Here are
details of current system analysis:
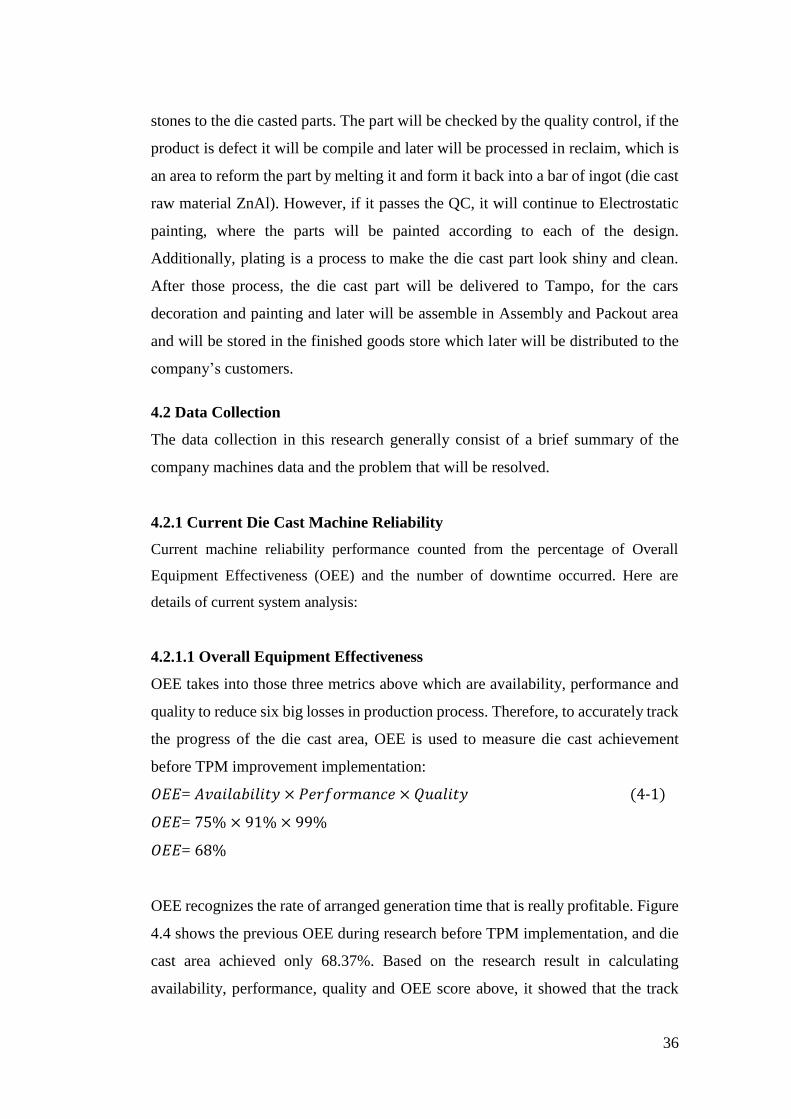
4.2.1.1 Overall Equipment Effectiveness
OEE takes into those three metrics above which are availability, performance and
quality to reduce six big losses in production process. Therefore, to accurately track
the progress of the die cast area, OEE is used to measure die cast achievement
before TPM improvement implementation:
𝑂𝐸𝐸= 𝐴𝑣𝑎𝑖𝑙𝑎𝑏𝑖𝑙𝑖𝑡𝑦 × 𝑃𝑒𝑟𝑓𝑜𝑟𝑚𝑎𝑛𝑐𝑒 × 𝑄𝑢𝑎𝑙𝑖𝑡𝑦 (4-1)
𝑂𝐸𝐸= 75% × 91% × 99%
𝑂𝐸𝐸= 68%
OEE recognizes the rate of arranged generation time that is really profitable. Figure
4.4 shows the previous OEE during research before TPM implementation, and die
cast area achieved only 68.37%. Based on the research result in calculating
availability, performance, quality and OEE score above, it showed that the track

37
record of machines’ reliability is quite good, but based on industry standards for
discrete manufacturing and strive for world class result, 60% OEE is fairly typical
for discrete manufacturers, but indicates there is room for improvement.
Below is the bar chart displaying the OEE performance from all the production area
in the company:
Figure 4.4 OEE Trend in Production Area for August-December 2017
The problem in Die Cast began to surface after the OEE percentage of all area were
shown. In the figure 4.5 below, shown that the OEE performance in Die cast, in the
past 5 months constantly below the goal and lower than the other primary process
performance; the Plastic injection molding. The plastic injection molding OEE
percentage scored 80% in the past 5 months, and so did Vacuum Forming (VUM)
81%, OMC and A&P, scored 82% and 83% respectively. The true reason behind
die cast low OEE percentage is because of the frequent and unexpected machine
downtime occurred in the die cast machines.
80%
68%
81%
73% 71%
77%82% 83%
0.00%
10.00%
20.00%
30.00%
40.00%
50.00%
60.00%
70.00%
80.00%
90.00%
100.00%
PIM Die
Cast
VUM ESP Barbell Tampo OMC A&P
OEE
Availability
Performance
Quality

38
Figure 4.5 Primary Process OEE Trends for August-December 2017
4.2.1.2 Current Machine Downtime
The research was conducted in die casting machine in production area. All the die
cast machine have the same characteristics. Thus, the research conducted in all the
machine as sample. Data collection are taken based on the machine components
that are having component failure to disrupt production process.
Based on the downtime reports in die cast area, below are the five biggest issues
that caused downtime in production line. Below is the following explanation about
each failure:
1. Material Leaking (Nozzle Failure)
Material leaking is when a small amount of liquid zinc, drool to the cover
of half die. This phenomenon happens when there is a gap between nozzle
and the sprue bush. Generally, the nozzle is supposed to be change every
100,000 shots, which means it needs to be replace weekly. If not replace
regularly, nozzle leaking can cause a serious fire hazard.
2. Nozzle Damage (Nozzle Failure)
Nozzle damaged occurs when the nozzle and the sprue bush is not in one
alignment. Additionally, material nozzle corrosive from the heat of iron
contact with aluminum, which caused a reaction towards the nozzle, causing
the nozzle to damage.

39
3. Hose Holder Leaking (Gripper Failure)
The hose holder has friction with the machine movements. This
phenomenon happens due to the improper placement of the hose holder. The
hose holder is usually replaced every week or every 150,000 shots.
4. Nozzle Stuck (Nozzle Failure)
When the nozzle temperature is too low/ heat loss to the sprue bush causing
the nozzle to stuck. To prevent fire hazard, the nozzle is supposed to be
change every 100,000 shots, which means it needs to be replace weekly.
5. Water Cooling Mold Leaking (Nipple Failure)
Water cooling mold leaks when the mold hose had rough friction with the
machine movement, due to the improper installation of the water cooling
nipple. The nipple needs to be replace every 450,000 shots, which means it
needs to be replace more than less every 2 weeks.
Table 4.1 Machine Failure Issues and Occurrences
No Issue Frequency Cumulative
Frequency
Frequency
Percentage Cumulative
Percentage
1 Nozzle Leaking 95 95 34% 34%
2 Hose Holder Leaking 82 177 29% 63%
3
Water Cooling
Holder Leaking 54 231 19% 82%
4 Nozzle Damaged 35 266 12% 94%
5 Nozzle Stuck 16 282 6% 100%
Total 282 282 100% 100%
The failure data that has been collected of the die cast machines for the research,
has been analyzed and identified the five critical issues and the total occurrences in
the available die cast machine around the 5 months’ period, which is 282 machine
failure occurrences. Nozzle leaking occurs the most often in the past five months,
followed by hose holder leaking 82 occurrences, water cooling holder leaking 54
occurrences and the rest of the 51 occurrences are from Nozzle damaged and nozzle
stuck, in that order.

40
Figure 4.6 Bar Chart of Machine Downtime Issues
The bar chart above identifies which breakdowns are the most critical to the
machine availability performance. Nozzle leaking, nozzle damaged and nozzle
stuck basically has the same solution, which is replacing the nozzle component.
Nozzle and gripper are classified as one of the critical component in the die cast
machine. Hence, the total cost of repair and, component replacement cost and the
loss of production per hour will be accounted in this research. The critical
components will be calculated to determine the preventive maintenance schedule
which will be focused on these five big issues.
Furthermore, the data obtained in this research is also from machine downtime from
the five big issues/failures. This data can identify which issue causes the longest
downtime in die cast area.
Table 4.2 Machine’s Downtime Duration
No Issue Occurrences Downtime
(hour)
1 Nozzle Leaking 95 63.7
2 Hose Holder Leaking 82 54.7
3 Water Cooling Holder Leaking 54 35.1
4 Nozzle Damaged 16 10.2
5 Nozzle Stuck 35 21.9
Total 282 185.6

41
From Table 4.2 above and the Pareto chart below, the same five issues are also the
highest downtime contributor based on downtime hour percentage. Nozzle leaking,
hose holder leaking and the rest are still placing in the same rank as the biggest
occurrences and the downtime contributor.
Figure 4.7 Pareto Chart of Machine Downtime
The nozzle leaking contributes the longest downtime by 34% out of a total of 3,824
minutes, which equivalent to 63.7 hours. The second biggest downtime is 29% by
hose holder leaking. This failure managed to contribute 3,285 minutes which
equivalent to 54.75 hours. The third is the water cooling holder leaking, the
replacement of the component took 2,108 minutes in five months overall. This
failure downtime percentage is 19%. Basically, the more often the failure occurs,
the longer time the downtime period will become. These issues will be further
analyzed to make a subtler preventive maintenance schedule to reduce downtime.
In terms to apply TPM, among many, the company should only choose one critical
equipment that causes the highest number of downtime to the inflicted area, to be
the focus or the subject of the study (Brophy, 2013). The Pareto chart below shows
the number of frequency of machine failure from all the die cast machine regarding
to the top 5 failures only.

42
Figure 4.8 Pareto Chart of Die Cast Machine Failure Occurrences
Hence, after a deep-dived analysis through die cast downtime report, machine A06
appears to have the highest number of machine breakdown regarding to the top 5
critical failure occurrences, with a total of 55 occurrences. The break down detail
of the 55 occurrences is shown in table 4.4 below. Additionally, A06 is currently
the only die cast machine that runs a 4-UP mold, which produces more output than
the other die cast machine that runs with a 2-UP mold. As mentioned before, a 4-
UP mold can produce 4 up to 8 parts in a single shot. Therefore, machine A06
components are is more likely to wear out than the other machines, thus higher
maintenance is needed for this particular machine. This research will be focused on
machine A06.
Table 4.3 Detail of A06 Machine Failures and Frequency
No Failure Frequency
1 Nozzle Leaking 13
2 Nozzle Damage 6
3 Nozzle Stuck 3
4 Hose Holder Leaking 21
5 Water Cooling Mold Leaking 11
Table 4.3 break downs the 55 occurrences that has happened in machine A06 from
August-December 2017. Nozzle has 3 types of failures, leaking, damage and stuck.

43
Leaking is the most often to occur, among the other nozzle failure with the
frequency of 13 occurrences.
4.2.1.3 Functional Hazard Analysis
Functional hazard analysis helps to identify the component functions and
abnormalities, from any potential safety hazards, health risk or malfunction hazards.
Functional hazard analysis is also for assessing the probability of failure (machine
or human error) if not being identified and handle immediately, could lead to some
greater consequences. In this research, there are 3 type of component failures in die
cast machine that will be discussed, such as nozzle leaking, nozzle damage, and
nozzle stuck. The nozzle failure will be the highlight because it is the most critical
component among the 3 components discussed in this research. Nozzle failure has
the consequences of violating safety hazard and may develop into fire hazard if not
being maintain properly.
Die cast machine has a back and forth movement and there are some
components that are greatly affected by this intensive impact, and one of it is
the nozzle. The nozzle in the die cast machine, has the function to control the
direction or the flow of the metal liquid (zinc). Whenever the nozzle collided
with the mold holder, it creates a friction. The harder the collision, the bigger
the friction to the nozzle, causing the tip of the nozzle to erode. The example
of a condition of a new nozzle and the failed nozzle is illustrated in figure 4.9
below.

44
Figure 4.9 Top View of Nozzle Initial Condition and Nozzle Failure Condition
The figure above shows the difference between a new nozzle that has not been
installed to the machine (left) and the nozzle that has aged 99,500 shots, which
has been experiencing leaking because of its distorted and eroded edges that
caused the metal liquid to leaked from the gaps of the tip or the edges. Nozzle
leaking could lead to a fire hazard if not immediately identify and take action.
According to the die cast process engineer, the tip of the nozzle is supposed to
have a conical shape and have a precise diameter. The nozzle has a lifetime of
an approximately 100,000 shots, which usually last for 7 days long. The
material of the nozzle is not to be thicker than the mold holder, otherwise it
would damage the holder, which could lead to greater consequences. A nozzle
leaking component could lead to a nozzle damage, if not immediately identify
and take action. The term damage in nozzle damage means that there is a crack
or a gap on the tip of the nozzle. Nozzle damage can occur because of the
excessive pressure from the injection of the metal liquid and the impact of the
holder. It can also occur if it was dropped or scratched during installation or
cleaning. Nozzle damage also have the consequence of fire hazard, considering
its condition is worse than nozzle leaking.

45
Figure 4.10 Side View of Nozzle Initial Condition and Nozzle Failure Condition
There are some factors that can lead to a nozzle stuck, such as the temperature
and clogging. A good nozzle needs to have the same temperature as the
machine. A normal temperature of die cast machine is around 420 Celsius, from
a range of 390-480 Celsius. Therefore, nozzle replacement took 10-15 minutes
long for heating up the nozzle, to have the same temperature as the machine.
Nozzle stuck happens when the nozzle has different temperature (colder) with
the machine, causing the sprue stuck to the mold, which creates a leftover
frozen zinc covering the nozzle tip. This phenomenon can be identified by the
loud impact noises from the mold crashing to the sprue. If this failure is not
handle immediately, it could lead to zinc flooding (splash), where the output or
the material to exit randomly, not at its designated exit. Zinc flooding opens
the possibility of the output to vault, risking the operator to be in contact with
hot material, if the cover of the machine is not closed.
4.3 Data Calculation
4.3.1 Machine Reliability
This research will use Total Productive Maintenance to find the failure time of
machine’s component. The result will be used to propose preventive maintenance
schedule to the company management. Preventive maintenance schedule will be
very useful for the company in order to reduce downtime.

46
4.3.1.1 Current Machine OEE
TPM uses OEE as a quantitative metric for measuring the productivity in
manufacturing operations. OEE helps to focus on the potential of a process and
highlight the previous obscured problems. According to Jeong & Philips (2001),
OEE acts as the core metric for measuring the success of TPM implementation
program. Nevertheless, before the research can identify the percentage value of
three metrics; availability, performance and quality, it needs to calculate the
supporting data taken from the output report.
Table 4.4 Output Report for 28 August 2017
TT
Bri
ef
-ing
5S AT
Total
Breakdo
wn Time
OT
Std.
Outpu
t
Act.
Output Reject G/O
34 40 40 32.67 584 22.93 15,543 15,150 130 15,020
Below is the detail calculation of an example taken from appendix 1, Machine A06
on 28 August 2017, shift 1.
4-UP Available Time (AT) = 𝑇𝑜𝑡𝑎𝑙 𝑇𝑖𝑚𝑒 − (𝐵𝑟𝑖𝑒𝑓𝑖𝑛𝑔 +5𝑆
60 𝑚𝑖𝑛)
4-UP Available Time (AT) = 34 ℎ𝑜𝑢𝑟 − (40 𝑚𝑖𝑛 +40 𝑚𝑖𝑛
60 𝑚𝑖𝑛)
4-UP Available Time (AT) = 34 ℎ𝑜𝑢𝑟 − (80 𝑚𝑖𝑛
60 𝑚𝑖𝑛)
4-UP Available Time (AT) = 34 ℎ𝑜𝑢𝑟 − (1.3 ℎ𝑜𝑢𝑟)
4-UP Available Time (AT) = 𝟑𝟐. 𝟔𝟕 𝒉𝒐𝒖𝒓s
Since the machine uses a 4-UP mold, that produces 4 output in a single shot, the
company, by default, multiplied every calculation of time by 4, hence to find the
actual available time for 4-UP is by dividing it back by 4, as the following below:
Actual Available Time (AT) = (32 ℎ𝑜𝑢𝑟
4)

47
Actual Available Time (AT) = 8 ℎ𝑜𝑢𝑟s
4-UP Operating Time (OT) = 𝐴𝑣𝑎𝑖𝑙𝑎𝑏𝑙𝑒 𝑇𝑖𝑚𝑒 − (𝑇𝑜𝑡𝑎𝑙 𝐵𝑟𝑒𝑎𝑘𝑑𝑜𝑤𝑛 𝑡𝑖𝑚𝑒
60 𝑚𝑖𝑛)
4-UP Operating Time (OT) = 32.67 ℎ𝑜𝑢𝑟 − (584 𝑚𝑖𝑛
60 𝑚𝑖𝑛)
4-UP Operating Time (OT) = 32.67 ℎ𝑜𝑢𝑟 − 9.73 hour
4-UP Operating Time (OT) = 𝟐𝟐. 𝟗𝟑 hour
Since the machine uses a 4-UP mold, that produces 4 output in a single shot, the
company, by default. multiplied every calculation of time by 4, hence to find the
actual operating time for 4-UP is by dividing it back by 4, as the following below:
Actual Operating Time (OT) = (22.93 ℎ𝑜𝑢𝑟
4)
Actual Operating Time (OT) = 5.73 ℎ𝑜𝑢𝑟s
The company will use the 22.93 hours as the operating time, because it represents
the 4 output produced. The purpose of the calculation above is only to inform the
readers about the company’s calculation.
Good Output (G/O) = 𝐴𝑐𝑡𝑢𝑎𝑙 𝑂𝑢𝑡𝑝𝑢𝑡 − 𝑅𝑒𝑗𝑐𝑒𝑐𝑡
Good Output (G/O) = 15,150 𝑝𝑎𝑟𝑡 − 130 𝑝𝑎𝑟𝑡
Good Output (G/O) = 𝟏𝟓, 𝟎𝟐𝟎 𝒑𝒂𝒓𝒕s
After the QC inspects the produced output, they will report and input the number
of reject parts to the output report. In terms of the output calculation, the company
did not multiply the produced parts by 4, but rather as is actual value, which is
15020 of good parts.
Variance (Var) = 𝐴𝑐𝑡𝑢𝑎𝑙 𝑂𝑢𝑡𝑝𝑢𝑡 − 𝑆𝑡𝑎𝑛𝑑𝑎𝑟𝑑 𝑜𝑢𝑡𝑝𝑢𝑡
Variance (Var) = 15150 𝑝𝑎𝑟𝑡 − 15,543 𝑝𝑎𝑟𝑡
Variance (Var) = −𝟑𝟗𝟑 𝒑𝒂𝒓𝒕𝒔

48
The term variance in this research is actually the difference of the actual output
compare to the standard output, in purpose to inform the reader whether the machine
has achieved the given target (the standard output) or not.
Availability = (𝑂𝑝𝑒𝑟𝑎𝑡𝑖𝑛𝑔 𝑇𝑖𝑚𝑒
𝐴𝑣𝑎𝑖𝑙𝑎𝑏𝑙𝑒 𝑇𝑖𝑚𝑒 ) × 100%
Availability = (22.93 ℎ𝑜𝑢𝑟
32.67 ℎ𝑜𝑢𝑟 ) × 100%
Availability = (0.702) × 100%
Availability = 𝟕𝟎. 𝟐%
Performance Calculation
𝑃𝑒𝑟𝑓𝑜𝑟𝑚𝑎𝑛𝑐𝑒 = (𝐴𝑐𝑡𝑢𝑎𝑙 𝑂𝑢𝑡𝑝𝑢𝑡
𝑆𝑡𝑎𝑛𝑑𝑎𝑟𝑑 𝑜𝑢𝑡𝑝𝑢𝑡 ) × 100%
𝑃𝑒𝑟𝑓𝑜𝑟𝑚𝑎𝑛𝑐𝑒 = (15,150
15,543) × 100%
𝑃𝑒𝑟𝑓𝑜𝑟𝑚𝑎𝑛𝑐𝑒 = (15,150
15,543) × 100%
𝑃𝑒𝑟𝑓𝑜𝑟𝑚𝑎𝑛𝑐𝑒 = (15,150
15,543) × 100%
𝑃𝑒𝑟𝑓𝑜𝑟𝑚𝑎𝑛𝑐𝑒 = (0.975) × 100%
𝑷𝒆𝒓𝒇𝒐𝒓𝒎𝒂𝒏𝒄𝒆 = 𝟗𝟕. 𝟓%
Quality = (𝐺𝑜𝑜𝑑 𝑂𝑢𝑡𝑝𝑢𝑡
𝐴𝑐𝑡𝑢𝑎𝑙 𝑜𝑢𝑡𝑝𝑢𝑡 ) × 100%
Quality = (15,020
15,150 ) × 100%
Quality = (15,020
15,150 ) × 100%
Quality = (0.991) × 100%
Quality = 𝟗𝟗. 𝟏%
Table 4.5 OEE Calculation Result
Availability Performance Quality OEE
70.2% 97.5% 99.1% 67.8%

49
After each metric has been calculated, the next step is to find the OEE percentage,
by multiplying the three metrics together, which yields to:
OEE = 𝐴𝑣𝑎𝑖𝑙𝑎𝑏𝑖𝑙𝑖𝑡𝑦 × 𝑃𝑒𝑟𝑓𝑜𝑟𝑚𝑎𝑛𝑐𝑒 × 𝑄𝑢𝑎𝑙𝑖𝑡𝑦
OEE = 70.2% × 97.5% × 99.1%
OEE = 67.8%
The following table 4.6 is the OEE trend of Machine A06 from August 2017-
December 2017. In table 4.6, the values shown in each of the metrics (availability,
performance and quality) are actually the average value of the data in the whole
month.
Table 4.6 OEE Trend of Machine A06 for August-December 2017
Month Availability Performance Quality OEE
August 69.5% 80.3% 99.6% 55.5%
September 694% 86.7% 99.0% 59.6%
October 62.7% 78.0% 99.3% 48.6%
November 65,8% 80.6% 99.2% 52.7%
December 64.3% 86.5% 99.3% 55.3%
66.3% 82.4% 99.3% 54.3%
It can be seen from the Quality column, machine A06 achieved an impeccable score
on the quality, which has an average of 99% of good parts, but due to its relatively
low availability in the past 5 months, which average is 66%, machine A06 only
managed to score 54% on the overall OEE. The long period of downtime is also
affecting the performance, causing speed loss and thus the performance has an
overall average percentage of 82%. This phenomenon is shown in the figure below,
especially in October where the performance significantly dropped to 78% due to
its low availability.

50
Figure 4.11 Line Chart of Machine A06 OEE Trend for August-December 2017
4.3.1.2 Failure Data of Machine
As mentioned before, the machine’s breakdown and component failure data was
obtained from August 2017 until December 2017. The research becomes more
focused into the 3 critical components which failure occurs frequently than other
components. The table 4.7 below shows the occurrence dates of the failure of nozzle
(nozzle leaking, nozzle damage and nozzle stuck). This table also shows the period
of time of when the failure starts and downtime finish. Regarding to this failure, the
component that needs to be replaced is the nozzle.
This research only focus on component replacement. Replacement activity, in
maintenance term, is when a component of a machine is worn out or broken and
thus cannot be repaired, the mechanic will come to fix the machine by changing or
replacing the component into a new one. Nevertheless, repairing is an activity that
mainly focus on fixing a component through setting or adjustment without the need
to change any of the component.
85%
55.50%59.60%
48.60%52.70%
55.30%
0%
10%
20%
30%
40%
50%
60%
70%
80%
90%
August September October November December
A06 Die Cast OEE Trend
Goal OEE

51
Table 4.7 Failure Time and Repair Finish Time of Nozzle Failure from August-
December 2017
Start Failure Finish Failure Duration
(min)
TTR
(hour)
TTF
(hour) Date Time Date Time
03/08/2017 0:05 03/08/2017 0:50 45 0.75 N/A
12/08/2017 4:00 12/08/2017 4:55 55 0.92 219
18/08/2017 5:20 18/08/2017 6:23 63 1.05 144
25/08/2017 6:21 25/08/2017 7:27 66 1.10 167
31/08/2017 7:25 31/08/2017 8:17 52 0.87 143
06/09/2017 2:20 06/09/2017 2:58 38 0.63 138
15/09/2017 13:13 15/09/2017 13:57 44 0.73 226
23/09/2017 4:30 23/09/2017 5:42 72 1.20 158
30/09/2017 16:42 30/09/2017 17:50 68 1.13 179
04/10/2017 0:07 04/10/2017 0:50 43 0.72 78
13/10/2017 8:01 13/10/2017 8:41 40 0.67 223
19/10/2017 1:35 19/10/2017 2:19 44 0.73 136
25/10/2017 13:03 25/10/2017 13:57 54 0.90 154
04/11/2017 0:14 04/11/2017 1:17 63 1.05 202
09/11/2017 23:00 09/11/2017 23:51 51 0.85 141
17/11/2017 22:41 17/11/2017 23:32 51 0.85 166
25/11/2017 22:30 25/11/2017 23:05 35 0.58 190
02/12/2017 21:10 02/12/2017 22:18 68 1.13 166
08/12/2017 20:02 08/12/2017 20:47 45 0.75 141
13/12/2017 19:52 13/12/2017 20:30 38 0.63 119
22/12/2017 19:02 22/12/2017 19:54 52 0.87 214
30/12/2017 18:24 30/12/2018 19:20 56 0.93 190
The table above also shares the information of the Time to Repair (TTR) and Time
to Failure (TTF), generated from the start failure and finish failure, time and date.
TTR is the time or duration needed to repair a component or machine which has
failure while operating. In the TTR column, the three longest time to replace
occurred in September 23, 30, and December 2. The TTF column describes the
period of time from a good condition unto the next failure occur.
Below is the example of detail calculation of TTR and TTF for Nozzle Failure
replacement activity taken from September 23, 2017:
Since the company never record the waiting time data, thus the research
assumed the duration of the Time to Repair is the same with the duration of
the breakdown time. The machine started to repair at 04.30 AM and finished

52
at 05:42 AM, hence the duration is 72 minutes, (05:42:00 – 04:30:00 = 72
minutes) which is also equal to 1.2 hour.
Time to failure is the period of time from a good condition unto the next
failure occur. The machine started to operate again after being maintain on
September 15 at 13:57 PM, then the nozzle failure occurs again on
September 23 at 04.30 AM. The TTF calculation is as follows:
(23 September 2017, 04.30 AM – 15 September 2017, 13:57 PM) and the
result of the subtraction is divided by 60, to convert the unit from minute to
hour, which yield the time to failure of nozzle failure to 158 hours.
Table 4.8 Failure Time and Repair Finish Time of Hose Holder Leaking Failure
from August-December 2017
Start Failure Finish Failure Duration
(min)
TTR
(hour)
TTF
(hour) Date Time Date Time
08/08/2017 13:12 08/08/2017 13:52 40 0,67 NA
14/08/2017 4:20 14/08/2017 5:28 68 1,13 134
22/08/2017 12:19 22/08/2017 13:03 44 0,73 198
29/08/2017 6:06 29/08/2017 6:47 41 0,68 161
04/09/2017 15:30 04/09/2017 16:20 50 0,83 152
12/09/2017 13:28 12/09/2017 14:26 58 0,97 189
20/09/2017 8:25 20/09/2017 9:11 46 0,77 185
27/09/2017 7:30 27/09/2017 8:15 45 0,75 166
03/10/2017 6:05 03/10/2017 6:37 32 0,53 141
10/10/2017 8:31 10/10/2017 9:18 47 0,78 169
15/10/2017 8:10 15/10/2017 8:55 45 0,75 118
23/10/2017 0:20 23/10/2017 1:25 65 1,08 183
31/10/2017 3:04 31/10/2017 4:01 57 0,95 193
06/11/2017 7:05 06/11/2017 7:50 45 0,75 147
14/11/2017 8:31 14/11/2017 9:05 34 0,57 192
20/11/2017 13:55 20/11/2017 14:52 57 0,95 148
28/11/2017 9:35 28/11/2017 10:19 44 0,73 186
05/12/2017 7:05 05/12/2017 7:40 35 0,58 164
10/12/2017 5:11 10/12/2017 6:00 49 0,82 117
18/12/2017 5:57 18/12/2017 6:45 48 0,80 191
25/12/2017 5:18 25/12/2017 5:58 40 0,67 166
Table 4.6 above shows the information of hose holder failure’s downtime hours,
from start until finish period. The data above is taken from the downtime report

53
from the period of August 2017-December 2017. The component in this failure that
require to be replace is the gripper.
The table above also shares information of the Time to Repair and Time to Failure,
which is generated from the start failure and finish failure, time and date. TTR is
the time or duration needed to repair a component or machine which has failure
while operating. In the TTR column, the longest time to repair and replace were
occurred in August 14, September 12 and October 23, these period of occurrences
took longer than others. The TTF column describes the period of time from a good
condition unto the next failure occur. The value of the TTF is relatively various,
even though generally it occurs every 7 days, the downtime could happen less or
more than 7 days. Therefore, the TTF can be used to design a preventive
maintenance schedule in order to determine the suitable time for the machine to be
maintain. The formula of TTR and TTF is attached in Chapter 2.
Below is the example of detail calculation of TTR and TTF for hose holder failure
on August 14, 2017:
Since the company never record the waiting time data, thus the research
assumed the duration of the Time to Repair is the same with the duration of
the breakdown time. The machine started to repair at 04.20 AM and finished
at 05:28 AM, hence the duration is 68 minutes, (05:28:00 – 04:20:00 = 68
minutes) which is also equal to 1.13 hour.
Time to failure is the period of time from a good condition unto the next
failure occur. The machine started to operate again after being maintain on
August 8 at 13:52 PM, then the nozzle failure occurs again on August 14 at
04.20 AM. The TTF calculation is as follows:
(14 August 2017, 04.20 AM – 8 August 2017, 13:52 PM) and the result of
the subtraction is divided by 60, to convert the unit from minute to hour,
which yield the time to failure of nozzle failure to 134 hours.

54
Table 4.9 Failure Time and Repair Finish Time of Water Cooling Holder Failure
from September-December 2017
Start Failure Finish Failure Duration
(min)
TTR
(hr)
TTF
(hr) Date Time Date Time
8/5/2017 3:10 8/5/2017 3:44 34 0.57 NA
8/19/2017 14:58 8/19/2017 15:24 26 0.43 347
9/1/2017 15:40 9/1/2017 16:00 20 0.33 312
9/13/2017 11:33 9/13/2017 11:57 24 0.40 283
9/30/2017 13:06 9/30/2017 13:38 32 0.53 409
10/14/2017 5:12 10/14/2017 5:48 36 0.60 327
10/24/2017 13:28 10/24/2017 13:50 22 0.37 247
11/10/2017 5:10 11/10/2017 5:50 40 0.67 399
11/24/2017 7:20 11/24/2017 7:51 31 0.52 337
12/4/2017 6:18 12/4/2017 6:48 30 0.50 238
12/20/2017 0:40 12/22/2017 1:02 22 0.37 377
Table 4.5 above shows the information of water cooling holder failure’s downtime
hours, from start until finish period. The data above is taken from the downtime
report from the period of August 2017-December 2017. The component in this
failure that require to be replace is the nipple.
The table above also shares information of the Time to Repair and Time to Failure,
which is generated from the start failure and finish failure, time and date. TTR is
the time or duration needed to repair a component or machine which has failure
while operating. In the TTR column, the longest time to repair and replace occurred
in August 5, October 14 and November 10, these period of occurrences took longer
than others. The TTF column describes the period of time from a good condition
unto the next failure occur. The value of the TTF is relatively various, even though
generally it occurs every 14 days, the downtime could happen less or more than 7
days. Therefore, the TTF can be used to design a preventive maintenance schedule
in order to determine the suitable time for the machine to be maintain. The formula
of TTR and TTF is attached in Chapter 2.
Below is the example of detail calculation of TTR and TTF for water cooling holder
leaking replacement activity taken from November 10, 2017:

55
The company did not record the waiting time data, thus the research
assumed the duration of the time to repair is the same with the duration of
the breakdown time. The machine started to repair at 05.10 AM and finished
at 05:50 AM, hence the duration is 40 minutes, (05:50:00 – 05:10:00 = 40
minutes) which is also equal to 0.67 hour.
Time to failure is the period of time from a good condition unto the next
failure occur. The machine started to operate again after being maintain on
October 24 at 13:50 PM, then the nozzle failure occurs again on November
10 at 05.10 AM. The TTF calculation is as follows:
(10 November, 05:10 AM– 24 October 2017, 13:50 PM) and the result of
the subtraction is divided by 60, to convert the unit from minute to hour,
which yield the time to failure of nozzle failure to 399 hours.
4.3.2 Calculation of Mean Time to Repair (MTTR) and Meant Time to Failure
(MTTF)
Mean Time to Repair (MTTR) is an average time which needed to repair a
component or machine which has failure while operation. Based on the distribution
identification, each failure has its own distribution which can be chosen. MTTR
could be calculated using equation (2-8) in Chapter 2. Hereby, Mean Time to Repair
for each failure shown in table below:
Table 4.10 MTTR Value of Each Critical Component from August until December
2017
Failure Component Frequency Downtime
(Hour)
MTTR
(Hour)
Nozzle Leaking
Nozzle
13 11.83 0.91
Nozzle Damage 6 4.94 0.82
Nozzle Stuck 3 2.27 0.75
Hose Holder Leaking Gripper 21 16.5 0.78
Water Cooling Holder
Leaking Nipple 11 5.28 0.48
The total downtime and frequency of each failure is provided in Table 4.10 and
Table 4.11. From the table above, the value of MTTR from each critical component

56
is able to be calculated, resulting the nozzle leaking repairmen time to be 0.91 hour
in average, hose holder leaking took 0.75 hour in average and water cooling mold
leaking took 0.48 hour in average.
An example of the calculation of MTTR taken from water cooling holder leaking
failure from Appendix 8, as follows:
𝑀𝑇𝑇𝑅 = ΣTTR
𝑡𝑜𝑡𝑎𝑙 𝑜𝑐𝑐𝑢𝑟𝑒𝑛𝑐𝑒𝑠
𝑀𝑇𝑇𝑅 = (0.57+0.43+0.33+0.40+0.53+0.60+0.37+0.67+0.52+0.50+0.37)
11
𝑀𝑇𝑇𝑅 = 5.28 hour
11
𝑀𝑇𝑇𝑅 = 0.48 ℎ𝑜𝑢𝑟
Meanwhile, Mean Time to Failure plays an important part in this research. As
mentioned before, MTTF is an average time of a component from a good condition
until the next failure happens. Mean Time to Failure is used to calculate an
unrepairable item or component, and hence could be transform to make a preventive
maintenance schedule. The formula of MTTF is available in Chapter 2, formula
(2-6). Below is the table of Mean Time to Failure that shows the total downtime,
number of frequency and total uptime is provided in Table 4.11.
Table 4.11 MTTF Value of Each Critical Component from August until December
2017
Failure Component Frequency Downtime
(Hour)
MTTF
(Hour)
Nozzle Leaking
Nozzle
13 11.83 172.53
Nozzle Damage 6 4.94 721
Nozzle Stuck 3 2.27 184.67
Hose Holder Leaking Gripper 21 16.50 165
Water Cooling Mold Leaking Nipple 11 5.28 328
From the table above, it can be seen that the mean time to failure of nozzle leaking
is 172.53 hours, the mean time to failure for nozzle damage is 721 hours, and mean
time to failure of nozzle stuck is 184.67 hours.

57
An example of the calculation of MTTF taken from water cooling holder leaking
failure from table 4.9, as follows:
𝑀𝑇𝑇𝐹 = ΣTTF
𝑡𝑜𝑡𝑎𝑙 𝑜𝑐𝑐𝑢𝑟𝑒𝑛𝑐𝑒𝑠
𝑀𝑇𝑇𝐹 = (347+312+283+409+327+247+399+337+238+377)
11
𝑀𝑇𝑇𝐹 = 3280 hour
10
𝑀𝑇𝑇𝐹 = 328 ℎ𝑜𝑢𝑟𝑠
Mean Time to Failure is also familiar as uptime. Uptime is the period of time of an
equipment that has been operating and available. The hose holder failure uptime is
165 hours and the water cooling mold leaking failure uptime is 328 hours.
4.3.3 Distribution Identification
The next phase in this research, after calculating the time to repair and time to
failure, is selecting the suitable distribution for each component. The calculation is
supported by a statistical software to determine the supporting values for this
research such as the parameter, the Anderson Darling and P-value from the
goodness of fit test. The table below shows the result of the fit of distribution from
time to failure (TTF).
Table 4.12 TTF Distribution for Each Component
Component Distribution Goodness of fit test
Acceptance Coefficient
correlation AD P-Value
Nozzle
Normal 0.351 0.436 Fit 0.978
Exponential 5.912 <0.003 Do not fit *
Weibull 0.419 >0.250 Fit 0.972
Lognormal 0.458 0.238 Fit 0.951
Gripper
Normal 0.544 0.141 Fit 0.966
Exponential 6.73 <0.003 Do not fit *
Weibull 0.466 0.238 Fit 0.982
Lognormal 0.718 0.051 Fit 0.952
Nipple
Normal 0.191 0.863 Fit 0.986
Exponential 4.436 <0.003 Do not fit *
Weibull 0.371 >0.250 Fit 0.948
Lognormal 0.696 0.047 Fit 0.892

58
Table 4.12 shows that each of the component tends to follow a certain distribution,
which is the main use of the goodness of fit test. The information from the table
above also tells that about how goodness of fit generates the value of Anderson-
Darling and P-Value, correlation coefficient and the parameter. Anderson Darling
(AD) determines how well the data follow a particular distribution. The result of
the parameter gives the fit test result, which is either fit or not fit with the
distribution.
In order to be able to schedule the preventive maintenance, the step is to determine
the distribution of time to repair and time to failure, through the comparison
between the result of the p-value and significance level (α). P-value is the
probability of a failure that is gained from the research in the statistical calculation.
while the significance level (α) in this research shows how extreme an ideal is, thus
can prove the difference of data exists (reject H0). The value of (α) is set to 0,05,
which indicates a 5% risk that there is a difference when there is no actual
difference.
𝐻0 = Data follows a distribution
𝐻1 = Data does not follow a distribution
The reason why the research compares the value of α and the p-value is to know if
the observed data is significantly different, comparing to what has been stated in
the null hypothesis (H0). If the p-value is less than or equal to the value of α, then
the null hypothesis is rejected, which means the result of the research, statistically,
is significant. Otherwise if the p-value is less than α, means that the research is
statistically insignificant. (Ross, 2004)
After the value of (α) is set, other statistic values can be determined, an example of
it is the (r) or known as the coefficient correlation or index of fit. If the value of (r)
that is closer to 1, means that the relations between parameters and the distribution
function is strong.

59
Table 4.13 TTF Distribution for Each Component
Component Distribution Parameter Std.
deviation Scale T-med Shape
Nozzle Normal - 0.85 - 39.05
Gripper Weibull 176.73 - 7.45 -
Nipple Normal 327.6 63.6
Table 4.13 indicates the parameter for each of the component, the distribution it
follows. In nozzle and nipple replacement, the fitted distribution is normal
distribution. Normal distribution has 2 parameters, which are t-med and standard
deviation. T-med has the value of 0.802 while the standard deviation is 39.05. The
gripper component follows Weibull distribution. Weibull distribution has 2
parameters, the shape value (β) and the scale value (θ), the detail information about
Weibull is available in Chapter 2. These information is essential for the next step,
which is the maintenance interval calculation.
4.3.4 Maintenance Cost Calculation
Conducting a preventive maintenance is to do the maintenance in a certain time that
has been calculated based on the reliability target, which has been set before. The
application of preventive maintenance will require some necessary cost, such as
preventive cost because there is an organized scheduled machine maintenance. This
cost will later be compare with the cost without preventive maintenance, also
known as corrective maintenance or failure cost. Corrective maintenance is the cost
that appear because of an expected failure occur causing production machine to stop
operating and disrupting the production time that was running. Therefore, to be able
to identify the costs that die cast area has spent and need to spend with current and
proposed maintenance system, below are the costs that are required to be considered
in calculating failure cost.
For the maintenance cost calculation, the data used was provided from the
maintenance and machine records. If ever a failure occurs, the company,
particularly the die cast machines are to be maintain with internal maintenance labor

60
from the company. Hence, in order to determine the maintenance, cost these data
below will be useful for supporting the calculation:
The die cast machine has a cycle time of 8.2 seconds/shot which is equivalent
to 0.13 minutes/shot
The machine capacity per minute yield to 7 shot/minute, but since the die cast
machine output consist of 4 parts in a single shot, the machine capacity will
be times by 4 which is equal to 28 shot/minute.
The production loss from machine failure is IDR 27,000/shot. The die cast
machine only produce 2 types of parts which are body and chassis. The price
of a body, cost IDR 8,500 and the chassis cost, IDR 5,000 respectively. Each
of these parts, the body and chassis, consist of 2 parts from a single shot.
The mechanic’s fee per minute is IDR 308 or costs IDR 18,450 if converts to
hour. The minimum salary for labor according to the government jurisdiction
in 2017 in Jababeka is IDR 3,837,600
The component price per unit for nozzle leaking, nozzle stuck and nozzle
damage or any abnormality of the nozzle that requires it to be replace is IDR
234,000
The component price per unit for hose holder leaking failure, which
component is the gripper, costs IDR 417,500
The component price per unit for water cooling holder leaking failure, which
component is the nipple, costs IDR 180,000
4.3.4.1 Calculation of Corrective Maintenance Cost (Cf)
In corrective maintenance, not every time a failure occurs, component replacement
is necessary. If the condition of the component is still good, then the component
only needs to be repair. However, if the component is worn-out (low reliability),
then the component needs to be immediately replace.
Corrective maintenance is a maintenance that being perform to refurbish the
condition of the damaged equipment until it’s become the desired condition,
hopefully to increase the equipment productivity. The formula of corrective
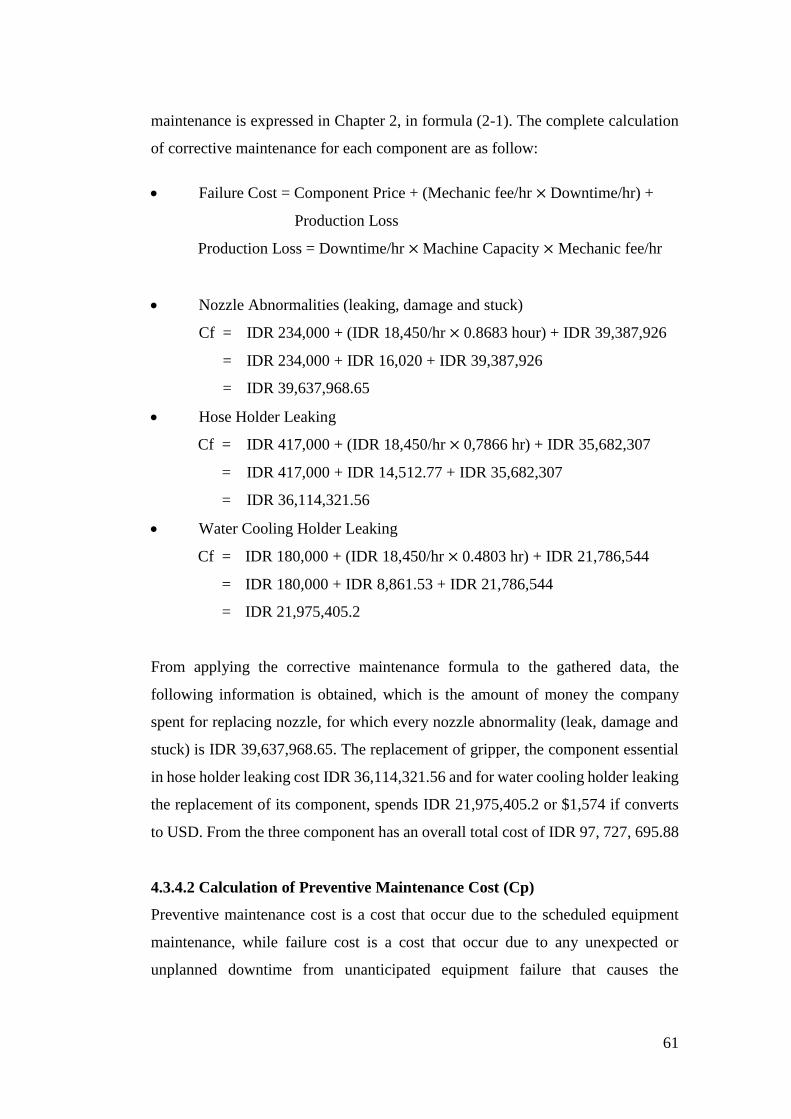
61
maintenance is expressed in Chapter 2, in formula (2-1). The complete calculation
of corrective maintenance for each component are as follow:
Failure Cost = Component Price + (Mechanic fee/hr × Downtime/hr) +
Production Loss
Production Loss = Downtime/hr × Machine Capacity × Mechanic fee/hr
Nozzle Abnormalities (leaking, damage and stuck)
Cf = IDR 234,000 + (IDR 18,450/hr × 0.8683 hour) + IDR 39,387,926
= IDR 234,000 + IDR 16,020 + IDR 39,387,926
= IDR 39,637,968.65
Hose Holder Leaking
Cf = IDR 417,000 + (IDR 18,450/hr × 0,7866 hr) + IDR 35,682,307
= IDR 417,000 + IDR 14,512.77 + IDR 35,682,307
= IDR 36,114,321.56
Water Cooling Holder Leaking
Cf = IDR 180,000 + (IDR 18,450/hr × 0.4803 hr) + IDR 21,786,544
= IDR 180,000 + IDR 8,861.53 + IDR 21,786,544
= IDR 21,975,405.2
From applying the corrective maintenance formula to the gathered data, the
following information is obtained, which is the amount of money the company
spent for replacing nozzle, for which every nozzle abnormality (leak, damage and
stuck) is IDR 39,637,968.65. The replacement of gripper, the component essential
in hose holder leaking cost IDR 36,114,321.56 and for water cooling holder leaking
the replacement of its component, spends IDR 21,975,405.2 or $1,574 if converts
to USD. From the three component has an overall total cost of IDR 97, 727, 695.88
4.3.4.2 Calculation of Preventive Maintenance Cost (Cp)
Preventive maintenance cost is a cost that occur due to the scheduled equipment
maintenance, while failure cost is a cost that occur due to any unexpected or
unplanned downtime from unanticipated equipment failure that causes the

62
production to stop running. The formula of preventive maintenance cost is
expressed in Chapter 2, in formula (2-2). The complete calculation of preventive
maintenance for each component are as follow:
Preventive Cost = Component Price + (Mechanic fee/hr × Downtime/hr) +
Production Loss
Production Loss = (Total part price/shot) × 2
Nozzle Abnormalities (leaking, damage and stuck)
Cp = IDR 234,000 + (IDR 18,450/hr × 0.5833 hr) + (0.5833 hr × 1,680
part/hr × 27,000)
= IDR 234,000 + IDR 10,761 + IDR 26,460,000
= IDR 26,704,762
Hose Holder Leaking
Cp = IDR 417,000 + (IDR 18,450/hr × 0.4167 hr) + (0.4167 hr × 1,680
part/hr × IDR 27,000)
= IDR 417,000 + IDR 7,688 + IDR 18,900,000
= IDR 19,325,187
Water Cooling Holder Leaking
Cp = IDR 180,000 + (IDR 18,450/hr × 0.2500 hr) + (0.2400 hr × 1,680
part/hr × IDR 27,000)
= IDR 180,000 + IDR 4,612+ IDR 11,340,000
= IDR 11,524,612
From the calculation of preventive maintenance cost above, the following
information is obtained, which is the amount of money the company spent for
replacing nozzle, for which every nozzle abnormality (leak, damage and stuck) is
reduced 33% from corrective maintenance, which is equal to IDR 26,704,780. The
replacement of gripper, the component essential in hose holder leaking cost IDR
19,325,200 equivalents to $1,389.69.58 and for water cooling holder leaking the
replacement of its component, spent IDR 15,306,160 or $1,100.6 if converts to USD
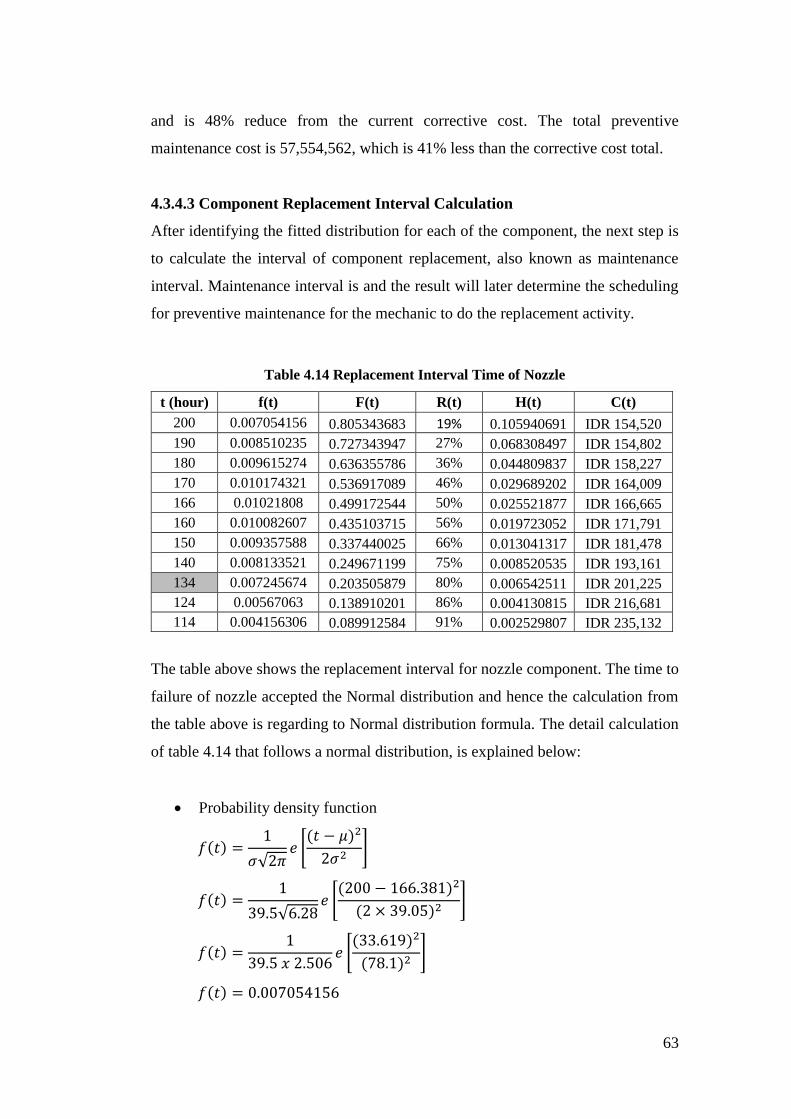
63
and is 48% reduce from the current corrective cost. The total preventive
maintenance cost is 57,554,562, which is 41% less than the corrective cost total.
4.3.4.3 Component Replacement Interval Calculation
After identifying the fitted distribution for each of the component, the next step is
to calculate the interval of component replacement, also known as maintenance
interval. Maintenance interval is and the result will later determine the scheduling
for preventive maintenance for the mechanic to do the replacement activity.
Table 4.14 Replacement Interval Time of Nozzle
t (hour) f(t) F(t) R(t) H(t) C(t)
200 0.007054156 0.805343683 19% 0.105940691 IDR 154,520
190 0.008510235 0.727343947 27% 0.068308497 IDR 154,802
180 0.009615274 0.636355786 36% 0.044809837 IDR 158,227
170 0.010174321 0.536917089 46% 0.029689202 IDR 164,009
166 0.01021808 0.499172544 50% 0.025521877 IDR 166,665
160 0.010082607 0.435103715 56% 0.019723052 IDR 171,791
150 0.009357588 0.337440025 66% 0.013041317 IDR 181,478
140 0.008133521 0.249671199 75% 0.008520535 IDR 193,161
134 0.007245674 0.203505879 80% 0.006542511 IDR 201,225
124 0.00567063 0.138910201 86% 0.004130815 IDR 216,681
114 0.004156306 0.089912584 91% 0.002529807 IDR 235,132
The table above shows the replacement interval for nozzle component. The time to
failure of nozzle accepted the Normal distribution and hence the calculation from
the table above is regarding to Normal distribution formula. The detail calculation
of table 4.14 that follows a normal distribution, is explained below:
Probability density function
𝑓(𝑡) =1
𝜎√2𝜋𝑒 [
(𝑡 − 𝜇)2
2𝜎2]
𝑓(𝑡) =1
39.5√6.28𝑒 [
(200 − 166.381)2
(2 × 39.05)2]
𝑓(𝑡) =1
39.5 𝑥 2.506𝑒 [
(33.619)2
(78.1)2]
𝑓(𝑡) = 0.007054156
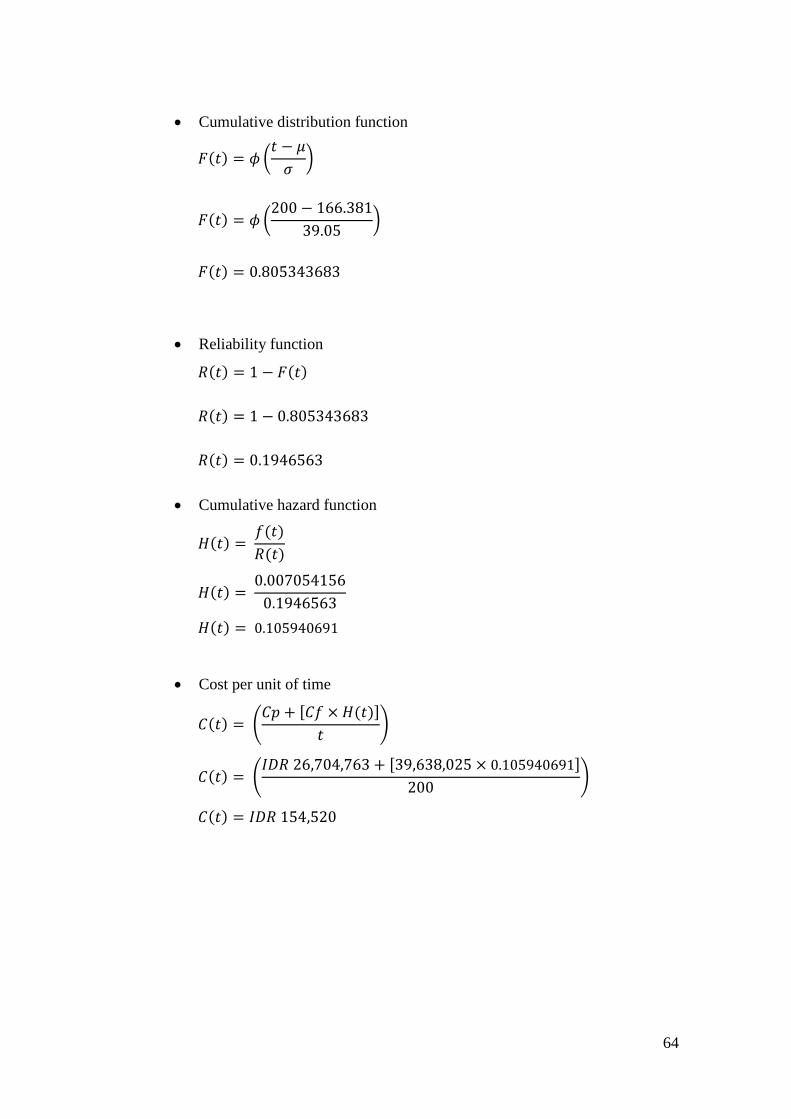
64
Cumulative distribution function
𝐹(𝑡) = 𝜙 (𝑡 − 𝜇
𝜎)
𝐹(𝑡) = 𝜙 (200 − 166.381
39.05)
𝐹(𝑡) = 0.805343683
Reliability function
𝑅(𝑡) = 1 − 𝐹(𝑡)
𝑅(𝑡) = 1 − 0.805343683
𝑅(𝑡) = 0.1946563
Cumulative hazard function
𝐻(𝑡) = 𝑓(𝑡)
𝑅(𝑡)
𝐻(𝑡) = 0.007054156
0.1946563
𝐻(𝑡) = 0.105940691
Cost per unit of time
𝐶(𝑡) = (𝐶𝑝 + [𝐶𝑓 × 𝐻(𝑡)]
𝑡)
𝐶(𝑡) = (𝐼𝐷𝑅 26,704,763 + [39,638,025 × 0.105940691]
200)
𝐶(𝑡) = 𝐼𝐷𝑅 154,520

65
Figure 4.12 Cost per Unit of Time Replacement Nozzle
Based on the calculation above, it shows that the interval time is related with cost.
It can be seen that the cost and time are moving inversely, the shorter the length of
interval time is, the higher the cost gets. Additionally, regarding to the time
movement, as it becomes shorter, the reliability of time will also increase. The
condition is illustrated in figure 4.12 above.
Table 4.15 Replacement Interval Time of Gripper
t (hour) f(t) F(t) R(t) H(t) C(t)
170 0.069367676 0.527059054 47% 0.00774 IDR 158,891
166 0.052677938 0.46586049 53% 0.006203 IDR 162,353
160 0.035745303 0.3791757 62% 0.004507 IDR 168,021
155 0.026345651 0.313614596 69% 0.00348 IDR 173,179
150 0.019654789 0.255298474 74% 0.002698 IDR 178,745
145 0.014789773 0.204666215 80% 0.002095 IDR 184,744
140 0.011189635 0.161653683 84% 0.001626 IDR 191,209
135 0.008487881 0.125833319 87% 0.001259 IDR 198,183
130 0.006438684 0.096545186 90% 0.000971 IDR 205,717
The table above shows the replacement interval for gripper component. The time to
failure of gripper accepted the Weibull distribution and hence the calculation from
the table above is regarding to Weibull distribution formula. Based on the
calculation above, it shows that the interval time is related with cost.
0
50
100
150
200
250
IDR 0
IDR 50,000
IDR 100,000
IDR 150,000
IDR 200,000
IDR 250,000
Cost VS Time Nozzle
C(t) t (hour)

66
Probability density function
𝑓(𝑡) = 𝛽
𝜃(
𝑡
𝜃)
𝛽−1
𝑒(𝑡𝜃
)𝛽
𝑓(𝑡) = 7.44828
176.733(
170
176.733)
7.44828−1
𝑒(170
176.733)7.44828
𝑓(𝑡) = 0.069367676
Cumulative distribution function
𝐹(𝑡) = 1 − 𝑒−(
𝑡𝜃
)𝛽
𝐹(𝑡) = 1 − 𝑒−(170
176.733)7.44828
𝐹(𝑡) = 0.527059054
Reliability function
𝑅(𝑡) = 1 − 𝐹(𝑡)
𝑅(𝑡) = 1 − 0.527059054
𝑅(𝑡) = 0.4729409
Hazard failure function
𝐻(𝑡) = 𝑓(𝑡)
𝑅(𝑡)
𝐻(𝑡) = 0.069367676
0.4729409
𝐻(𝑡) = 0.0077396
Cost per unit of time
𝐶(𝑡) = (𝐶𝑝 + [𝐶𝑓 × 𝐻(𝑡)]
𝑡)
𝐶(𝑡) = (𝐼𝐷𝑅 19,325,188 + [36,157,061 × 0.0077396]
170)
𝐶(𝑡) = 𝐼𝐷𝑅 158,891
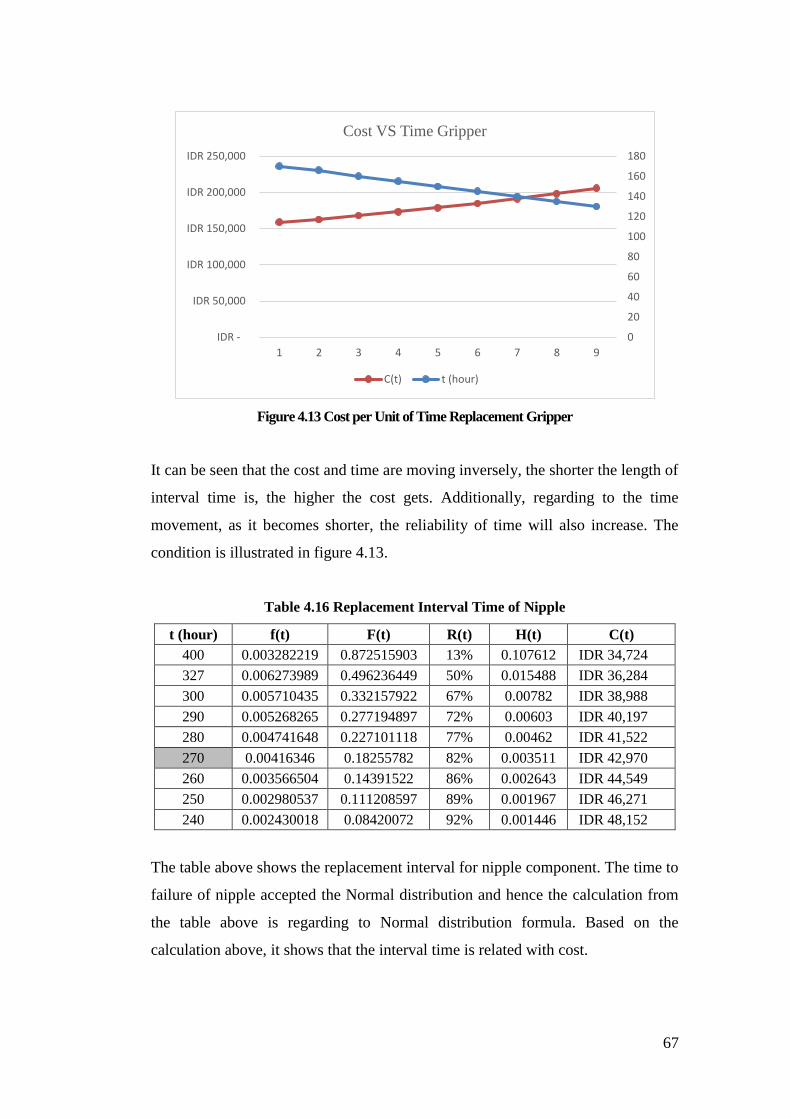
67
Figure 4.13 Cost per Unit of Time Replacement Gripper
It can be seen that the cost and time are moving inversely, the shorter the length of
interval time is, the higher the cost gets. Additionally, regarding to the time
movement, as it becomes shorter, the reliability of time will also increase. The
condition is illustrated in figure 4.13.
Table 4.16 Replacement Interval Time of Nipple
t (hour) f(t) F(t) R(t) H(t) C(t)
400 0.003282219 0.872515903 13% 0.107612 IDR 34,724
327 0.006273989 0.496236449 50% 0.015488 IDR 36,284
300 0.005710435 0.332157922 67% 0.00782 IDR 38,988
290 0.005268265 0.277194897 72% 0.00603 IDR 40,197
280 0.004741648 0.227101118 77% 0.00462 IDR 41,522
270 0.00416346 0.18255782 82% 0.003511 IDR 42,970
260 0.003566504 0.14391522 86% 0.002643 IDR 44,549
250 0.002980537 0.111208597 89% 0.001967 IDR 46,271
240 0.002430018 0.08420072 92% 0.001446 IDR 48,152
The table above shows the replacement interval for nipple component. The time to
failure of nipple accepted the Normal distribution and hence the calculation from
the table above is regarding to Normal distribution formula. Based on the
calculation above, it shows that the interval time is related with cost.
0
20
40
60
80
100
120
140
160
180
IDR -
IDR 50,000
IDR 100,000
IDR 150,000
IDR 200,000
IDR 250,000
1 2 3 4 5 6 7 8 9
Cost VS Time Gripper
C(t) t (hour)
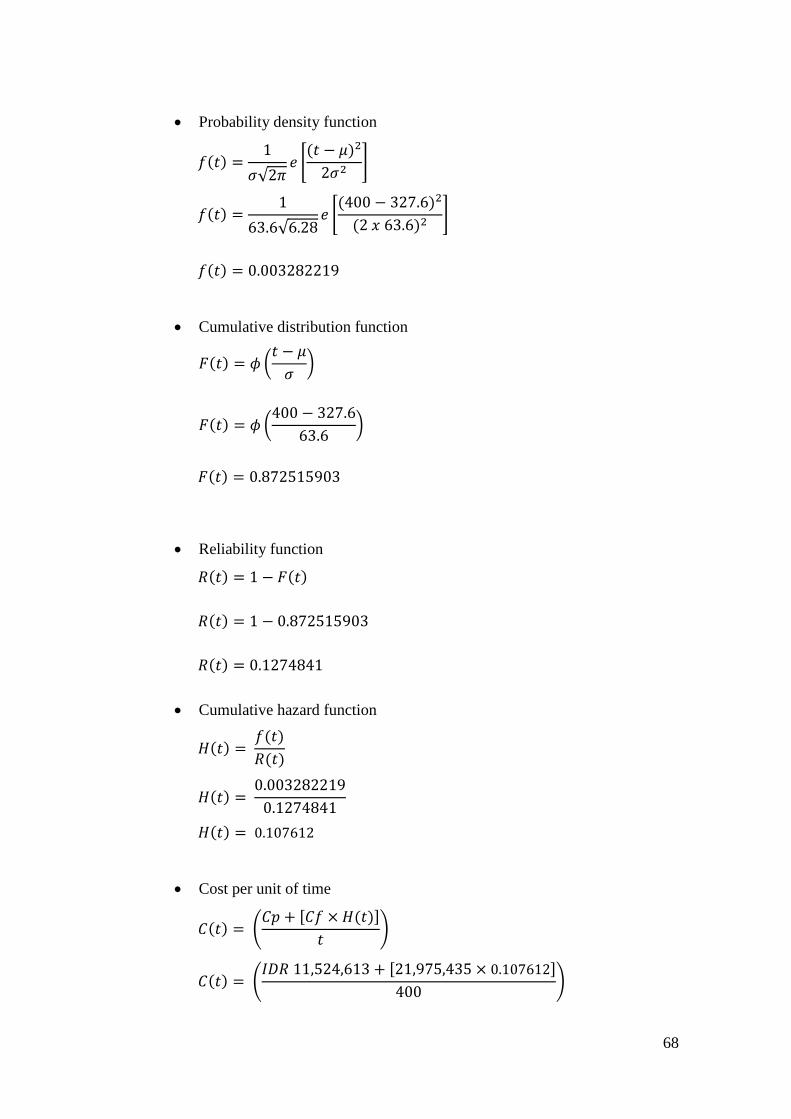
68
Probability density function
𝑓(𝑡) =1
𝜎√2𝜋𝑒 [
(𝑡 − 𝜇)2
2𝜎2]
𝑓(𝑡) =1
63.6√6.28𝑒 [
(400 − 327.6)2
(2 𝑥 63.6)2]
𝑓(𝑡) = 0.003282219
Cumulative distribution function
𝐹(𝑡) = 𝜙 (𝑡 − 𝜇
𝜎)
𝐹(𝑡) = 𝜙 (400 − 327.6
63.6)
𝐹(𝑡) = 0.872515903
Reliability function
𝑅(𝑡) = 1 − 𝐹(𝑡)
𝑅(𝑡) = 1 − 0.872515903
𝑅(𝑡) = 0.1274841
Cumulative hazard function
𝐻(𝑡) = 𝑓(𝑡)
𝑅(𝑡)
𝐻(𝑡) = 0.003282219
0.1274841
𝐻(𝑡) = 0.107612
Cost per unit of time
𝐶(𝑡) = (𝐶𝑝 + [𝐶𝑓 × 𝐻(𝑡)]
𝑡)
𝐶(𝑡) = (𝐼𝐷𝑅 11,524,613 + [21,975,435 × 0.107612]
400)

69
𝐶(𝑡) = 𝐼𝐷𝑅 34,724
Figure 4.14 Cost per Unit of Time Replacement Nipple
It can be seen that the cost and time are moving inversely, the shorter the length of
interval time is, the higher the cost gets. Additionally, regarding to the time
movement, as it becomes shorter, the reliability of time will also increase. The
machine reliability is set to reach 85%. The condition is illustrated in figure 4.14.
Component replacement activity is conducted in order to prevent unexpected
failure, which could impact to the production process. The interval calculation
shows when to do the replacement activity at the right time to reduce the risk of a
failure occur. Hence, the table below tells about when is the right time to replace
the component.
Table 4.17 Interval Time of Component Replacement
Component Distribution
Replacement
Interval Time Reliability Last Failure
Occurrence (h) (days)
Nozzle Normal 134 6 80% 12/30/2017
Gripper Weibull 145 6 80% 12/25/2017
Nipple Normal 270 11 82% 12/22/2017
0
50
100
150
200
250
300
350
400
450
IDR -
IDR 10,000
IDR 20,000
IDR 30,000
IDR 40,000
IDR 50,000
IDR 60,000
1 2 3 4 5 6 7 8 9
Cost VS Time Nipple
C(t) t (hour)

70
The replacement time are determined through the calculation in table 4.14, table
4.15 and table 4.16. Component replacement time is the key to design the proper
preventive maintenance schedule. Future preventive maintenance for nozzle
replacement took 134 hours to change, gripper will be done every 145 hours and
nipple will be done every 270 hours. The future calculation of preventive
maintenance will be proposed to the company. The goal of this scheduling is to
minimize maintenance cost spent by company. The company has set a goal of 80%
of the machine reliability. This information will be essential to the next phase,
which is designing the preventive maintenance schedule.
4.3.4.4 Proposed Preventive Maintenance Schedule
The preventive maintenance schedule is derived from the calculation result of the
interval time from each component. Every component has different time to perform
the maintenance activity, which is the replacement. Figure 4.15 are the preventive
maintenance schedule for the 3 observed component in this research to be replace.
The schedule will begin from January 1, 2018 until March 31, 2018.
Figure 4.15 Nozzle and Gripper Preventive Maintenance Schedule in A06 for January-March
2018
To reach the goal of 80%, the PM should be done based on the following schedule
on figure. 4.15. The color that represent the nozzle replacement is green, while the
gripper is purple. The component nozzle and gripper require the same time interval
in the maintenance activity, and since both of the component replacement time is
close to one another, it is recommended to do the maintenance activities on the same
day rather than on two different days, which could decrease the number of
downtime.

71
Figure 4.16 Nipple Preventive Maintenance Schedule in A06 for January-March 2018
Figure 4.14 is the proposed PM schedule for nipple component. As mentioned
before, the nipple component lifetime only last for less than 2 weeks, which is
approximately equal to 450,000 shots. The schedule begins in January 3, 2018
which last failure occurred in December 22, 2017, as it can be seen in figure 4.13.
There are several times where the nipple replacement occurs on the same day as the
nozzle and gripper replacement, such as; February 5 and February 15. Additionally,
although the nipple replacement is done every 11 days, the maintenance activity is
still close to the nipple and gripper replacement schedule, thus, if possible could be
made on the same day.
4.4 Data Analysis and Implementation
The next step, after improvement planning and calculation has been conduct, is to
go through the implementation. This subchapter will explain about further data
analysis from the calculations and the implementation of preventive maintenance
and TPM implementation, which is still regarding to the 8 pillars of TPM. This
system will be implemented by the company.
4.4.1 Machine Reliability
4.4.1.1 Component Reliability Comparison
The need to conduct a comparison of the reliability level is to evaluate the impact
to the machine performance before and after the improvement. The preventive
maintenance is set to 80%. The company will provide the necessary data and
equipment to ease the administration and reporting of downtime for the mechanics
by providing a computer PC in the pit stop (maintenance room). Below is the
comparison between the current and proposed preventive maintenance system
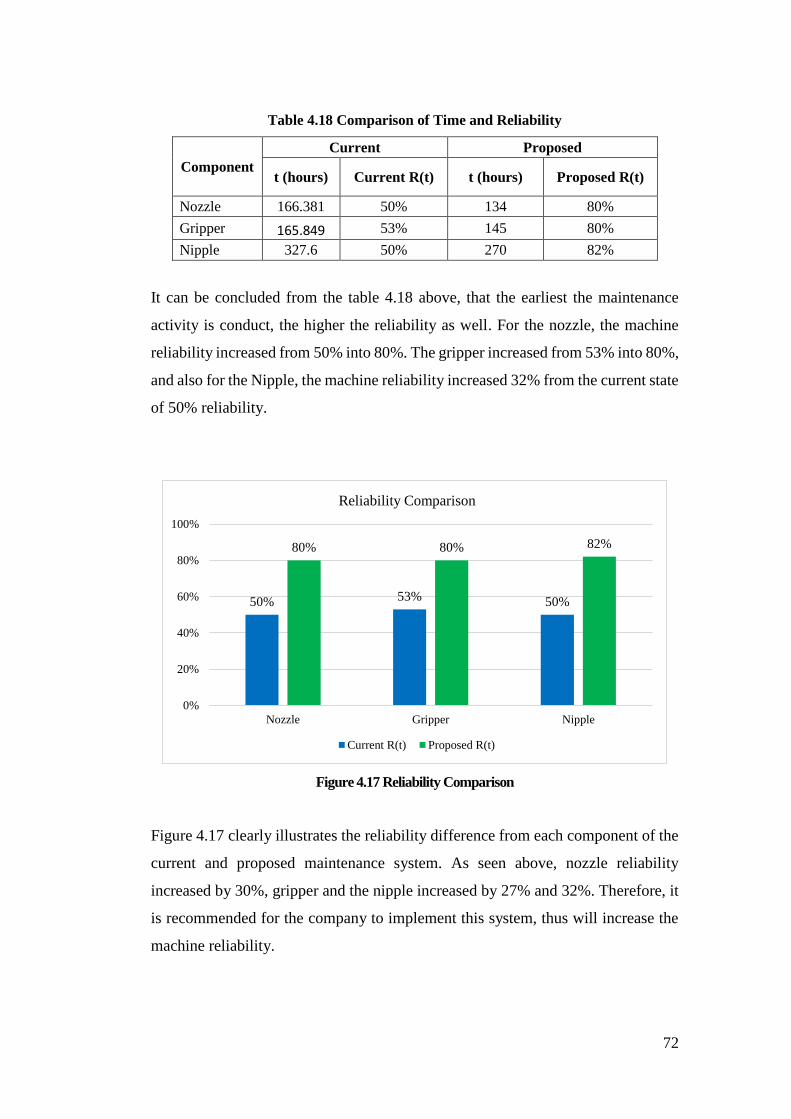
72
Table 4.18 Comparison of Time and Reliability
Component
Current Proposed
t (hours) Current R(t) t (hours) Proposed R(t)
Nozzle 166.381 50% 134 80%
Gripper 165.849 53% 145 80%
Nipple 327.6 50% 270 82%
It can be concluded from the table 4.18 above, that the earliest the maintenance
activity is conduct, the higher the reliability as well. For the nozzle, the machine
reliability increased from 50% into 80%. The gripper increased from 53% into 80%,
and also for the Nipple, the machine reliability increased 32% from the current state
of 50% reliability.
Figure 4.17 Reliability Comparison
Figure 4.17 clearly illustrates the reliability difference from each component of the
current and proposed maintenance system. As seen above, nozzle reliability
increased by 30%, gripper and the nipple increased by 27% and 32%. Therefore, it
is recommended for the company to implement this system, thus will increase the
machine reliability.
50% 53% 50%
80% 80% 82%
0%
20%
40%
60%
80%
100%
Nozzle Gripper Nipple
Reliability Comparison
Current R(t) Proposed R(t)

73
4.4.1.2 Proposed Preventive Maintenance Scheduling
4.4.1.3 OEE Comparison after TPM Implementation
To evaluate and validated the TPM implementation, overall equipment
effectiveness, also known as OEE is employed in this research. OEE focus on 3
metrics which are the availability, performance and quality. The OEE score is
obtained by multiplying all of the 3 metrics together. The table below is the result
of OEE from 3 months’ progress after the improvement. The detailed data is
available in Appendix 22-24.
Table 4.19 Machine A06 for January-March 2018
Month Availability Performance Quality OEE
Jan 75% 90% 99% 67%
Feb 86% 90% 99% 76%
Mar 87% 91% 99% 79%
80% 90% 99% 72%
The result of the OEE after the TPM implementation shows quite a significant
progress, compared to the observed period from August-December 2017. The OEE
trend keeps going up, starting from January 2018, which has an OEE score of 67%,
with the availability of 75% and an impeccable quality and performance of 99%
and 90%. On February, the availability increases 11%, which boost up the OEE
score into 76%, and on March, the availability increases by 1%, thus impacting the
performance to gain another 1% and managed to score 79%.
Below are the examples of the OEE metrics calculation, taken from January 2, 2018
in Appendix 22.
Availability = (𝑂𝑝𝑒𝑟𝑎𝑡𝑖𝑛𝑔 𝑇𝑖𝑚𝑒
𝐴𝑣𝑎𝑖𝑙𝑎𝑏𝑙𝑒 𝑇𝑖𝑚𝑒 ) × 100%
Availability = (22.93 ℎ𝑜𝑢𝑟
32.67 ℎ𝑜𝑢𝑟 ) × 100%
Availability = (0.702) × 100%
Availability = 𝟕𝟎. 𝟐%

74
Performance Calculation
𝑃𝑒𝑟𝑓𝑜𝑟𝑚𝑎𝑛𝑐𝑒 = (𝐴𝑐𝑡𝑢𝑎𝑙 𝑂𝑢𝑡𝑝𝑢𝑡
𝑆𝑡𝑎𝑛𝑑𝑎𝑟𝑑 𝑜𝑢𝑡𝑝𝑢𝑡 ) × 100%
𝑃𝑒𝑟𝑓𝑜𝑟𝑚𝑎𝑛𝑐𝑒 = (15,150
15,543) × 100%
𝑃𝑒𝑟𝑓𝑜𝑟𝑚𝑎𝑛𝑐𝑒 = (15,150
15,543) × 100%
𝑃𝑒𝑟𝑓𝑜𝑟𝑚𝑎𝑛𝑐𝑒 = (15,150
15,543) × 100%
𝑃𝑒𝑟𝑓𝑜𝑟𝑚𝑎𝑛𝑐𝑒 = (0,975) × 100%
𝑷𝒆𝒓𝒇𝒐𝒓𝒎𝒂𝒏𝒄𝒆 = 𝟗𝟕. 𝟓%
Quality = (𝐺𝑜𝑜𝑑 𝑂𝑢𝑡𝑝𝑢𝑡
𝐴𝑐𝑡𝑢𝑎𝑙 𝑜𝑢𝑡𝑝𝑢𝑡 ) × 100%
Quality = (15,020
15,150 ) × 100%
Quality = (15,020
15,150 ) × 100%
Quality = (0,991) × 100%
Quality = 𝟗𝟗. 𝟏%
Hence, the average availability, performance and quality from January until March
2018 months are calculated to determine the average OEE score:
𝑂𝐸𝐸 = 𝐴𝑣𝑎𝑖𝑙𝑎𝑏𝑖𝑙𝑖𝑡𝑦 𝑥 𝑃𝑒𝑟𝑓𝑜𝑟𝑚𝑎𝑛𝑐𝑒 𝑥 𝑄𝑢𝑎𝑙𝑖𝑡𝑦
𝑂𝐸𝐸 = 80% × 90% × 99%
𝑂𝐸𝐸 = 72%

75
Figure 4.18 OEE Comparison Before and After TPM
Although, some managers are probably quite satisfied with the value of each metric,
as it seems like everything is running well. However, when the 3 metrics are
multiplied, the real picture emerge. The company has set a goal for every area to
reach 85% in their OEE score and are obligated to sustain it. Die cast area still have
a lot of room for improvement and OEE really helps to highlight the equipment’s
problem area. In this case, the area that needs to be improve is the availability and
performance. Availability is associated with breakdown, long period of changeover
while performance is associated with equipment’s speed loss.
4.4.1.4 Cost Comparison
Besides to reduce the downtime, the essence of this research is to know whether the
new system could support cost saving by decreasing the price of maintenance
activity. TPM implementation before and after results are being compared in prices.
The preventive maintenance is more likely to occur, but breakdown will less likely
to happen with longer time.
54%
72%
0%
10%
20%
30%
40%
50%
60%
70%
80%
OEE Before TPM OEE After TPM
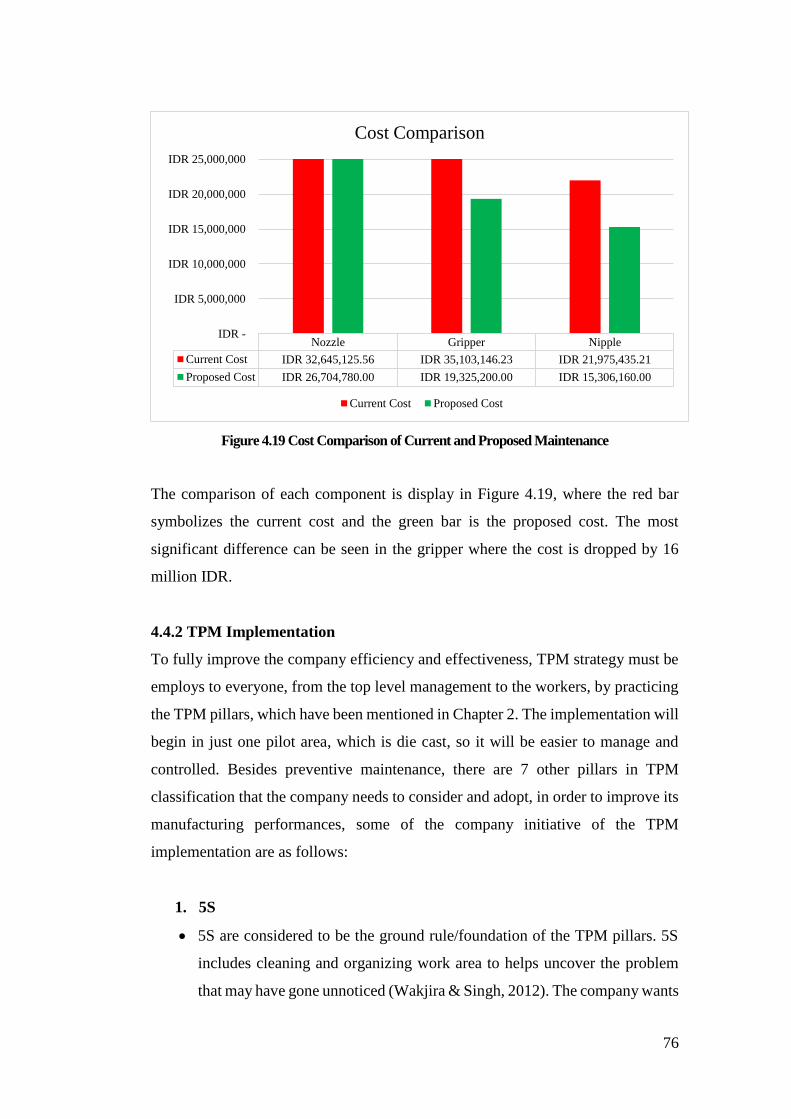
76
Figure 4.19 Cost Comparison of Current and Proposed Maintenance
The comparison of each component is display in Figure 4.19, where the red bar
symbolizes the current cost and the green bar is the proposed cost. The most
significant difference can be seen in the gripper where the cost is dropped by 16
million IDR.
4.4.2 TPM Implementation
To fully improve the company efficiency and effectiveness, TPM strategy must be
employs to everyone, from the top level management to the workers, by practicing
the TPM pillars, which have been mentioned in Chapter 2. The implementation will
begin in just one pilot area, which is die cast, so it will be easier to manage and
controlled. Besides preventive maintenance, there are 7 other pillars in TPM
classification that the company needs to consider and adopt, in order to improve its
manufacturing performances, some of the company initiative of the TPM
implementation are as follows:
1. 5S
5S are considered to be the ground rule/foundation of the TPM pillars. 5S
includes cleaning and organizing work area to helps uncover the problem
that may have gone unnoticed (Wakjira & Singh, 2012). The company wants
Nozzle Gripper Nipple
Current Cost IDR 32,645,125.56 IDR 35,103,146.23 IDR 21,975,435.21
Proposed Cost IDR 26,704,780.00 IDR 19,325,200.00 IDR 15,306,160.00
IDR -
IDR 5,000,000
IDR 10,000,000
IDR 15,000,000
IDR 20,000,000
IDR 25,000,000
Cost Comparison
Current Cost Proposed Cost

77
to make 5S as a culture and thus, every day, everyone is reminded to do 5S
every 2 hours for less than 3 minutes, using a special 5S song through the
speakers, to make the work less stressful.
Recently, the company has provided the die cast area with 1 large cabinet
for documents keeping, 2 level locker for water bottles storage, 2 shelves
for PPE storage, 2 boxes for tool keeping and 26 acrylics for each machine
to store its SOP, WI, Standard Schedule Conformance (SSC), and
Autonomous Checklist paper. All the places mentioned above has its own
identification so as to keep everything in its own place. Identification helps
to easily find items and easily spot things that are not being put in its proper
place. The illustration is available in Appendix 17.
In die cast area, 5S is to be done before the shift begins and after the shift
ends, with a given time of 10 minutes to sort out the tools, clean up the
machine and workplace. This practice aims to create a behavior of care and
self-belonging to everyone, the staff and workers, towards their workplace
and tools.
2. Autonomous Maintenance
Autonomous Maintenance aims to develop operator ownership. In the
company, the form of action for the autonomous maintenance is through
audit and inspection using a standardize checklist, designed by the process
engineer of the area. The maintenance staff tutor the operator on the basic
procedure on how to properly clean and maintain. This program’s aim is
neither to replace nor take over the maintenance job, but rather to help them
focus on repairing or replacement and avoid to do menial tasks, such as
cleaning, lubricating, inspection on equipment condition and adjustment.
Autonomous maintenance inspection is to be check regularly in the
beginning of the shift. The example of an autonomous maintenance for die
cast operator is available in Appendix 18.
3. Planned Maintenance
The company’s initiatives toward planned maintenance are as follows:
78
Develop from reactive to proactive methods and work attitude
Sustaining the good availability of the machine and enhancing its
research equipment to be able to perform predictive maintenance so as to
improve maintenance work efficiently and effectively.
Create a team that focus on collecting and reporting equipment condition
on a daily basis to determine the schedule/ the need for maintenance
requirements. The processed data will eventually analyze by the
engineers and the production to track equipment performance anytime.
Established Andon, blue tag and PM check sheets. Andon is a tool to
inform about the machine condition which in the form of 3 lights with
different colors. Green andon is a sign that the machine is operating,
yellow is to sign the material handler that material is running out and red
andon is to sign the technician that the machine is experiencing
abnormality and needs to be repair.
Blue Tag form is a short summarize report that is made only when there
is an abnormality in the equipment during production time. The flow of
the blue tag is when the operator, the person who is responsible to report
the abnormality, reported to the line leader of the abnormal occurrence
and the line leader will write down the Blue Tag form which will be
inputted in the blue tag board. The maintenance will come as soon as they
have received the Blue Tag form. The detail flow of Blue Tag reporting
is available in Appendix 19.
4. Education and Training
The department of Lean, Training and HSE are working together to give an
extensive knowledge and education towards the worker, with a goal to
create a factory full of valuable and knowledgeable workers. These training
includes;
Basic to Intermediate study of production system
The English language (oral and written)
In-depth study of each production process in the company

79
Health and Safety awareness
On the field training about proper techniques
Lean tools and methods
The aim of this program is to develop the character and knowledge of the
worker from a “know-how” into a “know-why”. Eventually, the workers
will be motivated to learn, apply their knowledge in work and pass on their
knowledge to others.
As a simple application of education and training in the line, is the line
leader. The line leader is responsible to give a 5-10-minutes briefing to the
workers to give them work motivation and insights before the workers can
start their job.
5. Quality Maintenance
The goal of this program is to make zero defect in the manufacturing. The
following points are the company initiatives towards a better quality
maintenance:
Use visual management in a form of a board called, “show and tell”,
which consist of the example of parts that are below the limit, accepted
limit and above the limit. This portable information board is to guide the
QC operator to decide easily on the good and defect parts. The illustration
of this implementation is attached in Appendix 20.
6. Kaizen
The concept of true TPM is where everyone, from the top level
management to regular workers, involved in the improvement program
to care for the equipment maintenance. Through TPM pillar, Kaizen, the
workers are allowed to participate in a problem solving event. Thus, they
can express their ideas and be a part in the decision making of the
meeting.

80
7. Environmental, Health & Safety
Visual Management
The department of Health Safety and Environment (HSE) associated with
the department of Lean Supply Chain (LSCO) use visual management to
promote and communicate safety by PPE signs, warning signs and stickers,
MSDS, safety posters, safety videos, near miss announcement board,
Triangle of safety and many more.
Risk Assessment
A fully risk assessment has been conducted for equipment and everyone
who is involve in the process of die cast, starting from the SWAT (line
leader), operator, QC, material handler, technician and even janitors. The
risk assessment should also be revise if ever there was a change of process
or equipment in the future.
Near Miss
The HSE team has reinforced everyone, in the die cast area to be more aware
of near miss and other potential safety hazard in their workplace. HSE
department has provided a near miss form to every production and non-
production area to report the near misses back to them, so any potential
hazards can be solved immediately. Every month, the HSE department will
give complementary gifts as a token of appreciation to any employee who
has reported many near miss in a month.
On The Spot Training
Every Thursday, each of the HSE engineers will go to a designated area and
for 30 minutes explain to 10 workers about potential safety hazards in the
workplace, near miss, emergency situation, emergency exit and how to use
emergency tools, such as fire extinguisher and fire hydrant in case of an
emergency. Actually, these topics has been explained before at the first time
they join the company through the labor orientation. This program aims to

81
remind the workers about safety awareness and to create a strong safety
culture to the workers.
The aim of TPM application in the company is not merely to have a high OEE
percentage to show off, but to continuously improve and sustain all the good
progress made from the TPM programs by the company. Some of the
documentation of the TPM implementation is attached in the Appendix 17-
Appendix 21, as evidence of the die cast progress in adopting TPM in its workplace
environment.

82
CHAPTER V
CONCLUSION AND RECOMMENDATION
.
5.1 Conclusion
The objectives in this research, which are to reduce the downtime and TPM
implementation has been achieved. After calculating and analyze all the necessary
data several points of conclusion can be drawn from this research, based on the
research objectives:
The performance of a toy manufacturing company has been analyzed and
thoroughly study. The die cast area has been specifically chosen as the subject
of the research because of its low equipment availability score impacted the
OEE trend. The research took a pilot machine, die cast A06, to be the main
subject of the research, which is the one that caused the highest downtime
with a total time of 40.3 hours in 5 months. After thorough observation, the
factors that mostly affecting the downtime are classified into five failures
which are nozzle leaking, nozzle damage, nozzle stuck, hose holder leaking
and water cooling mold leaking.
TPM implementation, through preventive maintenance and other initiatives in
the company, has successfully increase the reliability and OEE in the die cast
area. Nozzle reliability has increased by 30%, gripper and the nipple
reliability increased by 27% and 32%. The OEE gradually increasing, starting
from January 2018, which has an OEE score of 67%. On February, the OEE
score boost up to 76%, and on March managed 79%. The die cast machine
A06 in 3 months after TPM implementation has succeed to increase its OEE
by 18%, from an average of 54% in 2017 to its current score, 72%.

83
5.2 Recommendation
The following recommendation is taken based on the latest performance and is for
future improvement in any near research:
1. To synchronize the production schedule and maintenance schedule to avoid
conflicted schedule.
2. To reduce the use of paper for reporting so as the company can start to comply
with industry 4.0 standards
3. To develop the workers to have a Lean thinking in their work, thus will create
a more multi-skilled and effective people in the company.

84
REFERENCES
Ahuja, I., & Kahamba, J., Total Productive Maintenance and Performance:
Literature Review. International Journal of Quality & Reliability Management, Vol
25, 2008, pp 56-709.
Bhadury, B., Management of Productivity Through TPM, 2000, pp 51-241.
Brophy, A., The Financial Guide . In LEAN. Edinburg: Pearson Education Limited,
2013.
Chaneski, W., Total Productive Maintenance; An Effective Technique. Retrieved
from Modern Machine Shop: https://www.mmsonline.com/columns/total-
productive-maintenance-increases-machine-efficiency, 2002.
Dhillon, B., Engineering Maintenance. Florida: CRC Press LLC, 2002.
Gits, C., Design of Maintenance Concept. International Journal of Production
Economics, Vol 24, 1992, pp 217-226.
Kutucuoglo, K. H., A Framework for Managing Maintenance Using Performance
Measurement System. International Journal of Operations & Prodcutions, XIV,
2001, pp 172-194,
Mobley, K. R., Maintenance Engineering Handbook 7th Edition. New York : Mc
Graw Hill, New York, 2008.
Ross, S. M., Introduction to Probability and Statistics. San Diego: Elsevier
Academic Press, 2004.
Wakjira, M. W., & Singh, A. P., Total Productive Maintenance: A Case Study in
Manufacturing Industry. Global Journal of Researches in Engineering, Vol 12,
2012, pp 26.