increasing utilization in modern warehouse-scale computers using
TRANSCRIPT

..........................................................................................................................................................................................................................
INCREASING UTILIZATION IN MODERNWAREHOUSE-SCALE COMPUTERS
USING BUBBLE-UP..........................................................................................................................................................................................................................
PRECISELY PREDICTING PERFORMANCE DEGRADATION DUE TO COLOCATING MULTIPLE
EXECUTING APPLICATIONS ON A SINGLE MACHINE IS CRITICAL FOR IMPROVING UTILIZATION
IN MODERN WAREHOUSE-SCALE COMPUTERS (WSCS). BUBBLE-UP IS THE FIRST
MECHANISM FOR SUCH PRECISE PREDICTION. AS OPPOSED TO OVER-PROVISIONING
MACHINES, BUBBLE-UP ENABLES THE SAFE COLOCATION OF MULTIPLE WORKLOADS ON
A SINGLE MACHINE FOR WEB SERVICE APPLICATIONS THAT HAVE QUALITY OF SERVICE
CONSTRAINTS, THUS GREATLY IMPROVING MACHINE UTILIZATION IN MODERN WSCS.
......Warehouse-scale computers(WSCs) house large-scale Web applicationsand cloud services.1 The cost of construct-ing and operating these datacenters rangesfrom tens to hundreds of millions of dol-lars. As more computing moves onto thecloud, it’s exceedingly important to lever-age WSCs’ resources efficiently. However,the use of the computing resources in mod-ern WSCs remains low, often not exceed-ing 20 percent.2
Each machine in WSCs houses numer-ous cores, often four to eight cores persocket, and two to four sockets per machine.Cores share a number of resources, and inlight of the significant potential for parallel-ism on a single machine, this sharing canresult in performance interference acrosscores. This interference negatively and un-predictably impacts the quality of service(QoS) of user-facing and latency-sensitiveapplication threads. To avoid the potential
for interference, colocation is disallowedfor latency-sensitive applications, leavingcores idle, and resulting in an overprovision-ing that negatively impacts the entire data-center’s usage.
This overprovisioning is often unneces-sary, as colocations could result in significantperformance interference. The heavy-handedsolution of disallowing colocation resultsfrom an inability to precisely predict the per-formance impact for a given colocation.On the other hand, without prediction,profiling all possible colocations’ perfor-mance interference beforehand to guide colo-cation decisions is prohibitively expensive.The profiling complexity for all pairwisecolocations is O(N 2), where N is the numberof applications. With hundreds to thousandsof applications running in a datacenter, andthe frequent development and updating ofthese applications, a brute-force profilingapproach is impractical.
[3B2-9] mmi2012030088.3d 11/5/012 12:10 Page 88
Jason Mars
Lingjia Tang
Kevin Skadron
Mary Lou Soffa
University of Virginia
Robert Hundt
..............................................................
88 Published by the IEEE Computer Society 0272-1732/12/$31.00 �c 2012 IEEE

This work aims to enable the precise pre-diction of the performance degradation thatresults from contention for shared resourcesin the memory subsystem. A precise predic-tion is one that provides an expected amountof performance lost when colocated. Withthis information, colocations that don’t vio-late an application’s QoS threshold can beallowed, resulting in improved utilization inthe datacenter.
This is a challenging problem. The mostrelevant related work aims to classify applica-tions on the basis of how aggressive they arefor the shared memory resources and to iden-tify colocations to reduce contention basedon the classification. Furthermore, althoughsome work has looked at the server consoli-dation problem for datacenters hosting vir-tual machines (VMs), these works can’t beapplied at the application level to WSCsthat aren’t hosting VMs or without novelhardware changes. Until now, prior workhasn’t presented a solution to precisely pre-dict the amount of performance degradationeach application suffers due to colocation,which is essential for colocation decisionsof latency-sensitive applications in WSCs.In this article, we present such a solution—the Bubble-Up methodology.
Bubble-Up in a nutshellBubble-Up’s key insight is that predicting
the performance interference of co-runningapplications can be decoupled into measur-ing the pressure an application generates onthe memory subsystem and measuring howmuch an application suffers from differentlevels of pressure. The underlying hypothesisis that both the pressure and sensitivity canbe quantified using a common pressure met-ric. Having such a metric reduces the com-plexity of colocation analysis. As opposedto the brute force approach of profilingand characterizing every possible colocation,Bubble-Up only requires characterizing eachapplication once to produce precise pairwiseinterference predictions (such as O(N )).
Bubble-Up is a two-step characterizationprocess. First, each application is testedagainst an expanding bubble to produce asensitivity curve. The bubble is a carefullydesigned stress test for the memory sub-system that provides a dial for the amount
of pressure applied to the entire memory sub-system. This bubble is run along with thehost application being characterized. As thisdial is increased automatically (expandingthe bubble), the impact on the host applica-tion is recorded, producing a sensitivity curvefor the host application, such as the one illus-trated in Figure 1. The y-axis shows theapplication’s normalized QoS performance(latency, throughput, and so on), and thex-axis shows the bubble pressure. In the sec-ond step, we identify a pressure score for theapplication using a bubble pressure score re-porter. Applying these two Bubble-Up meth-odology steps to each application gives us asensitivity curve and a pressure score foreach application. Given two applications Aand B, we can then predict the performanceimpact of A when colocated with B by usingA’s sensitivity curve to look up A’s relativeperformance at B’s pressure score. In the ex-ample in Figure 1, B has a pressure score of 2and, as we can see from A’s sensitivity curve,A’s predicted QoS with that colocation is90 percent.
Modern WSCsBefore taking a closer look at Bubble-Up,
we must discuss how large-scale Web servicesare run in modern WSCs, and how we con-ceptualize QoS and application colocation inproduction WSCs.
Datacenter task placementIn modern WSCs, each Web service com-
prises one to hundreds of application tasks,
[3B2-9] mmi2012030088.3d 11/5/012 12:10 Page 89
Ap
p Q
oS
(%
)
Bubble’s pressure
100
90
80
2 10.....
Figure 1. Example sensitivity curve for an
application A. Assuming an application B’s
pressure score is 2, we can predict that
A will be performing at 90 percent of full
performance.
....................................................................
MAY/JUNE 2012 89

and each task runs on a single machine. Atask comprises an application binary, associ-ated data, and a configuration file that speci-fies the machine-level resources required.These resources include the number ofcores and amount of memory and diskspace that are to be allocated to the task. Atask’s configuration file could also includespecial rules for the cluster manager, suchas whether to disallow colocations withother tasks.
A cluster-level manager responsible for anumber of servers conducts task placement.On the basis of the resource requirement,the cluster manager uses an algorithm sim-ilar to bin packing to place each task in acluster of machines.3 After a task is assigneda machine, a machine-level manager (in theform of a daemon running in user mode)uses resource containers to allocate andmanage the resources belonging to thetask.4 For the remainder of this article, weuse the term application to represent theprogram binary for a given component ofa Web service, and application task to repre-sent this binary coupled with its executionconfiguration file.
Figure 2 shows a simplified illustration ofthe task-placement process. The amount of
required cores and memory resources speci-fied in each task’s configuration is carefullytuned by that task’s developers to achievethe QoS requirements. Latency-sensitivetasks that disallow colocation inadvertentlyoccupy more server resources, leading to un-necessary overprovisioning and lower ma-chine utilization.
Application QoSAs multicores become widely adopted in
datacenters, the cluster manager consolidatesmultiple disparate tasks on a single server toimprove machine utilization. However, vari-ous application tasks in a datacenter oftenhave different QoS priorities. User-facingapplications for Web search, maps, e-mail,and other Internet services are latency sensi-tive, and have high QoS priorities. Applica-tions such as file backup, offline imageprocessing, and video compression arebatch applications that often have no QoSconstraints. For these, latency isn’t as impor-tant. We define QoS of a latency-sensitiveapplication in terms of the relevant perfor-mance metric specified in its internal ser-vice-level agreements (SLAs). For example,the QoS of Google’s Web search is measuredusing query latency and queries per second,
[3B2-9] mmi2012030088.3d 11/5/012 12:10 Page 90
...
Core3
Server
Core1 Core4Core2
Latency-sensitive
core 3
server
Core1 core 4core 2
batch batch
core 3
server
Core1 core 4core 2
batch batch
core 3
server
Core1 core 4core 2
Batch Batch
Core3
Server
Core1 Core4Core2
Batch Batch
Tasks
...
Latency-sensitive
...
Clustermanager
Figure 2. Task placement in a cluster. The cluster manager doesn’t colocate latency-
sensitive applications with others to protect their quality of service (QoS) from performance
interference, causing low machine utilization.
....................................................................
90 IEEE MICRO
...............................................................................................................................................................................................
TOP PICKS

in contrast to Bing’s,5,6 which uses the qual-ity of search results provided.
There’s a tradeoff between the QoS per-formance of latency-sensitive applicationsand the machine utilization in WSCs.When equipped with a precise predictionof the performance degradation due to colo-cation, we can allow a small amount of QoSdegradation from colocation to improvethe machine utilization. As long as a coloca-tion pair is predicted to cause only a smallamount of QoS degradation within a speci-fied threshold, the cluster manager canallow the colocation. We specify the tolerableamount of QoS degradation in a QoS policy.For example, a 95 percent QoS policy indi-cates that we’re willing to sacrifice 5 percentof the QoS performance to improve machineusage. To enforce these QoS policies, weneed precise prediction for QoS degradationdue to colocation.
Bubble-Up methodologyThe Bubble-Up methodology enables
precise prediction for QoS degradation dueto colocation. Figure 3 illustrates the meth-odology’s two steps.
Step 1: Characterizing sensitivityBubble-Up’s first step is to characterize
each application task’s sensitivity to pressurein the memory subsystem. As Figure 3shows, in this step, we use a carefullydesigned stress test we call ‘‘the bubble’’ toiteratively increase the pressure applied tothe memory subsystem (for example, ‘‘bub-ble up in the subsystem’’). As we incremen-tally increase this pressure dial, we producea sensitivity curve that shows how each appli-cation’s QoS degrades as pressure increases.As we’ve previously described, we configureeach task to use a prescribed number ofcores for the cluster-level bin-packing algo-rithm used to assign tasks to machines inthe WSC. This number is commonly lessthan the number of cores available on asocket. The bubble runs on the remainingcores.
It’s important to understand that there’sno correct design for the bubble. Each designneeds only to approximate varying levels ofpressure, and there could be many gooddesigns. In this article, we present one suchdesign, and show that our single bubble de-sign is effective across myriad application
[3B2-9] mmi2012030088.3d 11/5/012 12:10 Page 91
Output
Core
App
DRAM
Memory bandwidth
Bubbleup
Bubbleup
Core
App ....
Shared cache
App’ssensitivity
curve
Output
DRAM
Memory bandwidth
Core
.... Reporter
Shared cache
App’s pressurescore
Step 1 Step 2
App App
Co
re
Co
re
Co
re
Co
re
Figure 3. Bubble-Up methodology. In step 1, we characterize the host application task’s sensitivity to pressure in the
memory subsystem using a bubble. In step 2, we characterize the host application’s contentiousness in terms of the
pressure it causes on a reporter.
....................................................................
MAY/JUNE 2012 91

workloads and architectures. Keep in mindthat we made assumptions about the archi-tectures for which this type of bubble designis applicable. Most importantly, we assumethe microarchitecture uses shared last-levelcaches, memory controllers, and bandwidthto memory. Modern commodity processorsencompass this type of design.
The art of bubble design. Although theremight be many ways to design a bubble,arriving at a good design that isn’t prone toerror and imprecision requires a set of keyrequirements and guidelines that apply gen-erally to bubble design.
� Monotonic curves. As the bubble’s pres-sure increases (turning the pressuredial up), the amount of performanceinterference should also increasemonotonically. Assuming the hostapplication task is sensitive to cross-core interference, higher amountsof pressure should result in worseperformance.
� Wide dial range. The pressure dialshould have a range that captures thecontentiousness of all the applicationtasks of interest. It should start from es-sentially no pressure, and incrementallyincrease pressure to a point close to themaximum possible pressure, or at leastworse than the most contentious appli-cation task in the set.
� Broad impact. The bubble should bedesigned to apply pressure to the mem-ory subsystem as a whole, not stressinga single component. However, remem-ber that error is introduced as the dif-ference in component pressure relativeto the host task’s sensitivity. Thiserror is generally minimized if first-order effects are prioritized.
For more detail on bubble design guide-lines, see our paper for the 44th AnnualIEEE/ACM International Symposium onMicroarchitecture.7
Designing the bubble. Our bubble’s designprinciple is to use a working set size as ourmeasure of pressure. For a given workingset size, we perform memory operations in
software to exercise that working set asaggressively as possible.
Our bubble is a multithreaded kernel thatgenerates memory traffic using both loadsand stores with a mixture of random andstreaming accesses. The number of threadsspawned is based on the configuration fileof the task being characterized. The pressuredial we use is the working set size on whichour kernel works. For example, a pressuresize of 1 means our bubble will continuouslysmash a 1-Mbyte chunk of memory. As weincrease the pressure, we increase our kernel’sworking set size. This increases the amountof data being pumped through the memorysubsystem, as computation isn’t the bottle-neck. We provide more details on our designelsewhere.7
Step 2: Bubble scoringBubble-Up’s second step characterizes
each application task’s contentiousness interms of its pressure on the memory sub-system. We call this measure of contentious-ness a bubble score. As Figure 3 shows, toidentify an application’s bubble score, weuse a reporter that observes how its own per-formance is affected by the application togenerate a score for the application. The re-porter is a carefully designed single threadedworkload that’s sensitive to contention. Aswith the bubble, the reporter is only designedonce and then can be used with myriadapplications and architectures.
Designing the reporter. We use the reporter’sown sensitivity to performance interferenceas a basis for reporting the pressure a host ap-plication generates. The impact the reporterfelt is translated in terms of the host applica-tion’s predicted bubble score. The onlyguideline to designing a good reporter is tohave a broad sensitivity—for example, itshould be sensitive to the memory subsystemholistically.
Like the bubble, there’s also no correctdesign for the reporter. However, unlikethe bubble, there is more flexibility in design-ing the reporter. This flexibility comes fromthe fact that the reporter is trained, and thesensitivity curve serves as a rubric for scorereporting, no matter the shape. To imple-ment the reporter, we use a mixture of
[3B2-9] mmi2012030088.3d 11/5/012 12:10 Page 92
....................................................................
92 IEEE MICRO
...............................................................................................................................................................................................
TOP PICKS

random accesses and streaming accesses sim-ilar to those used for the bubble itself, with-out the high instruction-level parallelism.The working set of the reporter used inthis work is about 20 Mbytes; thus, it usesthe last-level cache, memory bandwidth,and prefetcher on the machines used in ourevaluation.
Training the reporter. Before we can use thereporter, we must first train it using the bub-ble on the architecture for which it will bereporting. This training involves runningthe reporter against the bubble on the archi-tecture of interest, and collecting the report-er’s sensitivity curve. This needs to be doneonly once for each architecture. The reportercan then use its own sensitivity curve totranslate a performance degradation it suffersto the corresponding bubble score. The curveis essentially used in reverse. Instead ofusing scores to predict QoS, we use thereporter’s QoS to ascertain the colocatedapplication’s score.
Large-scale WSC workloadsand their sensitivity curves
Although the cloud houses much of theworld’s computation, little is known aboutthe application workloads that live in thiscomputing domain. The characteristics ofthe tasks that compose a large-scale Web ser-vice vary significantly. In addition to data-retrieval tasks, there are compute-intensivetasks for analyzing, organizing, scoring, andpreparing information for applications suchas search, maps, and ad serving.
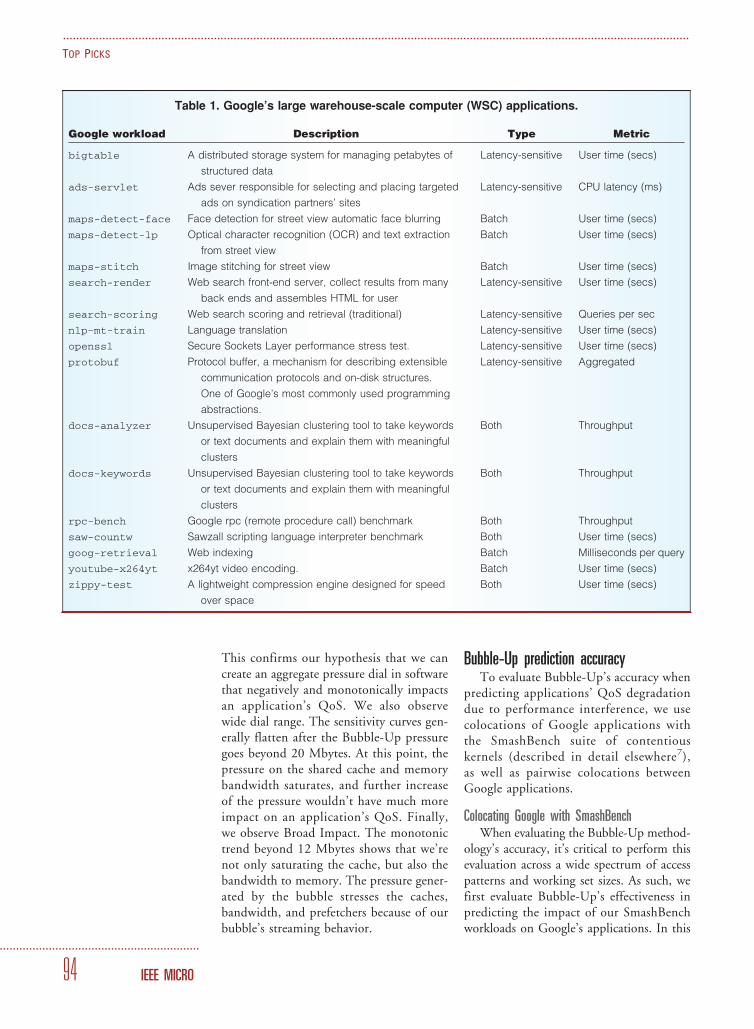
Google’s diverse workloadsTable 1 presents several key application
tasks housed in Google’s productionWSCs. These application tasks comprise amajority of the CPU cycles in arguably theworld’s largest datacenter infrastructure. Inaddition to each application task’s name,Table 1 shows the description, priorityclass, and key optimization metric for eachworkload. Each application task correspondsto an actual binary run in the datacenter. Ap-plication tasks that are user facing, both di-rectly and indirectly, are classified as latencysensitive, because the response time is para-mount. Throughput-oriented tasks that
aren’t user facing are classified as batch.Note that some tasks can be used in bothroles and are denoted as ‘‘Both’’ in thetable. The ‘‘Metric’’ column shows eachapplication’s key metric. In the context ofthis work, we define each task’s QoS as itsperformance along this metric.
We highlighted search-render inTable 1. This task is responsible for assem-bling the final view of the search processfor the user, which includes assemblingscored search results (including Web,image, and video), relevant ads from theads-servlet, and so on. This task ishighly latency sensitive and presents a com-pelling case that we use throughout thiswork to illustrate Bubble-Up’s necessity andvalue.
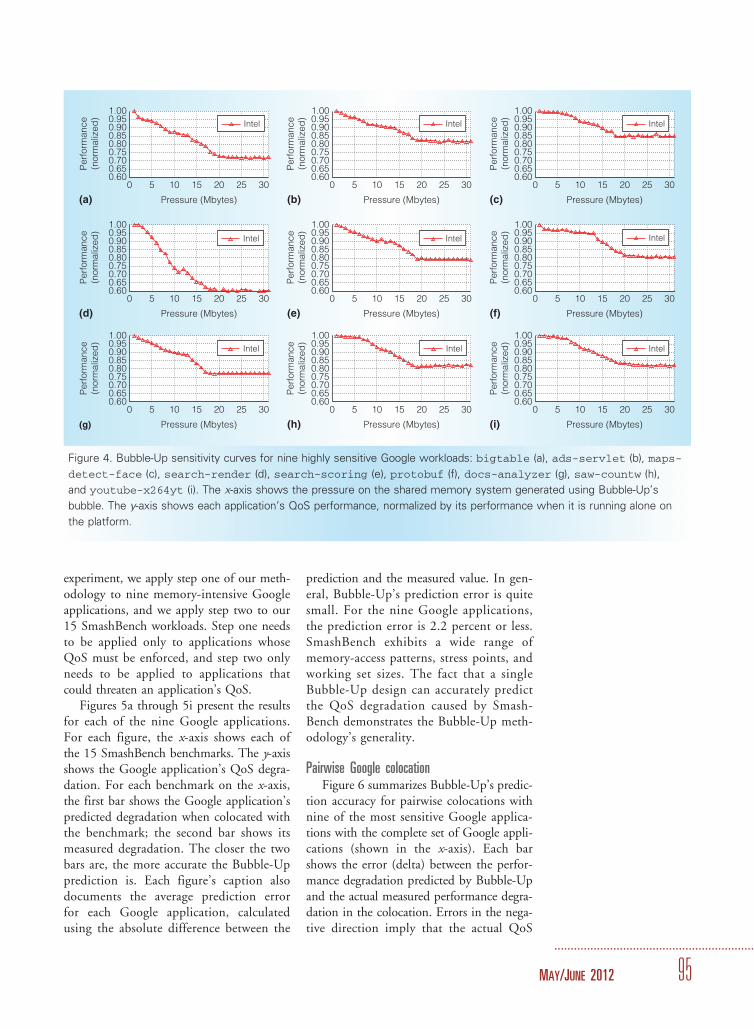
Sensitivity curves of WSC workloadsFigure 4 presents the sensitivity curves
generated by Bubble-Up for nine of themore sensitive Google benchmarks. Here,we examine our Bubble-Up design throughanalyzing the resulting sensitivity curves,and further improve our understanding ofhow pressure in the shared resources affectsthe QoS of Google’s applications. To gener-ate sensitivity curves, we adjust the pressureBubble-Up generates and measure an appli-cation’s QoS under each given pressure.Our evaluation uses a six-core Nehalem-based Xeon platform. The performancemetric we used to describe each Googleapplication’s QoS is the internal metric, aspresented in Table 1. We configured eachapplication task to use three cores on thesix-core Xeon. As we described earlier, dur-ing the characterization phase, the bubbleruns on the remaining cores. Figures 4a to4i present each Google application’s sensi-tivity curve. For each figure, the x-axisshows the pressure on the shared memorysystem generated using Bubble-Up’s bub-ble. The y-axis shows each application’sQoS performance, normalized by its perfor-mance when it’s running alone on theplatform.
Figure 4 illustrates that our bubble de-sign does indeed have the three propertieswe presented earlier. We observe mono-tonic curves. In general, each application’sQoS decreases as the pressure increases.
[3B2-9] mmi2012030088.3d 11/5/012 12:10 Page 93
....................................................................
MAY/JUNE 2012 93
This confirms our hypothesis that we cancreate an aggregate pressure dial in softwarethat negatively and monotonically impactsan application’s QoS. We also observewide dial range. The sensitivity curves gen-erally flatten after the Bubble-Up pressuregoes beyond 20 Mbytes. At this point, thepressure on the shared cache and memorybandwidth saturates, and further increaseof the pressure wouldn’t have much moreimpact on an application’s QoS. Finally,we observe Broad Impact. The monotonictrend beyond 12 Mbytes shows that we’renot only saturating the cache, but also thebandwidth to memory. The pressure gener-ated by the bubble stresses the caches,bandwidth, and prefetchers because of ourbubble’s streaming behavior.
Bubble-Up prediction accuracyTo evaluate Bubble-Up’s accuracy when
predicting applications’ QoS degradationdue to performance interference, we usecolocations of Google applications withthe SmashBench suite of contentiouskernels (described in detail elsewhere7),as well as pairwise colocations betweenGoogle applications.
Colocating Google with SmashBenchWhen evaluating the Bubble-Up method-
ology’s accuracy, it’s critical to perform thisevaluation across a wide spectrum of accesspatterns and working set sizes. As such, wefirst evaluate Bubble-Up’s effectiveness inpredicting the impact of our SmashBenchworkloads on Google’s applications. In this
[3B2-9] mmi2012030088.3d 11/5/012 12:10 Page 94
Table 1. Google’s large warehouse-scale computer (WSC) applications.
Google workload Description Type Metric
bigtable A distributed storage system for managing petabytes of
structured data
Latency-sensitive User time (secs)
ads-servlet Ads sever responsible for selecting and placing targeted
ads on syndication partners’ sites
Latency-sensitive CPU latency (ms)
maps-detect-face Face detection for street view automatic face blurring Batch User time (secs)
maps-detect-lp Optical character recognition (OCR) and text extraction
from street view
Batch User time (secs)
maps-stitch Image stitching for street view Batch User time (secs)
search-render Web search front-end server, collect results from many
back ends and assembles HTML for user
Latency-sensitive User time (secs)
search-scoring Web search scoring and retrieval (traditional) Latency-sensitive Queries per sec
nlp-mt-train Language translation Latency-sensitive User time (secs)
openssl Secure Sockets Layer performance stress test. Latency-sensitive User time (secs)
protobuf Protocol buffer, a mechanism for describing extensible
communication protocols and on-disk structures.
One of Google’s most commonly used programming
abstractions.
Latency-sensitive Aggregated
docs-analyzer Unsupervised Bayesian clustering tool to take keywords
or text documents and explain them with meaningful
clusters
Both Throughput
docs-keywords Unsupervised Bayesian clustering tool to take keywords
or text documents and explain them with meaningful
clusters
Both Throughput
rpc-bench Google rpc (remote procedure call) benchmark Both Throughput
saw-countw Sawzall scripting language interpreter benchmark Both User time (secs)
goog-retrieval Web indexing Batch Milliseconds per query
youtube-x264yt x264yt video encoding. Batch User time (secs)
zippy-test A lightweight compression engine designed for speed
over space
Both User time (secs)
....................................................................
94 IEEE MICRO
...............................................................................................................................................................................................
TOP PICKS
experiment, we apply step one of our meth-odology to nine memory-intensive Googleapplications, and we apply step two to our15 SmashBench workloads. Step one needsto be applied only to applications whoseQoS must be enforced, and step two onlyneeds to be applied to applications thatcould threaten an application’s QoS.
Figures 5a through 5i present the resultsfor each of the nine Google applications.For each figure, the x-axis shows each ofthe 15 SmashBench benchmarks. The y-axisshows the Google application’s QoS degra-dation. For each benchmark on the x-axis,the first bar shows the Google application’spredicted degradation when colocated withthe benchmark; the second bar shows itsmeasured degradation. The closer the twobars are, the more accurate the Bubble-Upprediction is. Each figure’s caption alsodocuments the average prediction errorfor each Google application, calculatedusing the absolute difference between the
prediction and the measured value. In gen-eral, Bubble-Up’s prediction error is quitesmall. For the nine Google applications,the prediction error is 2.2 percent or less.SmashBench exhibits a wide range ofmemory-access patterns, stress points, andworking set sizes. The fact that a singleBubble-Up design can accurately predictthe QoS degradation caused by Smash-Bench demonstrates the Bubble-Up meth-odology’s generality.
Pairwise Google colocationFigure 6 summarizes Bubble-Up’s predic-
tion accuracy for pairwise colocations withnine of the most sensitive Google applica-tions with the complete set of Google appli-cations (shown in the x-axis). Each barshows the error (delta) between the perfor-mance degradation predicted by Bubble-Upand the actual measured performance degra-dation in the colocation. Errors in the nega-tive direction imply that the actual QoS
[3B2-9] mmi2012030088.3d 11/5/012 12:10 Page 95
0.600.650.700.750.800.850.900.951.00
0 5 10 15 20 25 30
Perf
orm
ance
(norm
aliz
ed
)
Pressure (Mbytes)(a) (b) (c)
(d) (e) (f)
(g) (h) (i)
0.600.650.700.750.800.850.900.951.00
0 5 10 15 20 25 30
Perf
orm
ance
(norm
aliz
ed
)
Pressure (Mbytes)
0.600.650.700.750.800.850.900.951.00
0 5 10 15 20 25 30
Perf
orm
ance
(norm
aliz
ed
)
Pressure (Mbytes)
0.600.650.700.750.800.850.900.951.00
0 5 10 15 20 25 30
Perf
orm
ance
(norm
aliz
ed
)
Pressure (Mbytes)
0.600.650.700.750.800.850.900.951.00
0 5 10 15 20 25 30P
erf
orm
ance
(norm
aliz
ed
)
Pressure (Mbytes)
0.600.650.700.750.800.850.900.951.00
0 5 10 15 20 25 30
Perf
orm
ance
(norm
aliz
ed
)
Pressure (Mbytes)
0.600.650.700.750.800.850.900.951.00
0 5 10 15 20 25 30
Perf
orm
ance
(norm
aliz
ed
)
Pressure (Mbytes)
0.600.650.700.750.800.850.900.951.00
0 5 10 15 20 25 30
Perf
orm
ance
(norm
aliz
ed
)
Pressure (Mbytes)
0.600.650.700.750.800.850.900.951.00
0 5 10 15 20 25 30
Perf
orm
ance
(norm
aliz
ed
)
Pressure (Mbytes)
Intel Intel Intel
Intel
IntelIntelIntel
Intel Intel
Figure 4. Bubble-Up sensitivity curves for nine highly sensitive Google workloads: bigtable (a), ads-servlet (b), maps-
detect-face (c), search-render (d), search-scoring (e), protobuf (f), docs-analyzer (g), saw-countw (h),
and youtube-x264yt (i). The x-axis shows the pressure on the shared memory system generated using Bubble-Up’s
bubble. The y-axis shows each application’s QoS performance, normalized by its performance when it is running alone on
the platform.
....................................................................
MAY/JUNE 2012 95

[3B2-9] mmi2012030088.3d 11/5/012 12:10 Page 96
en−
lern
−m
n−
sn−
ln−
msl−
ssl−
msl−
l
Qo
S d
eg
rad
atio
n (
%)
PredictedActual
0
10
20
30
40
50
(a) (b) (c)
(d) (e) (f)
(g) (h) (i)
bl−
sb
l−m
bl−
lb
t−s
bt−
lb
t−m
ern
−s
en−
lern
−m
n−
sn−
ln−
msl−
ssl−
msl−
l
Qo
S d
eg
rad
atio
n (
%)
0
10
20
30
40
50
bl−
sb
l−m
bl−
lb
t−s
bt−
lb
t−m
ern
−s
en−
lern
−m
n−
sn−
ln−
msl−
ssl−
msl−
l
Qo
S d
eg
rad
atio
n (
%)
0
10
20
30
40
50
bl−
sb
l−m
bl−
lb
t−s
bt−
lb
t−m
ern
−s
en−
lern
−m
n−
sn−
ln−
msl−
ssl−
msl−
l
Qo
S d
eg
rad
atio
n (
%)
0
10
20
30
40
50
bl−
sb
l−m
bl−
lb
t−s
bt−
lb
t−m
ern
−s
en−
lern
−m
n−
sn−
ln−
msl−
ssl−
msl−
l
Qo
S d
eg
rad
atio
n (
%)
0
10
20
30
40
50
bl−
sb
l−m
bl−
lb
t−s
bt−
lb
t−m
ern
−s
en−
lern
−m
n−
sn−
ln−
msl−
ssl−
msl−
l
Qo
S d
eg
rad
atio
n (
%)
0
10
20
30
40
50
bl−
sb
l−m
bl−
lb
t−s
bt−
lb
t−m
ern
−s
en−
lern
−m
n−
sn−
ln−
msl−
ssl−
msl−
l
QoS
deg
rad
atio
n (
%)
0
10
20
30
40
50
bl−
sb
l−m
bl−
lb
t−s
bt−
lb
t−m
ern
−s
en−
lern
−m
n−
sn−
ln−
msl−
ssl−
msl−
l
QoS
deg
rad
atio
n (
%)
0
10
20
30
40
50
bl−
sb
l−m
bl−
lb
t−s
bt−
lb
t−m
ern
−s
en−
lern
−m
n−
sn−
ln−
msl−
ssl−
msl−
l
QoS
deg
rad
atio
n (
%)
0
10
20
30
40
50
bl−
sb
l−m
bl−
lb
t−s
bt−
lb
t−m
ern
−s
PredictedActual
PredictedActual
PredictedActual
PredictedActual
PredictedActual
PredictedActual
PredictedActual
PredictedActual
Figure 5. Bubble-Up’s accuracy in predicting QoS impact for nine highly sensitive Google workloads (in the following, the
average prediction errors are listed in parentheses as percentages): bigtable (2.2) (a); ads-servlet (0.8) (b); maps-
detect-face (0.7) (c); search-render (1.8) (d); search-scoring (0.8) (e); protobuf (2.2) (f); docs-analyzer (1.7) (g);
saw-countw (1.2) (h); and youtube-x264yt (1.5) (i).
−30
−20
−10
0
10
20
30
big
tab
le
ad
s−
serv
let
map
s−
dete
ct−
face
map
s−
dete
ct−
lp
map
s−
stitc
h
searc
h−
rend
er
searc
h−
scoring
nlp
−m
t_tr
ain
op
enssl
pro
tob
uf
docs−
analy
zer
docs−
keyw
ord
s
rpc−
bench
saw
−countw
goog
−re
trie
val
youtu
be−
x264yt
zip
py−
test
mean
Err
or
(%)
bigtable ads−servlet maps−detect−face search−render search−scoring
protobuf docs−analyzer saw−countw youtube−x264yt
Figure 6. Bubble-Up’s prediction accuracy for pairwise colocations of Google applications. Bars show the error (delta)
between the predicted performance degradation and the actual measured performance degradation.
....................................................................
96 IEEE MICRO
...............................................................................................................................................................................................
TOP PICKS

degradation is worse (more) than predicted;errors in the positive direction imply thatthe actual QoS degradation is better (less)than predicted. Only errors in the negativedirection can result in a violation of a QoSpolicy. As the figure shows, Bubble-Up’s pre-diction error is fairly small across all Googlepairwise colocations.
Improving utilization with Bubble-UpAs Bubble-Up proves to be effective at
precisely predicting the performance impactof colocations, the question arises of howwe improve utilization throughout a WSCwith Bubble-Up. To improve machineusage, we let latency-sensitive applicationshave a small amount of QoS degradation.Each application’s QoS policy specifiesthe tolerable degradation threshold. UsingBubble-Up, we can predict the QoS degrada-tion and allow colocation of latency-sensitiveapplications with other applications whenthe predicted QoS degradation is withinthe specified threshold. To evaluate Bubble-Up’s effectiveness, we constructed a scenario
using Google’s commercial workloads, largetraces of real queries from production, andproduction machines.
For this scenario, we use a cluster com-posed of 500 machines. In this experiment,we focused on search-render as ourmain latency-sensitive application whose QoSdegradation must remain small. This clusterhas 500 instances of search-render,each placed on a single machine. There are500 other Google applications, evenly dis-tributed across the 15 application types inTable 1. Every application uses three cores.Our evaluation baseline is the currentlydeployed cluster management that disallowscolocation of search-render with anyother applications. In this experiment, weinvestigated the potential colocation and uti-lization gained using Bubble-Up predictionsunder varying QoS policies.
Figure 7a presents the cluster’s usageresults after employing Bubble-Up predic-tion under various QoS policies. The base-line is the utilization of the cluster whencolocation is disallowed and each instance
[3B2-9] mmi2012030088.3d 11/5/012 12:10 Page 97
010
20
30
40
50
60
70
80
90
100
Baseline 99% 98% 95% 90% 85% 80% max
Clu
ste
r utiliz
ation (
%)
QoS policy
95% 90% 85% 80%
Colo
cations
QoS policy
0
100
(a)
(b)
200
300
400
500
99% 98%
QoS violated 2%−3%
QoS violated 1%−2%
QoS violated <1%
QoS enforced
Figure 7. Impact of using Bubble-Up to allow safe colocations in WSCs. Improvement in
cluster utilization when allowing Bubble-Up colocations with search-render under each
QoS policy (a); number of Bubble-Up colocations under each QoS policy (b).
....................................................................
MAY/JUNE 2012 97

of search-render occupies three ofthe six cores on a single machine, and thusat 50 percent cluster utilization. The maxi-mum utilization is achieved by allowing allcolocations—placing each of the 500 otherGoogle applications to co-run with asearch-render on every machine,regardless of search-render’s QoS deg-radation. The maximum utilization isn’t100 percent because we define a machine’sutilization as the aggregate performance ofall applications running on the machine,normalized by their solo performance. Forexample, applications A and B could be colo-cated, occupying all six cores on a machine.Because of cross-core interference, their per-formance is only 90 percent of that whenrunning alone, occupying three cores on amachine. The resulting machine utilizationwhen colocated in this case would be 90 per-cent instead of 100 percent.
As Figure 7a demonstrates, Bubble-Upprediction greatly improves machine utiliza-tion. Even under 99 percent of QoS policy(when the tolerable QoS degradation isonly 1 percent), the usage improves from50 percent to close to 70 percent. Allowinga more relaxed QoS policy improves theusage even more. Under the 80 percentQoS policy, the utilization improvement isclose to 80 percent, showing a large potentialbenefit when adopting Bubble-Up in WSCs.
Figure 7b presents the total number ofcolocations the cluster manager allowedbased on Bubble-Up’s prediction undereach QoS policy. Similar to utilization,the number of colocations increases as theallowed QoS degradation increases. Thebaseline colocation is 0. With 99 percentQoS policy, the colocation is close to 200.With 80 percent QoS policy, the allowedcolocations increase to 400. However, be-cause of Bubble-Up’s prediction error, therecould be colocations that violate the policy’sspecified QoS threshold. Stack bars presentboth the number of colocations that satisfythe QoS policy and the number of violations.The violations are broken down into threecategories: violations that cause less than1 percent of extra degradation beyond theQoS policy, 1 to 2 percent of extra degrada-tion, and 2 to 3 percent of additional degra-dation. For example, as the figure shows,
under 99 percent QoS policy, around 10percent of the colocations violate the policy.However, all of these violations only causeless than 1 percent extra QoS degradationbeyond the policy, meaning their QoS iswithin a 98 percent QoS policy. We describemany more results elsewhere, spanning threedisparate architectures.7
B ubble-Up is not only a technique thatsolves an important and pressing pro-
blem, but also a philosophy that inspires anew way of thinking about establishing newmetrics for architecting and optimizingmodern WSCs. When developing real-worldsolutions to be deployed on commodityprocessors, black-box profiling methodolo-gies are often preferable to white-boxanalytical approaches. This observation re-sults from the fact that the real-world impactof contention and performance interferenceis in large part determined by the set ofmemory subsystem components and optimi-zations (prefetchers, queuing protocols, re-placement policies, and victim caches)present on the architecture of interest.Modeling all of these factors as they existon real architectures often proves intractablebecause the complexity is high, and many ofthese components’ designs are trade secrets.
In addition to solving an important andpressing problem, Bubble-Up is an enablingtechnology. We can leverage Bubble-Up dy-namically to perform short probes of alreadyrunning services to analyze colocation deci-sions in flight. This type of approach opensup new possibilities in enabling adaptivemethods in managing QoS and maximizingutilization at finer granularities. Bubble-Uppresents the core principles to enable suchdevelopments.
The challenge of understanding howapplications interact and interfere with eachother goes beyond the domain of WSCs.Although our Bubble-Up methodology isparticularly useful for increasing utilizationin modern WSCs, it can also be applied any-where a known set of workloads are contin-uously executed on multicore and many-core systems—and, with the insights andprinciples gained from this static approach,a dynamic approach is right around thecorner. M I CR O
[3B2-9] mmi2012030088.3d 11/5/012 12:10 Page 98
....................................................................
98 IEEE MICRO
...............................................................................................................................................................................................
TOP PICKS

....................................................................References
1. U. Holzle and L.A. Barroso, The Datacenter
as a Computer: An Introduction to the De-
sign of Warehouse-Scale Machines, Mor-
gan and Claypool, 2009.
2. L.A. Barroso and U. Holzle, ‘‘The Case for
Energy-Proportional Computing,’’ Com-
puter, vol. 40, Dec. 2007, pp. 33-37.
3. A. Mishra et al., ‘‘Towards Characteriz-
ing Cloud Backend Workloads: Insights
from Google Compute Clusters,’’ ACM
SIGMETRICS Performance Evaluation Rev.,
vol. 37, no. 4, 2010, pp. 34-41.
4. G. Banga, P. Druschel, and J.C. Mogul, ‘‘Re-
source Containers: A New Facility for Re-
source Management in Server Systems,’’
Proc. 3rd Symp. Operating Systems, De-
sign, and Implementation (OSDI 99), Usenix
Assoc., 1999, pp. 45-58.
5. V.J. Reddi et al., ‘‘Web Search Using Mo-
bile Cores: Quantifying and Mitigating the
Price of Efficiency,’’ Proc. 37th Ann. Int’l
Symp. Computer Architecture (ISCA 10),
ACM, 2010, pp. 314-325.
6. C. Kozyrakis et al., ‘‘Server Engineering
Insights for Large-Scale Online Ser-
vices,’’ IEEE Micro, vol. 30, no. 4, 2010,
pp. 8-19.
7. J. Mars et al., ‘‘Bubble-Up: Increasing Utili-
zation in Modern Warehouse Scale Com-
puters via Sensible Colocations,’’ Proc.
44th Ann. IEEE/ACM Int’l Symp. Microarch-
itecture, ACM, 2011, pp. 248-259.
Jason Mars is a PhD candidate in theComputer Science Department at theUniversity of Virginia. His research inter-ests include adaptive systems in softwareand hardware, warehouse-scale computerarchitecture, and software/hardware code-signed architectures. Mars has an MS incomputer science from the University ofVirginia. He is a member of IEEE and theACM.
Lingjia Tang is a PhD candidate inthe Computer Science Department at theUniversity of Virginia. Her research interestsinclude compilers, runtime systems, andcomputer architecture. Tang has an MS incomputer science from the University ofVirginia.
Kevin Skadron is a professor in theComputer Science Department at the Uni-versity of Virginia. His research interestsfocus on parallel and accelerator architecturesin the presence of physical constraints such astemperature and power. Skadron has a PhDin computer science from Princeton Uni-versity. He is a senior member of IEEE andthe IEEE Computer Society and a distin-guished member of the ACM.
Mary Lou Soffa is the Owen R. CheathamProfessor and department chair of theComputer Science Department at the Uni-versity of Virginia. Her research interestsinclude optimizing compilers, virtual execu-tion environments, software testing, programanalysis, instruction-level parallelism, andmulticore architectures. Soffa has a PhD incomputer science from the University ofPittsburgh. She is an ACM Fellow.
Robert Hundt is a tech lead at Google,where he’s working on compiler optimiza-tion, datacenter performance, and Gmailperformance. Hundt has a Diplom Univ. ininformatik from the Technical University inMunich. He is a senior member of IEEE.
Direct questions and comments aboutthis article to Jason Mars, 2000 JeffersonPark Ave., Apt. 12, Charlottesville, VA,22903; [email protected].
[3B2-9] mmi2012030088.3d 15/5/012 14:38 Page 99
....................................................................
MAY/JUNE 2012 99