increasing concentrations of perfluoroalkyl acids in
TRANSCRIPT
Increasing Concentrations of Perfluoroalkyl Acids in ScandinavianOtters (Lutra lutra) between 1972 and 2011: A New Threat to theOtter Population?Anna Roos,†,‡,* Urs Berger,§ Ulf Jarnberg,§ Jiska van Dijk,∥ and Anders Bignert†
†Department of Contaminant Research, Swedish Museum of Natural History, PO Box 50007, SE-104 05 Stockholm, Sweden‡Department of Environmental Toxicology, Uppsala University, Norbyvagen 18A, SE-752 36 Uppsala, Sweden§Department of Applied Environmental Science (ITM), Stockholm University, SE-106 91 Stockholm, Sweden∥Norwegian Institute for Nature Research (NINA), NO-7485 Trondheim, Norway
*S Supporting Information
ABSTRACT: Liver samples from 140 otters (Lutra lutra) from Sweden andNorway were analyzed for 10 perfluoroalkyl carboxylic acids (PFCAs; C6−C15),4 perfluoroalkane sulfonic acids (PFSAs; C4,C6,C8,C10) and perfluorooctanesulfonamide (FOSA). Perfluorooctane sulfonic acid (PFOS) was the dominantcompound accounting for approximately 80% of the fluorinated contaminants andshowing concentrations up to 16 μg/g wet weight. Perfluorononanoic acid(PFNA) was the dominant PFCA (up to 640 ng/g wet weight) closely followedby the C10 and C11 homologues. A spatial comparison between otters fromsouthwestern Norway, southern and northern Sweden sampled between 2005 and2011 revealed that the samples from southern Sweden had generally the largestcontaminant load, but two PFCAs and FOSA were higher concentrated in theNorwegian samples. A temporal trend study was performed on otters fromsouthern Sweden collected between 1972 and 2011. Seven PFCAs (C8−C14),PFOS and perfluorodecane sulfonic acid (PFDS) showed significantly increasing trends with doubling times between 5.5 and 13years. The PFCAs also showed significantly increasing trends over the period 2002 to 2011. These findings together with theexceptionally high liver concentrations of PFOS are of great concern for the Scandinavian otter populations.
■ INTRODUCTION
Per- and polyfluoroalkyl substances (PFASs) are both oil andwater repellent, highly fluorinated, man-made chemicals. ManyPFASs have been in use for more than half a century innumerous industrial and consumer product applications,1 suchas textile stain and soil repellents, grease-proofing for food-contact paper, processing aids in fluoropolymer manufacturingand in aqueous film-forming fire fighting foams. There is noknown production of PFASs in Scandinavia but there may be(or have been) downstream industries using PFAS formulationsand many imported products still contain a variety of PFASs.2
The PFASs can be divided into two groups: perfluoroalkyl acids(PFAAs) and their environmental or metabolic precursorcompounds.3 PFAAs are resistant to thermal, chemical andbiological degradation, thus being extremely persistent in theenvironment. The two PFAA subgroups of highest concern arethe perfluoroalkyl carboxylic acids (PFCAs) and the perfluoro-alkane sulfonic acids (PFSAs). Perfluorooctane sulfonic acid(PFOS) is the most widely investigated PFSA. The largesthistoric producer of PFOS and PFOS-based compounds (i.e.,PFOS precursors), the 3M Company, phased out theproduction on a voluntary basis between 2000 and 2002 afterevidence of elevated concentrations of PFOS in blood fromtheir workers and in wildlife.4,5 PFOS and its precursors have
been used in cleaning aids, fire fighting foam and as water andgrease/stain proofing in textiles, furniture, paper and carpets.Nowadays PFOS is mainly used in the metal and aircraftindustry. PFOS is a PBT chemical; it is persistent,bioaccumulative, and toxic and was included in the StockholmConvention on Persistent Organic Pollutants in 2009, underAnnex B (requiring use restrictions). It was banned in manyapplications within the EU in June 2008, but was partlyreplaced by other persistent PFAAs, for example the shorterchain homologue perfluorobutane sulfonic acid (PFBS).Furthermore, PFOS is now produced in southeast Asia.Perfluorooctanoic acid (PFOA) is another persistent PFAAwhich has received a lot of attention. PFOA is used primarilyduring the production of fluoropolymers, which have hundredsof various manufacturing and industrial applications.Adverse health effects following PFAA exposure have been
reported from laboratory studies on rodents. The primarytarget is the liver where PFOS and PFOA cause increased liverweight and hepatocytic hypertrophy6,7 as well as abnormal
Received: April 5, 2013Revised: August 29, 2013Accepted: September 13, 2013Published: September 13, 2013
Article
pubs.acs.org/est
© 2013 American Chemical Society 11757 dx.doi.org/10.1021/es401485t | Environ. Sci. Technol. 2013, 47, 11757−11765
behavior, weight loss and serious damages in liver and lung8
and developmental neurotoxic effects.9 Early pregnancy loss,comprised postnatal survival, delays in general growth anddevelopment were also found for mice given PFOA10 as well asincreased mortality, lowered cholesterol and estradiol levels inserum in cynomolgus monkeys given PFOS in different doses.11
In addition, PFOS and PFOA are potential developmentaltoxicants and are suspected endocrine disruptors resulting inlower testosterone levels and higher estradiol levels in adultrats.12
A study on wild sea otters (Enhydra lutris) from Californiashowed that otters that died from infectious diseases had higherconcentrations of both PFOS and PFOA compared to ottersthat died from noninfectious diseases.13 The highest concen-trations of PFAAs with a dominance of PFOS are usually foundin top predators like polar bear (Ursus maritimus), mink(Neovison vison), river otter (Lontra canadensis), and variouspinnipeds,14−17 which demonstrates that some PFAAs dobioaccumulate. The bioaccumulation potential generallyincreases with increasing chain length of the PFAAs.18
Therefore most attention in biomonitoring has been giventhe long-chain PFSAs and PFCAs. PFAAs do not dissolve inlipids but bind to proteins.19 Thus, they are found in highestconcentrations in for example liver, serum, and egg yolks.20
The otter (Lutra lutra) in Sweden has previously beenexposed to high concentrations of organochlorines, showed alow reproduction rate and was only found in few numbers inscattered areas in the 1980s.21 After the ban of PCBs and DDTin the 1970s the concentrations of these compounds havedecreased in Swedish biota.22,23 In the early 1990s the otterpopulation in Sweden started to increase in numbers and inspatial distribution and otters are now again found in areas thathave been abandoned for three decades or more.24
Approximately 80% of the otter’s diet consists of fish, whichmakes the otter a target species for waterborne environmentalcontaminants such as PFAAs. Furthermore, PFAAs are knownto have increased in concentrations in the Swedish environ-ment at least up to the late 1990s, for example in guillemot eggs(Uria aalge)25 and in gray seals (Halichoerus grypus).26
Increasing trends were found in biota worldwide includingremote areas such as the Arctic27−29 and Antarctica.30 However,no comprehensive study on trends of PFAAs in otters has beenpublished to date.Fifteen PFASs were analyzed in 140 livers of otters from
Sweden and Norway in the present study. The aim was toinvestigate PFAS levels, as well as their temporal trends forsouthern Sweden and possible spatial differences between areasin Sweden and Norway.
■ MATERIALS AND METHODSSamples. Liver samples from otters from Sweden (n = 123,
collected between 1972 and 2011) and from southwesternNorway (n = 17, collected in 2010) were included in this study.The sampling areas are depicted in Figure S1 in the SupportingInformation (SI). Most of the otters were killed in trafficaccidents or drowned in fishing gear. The carcasses were frozenbefore necropsy and thawed when samples of different tissueswere taken for various studies. The liver samples were stored at−25 °C in the Environmental Specimen Bank at the SwedishMuseum of Natural History (SMNH) in Stockholm, Sweden,or at the Norwegian Institute for Nature Research (NINA) inTrondheim, Norway. Gender, weight and length of the otterswere determined during necropsy and the specimen were
grouped into three age groups: juveniles (up to 5 months old, n= 3) if tooth replacement was incomplete, subadults(approximately 5−18 months old, n = 28) when the epiphysealclosure at the proximal ends of the femur was incomplete, andadults (19 months and older, n = 109) when the epiphysealclosure was complete.31 Two of the samples included in thepresent study were from a mother and her juvenile cub. Thelactiferous tissue from one lactating female was also analyzed, inaddition to the liver.The temporal trend analyses consisted of 97 otters from
southern Sweden collected between 1972 and 2011. Thegeographical study focused on otters collected between 2005and 2011 and covered three areas: southern and northernSweden (n = 46 and 16, respectively) and southwesternNorway (n = 17, see Figure S1 in the SI). Most (probably all)of the otters from Sweden came from limnic areas and theotters from Norway were mainly from a marine environment atthe southwestern coast of Norway. There was no tendency ofincluding a higher percentage of urban otters in recent yearscompared to earlier years.
Target Compounds. In this paper we follow the PFASterminology as suggested by Buck et al.3 For full compoundnames, CAS-number and carbon chain length of the analytessee Table S1 in the SI. The target compounds were PFOA,PFNA, PFDA, PFUnDA, PFDoDA, PFTrDA, PFTeDA,PFHxS, PFOS, PFDS, and FOSA and 80 specimens (includingall Norwegian samples) were also analyzed for PFHxA, PFHpA,PFPeDA, and PFBS. For simplicity, perfluorooctane sulfon-amide (FOSA, the only precursor compound included in thisstudy) is hereafter included in the generic term PFAAs.Chemical standards were obtained either from Wellington,Aldrich or Fluka.
Chemical Analyses. Prior to analysis, liver samples werethawed and subsampled at SMNH or NIVA. Approximately 1 gof liver was taken for analysis. The analytical method and thenumber of analytes changed during this study. The first methodused up to 2005 was based on ion pair extraction into anonpolar solvent as described by Ylinen et al.32 and elaboratedby Hansen et al.33 The method is described in detail in the SIincluding modifications from the originally published proce-dure.33 Instrumental analysis and quantification in the firstmethod was based on high performance liquid chromatography(HPLC) coupled to tandem mass spectrometry (MS/MS) inthe negative ion electrospray ionization mode as described indetail by Holmstrom et al.25 A more detailed description of theanalytical method is given in the SI.The second method used for analyses performed 2008 or
later is described by Berger et al.34 It was based on solid−liquidextraction with acetonitrile and dispersive cleanup ongraphitised carbon. A brief version of the sample preparationincluding modifications from the procedure described byBerger and co-workers is given in the SI. Instrumental analysisand quantification in the second method was done as describedin detail by Holmstrom and Berger.35 The same instrumenta-tion as in the first method was employed. Again, the procedureis described in detail in the SI. All concentration values in thepresent study are given on a sample wet weight (ww) basis.
Quality Assurance. Due to the methodological differences,systematic deviations between the results from the twomethods were expected. Therefore, nine liver samples wereanalyzed with both methods, and the two sets of results werecompared for each analyte using regression analysis. Allregression analyses were scrutinized and only the statistically
Environmental Science & Technology Article
dx.doi.org/10.1021/es401485t | Environ. Sci. Technol. 2013, 47, 11757−1176511758
significant ones were used in the conversions. In several of theregressions, potential high leverage effects of single measure-ments were identified and therefore the ratio between the twomethods was used in the conversion which is a more robustway to convert data. For compounds that showed a significantcorrelation between the two methods a correlation coefficientwas calculated. Data from the previous method was thenadjusted using the correlation coefficient for each substance sothat results from the two methods could be combined forfurther data treatment. For PFNA, PFTeDA, PFHxS, andFOSA there was no significant correlation between the resultsof the two methods and therefore only data from the latermethod was used.The method detection limits (MDLs) for the first method
were around 1 ng/g wet weight for all analytes, while MDLs inthe second method were between 0.1 and 1 ng/g. Absoluterecoveries of the internal standards (ISTDs) in the secondmethod were calculated for all samples and were between 69and 91% (average values) with standard deviations <19% for allISTDs. Duplicate sample extractions were performed with bothmethods to assess precision. In the first method, quantifiedconcentrations of paired results varied with <10% between theduplicate samples, with one exception of 15% for PFHxS. In thesecond method the variation of 27 out of 36 paired results was<10%, and the remaining 9 paired values showed deviationsbetween 11 and 19%. A fish sample previously investigated inan international interlaboratory comparison study36 wasanalyzed with the second method for accuracy testing. Theresults for all quantifiable analytes obtained in the present studydeviated <24% from the median values obtained in theinterlaboratory comparison study.Statistical and Trend Analyses. Statistical analyses were
only performed for PFAAs that had less than 25% nondetects inthe sample set under consideration. Values below the MDL(nondetects) were replaced by MDL/√2 prior to statisticaltreatment.37 Other methods have been suggested that are animprovement over the common practice of recalculatingnondetects as MDL/√2, and which would increase thestatistical power.38 However, these alternative methods requireseveral values to be above MDL in any particular year andtherefore could not be applied in the present study.The otters from Norway were all collected from the same
area and in the same year. Therefore, they were used for testingof a possible correlation of PFAA levels with age and/or sexusing students t test. In this material, there were no juveniles,thus only two age classes. Since the Norwegian sample set onlyconsisted of 17 otters, we also used simple regression analysison the otters from southern Sweden (i.e., the largest group),where the different PFAAs were dependent variables and age,sex, and sampling year were independent variables. Onlysampling year turned out to be significant, not sex or age.Otters collected between 2005 and 2011 were used in a
spatial study covering three areas: southwestern Norway,northern Sweden and southern Sweden (Figure S1 in the SI).Kruskal−Wallis non parametric test was used to test forsignificant differences in medians between the three areas. Incase Kruskal−Wallis test was significant, repeated Mann−Whitney U-tests were applied as a post hoc test with theBonferroni correction.Temporal trend analyses were only carried out on otters
from southern Sweden using ordinary log−linear regressionanalysis. Prior to statistical analysis the PFAA concentrationvalues were log-transformed in order to approach the
assumptions of normal distribution and variance homogeneity.Mean values of at least four individual specimens werecalculated to avoid a strong influence of single specimens of aparticular year. If the number of measurements were fewer thanfour in a particular year we fused data from two or more yearsuntil we got at least four measurements. Then we calculated themean value for concentration and year before the linearregression analysis was carried out.
■ RESULTS AND DISCUSSIONPFAA Concentrations. PFNA, PFOS, and FOSA were
detected above their respective MDLs in all samples. PFCAswith 8 and 10 to 13 carbon atoms (PFOA and PFDA-PFTrDA)and PFHxS were detected in >95% of all analyzed samples,whereas PFTeDA, PFPeDA and PFDS were above MDL in 87,79, and 90% of all samples, respectively. PFHxA was belowMDL in all samples (<0.1−<0.5 ng/g ww) and PFHpA wasbelow MDL in all but three samples from 2009 and 2010. PFBSwas found in 18 otters from northern and southern Sweden(31%) from the period 2005 to 2011, and in two otters fromNorway (12%), in concentrations just above the MDL (0.15−0.3 ng/g ww). Thus, PFHxA, PFHpA, and PFBS were notfurther evaluated.PFOS was found in all samples in concentrations ranging
from 19 to 16 000 ng/g ww. It was by far the dominantcompound (approximately 80% of the analyzed PFAAs wasPFOS), which is in agreement with numerous other wildlifestudies.22,23,34,39,40 The concentrations of PFOS were higher ormuch higher in otters from Sweden compared to the ottersfrom Norway, as well as in other mammals and birds of preyfrom Scandinavia.26,41−43
PFNA was the second most abundant PFAA and thedominant PFCA in our study with liver concentrations rangingbetween 0.51 and 637 ng/g ww. Among the PFCAs, theconcentrations decreased gradually with increasing chain lengthfrom PFNA to PFPeDA. This pattern is different from thetypical PFCA pattern often observed in marine mammals andbirds, where the odd carbon chain homologues clearlydominate over the adjacent even carbon chain homologues.35,44
However, the Norwegian otters in the present study did show atendency of this “marine” pattern (see Spatial trends sectionbelow). Compared to the otters in our study, the concen-trations of PFCAs were lower in arctic fox (Alopex lagopus),ringed seal (Pusa hispida), mink, birds, and fish from theCanadian Arctic, but the concentrations in polar bears weregenerally similar or only somewhat lower.44 Polar bears fromEast Greenland had generally similar or higher meanconcentrations of most PFAAs compared to the otters in thepresent study.45
FOSA was the only nonpersistent precursor compoundincluded in this study. It was found in all samples analyzed(0.7−92 ng/g). The FOSA concentrations in otters weresomewhat lower compared to harbor porpoise from Danishwaters.43 River otter and mink from the United States hadhigher (Illinois) or similar (Massachusetts, South Carolina andLouisiana) concentrations of FOSA as the otters in our study.15
Age and Gender. No significant differences in PFAAconcentrations between subadults and adults were found in theNorwegian otters apart from PFNA, where adults had slightlyhigher concentrations compared to the subadults (t test, p =0.008). Also, no significant difference in concentrationsbetween males and females was found for any of thecompounds. Age and sex had no significance in the multiple
Environmental Science & Technology Article
dx.doi.org/10.1021/es401485t | Environ. Sci. Technol. 2013, 47, 11757−1176511759
regression analyses either, carried out on otters from southernSweden (including two juveniles). Therefore, otters of differentage and/or sex were treated as one group in further statisticalanalysis.A mother and her juvenile cub were analyzed and the liver
concentration ratio cub/mother was below 1 for all PFAAs,indicating a limited transfer from mother to cub (Table 1). Thehighest ratios were found for the long-chain PFCAs (PFDoDA,PFTrDA, and PFTeDA), with values between 0.80 and 0.99.The exception was PFPeDA having a ratio of only 0.55. PFHxSshowed the highest ratio among the PFSAs with 0.72. The ratioof PFAA concentrations in lactiferous tissue/liver from alactating female was ≤0.2 for most compounds (Table 1). Onlylong-chain PFCAs (PFTrDA, PFTeDA, and PFPeDA) andPFHxS displayed higher ratios, which can explain the elevatedratios of these PFAAs compared to the other analytes in thecub/mother comparison. However, only one pair cub/motherwas analyzed so the data should be treated with caution. Sincesubadults had similar liver concentrations as adults for allcompounds, it seems likely that a steady state is reachedrelatively early in an otters life.
Male polar bears showed a significant increase inconcentrations of PFCAs only up to an age of six years eventhough the oldest male in the study was 28 years old.45
Similarly to the present study on otters, no difference in PFAAconcentrations between adult male and female polar bears wasfound. This could indicate that lactation is not a major pathwayof PFAA elimination among otters and polar bears. No genderor age differences in PFAA levels were seen in ringed sealpopulations in Canada. The authors suggested that the lack of aconcentration trend with age could be due to relatively rapiddepuration rates.17 A half-life of 21 weeks was estimated forPFOS in bottlenose dolphins (Tursiops truncatus), and urinewas suggested to be an important depuration pathway forPFAAs.40
However, harbor seal pups (Phoca vitulina concolor) in thenorthwestern Atlantic had higher concentrations of PFOS andPFDS compared to adults, and it was suggested that maternaltransfer is an important route for PFAAs to pups among harborseals. No gender difference in concentrations was seen amongadult seals.46 Similar patterns were observed for bottlenosedolphins from Florida40 and harbor porpoises in Danish
Table 1. PFAA Liver Concentration Ratios Cub/Mother in an Otter Pair That Was Killed in Traffic in Central Sweden in 2009and Concentration Ratios in Lactiferous Tissue/Liver in a Lactating Female
PFOA PFNA PFDA PFUnDA PFDoDA PFTrDA PFTeDA PFPeDA PFHxS PFOS PFDS FOSA
ratio cub/mother 0.79 0.31 0.42 0.59 0.80 0.99 0.89 0.55 0.72 0.61 0.62 0.38ratio lactiferous tissue/liver 0.09 0.03 0.03 0.07 0.14 0.23 0.23 0.27 0.38 0.07 0.20 0.14
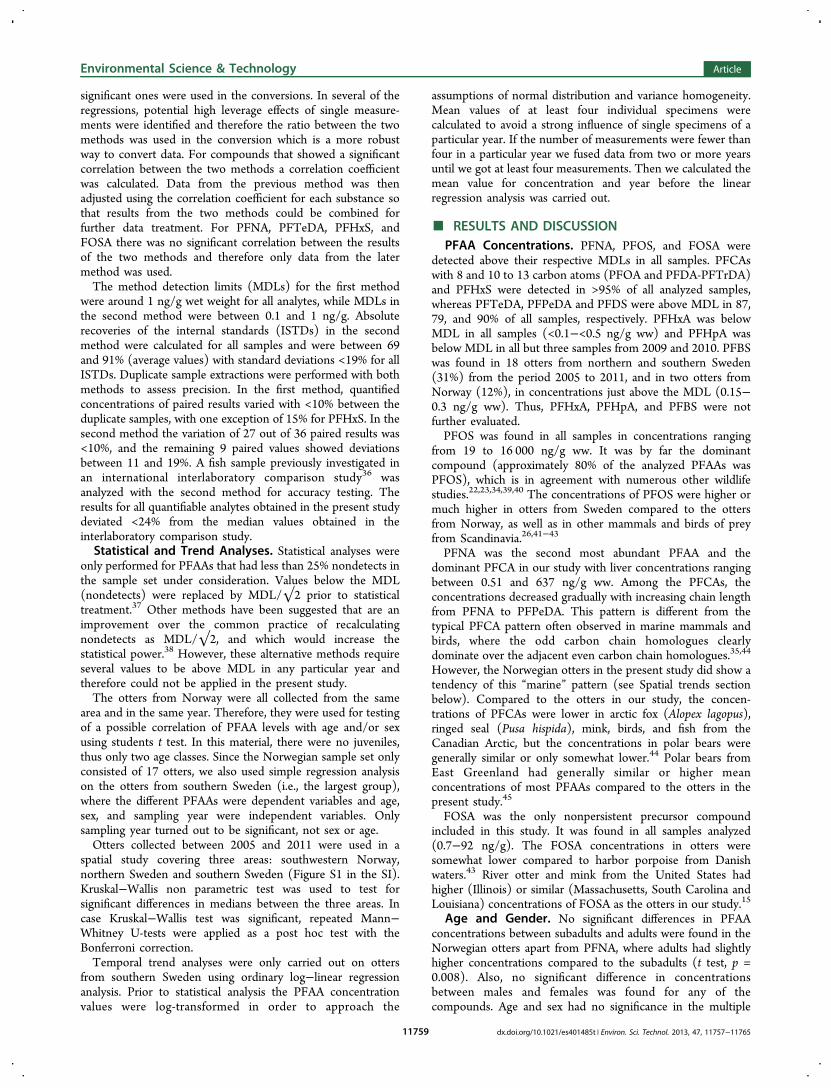
Figure 1. PFAA concentrations in otters (ng/g ww) collected between 2005 and 2011 from three areas (southwestern Norway, northen Sweden, andsouthern Sweden). The results are presented in boxplots, showing the median in a box delimited by the lower and upper quartiles. A vertical line isdrawn from the bottom and top of the box to the lowest and largest observation within 1.5 interquartile ranges, respectively. All observations beyondthese limits are plotted individually. The width of each box is proportional to the number of analyses for that group.
Environmental Science & Technology Article
dx.doi.org/10.1021/es401485t | Environ. Sci. Technol. 2013, 47, 11757−1176511760

waters.43 Clearly, the toxicokinetic behavior of PFAAs in ottersand bears is different from that in pinnipeds and cetaceans.Spatial Trends. In the sample set used for the spatial trend
analysis the percentage nondetects was below 11% for allanalytes (apart from PFHxA, PFHpA, and PFBS, see above).The results of the spatial trend comparison are visualized withboxplots in Figure 1. Table S2 in the SI gives a numericsummary of the concentration data from the spatial trend study.Much smaller concentration ranges were observed for thePFAAs in otters from Norway compared to otters fromSweden. This was probably due to the fact that the otters inNorway were all sampled within a confined marine area duringa short time period (2010), whereas otters from Sweden weresampled between 2005 and 2011 from larger areas feeding froma limnic food chain (Figure S1 in the SI).The general pattern (i.e., relative proportions) of PFAAs in
otters was similar for all three sampling regions. Among thePFCAs, PFNA dominated (33−40%) followed by PFDA andPFUnDA (20−30%) (Figure S2 in the SI). The otherhomologues did not contribute much to the sum of PFCAs.The Norwegian otters showed a tendency of a pattern ofdomination of odd carbon number PFCAs compared toadjacent even carbon chains (Table S2 in the SI). Such apattern has often been associated with the marine food web(see PFAA concentrations section above), which is inaccordance with the fact that the Norwegian otters originatedfrom a marine environment. As for the PFSAs and FOSA,
PFOS dominated in otters from Sweden (95−98%) as well asin otters from Norway (86%). Other PFSAs contributed with1−3%. FOSA contributed with 11% in otters from Norway tothe sum of PFSAs plus FOSA, and to a lesser extent in Swedishsamples (Figure S2 in the SI).Significant concentration differences between the three
regions were found for PFOA (p < 0.01), PFNA (p < 0.008),PFDA (p < 0.001), PFTeDA (p < 0.004), PFOS (p < 0.001),and FOSA (p < 0.008). Median values of PFOA, PFTeDA, andFOSA in otters from Norway were higher compared to those inotters from the two areas in Sweden (Figure 1). The medianconcentration of PFOA in otters from Norway was 14 ng/gww, compared to 9.0 and 5.3 ng/g ww in otters from southernand northern Sweden, respectively. However, the PFOAconcentration ranges were larger in Sweden, especially in thenorth (Table S2 in the SI). The median concentrations ofPFTeDA (2.5 ng/g ww in Norway, 1.2 and 0.9 ng/g ww insouthern and northern Sweden, respectively) and the medianlevels of FOSA (25 ng/g ww in Norway, 8.6 and 12 ng/g ww insouthern and northern Sweden, respectively) were twice tothree times as high in otters from Norway compared toSweden. Otters from southern Sweden had higher medianconcentrations of PFNA (86 ng/g ww) and PFDA (71 ng/gww) compared to otters from the other two areas (Table S2 inthe SI).The median concentration of PFOS in otters from southern
Sweden (803 ng/g ww) was significantly higher than that in
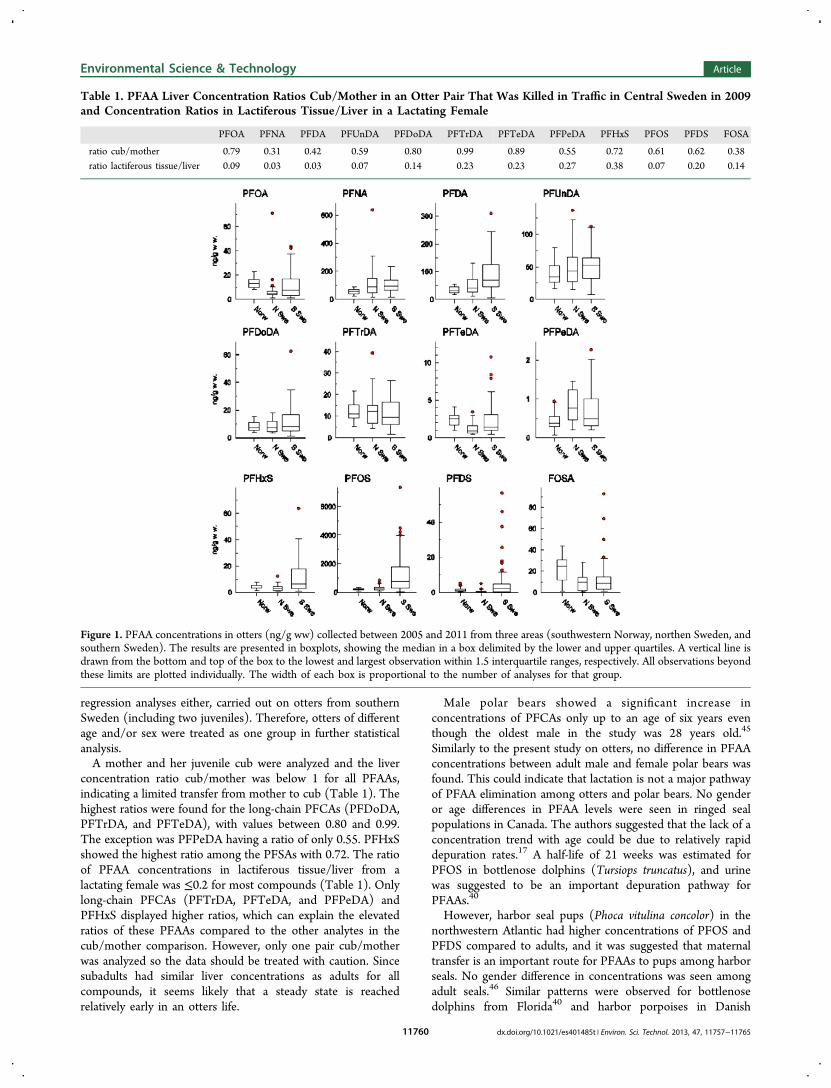
Figure 2. Time trends of PFAA concentrations (ng/g ww) in livers from otters from southern Sweden collected between 1972 and 2011. Red circlesrepresent annual geometric means. Black solid lines show the results of linear regression on log-transformed annual means for PFAAs displayingsignificantly increasing levels, and red solid lines show the results from the last 10 years, if the linear regression analysis was significant. Some extremeindividual values are outside the ranges of the graphs.
Environmental Science & Technology Article
dx.doi.org/10.1021/es401485t | Environ. Sci. Technol. 2013, 47, 11757−1176511761

otters from northern Sweden (266 ng/g ww) and Norway (201ng/g ww). A similar geographical pattern was seen in fish from27 Swedish lakes, where the highest concentrations of PFOSwere found in fish from Southern Sweden.23 No significantdifference between concentrations of PFOS in otters fromnorthern Sweden and Norway was observed, although somevery high (up to 3660 ng/g ww) concentrations were alsofound in otters from northern Sweden, but not in Norway.Since southern Sweden is the most densely populated of the
three regions, it could be expected that otters from southernSweden would have the highest concentrations of all PFAAs,but this was not the case. An explanation might be that manyotters from this area feed in eutrophic lakes, which might have alower contaminant burden in the fish compared to the otherareas, due to dilution effects.47 However, the ranges in PFAAconcentrations were large. Some otters showed very highconcentrations of PFOS, whereas other otters found nearbymight have low concentrations. This is an indication for locallyconfined contamination hot spots (such as e.g. firefightingtraining sites), which make it difficult to find plausibleexplanations for the observed spatial trends. Nevertheless, ageneral tendency among the PFCA homologue series wasobserved, with significant concentration differences betweenthe regions for PFOA to PFDA, and a quite homogeneousdistribution of the longer chain compounds PFUnDA toPFPeDA (with the exception of PFTeDA). This indicates thatdirect sources and waterborne transport may be moreimportant for spatial contamination patterns of PFOA toPFDA (as well as PFOS), whereas indirect atmospheric long-range transport via precursor compounds (such as fluoro-telomer alcohols) may lead to a more uniform distribution oflonger chain homologues throughout Scandinavia.Time Trends. PFPeDA was excluded from statistical
temporal trend analysis due to high proportion of nondetectsin the corresponding sample set. The other analytes were aboveMDL in >75% (PFTeDA) or even >87% (all other PFAAs) ofthe samples. The temporal trend analyses of PFAAconcentrations in otters from southern Sweden revealed asignificant increase between 1972 and 2011 for 9 of the 11investigated compounds: PFOA, PFNA, PFDA, PFUnDA,PFDoDA, PFTrDA, PFTeDA, PFOS, and PFDS (Figure 2 andTable 2). The statistical power of the time trends is given in SITable S3. The yearly increase for the different PFAAs was in
the range 5.5−13%, resulting in doubling times for the wholetime series between 5.5 and 13 years (Table 2). Fourcompounds were only analyzed in 41 out of the 97 temporaltrend samples (PFNA, PFTeDA, PFHxS, and FOSA). Thislower sample number affected the power to detect trendssubstantially. Of these PFAAs only PFNA and PFTeDAshowed a significant increase over time. Although the meanconcentrations of PFHxS were higher during the last years ofthe time trend compared to earlier, the range was large and nostatistically significant time trend for PFHxS was seen.When looking only at the last 10 years of the time trend
(2002−2011), the PFCAs still showed increasing trends andmost PFCAs (with the exception of PFUnDA and PFTrDA)increased even at a faster rate during recent years compared tothe whole study period (Figure 2 and Table 2). We have noindication of a change in the otter’s diet during this time thatcould explain the increasing concentrations. No significantupward or downward trend of any of the PFSAs was detectedbetween 2002 and 2011 (Table 2). This might be due to acombination of the production phase-out of the long chainPFSAs by the 3M Company in 2002 and their extraordinaryenvironmental persistence.The proportion of PFOA in relation to the sum of all PFCAs
decreased from 25% in the 1970s to 5% in the 2000s (Figure3). This means that the temporal increase in concentrationswas not as steep for PFOA as it was for the longer chainPFCAs, which can also be seen from the slopes and doublingtimes given in Table 2. This could be due to differences inelimination half-lives between PFOA and longer chain PFCAs,or due to differences in exposure sources and/or pathways.During the whole study period, PFOS was the dominant PFSA.The relative contribution of FOSA to the sum of PFSAs was15−30% in the beginning of the study period and decreased toless than 5% in the end of the study period (Figure 3).However, this finding should be interpreted with caution due tothe low number of available samples from early years. Theproportions of the other PFSAs were below 5%.Most PFAA temporal trend studies have so far been
conducted on humans or wildlife from marine areas. Decreasingtrends for some PFAAs such as PFOA and PFOS were oftenreported starting from the beginning of the 2000s.48−50 Thisapplies also to temporal trends from Sweden, such as forhuman serum51 as well as Baltic gray seals26 and guillemots.52
Table 2. Results from Log-Linear Regression Analysis of PFAAs in Otters from Southern Sweden Collected Between 1972 and2011a
1972−2011 2002−2011
n slope (95% CI) r2 sign. leveldoubling time (yr)
(95% CI) n Slope (95% CI) r2 sign. leveldoubling time (yr)
(95% CI)
PFOA 97 5.8% (3.4−8.3) 0.69 p < 0.001 12 (8.4−20) 76 12% (7.2−17) 0.81 p < 0.001 5.8 (4.2−9.7)PFNA 41 5.7% (0.57−11) 0.70 p < 0.037 12 (6.4−121) 36 10% (4.0−16) 0.90 p < 0.017 6.8 (4.2−18)PFDA 97 13% (11−14) 0.96 p < 0.001 5.5 (4.9−6.3) 76 14% (9.9−17) 0.90 p < 0.001 5.1 (4.0−7.1)PFUnDA 97 11% (9.9−13) 0.95 p < 0.001 6.1 (7.1−5.3) 76 7.1% (4.5−9.7) 0.83 p < 0.001 9.8 (7.2−15)PFDoDA 97 11% (9.4−13) 0.94 p < 0.001 6.3 (5.4−7.4) 76 15% (12−18) 0.95 p < 0.001 4.6 (3.8−5.6)PFTrDA 97 11% (8.3−13) 0.89 p < 0.001 6.6 (5.4−8.4) 76 4.1% (0.13−8.1) 0.42 p < 0.043 17 (8.6−516)PFTeDA 41 7.8% (0.8−15) 0.70 p < 0.038 8.9 (4.7−90) 36 27% (21−32) 0.99 p < 0.003 2.6 (2.2−3.4)PFHxS 41 ns ns ns ns 36 ns ns ns nsPFOS 97 5.5% (2.5−8.6) 0.57 p < 0.002 13 (8.1−28) 76 ns ns ns nsPFDS 97 8.6% (4.0−13) 0.58 p < 0.002 8.1 (5.3−17) 76 ns ns ns nsFOSA 41 ns ns ns ns 36 ns ns ns ns
aNumber of individuals (n), slope and 95% confidence interval (CI), r2, significance level and doubling time (with 95% CI) are shown for the wholetime period (left) as well as for the last 10 years only (right). ns = not statistically significant.
Environmental Science & Technology Article
dx.doi.org/10.1021/es401485t | Environ. Sci. Technol. 2013, 47, 11757−1176511762

In the otters of the present study, however, all significant trends(including PFOA and PFOS) point upward. The reason for thisdiscrepancy is not known. It could possibly be due to anextraordinary long elimination half-life of PFAAs in otters. Thiswould explain both the potential to accumulate very high levelsof PFOS as well as the continuously increasing trends of PFOAand PFOS despite potentially decreasing trends or unchangedconcentrations in the otter’s environment and diet. However,there was no correlation with age among the otters in thisstudy. Concentrations of PFOS in guillemot eggs collectedannually since 1968 showed an increasing trend up to 2011.52
However, when only looking at the last 10 years a decreasingtrend is observed, which is not observed in the otters of thepresent study. Time trends in Swedish freshwater fish (1980−2011) from two lakes, one from the north and one from thesouth of Sweden, show similar patterns. PFOS increased up toyear 2000 in arctic char in the north and perch from the south.Thereafter no clear trend is seen in arctic char but asignificantly decreasing trend over the last 10 years wasdetected in perch.23
Terrestrial and also limnic animals, such as the Swedishotters in the present study, are mainly exposed to airbornepollutants and contamination from land-based point sources,whereas marine animals live in an environment that alsoaccumulates pollutants transported via water currents. There-fore, differences in time trends in terrestrial or limnic species ascompared to marine biota could be expected. However, a studybased on eggs from peregrine falcon collected in Swedenbetween 1974 and 200741 showed a different pattern comparedto our study. The concentrations of PFOS and PFHxSincreased initially during the study period but started levelingoff already after the mid-1980s. Also in a study on roe deers(Capreolus capreolus) from Germany decreasing trends ofPFAAs were detected in recent years. The sum PFAAconcentration decreased from 11.2 μg/kg in 2000 to 4.2 μg/kg in 2010, which was primarily a reflection of decreasing PFOSconcentrations.53 Why the concentrations of PFOS do not
decrease in otters from the present study and why ottersaccumulate such high levels of PFOS is not known but it is ofgreat concern. Furthermore, also the fact that the concen-trations of most PFCAs are still increasing (at a faster rate thanbefore 2000) is alarming. From the results of the present study,negative effects from PFAA contamination on the Scandinavianotter populations cannot be ruled out. Regulatory action to stopfuture emissions of PFAAs and their precursor compounds tothe environment is urgently needed. Additionally, furtherstudies should investigate patterns and levels of PFAAs in thefeed of otters as well as PFAA toxicokinetics within otters, inorder to shed light on the unique exposure that these animalsare experiencing.
■ ASSOCIATED CONTENT*S Supporting InformationAdditional information as noted in the text. This material isavailable free of charge via the Internet at http://pubs.acs.org.
■ AUTHOR INFORMATIONCorresponding Author*Phone +46 8 5195 4223; fax +46 8 5195 4256; e-mail [email protected] authors declare no competing financial interest.
■ ACKNOWLEDGMENTSWe thank the numerous individuals and the police forcollecting otter carcasses. Anne-Sofie Karsrud, Anna-LenaEgeback, Marko Filipovic, and Tomas Alsberg are acknowl-edged for help with chemical analysis and Jan Orberg has givenvaluable comments on the manuscript. We also want to thankthe Swedish EPA, the county boards of Sodermanland andUppland (Sweden), and the Norwegian Directorate for NatureManagement for fundings.
■ REFERENCES(1) Kissa, E. Fluorinated Surfactants and Repellents; Marcel Dekker:New York, 2001.(2) Herzke, D.; Olsson, E.; Posner, S. Perfluoroalkyl andpolyfluoroalkyl substances (PFASs) in consumer products in Nor-wayA pilot study. Chemosphere 2012, 88 (8), 980−987.(3) Buck, R. C.; Franklin, J.; Berger, U.; Conder, J. M.; Cousins, I. T.;de Voogt, P.; Jensen, A. A.; Kannan, K.; Mabury, S. A.; van Leeuwen,S. P. J. Perfluoroalkyl and polyfluoroalkyl substances in theenvironment: Terminology, classification, and origins. Integr. Environ.Assess. Manage. 2011, 7 (4), 513−541.(4) 3M Phase-out plan for POSF-based products, 2000.(5) Paul, A. G.; Jones, K. C.; Sweetman, A. J. A first globalproduction, emission, and environmental inventory for perfluorooc-tane sulfonate. Environ. Sci. Technol. 2008, 43 (2), 386−392.(6) Seacat, A. M.; Thomford, P. J.; Hansen, K. J.; Clemen, L. A.;Eldridge, S. R.; Elcombe, C. R.; Butenhoff, J. L. Sub-chronic dietarytoxicity of potassium perfluorooctanesulfonate in rats. Toxicology 2003,183 (1−3), 117−131.(7) Kennedy, G. L.; Butenhoff, J. L.; Olsen, G. W.; O’Connor, J. C.;Seacat, A. M.; Perkins, R. G.; Biegel, L. B.; Murphy, S. R.; Farrar, D. G.The toxicology of perfluorooctanoate. Crit. Rev. Toxicol. 2004, 34 (4),351−384.(8) Cui, L.; Zhou, Q.-F.; Liao, C.-Y.; Fu, J.-J.; Jiang, G.-B. Studies onthe toxicological effects of PFOA and PFOS on rats using histologicalobservation and chemical analysis. Arch. Environ. Contam. Toxicol.2009, 56 (2), 338−349.(9) Johansson, N.; Fredriksson, A.; Eriksson, P. Neonatal exposure toperfluorooctane sulfonate (PFOS) and perfluorooctanoic acid
Figure 3. PFCA patterns (top) and PFSA patterns (bottom) in ottersfrom three decades, 1970s, 1990s, and 2000s.
Environmental Science & Technology Article
dx.doi.org/10.1021/es401485t | Environ. Sci. Technol. 2013, 47, 11757−1176511763
(PFOA) causes neurobehavioural defects in adult mice. Neuro-Toxicology 2008, 29 (1), 160−169.(10) Lau, C.; Thibodeaux, J. R.; Hanson, R. G.; Narotsky, M. G.;Rogers, J. M.; Lindstrom, A. B.; Strynar, M. J. Effects ofperfluorooctanoic acid exposure during pregnancy in the mouse.Toxicol. Sci. 2006, 90 (2), 510−518.(11) Seacat, A. M.; Thomford, P. J.; Thomford, P. J.; Hansen, K. J.;Olsen, G. W.; Case, M. T.; Butenhoff, J. L. Subchronic toxicity studieson perfluorooctanesulfonate potassium salt in cynomolgus monkeys.Toxicol. Sci. 2002, 68 (1), 249−264.(12) Jensen, A. A.; Leffers, H. Emerging endocrine disrupters:Perfluoroalkylated substances. Int. J. Androl. 2008, 31 (2), 161−169.(13) Kannan, K.; Perrotta, E.; Thomas, N. J. Association betweenperfluorinated compounds and pathological conditions in southern seaotters. Environ. Sci. Technol. 2006, 40 (16), 4943−4948.(14) Kannan, K.; Corsolini, S.; Falandysz, J.; Oehme, G.; Focardi, S.;Giesy, J. P. Perfluorooctanesulfonate and related fluorinated hydro-carbons in marine mammals, fishes, and birds from coasts of the Balticand the Mediterranean Seas. Environ. Sci. Technol. 2002, 36 (15),3210−3216.(15) Kannan, K.; Newsted, J.; Halbrook, R. S.; Giesy, J. P.Perfluorooctanesulfonate and related fluorinated hydrocarbons inmink and river otters from the United States. Environ. Sci. Technol.2002, 36 (12), 2566−2571.(16) Giesy, J. P.; Kannan, K. Global distribution of perfluorooctanesulfonate in wildlife. Environ. Sci. Technol. 2001, 35 (7), 1339−1342.(17) Butt, C. M.; Mabury, S. A.; Kwan, M.; Wang, X.; Muir, D. C. G.Spatial trends of perfluoroalkyl compounds in ringed seals (Phocahispida) from the Canadian Arctic. Environ. Toxicol. Chem. 2008, 27(3), 542−553.(18) Conder, J. M.; Hoke, R. A.; Wolf, W. d.; Russell, M. H.; Buck, R.C. Are PFCAs bioaccumulative? A critical review and comparison withregulatory criteria and persistent lipophilic compounds. Environ. Sci.Technol. 2008, 42 (4), 995−1003.(19) Jones, P. D.; Hu, W.; De Coen, W.; Newsted, J. L.; Giesy, J. P.Binding of perfluorinated fatty acids to serum proteins. Environ.Toxicol. Chem. 2003, 22 (11), 2639−2649.(20) Norden, M.; Berger, U.; Engwall, M. High levels ofperfluoroalkyl acids in eggs and embryo livers of great cormorant(Phalacrocorax carbo sinensis) and herring gull (Larus argentatus) fromLake Vanern, Sweden. Environ. Sci. Pollut. Res. 2013, DOI: 10.1007/s11356-013-1567-3.(21) Roos, A.; Greyerz, E.; Olsson, M.; Sandegren, F. The otter(Lutra lutra) in Sweden population trends in relation to ΣDDTand total PCB concentrations during 1968−99. Environ. Pollut. 2001,111 (3), 457−469.(22) Bignert, A.; Danielsson, S.; Faxneld, S.; Nyberg, E.; Berger, U.;Borg, H.; Eriksson, U.; Holm, K.; Nylund, K.; Haglund, P. CommentsConcearning the National Swedish Contaminant Monitoring Programme,2012; p 224.(23) Nyberg, E.; Faxneld, S.; Danielsson, S.; Bignert, A.; Eriksson, U.;Holm, K.; Borg, H.; Berger, U.; Haglund, P. The National SwedishContaminant Monitoring programme for Freshwater Biota, 2012, 2012; p214.(24) Roos, A. M.; Backlin, B.-M. V. M; Helander, B. O.; Riget, F. F.;Eriksson, U. C. Improved reproductive success in otters (Lutra lutra),grey seals (Halichoerus grypus) and sea eagles (Haliaeetus albicilla)from Sweden in relation to concentrations of organochlorinecontaminants. Environ. Pollut. 2012, 170 (0), 268−275.(25) Holmstrom, K. E.; Jarnberg, U.; Bignert, A. Temporal Trends ofPFOS and PFOA in Guillemot Eggs from the Baltic Sea, 1968−2003.Environ. Sci. Technol. 2004, 39 (1), 80−84.(26) Kratzer, J.; Ahrens, L.; Roos, A.; Backlin, B.-M.; Ebinghaus, R.Temporal trends of polyfluoroalkyl compounds (PFCs) in liver tissueof grey seals (Halichoerus grypus) from the Baltic Sea, 1974−2008.Chemosphere 2011, 84 (11), 1592−1600.(27) Dietz, R.; Bossi, R.; Riget, F. F.; Sonne, C.; Born, E. W.Increasing perfluoroalkyl contaminants in East Greenland Polar Bears
(Ursus maritimus): A new toxic threat to the Arctic Bears. Environ. Sci.Technol. 2008, 42 (7), 2701−2707.(28) Tomy, G. T.; Budakowski, W.; Halldorson, T.; Helm, P. A.;Stern, G. A.; Friesen, K.; Pepper, K.; Tittlemier, S. A.; Fisk, A, T.Fluorinated organic compounds in an Eastern Arctic marine food web.Environ. Sci. Technol. 2004, 38 (24), 6475−6481.(29) Smithwick, M.; Norstrom, R. J.; Mabury, S. A.; Solomon, K.;Evans, T. J.; Stirling, I.; Taylor, M. K.; Muir, D. C. G. Temporal trendsof perfluoroalkyl contaminants in Polar Bears (Ursus maritimus) fromtwo locations in the North American Arctic, 1972−2002. Environ. Sci.Technol. 2006, 40 (4), 1139−1143.(30) Schiavone, A.; Corsolini, S.; Kannan, K.; Tao, L.; Trivelpiece,W.; Torres, D., Jr; Focardi, S. Perfluorinated contaminants in fur sealpups and penguin eggs from South Shetland, Antarctica. Sci. Tot.Environ. 2009, 407 (12), 3899−3904.(31) Mason, C. F.; Madsen, A. B. Mercury in Danish otters (Lutralutra). Chemosphere 1992, 25 (6), 865−867.(32) Ylinen, M.; Hanhijarvi, H.; Peura, P.; Ramo, O. Quantitative gaschromatographic determination of perfluorooctanoic acid as the benzylester in plasma and urine. Arch. Environ. Contam. Toxicol. 1985, 14 (6),713−717.(33) Hansen, K. J.; Clemen, L. A.; Ellefson, M. E.; Johnson, H. O.Compound-specific, quantitative characterization of organic fluoro-chemicals in biological matrices. Environ. Sci. Technol. 2001, 35 (4),766−770.(34) Berger, U.; Glynn, A.; Holmstrom, K. E.; Berglund, M.;Ankarberg, E. H.; Tornkvist, A. Fish consumption as a source ofhuman exposure to perfluorinated alkyl substances in SwedenAnalysis of edible fish from Lake Vattern and the Baltic Sea.Chemosphere 2009, 76 (6), 799−804.(35) Holmstrom, K. E.; Berger, U. Tissue distribution ofperfluorinated surfactants in common guillemot (Uria aalge) fromthe Baltic Sea. Environ. Sci. Technol. 2008, 42 (16), 5879−5884.(36) van Leeuwen, S. P. J.; Swart, C. P.; van der Veen, I.; de Boer, J.Significant improvements in the analysis of perfluorinated compoundsin water and fish: Results from an interlaboratory method evaluationstudy. J. Chromatogr. A 2009, 1216 (3), 401−409.(37) Loftis, J. C.; Ward, R. C.; Phillips, R. D. An Evaluation of TrendDetection Techniques for Use in Water Quality Monitoring Programs; U.S.Environmental Protection Agency, 1989(38) Helsel, D. Nondetects and Data Analysis: Statistics for CensoredEnvironmental Data; New York, 2005.(39) Butt, C. M.; Berger, U.; Bossi, R.; Tomy, G. T. Levels and trendsof poly- and perfluorinated compounds in the arctic environment. Sci.Tot. Environ. 2010, 408 (15), 2936−2965.(40) Houde, M.; Balmer, B. C.; Brandsma, S.; Wells, R. S.; Rowles, T.K.; Solomon, K. R.; Muir, D. C. G. Perfluoroalkyl compounds inrelation to life-history and reproductive parameters in bottlenosedolphins (Tursiops truncatus) from Sarasota Bay, Florida, USA.Environ. Toxicol. Chem. 2006, 25 (9), 2405−2412.(41) Holmstrom, K. E.; Johansson, A.-K.; Bignert, A.; Lindberg, P.;Berger, U. Temporal trends of perfluorinated surfactants in SwedishPeregrine Falcon Eggs (Falco peregrinus), 1974−2007. Environ. Sci.Technol. 2010, 44 (11), 4083−4088.(42) Dietz, R.; Riget, F. F.; Galatius, A.; Sonne, C.; Teilmann, J.;Bossi, R. Spatial trends of perfluorochemicals in harbor seals (Phocavitulina) from Danish waters. Sci. Total Environ. 2012, 414 (0), 732−737.(43) Galatius, A.; Dietz, R.; Riget, F. F.; Sonne, C.; Kinze, C. C.;Lockyer, C.; Bossi, R. Temporal and life history related trends ofperfluorochemicals in harbor porpoises from the Danish North Sea.Mar. Pollut. Bull. 2011, 62 (7), 1476−1483.(44) Martin, J. W.; Smithwick, M. M.; Braune, B. M.; Hoekstra, P. F.;Muir, D. C. G.; Mabury, S. A. Identification of long-chainperfluorinated acids in biota from the Canadian Arctic. Environ. Sci.Technol. 2003, 38 (2), 373−380.(45) Smithwick, M.; Mabury, S. A.; Solomon, K. R.; Sonne, C.;Martin, J. W.; Born, E. W.; Dietz, R.; Derocher, A. E.; Letcher, R. J.;Evans, T. J.; Gabrielsen, G. W.; Nagy, J.; Stirling, I.; Taylor, M. K.;
Environmental Science & Technology Article
dx.doi.org/10.1021/es401485t | Environ. Sci. Technol. 2013, 47, 11757−1176511764

Muir, D. C. G. Circumpolar study of perfluoroalkyl contaminants inPolar Bears (Ursus maritimus). Environ. Sci. Technol. 2005, 39 (15),5517−5523.(46) Shaw, S.; Berger, M. L.; Brenner, D.; Tao, L.; Wu, Q.; Kannan,K. Specific accumulation of perfluorochemicals in harbor seals (Phocavitulina concolor) from the northwest Atlantic. Chemosphere 2009, 74(8), 1037−1043.(47) Skei, J.; Larsson, P.; Rosenberg, R.; Jonsson, P.; Olsson, M.;Broman, D. Eutrophication and contaminants in aquatic ecosystems.Ambio 2000, 29 (4/5), 184−194.(48) Ahrens, L.; Siebert, U.; Ebinghaus, R. Temporal trends ofpolyfluoroalkyl compounds in harbor seals (Phoca vitulina) from theGerman Bight, 1999−2008. Chemosphere 2009, 76 (2), 151−158.(49) Butt, C. M.; Muir, D. C. G.; Stirling, I.; Kwan, M.; Mabury, S. A.Rapid response of arctic ringed seals to changes in perfluoroalkylproduction. Environ. Sci. Technol. 2006, 41 (1), 42−49.(50) Hart, K.; Gill, V.; Kannan, K. Temporal Trends (1992−2007) ofperfluorinated chemicals in northern sea otters (Enhydra lutris kenyoni)from South-Central Alaska. Arch. Environ. Contam. Toxicol. 2009, 56(3), 607−614.(51) Glynn, A.; Berger, U.; Bignert, A.; Ullah, S.; Aune, M.; Lignell,S.; Darnerud, P. O. Perfluorinated alkyl acids in blood serum fromprimiparous women in Sweden: Serial sampling during pregnancy andnursing, and temporal trends 1996−2010. Environ. Sci. Technol. 2012,46 (16), 9071−9079.(52) Bignert, A.; Danielsson, S.; Faxneld, S.; Nyberg, E.; Berger, U.;Borg, H.; Eriksson, U.; Holm, K.; Nylund, K.; Haglund, P. Commentsconcearning the national Swedish contaminant monitoring programmein marine biota, 2013. Report to EPA 2013, No. 1, 259.(53) Falk, S.; Brunn, H.; Schroter-Kermani, C.; Failing, K.; Georgii,S.; Tarricone, K.; Stahl, T. Temporal and spatial trends ofperfluoroalkyl substances in liver of roe deer (Capreolus capreolus).Environ. Pollut. 2012, 171, 1−8.
Environmental Science & Technology Article
dx.doi.org/10.1021/es401485t | Environ. Sci. Technol. 2013, 47, 11757−1176511765