perfluoroalkyl substances in the blood of wild rats and ... · perfluoroalkyl substances in the...
TRANSCRIPT

Perfluoroalkyl Substances in the Blood of Wild Rats and Micefrom 47 Prefectures in Japan: Use of Samples from NationwideSpecimen Bank
Sachi Taniyasu • Kurunthachalam Senthilkumar • Eriko Yamazaki •
Leo W. Y. Yeung • Keerthi S. Guruge • Kurunthachalam Kannan •
Nobuyoshi Yamashita
Received: 20 September 2012 / Accepted: 29 January 2013 / Published online: 14 March 2013
� Springer Science+Business Media New York 2013
Abstract Numerous studies have reported on the global
distribution, persistence, fate, and toxicity of perfluoroalkyl
and polyfluoroalkyl substances (PFASs). However, studies
on PFASs in terrestrial mammals are scarce. Rats can be
good sentinels of human exposure to toxicants because of
their habitat, which is in close proximity to humans. Fur-
thermore, exposure data measured for rats can be directly
applied for risk assessment because many toxicological
studies use rodent models. In this study, a nationwide survey
of PFASs in the blood of wild rats as well as surface water
samples collected from rats’ habitats from 47 prefectures in
Japan was conducted. In addition to known PFASs, com-
bustion ion chromatography technique was used for analysis
of total fluorine concentrations in the blood of rats. In total,
216 blood samples representing three species of wild rats
(house rat, Norway rats, and field mice) were analyzed
for 23 PFASs. Perfluorooctanesulfonate (PFOS; concentra-
tion range \0.05-148 ng/mL), perfluorooctane sulfonamide
(PFOSA; \0.1–157), perfluorododecanoate (\0.05–5.8),
perfluoroundecanoate (PFUnDA; \0.05–51), perfluorode-
canoate (PFDA; \0.05–9.7), perfluorononanoate (PFNA;
\0.05–249), and perfluorooctanoate (PFOA) (\0.05–60)
were detected[80 % of the blood samples. Concentrations
of several PFASs in rat blood were similar to those reported
for humans. PFSAs (mainly PFOS) accounted for 45 % of
total PFASs, whereas perfluoroalkyl carboxylates (PFCAs),
especially PFUnDA and PFNA, accounted for 20 and 10 %
of total PFASs, respectively. In water samples, PFCAs were
the predominant compounds with PFOA and PFNA found in
[90 % of the samples. There were strong correlations
(p \ 0.001 to p \ 0.05) between human population density
and levels of PFOS, PFNA, PFOA, and PFOSA in wild rat
blood.
Perfluoroalkyl and polyfluoroalkyl substances (PFASs) are
synthetic organic compounds used in a variety of industrial
and commercial applications, as surfactants in pesticides,
and as surface protectors in textiles, furnishings, and food
packaging (Giesy and Kannan 2001). PFASs were first
reported in wildlife in 2001 (Giesy and Kannan 2001);
since then, PFASs have been widely studied in surface
waters (Yamashita et al. 2005; Nakata et al. 2006; Senthil
Kumar et al. 2007; So et al. 2007; Raj et al. 2011), sedi-
ments (Higgins et al. 2005; Nakata et al. 2006; Ahrens
et al. 2010), biota (Houde et al. 2006; Senthil Kumar et al.
2007; Yeung et al. 2009a; Yamashita et al. 2012), and
humans (Kannan et al. 2004; Kannan 2011).
Perfluorooctanesulfonate (PFOS) and perfluorooctano-
ate (PFOA) have been the most studied chemicals due to
S. Taniyasu � E. Yamazaki � N. Yamashita (&)
National Institute of Advanced Industrial Science and
Technology (AIST), Ibaraki 305-8569, Japan
e-mail: [email protected]
K. Senthilkumar (&)
Department of Natural Sciences, Savannah State University,
Savannah, GA 31404, USA
e-mail: [email protected]
L. W. Y. Yeung
Department of Chemistry, University of Toronto, Toronto, ON
M5S 3H6, Canada
K. S. Guruge
Safety Research Team, National Institute of Animal Health,
Tsukuba, Ibaraki 305-0856, Japan
K. Kannan
Wadsworth Center, New York State Department of Health and
Department of Environmental Health Sciences, State University
of New York, Albany, NY 12201-0509, USA
123
Arch Environ Contam Toxicol (2013) 65:149–170
DOI 10.1007/s00244-013-9878-4
their widespread occurrence and potential toxic effects
(Seacat et al. 2002; Oakes et al. 2005; Senthil Kumar 2005;
Liu et al. 2012). Both of these chemicals have been shown
to have various effects on developmental, reproduction,
and immune functions in laboratory animals (Abbott et al.
2007; Fairley et al. 2007; Lau et al. 2007; Keil et al. 2008;
Liu et al. 2012). Concerns about the toxicity led to the
phasing out of PFOS production in the United States and
the European Union by some manufacturers in 2002, but
the phasing out of PFOA will not be completed until 2015
(http://www2.dupont.com/PFOA/en_US/). Therefore, PFOA
may still be produced in other parts of the world, including
China (UNEP United Nations Environment Programme
[UNEP] 2008). PFOS and its precursor, perfluorooctane
sulfonyl fluoride (PFOSF), were listed as restricted use
chemicals (Annex B) under the Stockholm Convention in
May 2009 (Wang et al. 2009), and this restriction was entered
into force in August 2010. In Japan, according to the Japa-
nese Chemical Substance Control Law (http://www.safe.
nite.go.jp/english/), PFOS and PFOSF were listed as Class I
Specified Chemical Substances in April 2010.
The first report on PFASs in Japanese environment was
published in 2003 (Taniyasu et al. 2003), and subsequent
monitoring reports investigated PFASs in different envi-
ronmental matrices (Kannan et al. 2002; Nakata et al. 2006;
Senthil Kumar et al. 2007; Harada et al. 2007; Guruge et al.
2008; Murakami et al. 2008; Murakami and Takada 2008;
Taniyasu et al. 2008; Harada and Koizumi 2009; Mak et al.
2009; Zushi et al. 2010). However, most wildlife bio-
monitoring data on PFASs in the world focused mainly on
aquatic biota, such as fish (Kannan et al. 2005), water birds
(Wang et al. 2008), and marine mammals (Yeung et al.
2009a). Very few studies have reported PFASs in terrestrial
wildlife (Dai et al. 2006; Senthil Kumar et al. 2007; Guruge
et al. 2008; Li et al. 2008).
Wild rat (Rattus spp. and Apodemus spp.) is a good
indicator of human exposure to environmental chemicals
because they live in proximity to humans (Takasuga et al.
2004; Senthil Kumar et al. 2005a). They feed on human
refuse from the garbage and drink water from drains and
water bodies. Rats have a life span of 1–2 years and have
short home ranges (approximately 100 m2) suggesting
that they could be used as ‘‘sentinels’’ for the detection of
local pollution in terrestrial environments (Scott 1966;
Ceruti et al. 2002; Takasuga et al. 2004; Senthil Kumar
et al. 2005a; Ishizuka et al. 2005). In this study, we report
geographical distribution of PFASs and total fluorine (TF)
concentrations in wild rat blood samples collected in 47
prefectures in Japan. Second, the relationship between
PFAS concentrations in wild rats with those in water
collected near their habitat was examined. To our
knowledge, this is the first report to document the use of
wild rats as sentinels of water contamination by PFASs.
Furthermore, we document the use of samples from a
wild rat specimen bank for the analysis of PFASs and TF
in Japan.
Materials and Methods
Sample Collection
A nationwide collection of wild rats in all 47 prefectures in
Japan started in June 2004 and was completed in December
2009. For this study, three species of wild rats (Norway rat
[Rattus norvegicus], House rat [R. rattus], and Japanese
field mouse [Apodemus specious]) were collected. Samples
were collected from two distinct geographical locations,
one in a densely populated area (i.e., industrial, commercial,
residential areas) and another in a remote area (i.e., country
side or nature reserve), in each prefecture. Approximately
five specimens were collected from each location, and the
number of specimens collected for each prefecture was
between 15 and 20. Overall, 700 specimens from all 47
prefectures in Japan were collected during a 6-year period.
The specimens were archived at Advanced Industrial Sci-
ence and Technology (Tsukuba, Japan) to evaluate potential
risks of hazardous chemicals to humans and wildlife.
The rats and mice were collected using box traps and
then transported to the laboratory alive. In the laboratory,
using a PFAS-free syringe, blood was drawn from the tail
vein and fresh livers removed immediately after cerebral
dislocation. After biometric measurements, whole body,
blood, and liver were frozen at -20 �C until analysis.
PFAS-free polypropylene (PP) tubes and containers were
used for the storage of samples. From the specimen bank,
216 specimens were selected for PFAS analysis. The
details of the samples are listed in Table 1. Water samples
(500 mL in PP bottles) were collected simultaneously from
62 locations near the nesting places of rats. All the water
samples were stored at –20 �C until analysis. The details of
water sampling are also listed in Table 1.
Chemicals and Reagents
Purities of all of analytical standards used in this study
were C 95 %. Potassium salts of perfluorodecane sulfonate
(PFDS), PFOS, perfluorohexane sulfonate (PFHxS), perfluo-
rooctane sulfonamide (PFOSA), perfluorononanoate (PFNA),
PFOA 13C4-PFOS 13C2-perfluorodecanoate (PFDA), perflu-
orodecanesulfinic acid (PFDSi), perfluorooctanesulfinic acid
(PFOSi), perfluorohexanesulfinic acid (PFHxSi) 13C5-PFNA,13C4-PFOA, and 13C4-perfluorobutanoate (PFBA) were pur-
chased from Wellington Laboratories (Guelph, Ontario,
Canada). N-ethyl perfluorooctanesulfonamide (N-EtFOSA)
and N-ethyl perfluorooctanesulfonamidacetate (N-EtFOSAA)
150 Arch Environ Contam Toxicol (2013) 65:149–170
123

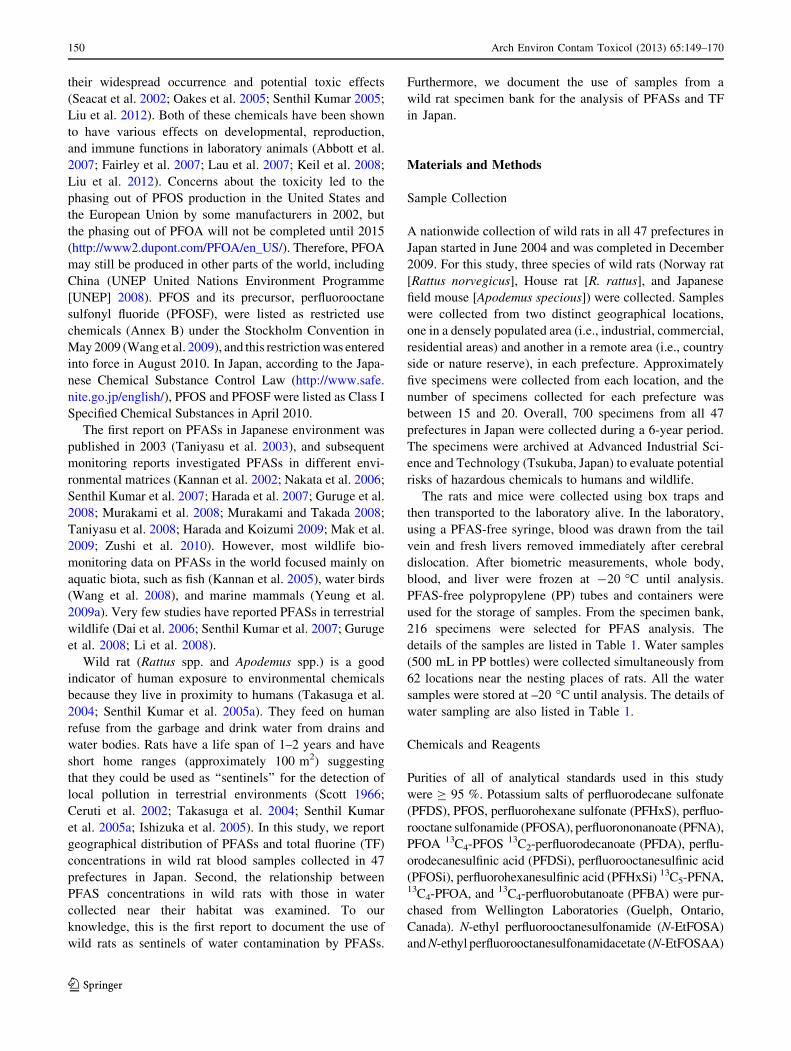
Table 1 Details of wild rat and water samples analyzed in this study
Region Prefecture City/town Sample code Date Description of sampling location Possible water sources to wild rat
Hokkaido Hokkaido Tomakomai HK1 Oct 05 River basin River
Sapporo HK2 Sep 06 River basin River
Yoichi HK3 May 06 River basin River
Tohoku Aomori Aomori AM1 Sep 06 Port Sump
Hachinohe AM2 Nov 05 Port Tap water
Iwate Kitakami IT2 Oct 06 Industrial area Channel
Shizukuishi IT3 Oct 06 River basin Channel
Akita Akita AT1 Nov 06 Forest Agricultural channel
Yamagata Yamagata YG2 Nov 06 River basin River
Miyagi Ishinomaki MG1 Jun 06 Port Channel
Fukushima Iwaki FS1 Mar 06 Port No corresponding water sample
Kanto Gunma Shibukawa GM1 May 07 River basin River
Tochigi Utsunomiya TG1 May 06 River basin River
Ibaraki Kashima IK1 Oct 04 Port Sump
Hitachi IK5 Sep 06 Port Channel
Chiba Choshi CB4 Jun 04 Port Sump
Chiba CB5 Oct 05 Residential area Sump
Saitama Saitama ST1 Nov 07 River basin River
Tokyo Hachioji TK4 Oct 04 Market place Sump
Kanagawa Kawasaki KG1 Jul 04 Park Sump
Chubu Niigata Niigata NG1 Jul 06 River basin Sump
Jyoetsu NG3 Jul 05 River basin Sump
Yamanashi Kofu YN1 May 05 Market place Channel
Fuefuki YN2 Jul 07 Forest Channel
Shizuoka Yaizu SO1 May 05 Port Sump
Nagano Suwa NN1 Sep 05 Lake basin Agricultural channel
Aichi Nagoya AC1 Nov 07 Port Channel
Toyama Uozu TY1 Jul 07 Port Sump
Toyama TY3 Jul 07 River area River
Ishikawa Kaga IK1 Jun 07 Clean center Agricultural channel
Fukui Fukui FK1 Oct 07 Forest Agricultural channel
Gifu Seki GF3 Jul 07 Agricultural area Agricultural channel
Kinki Mie Suzuka ME1 Jul 07 Port Channel
Shiga Nagahama SG3 Jul 07 Agricultural area Agricultural channel
Nara Nara NR2 Nov 07 Agricultural area Agricultural channel
Wakayama Arida WY1 Jan 07 River basin River
Kyoto Kyotanba KT1 Apr 07 Industrial area Channel
Osaka Izumisano OS1 Apr 07 Forest Channel
Hyogo Sanda HG3 May 07 Industrial area Agricultural channel
Shikoku Kagawa Higashikagawa KG2 Apr 07 Port Pond
Takuma KG3 Apr 07 Port Sump
Tokushima Shishikui TS2 Nov 07 Port Sump
Ehime Imabari EH2 Apr 07 Port Sump
Kochi Toyo KC3 Nov 07 Agricultural area Agricultural channel
Arch Environ Contam Toxicol (2013) 65:149–170 151
123

were gift from the 3M Company (St. Paul, MN). PFBS
was a gift from Chiron AS (Trondheim, Norway). Per-
fluoropropanesulfonate (PFPrS) was a gift from JEMCO
(Akita, Japan). Perfluorooctadecanoate (PFOcDA), perflu-
orohexadecanoate (PFHxDA), perfluorotetradecanoate
(PFTeDA), and 7:3 fluorotelmer carboxylate (FTCA) were a
gift from SynQuest Lab (Alachua, FL). Perfluoropentanoate
(PFPeA), perfluoroheptanoate (PFHpA), PFDA, perfluo-
roundecanoate (PFUnDA), and perfluorododecanoate
(PFDoDA) were purchased from Fluorochem Ltd (Derby-
shire, UK). PFHxA was purchased from Wako Pure Chemical
(Osaka, Japan). PFBA was purchased from Avocado
Research Chemicals, Ltd (Lancashire, UK). Saturated flu-
orotelomer carboxylate (8:2 FTCA) and unsaturated fluoro-
telomer carboxylate (8:2 FTUCA) were purchased from Asahi
Glass (Tokyo, Japan). Oasis weak anion exchange (WAX;
6 cc 150 mg, 30 lm) solid phase extraction (SPE) cartridges
were purchased from Waters (Milford, MA). Milli-Q water
was used throughout the experiment. Methanol and acetoni-
trile (residual pesticide and polychlorinated biphenyls [PCB]
analytical grade), ammonium acetate (97 %), ammonium
solution (25 %), and acetic acid (99.9 %) were purchased
from Wako.
PFAS Extraction
Water samples were extracted using Oasis-WAX SPE
cartridges according to methods published elsewhere
(Taniyasu et al. 2005, 2008; ISO25101 2009). The cartridges
were preconditioned by passing 4 mL of 0.1 % NH4OH in
methanol followed by 4 mL of methanol and 4 mL of Milli-
Q water. Water samples, 300 mL, were passed through the
preconditioned cartridges at a rate of 1 drop/s. The cartridges
were then pre-eluted with 4 mL of 25 mM ammonium ace-
tate buffer at pH 4 and the target analytes eluted with 4 mL of
methanol followed by 4 mL of 0.1 % NH4OH in methanol.
The eluates were then concentrated to 1 mL under a gentle
stream of nitrogen for instrumental analysis.
Whole blood samples were extracted by acetonitrile
(ACN) followed by SPE clean-up as described earlier
(Yeung et al. 2009b). In brief, 0.5 mL of whole blood sample
was mixed with 5 mL of ACN using a vortex mixer. The
mixture was shaken for 20 min at 250 rpm. The organic
phase was separated from the aqueous mixture by centrifu-
gation for 15 min at 3000 rpm. The supernatant, 5 mL, was
transferred to another PP tube. Five mL of ACN was added to
the sample again, and the extraction procedure was repeated.
Then 10 mL of combined extract was concentrated to
0.5 mL under a gentle stream of nitrogen. Milli-Q water,
10 mL, was added to the extract and then subjected to the
SPE clean-up step as described for water samples.
Instrumental Analysis
Separation of the analytes was performed using an Agilent
HP1100 liquid chromatograph (Agilent, Palo Alto, CA)
Table 1 continued
Region Prefecture City/town Sample code Date Description of sampling location Possible water sources to wild rat
Chugoku Okayama Wake OY3 Aug 07 Agricultural area Agricultural channel
Hiroshima Fukuyama HS1 Oct 07 Residential area Channel
Higashihiroshima HS3 Jun 07 Residential area Channel
Tottori Yonago TT1 Aug 07 Port Channel
Tottori TT2 Jun 07 Port Channel
Shimane Hamada SN2 Aug 07 Port Channel
Ooda SN4 Oct 07 Port Channel
Yamaguchi Shimonoseki YG1 Jun 07 Port Sump
Nagato YG3 Aug 07 Port Channel
Kyushu Fukuoka Kitakyusyu FO2 Mar 08 Port Channel
Nijyo FO3 Mar 08 Port Channel
Saga Taku SA3 Nov 07 Industrial area Agricultural channel
Oita Nakatsu OI1 Jun 07 Industrial area Agricultural channel
Nagasaki Sasebo NS4 Oct 07 River basin River
Miyazaki Kawaminami MZ1 Oct 06 Port Sump
Kumamoto Kamiamakusa KM1 Jun 07 Port Channel
Kagoshima Makurazaki KS2 Jul 05 Animal center Tap water
Okinawa Okinawa Ginowan ON3 Mar 07 Residential area No corresponding water sample
There were no corresponding water sources for wild rat collected from FS1 and ON3
152 Arch Environ Contam Toxicol (2013) 65:149–170
123

Ta
ble
2S
um
mar
yo
fP
FA
Sco
nce
ntr
atio
ns
(ng
/mL
)in
wh
ole
blo
od
of
wil
dra
tsfr
om
47
pre
fect
ure
sin
Jap
an
Co
un
try
PF
DS
PF
OS
PF
Hx
SP
FO
SA
N-E
tFO
SA
AP
FT
eDA
PF
Do
DA
PF
Un
DA
PF
DA
PF
NA
PF
OA
PF
BA
7:3
FT
CA
Jap
an4
7p
refe
ctu
res
(rat
n=
21
6)
Occ
urr
ence
%2
81
00
31
83
53
41
95
10
11
00
10
19
53
65
5
Ari
thm
etic
mea
n9
.10
.59
0.9
23
.91
.92
.11
.8
Med
ian
5.7
0.4
80
.51
2.5
1.3
6.0
0.5
8
Min
imu
m\
0.0
5\
0.0
5\
0.0
5\
0.1
\0
.05
\0
.05
\0
.05
\0
.05
\0
.05
\0
.05
\0
.05
\0
.05
\0
.05
Max
imu
m3
81
48
18
18
71
02
1.2
6.8
51
9.7
24
96
01
.91
07
Pre
fect
ure
Lo
cati
on
Sam
ple
ID
Ho
kk
aid
oT
om
ako
mai
(rat
n=
2)
HK
1M
ean
16
3.0
0.1
60
.81
1.1
2.2
0.2
2
SD
20
3.7
0.2
30
.90
1.4
2.8
0.1
3
Min
imu
m2
.00
.43
\0
.05
0.1
70
.16
0.2
20
.12
Max
imu
m3
15
.60
.33
1.4
2.1
4.2
0.3
1
n[
LO
Q0
20
20
01
22
22
00
Sap
po
ro(r
atn
=4
)H
K2
Mea
n0
.55
68
3.5
27
1.0
0.2
91
.14
.52
.17
.50
.73
4.1
SD
0.4
16
85
.52
50
.88
0.0
50
.62
3.5
1.7
9.3
0.5
65
.1
Min
imu
m0
.17
3.0
\0
.05
3.6
0.3
60
.22
0.4
90
.92
0.4
30
.49
0.2
30
.33
Max
imu
m0
.98
14
81
26
02
.30
.34
1.8
8.1
4.1
21
1.4
11
n[
LO
Q4
43
44
44
44
44
04
Yo
ich
i(r
atn
=2
)H
K3
Mea
n0
.22
11
0.2
52
.60
.79
0.0
90
.62
1.9
1.7
5.3
2.9
2.5
SD
0.2
31
30
.35
0.4
60
.06
0.0
50
.50
1.7
2.0
6.6
3.7
2.4
Min
imu
m0
.06
1.7
\0
.05
2.3
0.7
40
.05
0.2
60
.64
0.3
00
.61
0.2
70
.82
Max
imu
m0
.38
21
0.5
02
.90
.83
0.1
30
.97
3.1
3.1
10
5.5
4.2
n[
LO
Q2
21
22
22
22
22
02
Ao
mo
riA
om
ori
(rat
n=
4)
AM
1M
ean
8.7
0.6
50
.13
0.0
60
.40
1.2
1.3
3.2
0.4
90
.37
SD
7.4
0.4
40
.09
0.0
80
.37
0.6
10
.56
4.3
0.3
50
.31
Min
imu
m1
.80
.27
0.0
6\
0.0
50
.11
0.5
10
.64
0.1
80
.07
\0
.05
Max
imu
m1
81
.20
.25
0.1
70
.95
1.9
2.0
9.4
0.8
90
.70
n[
LO
Q0
40
44
24
44
44
03
Hac
hin
oh
e(r
atn
=4
)A
M2
Mea
n0
.08
5.7
0.1
20
.33
0.1
60
.19
1.2
1.8
0.5
55
.8
SD
0.0
94
.30
.25
0.2
30
.12
0.1
60
.76
3.1
0.4
99
.3
Min
imu
m\
0.0
51
.2\
0.0
50
.13
0.0
9\
0.0
50
.47
0.1
30
.13
0.1
4
Max
imu
m0
.16
00
.49
0.6
50
.34
0.3
42
.16
.41
.22
0
n[
LO
Q2
41
44
34
00
44
04
Iwat
eK
itak
ami
(rat
n=
4)
IT2
Mea
n0
.14
7.5
0.0
72
.00
.18
0.2
01
.14
.11
.41
.50
.35
1.3
SD
0.1
44
.10
.14
2.2
0.1
60
.09
0.5
21
.80
.34
2.1
0.2
71
.7
Min
imu
m\
0.0
51
.4\
0.0
50
.18
\0
.05
0.1
00
.52
2.0
0.8
70
.19
0.1
70
.39
Max
imu
m0
.33
10
0.2
84
.60
.36
0.3
21
.86
.21
.74
.60
.75
3.9
n[
LO
Q3
41
43
44
44
44
04
Sh
izu
ku
ish
i(r
atn
=4
)IT
3M
ean
0.1
70
.06
0.0
10
.20
0.1
10
.12
0.1
70
.03
SD
0.0
70
.07
0.0
30
.09
0.0
40
.15
0.0
50
.06
Arch Environ Contam Toxicol (2013) 65:149–170 153
123

Ta
ble
2co
nti
nu
ed
Co
un
try
PF
DS
PF
OS
PF
Hx
SP
FO
SA
N-E
tFO
SA
AP
FT
eDA
PF
Do
DA
PF
Un
DA
PF
DA
PF
NA
PF
OA
PF
BA
7:3
FT
CA
Min
imu
m0
.09
\0
.1\
0.0
50
.12
0.0
7\
0.0
50
.10
\0
.05
Max
imu
m0
.26
0.1
30
.05
0.3
20
.15
0.3
40
.20
0.1
2
n[
LO
Q0
40
20
01
44
34
10
Ak
ita
Ak
ita
(rat
n=
3)
AT
1M
ean
1.8
0.0
90
.07
0.3
31
.70
.38
0.2
40
.03
0.4
2
SD
0.7
80
.03
0.1
10
.46
2.2
0.3
70
.27
0.0
60
.06
Min
imu
m0
.94
0.0
6\
0.0
5\
0.0
50
.29
0.1
20
.06
\0
.05
0.3
7
Max
imu
m2
.40
.11
0.2
00
.86
4.3
0.8
00
.56
0.1
00
.48
n[
LO
Q0
30
31
03
33
31
30
Yam
agat
aY
amag
ata
(rat
n=
4)
YG
2M
ean
0.5
91
95
.33
51
.50
.50
1.8
8.1
3.4
7.9
1.4
13
SD
0.6
21
08
.36
.50
.83
0.4
51
.04
.82
.08
.01
.31
9
Min
imu
m0
.20
9.9
\0
.05
29
0.7
30
.10
0.7
74
.01
.60
.26
0.2
50
.48
Max
imu
m1
.53
21
84
32
.71
.03
.21
36
.01
53
.14
0
n[
LO
Q4
43
44
44
44
44
04
Miy
agi
Ish
ino
mak
i(r
atn
=4
)M
G1
Mea
n0
.18
7.5
0.1
38
.70
.82
0.0
20
.44
2.6
1.2
4.6
0.9
82
.2
SD
0.1
56
.00
.10
4.6
0.2
50
.04
0.2
91
.90
.75
3.0
0.7
92
.2
Min
imu
m\
0.0
51
.9\
0.0
52
.60
.49
\0
.05
0.1
80
.76
0.5
21
.7\
0.0
50
.30
Max
imu
m0
.36
16
0.2
21
31
.10
.08
0.8
45
.22
.38
.71
.75
.4
n[
LO
Q3
43
44
14
44
43
04
Fu
ku
shim
aIw
aki
(rat
n=
4)
FS
1M
ean
0.2
29
.40
.08
0.9
60
.27
0.1
00
.86
3.4
1.3
1.6
0.7
01
.4
SD
0.2
03
.60
.17
0.3
40
.25
0.0
40
.16
1.1
0.3
21
.80
.74
1.6
Min
imu
m\
0.0
54
.2\
0.0
50
.66
0.0
90
.07
0.6
32
.70
.83
0.5
20
.07
0.0
4
Max
imu
m0
.46
13
0.3
31
.40
.63
0.1
51
.05
.01
.54
.31
.63
.6
n[
LO
Q3
41
44
44
44
44
04
Gu
nm
aS
hib
uk
awa
(rat
n=
3)
GM
1M
ean
0.8
30
.19
0.1
00
.53
0.2
60
.38
0.2
9
SD
0.2
00
.09
0.0
20
.14
0.0
50
.03
0.2
3
Min
imu
m0
.68
0.0
90
.08
0.3
60
.21
0.3
50
.09
Max
imu
m1
.10
.28
0.1
10
.63
0.2
90
.41
0.5
4
n[
LO
Q0
30
30
03
33
30
30
To
chig
iU
tsu
no
miy
a(r
atn
=4
)T
G1
Mea
n5
.80
.31
0.6
10
.17
1.8
1.2
2.5
0.7
30
.28
SD
0.7
90
.36
0.3
30
.07
0.6
10
.21
2.8
0.8
60
.37
Min
imu
m4
.8\
0.0
50
.20
0.1
01
.10
.92
0.6
30
.15
\0
.05
Max
imu
m6
.60
.72
0.9
80
.25
2.4
1.4
6.7
2.0
0.8
2
n[
LO
Q0
42
40
04
44
44
03
Ibar
aki
Kas
him
a(r
atn
=3
)IR
1M
ean
0.1
57
.20
.35
4.1
0.1
70
.10
1.4
20
3.5
36
5.5
1.5
SD
0.2
61
.40
.36
2.9
0.3
00
.18
1.4
28
2.2
45
5.6
2.6
Min
imu
m\
0.0
55
.66
\0
.05
1.0
3\
0.0
5\
0.0
50
.41
63
.24
1.5
80
.90
60
.15
5\
0.0
5
Max
imu
m0
.45
8.4
0.7
26
.90
.51
0.3
13
.15
15
.98
61
14
.5
n[
LO
Q1
32
31
13
33
33
01
154 Arch Environ Contam Toxicol (2013) 65:149–170
123

Ta
ble
2co
nti
nu
ed
Co
un
try
PF
DS
PF
OS
PF
Hx
SP
FO
SA
N-E
tFO
SA
AP
FT
eDA
PF
Do
DA
PF
Un
DA
PF
DA
PF
NA
PF
OA
PF
BA
7:3
FT
CA
Hit
ach
i(r
atn
=4
)IR
5M
ean
0.0
81
00
.24
2.3
0.1
10
.20
3.3
11
9.7
12
2.5
4.1
SD
0.0
92
.60
.38
1.1
0.1
30
.23
1.4
3.4
4.2
14
3.7
6.9
Min
imu
m\
0.0
57
.4\
0.0
51
.4\
0.0
5\
0.0
51
.56
.06
.30
.52
0.1
5\
0.0
5
Max
imu
m0
.19
13
0.8
03
.90
.28
0.4
24
.51
31
62
98
.01
4
n[
LO
Q2
42
42
24
44
44
02
Ch
iba
Ch
osh
i(r
atn
=3
)C
B4
Mea
n0
.03
9.8
5.4
0.0
50
.47
4.2
1.4
0.7
50
.09
0.5
0
SD
0.0
68
.04
.30
.09
0.1
80
.36
0.4
80
.15
0.1
20
.86
Min
imu
m\
0.0
54
.90
.65
\0
.05
0.3
43
.80
.82
0.6
6\
0.0
5\
0.0
5
Max
imu
m0
.10
19
9.1
0.1
60
.68
4.5
1.7
0.9
20
.23
1.5
n[
LO
Q1
30
31
03
33
32
01
Ch
iba
(rat
n=
4)
CB
5M
ean
18
43
0.4
91
17
4.1
0.9
54
.41
67
.42
33
00
.62
37
SD
18
16
0.3
45
04
.00
.60
1.3
8.7
3.2
17
24
0.1
74
8
Min
imu
m1
.58
23
.5\
0.0
57
1.3
1.2
10
.43
2.7
4.8
3.8
1.3
1.9
0.4
54
.4
Max
imu
m3
7.6
62
.30
.79
41
87
10
.01
.85
.72
31
14
06
00
.79
10
7
n[
LO
Q4
43
44
44
44
44
44
Sai
tam
aS
aita
ma
(rat
n=
3)
ST
1M
ean
0.9
44
73
.42
21
.20
.23
2.2
8.2
3.6
7.8
1.7
0.3
39
.6
SD
0.5
93
13
.51
20
.46
0.2
31
.55
.41
.65
.51
.80
.22
3.8
Min
imu
m0
.25
15
\0
.05
10
0.7
1\
0.0
50
.51
2.3
1.7
1.4
0.1
00
.16
5.2
Max
imu
m1
.37
87
.03
41
.60
.45
3.2
13
4.6
12
3.7
0.5
81
2
n[
LO
Q3
32
33
23
33
33
33
To
ky
oH
ach
ioji
(rat
n=
4)
TK
4M
ean
0.6
73
00
.49
17
1.1
0.3
41
32
.26
71
.60
.75
0.4
3
SD
0.7
82
80
.82
26
1.4
0.1
21
30
.92
12
11
.30
.20
0.1
2
Min
imu
m0
.25
11
\0
.05
2.0
0.2
70
.22
3.1
1.1
2.8
0.6
30
.51
0.3
2
Max
imu
m1
.87
21
.75
53
.10
.50
31
3.2
24
93
.40
.97
0.6
0
n[
LO
Q4
42
44
04
44
44
44
Kan
agaw
aK
awas
aki
(rat
n=
3)
KG
1M
ean
0.0
51
70
.28
19
26
0.0
20
.33
1.4
1.9
2.3
0.5
10
.09
SD
0.0
77
.70
.24
32
50
0.0
30
.35
1.1
1.1
1.5
0.2
20
.14
Min
imu
m\
0.0
51
0\
0.0
51
.5\
0.0
5\
0.0
50
.14
0.5
00
.88
0.5
90
.27
\0
.05
Max
imu
m0
.16
27
0.5
96
71
02
0.0
60
.84
3.0
3.4
4.0
0.7
90
.30
n[
LO
Q2
43
42
14
44
44
02
Nii
gat
aN
iig
ata
(rat
n=
4)
NG
1M
ean
0.2
41
90
.52
10
0.4
10
.12
1.6
14
5.1
21
1.9
0.2
41
.5
SD
0.0
61
00
.72
3.7
0.3
00
.17
0.7
45
.92
.62
52
.30
.23
1.7
Min
imu
m0
.18
11
\0
.05
4.8
0.1
7\
0.0
50
.99
9.3
3.5
1.8
0.2
9\
0.0
50
.07
Max
imu
m0
.29
34
1.5
13
0.8
30
.37
2.6
23
9.0
55
5.1
0.5
43
.7
n[
LO
Q4
42
44
24
44
44
34
Jyo
etsu
(rat
n=
4)
NG
3M
ean
14
1.4
1.2
0.4
93
.79
.85
.39
.10
.46
4.0
SD
19
1.9
1.4
0.4
63
.06
.54
.51
40
.13
4.2
Min
imu
m3
.50
.21
0.1
10
.06
1.0
3.8
2.0
1.1
0.3
40
.66
Arch Environ Contam Toxicol (2013) 65:149–170 155
123

Ta
ble
2co
nti
nu
ed
Co
un
try
PF
DS
PF
OS
PF
Hx
SP
FO
SA
N-E
tFO
SA
AP
FT
eDA
PF
Do
DA
PF
Un
DA
PF
DA
PF
NA
PF
OA
PF
BA
7:3
FT
CA
Max
imu
m4
34
.23
.30
.93
6.8
18
12
30
0.5
81
0
n[
LO
Q0
40
44
44
44
44
04
Yam
anas
hi
Ko
fu(r
atn
=3
)Y
N1
Mea
n0
.11
6.4
5.6
1.3
0.0
90
.81
2.2
0.9
31
.10
.30
SD
0.0
41
.44
.10
.41
0.0
30
.31
0.9
91
.01
.10
.44
Min
imu
m0
.08
5.0
1.2
0.8
50
.06
0.5
81
.40
.27
0.3
30
Max
imu
m0
.15
7.8
9.3
1.7
0.1
11
.23
.32
.12
.30
.81
n[
LO
Q3
30
33
33
33
32
00
Fu
efu
ki
(rat
n=
2)
YN
2M
ean
1.2
0.2
50
.76
0.9
41
.20
.26
SD
0.3
80
.36
0.3
10
.41
0.2
90
.06
Min
imu
m0
.92
\0
.10
.54
0.6
51
.00
.21
Max
imu
m1
.50
.51
0.9
81
.21
.40
.30
n[
LO
Q0
20
10
00
22
20
20
Sh
izu
ok
aY
aizu
(rat
n=
4)
SO
1M
ean
8.2
0.2
60
.20
0.0
40
.90
3.9
2.9
6.2
4.0
0.2
60
.72
SD
7.3
0.5
20
.21
0.0
60
.92
3.9
2.8
9.1
7.7
0.5
20
.38
Min
imu
m2
.3\
0.0
5\
0.0
5\
0.0
5\
0.0
50
.27
0.6
80
.83
0.0
7\
0.0
50
.25
Max
imu
m1
91
.00
.46
0.1
22
.29
.57
.12
01
61
.01
.2
n[
LO
Q0
41
03
23
44
44
14
Nag
ano
Su
wa
(rat
n=
4)
NN
1M
ean
0.9
31
60
.07
1.6
0.5
30
.79
5.7
3.2
39
0.6
5
SD
0.3
74
.80
.05
2.1
0.2
70
.18
1.4
0.4
44
20
.88
Min
imu
m0
.51
9.3
\0
.05
0.2
50
.15
0.6
34
.42
.60
.34
\0
.05
Max
imu
m1
.32
00
.11
4.7
0.7
81
.07
.13
.58
11
.9
n[
LO
Q4
43
44
04
44
43
00
Aic
hi
Nag
oy
a(r
atn
=3
)A
C1
Mea
n3
03
.97
.00
.57
0.1
01
.89
.64
.22
75
.60
.29
8.7
SD
22
3.0
5.5
0.5
00
.12
0.6
80
.94
0.6
32
51
.10
.19
11
Min
imu
m5
.30
.74
1.5
0.2
1\
0.0
51
.08
.93
.61
04
.80
.10
0.0
6
Max
imu
m4
76
.81
21
.10
.23
2.4
11
4.8
56
6.8
0.4
72
1
n[
LO
Q0
33
33
23
33
33
33
To
yam
aU
ozu
(rat
n=
4)
TY
1M
ean
3.2
0.0
40
.88
0.1
40
.51
2.6
1.9
1.6
0.0
8
SD
1.8
0.0
60
.30
0.0
80
.11
0.4
60
.80
1.3
0.1
0
Min
imu
m2
.1\
0.0
50
.46
0.0
70
.41
2.2
1.3
0.3
2\
0.0
5
Max
imu
m5
.80
.12
1.2
0.2
50
.67
3.3
3.0
3.4
0.1
9
n[
LO
Q0
42
44
04
44
42
00
To
yam
a(r
atn
=4
)T
Y3
Mea
n0
.19
7.7
0.4
33
.10
.26
0.2
23
.58
.82
.62
.16
.20
.33
2.9
SD
0.0
95
.10
.77
2.4
0.1
20
.08
0.9
72
.20
.72
3.2
12
0.1
03
.7
Min
imu
m0
.10
3.2
\0
.05
0.9
50
.10
0.1
62
.75
.91
.60
.33
0.1
80
.18
0.1
1
Max
imu
m0
.28
13
1.6
6.5
0.3
70
.31
4.4
11
3.3
6.9
24
0.4
27
.9
n[
LO
Q4
42
44
44
44
44
44
Ish
iKaw
aK
aga
(rat
n=
3)
IK1
Mea
n5
.30
.48
0.0
91
.24
.33
.82
.90
.38
0.2
20
.23
SD
4.4
0.2
20
.16
1.3
2.9
3.3
2.9
0.4
10
.32
0.4
0
156 Arch Environ Contam Toxicol (2013) 65:149–170
123
Ta
ble
2co
nti
nu
ed
Co
un
try
PF
DS
PF
OS
PF
Hx
SP
FO
SA
N-E
tFO
SA
AP
FT
eDA
PF
Do
DA
PF
Un
DA
PF
DA
PF
NA
PF
OA
PF
BA
7:3
FT
CA
Min
imu
m2
.70
.32
\0
.05
0.4
52
.31
.80
.82
0.1
1\
0.0
5\
0.0
5
Max
imu
m1
00
.73
0.2
72
.77
.77
.66
.20
.85
0.5
90
.69
n[
LO
Q0
30
30
13
33
33
21
Fu
ku
iF
uk
ui
(rat
n=
3)
FI1
Mea
n7
.80
.54
0.6
73
.06
.27
.64
.11
.30
.56
0.8
4
SD
3.4
0.4
80
.36
0.6
92
.05
.50
.99
1.0
0.3
10
.73
Min
imu
m5
.2\
0.1
0.2
62
.64
.13
.63
.30
.07
0.2
7\
0.0
5
Max
imu
m1
20
.91
0.9
43
.88
.01
45
.21
.90
.88
1.3
n[
LO
Q0
30
20
33
33
33
32
Gif
uS
eki
(rat
n=
3)
GF
3M
ean
0.4
80
.17
0.1
10
.40
0.1
70
.29
0.2
20
.47
SD
0.0
90
.05
0.0
20
.02
0.0
20
.03
0.0
70
.17
Min
imu
m0
.41
0.1
10
.09
0.3
80
.15
0.2
60
.17
0.3
7
Max
imu
m0
.58
0.2
10
.12
0.4
30
.20
0.3
10
.30
0.6
6
n[
LO
Q0
30
30
03
33
33
30
Mie
Su
zuk
a(r
atn
=4
)M
E1
Mea
n2
50
.60
1.0
0.8
20
.11
2.7
11
4.5
5.0
1.9
13
SD
10
0.9
00
.84
0.5
70
.02
1.2
3.5
1.3
4.9
1.5
16
Min
imu
m1
3\
0.0
50
.35
\0
.05
0.0
91
.55
.93
.00
.60
0.6
31
.7
Max
imu
m3
71
.92
.21
.30
.14
4.3
14
6.2
11
4.0
36
n[
LO
Q0
42
43
44
44
44
04
Sh
iga
Nag
aham
a(r
atn
=3
)S
G3
Mea
n0
.66
0.5
60
.11
0.2
90
.15
0.2
00
.13
0.3
4
SD
0.3
60
.22
0.0
20
.09
0.0
60
.09
0.1
10
.06
Min
imu
m0
.40
0.4
20
.10
0.2
30
.09
0.1
3\
0.0
50
.28
Max
imu
m1
.10
.82
0.1
30
.40
0.2
00
.31
0.2
00
.39
n[
LO
Q0
30
30
03
33
32
30
Nar
aN
ara
(rat
n=
3)
NR
2M
ean
1.3
1.5
0.0
81
.22
.01
.31
.00
.86
1.9
SD
0.1
51
.80
.04
0.6
00
.38
0.5
30
.17
0.4
31
.5
Min
imu
m1
.10
.41
0.0
50
.54
1.6
0.6
90
.92
0.5
00
.27
Max
imu
m1
.43
.60
.12
1.7
2.3
1.7
1.2
1.3
3.2
n[
LO
Q0
30
30
33
33
33
30
Wak
ayam
aA
rid
a(r
atn
=3
)W
Y1
Mea
n0
.25
0.0
40
.07
0.1
70
.17
0.1
50
.11
0.2
7
SD
0.1
40
.07
0.0
20
.07
0.1
20
.11
0.0
50
.21
Min
imu
m0
.10
\0
.10
.04
0.1
30
.06
0.0
30
.07
0.1
0
Max
imu
m0
.38
0.1
10
.09
0.2
50
.29
0.2
60
.17
0.5
1
n[
LO
Q0
30
10
03
33
33
30
Ky
oto
Ky
ota
nb
a(r
atn
=2
)K
T1
Mea
n2
.50
.14
0.0
60
.95
2.6
2.1
2.4
0.2
40
.34
SD
1.4
0.0
70
.09
0.6
11
.41
.00
.43
0.0
40
.06
Min
imu
m1
.50
.09
\0
.05
0.5
21
.61
.42
.10
.21
0.3
0
Max
imu
m3
.50
.20
0.1
31
.43
.72
.92
.70
.26
0.3
9
n[
LO
Q0
20
20
12
22
22
20
Arch Environ Contam Toxicol (2013) 65:149–170 157
123

Ta
ble
2co
nti
nu
ed
Co
un
try
PF
DS
PF
OS
PF
Hx
SP
FO
SA
N-E
tFO
SA
AP
FT
eDA
PF
Do
DA
PF
Un
DA
PF
DA
PF
NA
PF
OA
PF
BA
7:3
FT
CA
Osa
ka
Izu
mis
ano
(rat
n=
4)
OS
1M
ean
11
2.7
2.7
5.6
3.9
4.8
13
2.3
SD
2.5
1.2
1.2
1.9
0.8
03
.81
62
.0
Min
imu
m7
.61
.81
.84
.02
.80
.45
0.2
40
.37
Max
imu
m1
34
.44
.48
.14
.58
.03
54
.8
n[
LO
Q0
40
40
04
44
44
04
Hy
og
oS
and
a(r
atn
=3
)H
G3
Mea
n0
.48
0.1
90
.26
0.8
10
.20
0.2
20
.29
0.5
5
SD
0.1
70
.17
0.1
10
.33
0.1
50
.11
0.0
90
.57
Min
imu
m0
.37
\0
.10
.16
0.5
60
.10
0.1
20
.20
0.1
5
Max
imu
m0
.67
0.3
30
.38
1.2
0.3
70
.34
0.3
61
.2
n[
LO
Q0
30
20
03
33
33
30
Kag
awa
Hig
ash
ikag
awa
(rat
n=
4)
KG
2M
ean
2.3
0.1
40
.68
0.0
50
.49
1.6
0.8
12
.33
.00
.18
0.6
7
SD
4.5
0.2
90
.65
0.0
90
.87
3.0
1.4
4.3
4.2
0.2
31
.3
Min
imu
m\
0.0
5\
0.0
5\
0.0
5\
0.0
50
.02
0.0
90
.05
0.0
50
.78
\0
.05
\0
.05
Max
imu
m9
.20
.57
1.6
0.1
91
.86
.12
.98
.89
.30
.47
2.7
n[
LO
Q0
21
30
14
44
44
23
Tak
um
a(r
atn
=4
)K
G3
Mea
n0
.39
0.1
50
.08
0.3
30
.22
0.4
80
.55
0.2
8
SD
0.1
20
.07
0.0
20
.11
0.0
70
.25
0.2
10
.29
Min
imu
m0
.25
0.0
80
.07
0.2
30
.16
0.2
90
.35
0.0
9
Max
imu
m0
.50
0.2
50
.12
0.4
70
.29
0.8
20
.77
0.7
2
n[
LO
Q0
40
40
04
44
44
40
To
ku
shim
aS
his
hik
ui
(rat
n=
4)
TS
2M
ean
2.2
0.2
00
.19
0.0
20
.49
1.9
0.5
91
.01
.10
.66
0.4
4
SD
4.0
0.4
10
.34
0.0
40
.56
2.2
0.7
61
.00
.23
0.7
50
.87
Min
imu
m0
.14
\0
.05
\0
.1\
0.0
5\
0.0
50
.12
0.0
90
.29
0.8
8\
0.0
5\
0.0
5
Max
imu
m8
.30
.81
0.7
00
.08
1.3
5.0
1.7
2.5
1.4
1.6
1.7
n[
LO
Q0
41
20
13
44
44
31
Eh
ime
Imab
ari
(rat
n=
4)
EH
2M
ean
0.2
60
.01
0.1
80
.10
0.0
30
.81
SD
0.1
20
.03
0.1
50
.08
0.0
40
.14
Min
imu
m0
.15
\0
.05
0.0
60
\0
.05
\0
.05
0.6
7
Max
imu
m0
.43
0.0
60
.36
0.2
00
.09
1.0
0
n[
LO
Q0
40
00
01
43
24
00
Ko
chi
To
yo
(rat
n=
4)
KC
3M
ean
0.1
30
.02
0.2
20
.85
0.2
40
.45
0.5
00
.63
SD
0.1
60
.04
0.2
20
.72
0.2
20
.34
0.2
60
.44
Min
imu
m\
0.0
5\
0.0
50
.06
0.3
20
.06
0.1
50
.24
0.2
8
Max
imu
m0
.33
0.0
70
.53
1.9
0.5
60
.94
0.8
51
.3
n[
LO
Q0
20
00
14
44
44
40
Ok
ayam
aW
ake
(rat
n=
2)
OY
3M
ean
0.9
70
.12
0.3
21
.71
.60
.87
0.5
60
.33
0.1
1
SD
0.0
10
.01
0.1
60
.26
0.0
03
0.0
50
.07
0.1
00
.04
Min
imu
m0
.96
0.1
10
.21
1.6
1.6
0.8
40
.51
0.2
60
.08
158 Arch Environ Contam Toxicol (2013) 65:149–170
123

Ta
ble
2co
nti
nu
ed
Co
un
try
PF
DS
PF
OS
PF
Hx
SP
FO
SA
N-E
tFO
SA
AP
FT
eDA
PF
Do
DA
PF
Un
DA
PF
DA
PF
NA
PF
OA
PF
BA
7:3
FT
CA
Max
imu
m0
.98
0.1
20
.44
1.9
1.6
0.9
00
.61
0.4
10
.14
n[
LO
Q0
20
20
22
22
22
20
Hir
osh
ima
Fu
ku
yam
a(r
atn
=4
)H
S1
Mea
n1
.91
30
.51
1.3
0.7
90
.33
1.5
4.1
2.8
4.7
4.7
2.5
SD
1.8
8.7
0.8
10
.56
0.3
40
.24
0.7
20
.44
0.7
85
.48
.73
.3
Min
imu
m0
.63
6.1
\0
.05
0.5
30
.38
0.1
00
.86
3.5
1.9
1.2
0.3
20
.12
Max
imu
m4
.42
51
.71
.71
.20
.60
2.2
4.4
3.5
13
18
7.1
6
n[
LO
Q4
43
44
44
44
44
04
Hig
ash
ihir
osh
ima
(rat
n=
4)
HS
3M
ean
0.6
80
.10
0.4
70
.28
0.4
00
.55
SD
0.4
50
.11
0.3
30
.15
0.2
10
.11
Min
imu
m0
.23
\0
.05
0.2
10
.14
0.1
10
.45
Max
imu
m1
.20
.25
0.9
40
.49
0.5
70
.70
n[
LO
Q0
40
00
03
44
44
00
To
tto
riY
on
ago
(rat
n=
4)
TT
1M
ean
0.0
58
.40
.21
7.3
0.1
60
.09
0.6
24
.62
.03
.80
.33
0.6
6
SD
0.1
06
.90
.26
5.8
0.1
70
.05
0.6
95
.71
.82
.70
.21
0.2
5
Min
imu
m\
0.0
52
.2\
0.0
51
.3\
0.0
50
.04
0.1
60
.92
0.5
30
.39
0.1
60
.34
Max
imu
m0
.20
18
0.5
51
50
.40
0.1
61
.61
34
.76
.80
.63
0.9
3
n[
LO
Q1
42
43
44
44
44
04
To
tto
ri(r
atn
=3
)T
T2
Mea
n7
.10
.36
0.5
00
.03
0.3
93
.41
.73
.51
.80
.93
SD
5.1
0.5
30
.05
0.0
50
.22
2.1
1.2
2.3
1.2
0.7
6
Min
imu
m3
.90
.06
0.4
6\
0.0
50
.25
2.0
1.0
0.8
40
.93
0.1
8
Max
imu
m1
30
.97
0.5
50
.09
0.6
45
.83
.14
.83
.11
.7
n[
LO
Q0
33
31
03
33
33
03
Sh
iman
eH
amad
a(r
atn
=4
)S
N2
Mea
n0
.66
0.2
40
.05
0.5
42
.40
.56
0.1
60
.61
0.0
4
SD
0.2
00
.10
0.0
60
.25
1.1
0.2
20
.04
0.1
30
.07
Min
imu
m0
.38
0.1
4\
0.0
50
.19
0.8
70
.24
0.1
20
.44
\0
.05
Max
imu
m0
.86
0.3
60
.13
0.7
83
.40
.74
0.2
00
.75
0.1
4
n[
LO
Q0
40
40
24
44
44
01
Oo
da
(rat
n=
4)
SN
4M
ean
0.6
00
.14
0.0
50
.12
0.5
50
.25
SD
0.2
70
.04
0.0
40
.04
0.1
80
.29
Min
imu
m0
.25
0.1
1\
0.0
50
.08
0.3
0\
0.0
5
Max
imu
m0
.91
0.1
90
.09
0.1
80
.70
0.6
5
n[
LO
Q0
40
00
00
43
44
30
Yam
agu
chi
Sh
imo
no
sek
i(r
atn
=3
)Y
C1
Mea
n5
.51
.11
.10
.51
2.7
1.0
3.9
1.5
0.2
91
.7
SD
2.2
0.9
10
.51
0.0
60
.47
0.3
33
.11
.30
.08
1.7
Min
imu
m4
.1\
0.0
50
.73
0.4
52
.20
.75
0.6
4\
0.0
50
.24
0.5
3
Max
imu
m8
.01
.61
.60
.55
3.1
1.4
6.9
2.5
0.3
83
.7
n[
LO
Q0
32
30
03
33
32
33
Arch Environ Contam Toxicol (2013) 65:149–170 159
123

Ta
ble
2co
nti
nu
ed
Co
un
try
PF
DS
PF
OS
PF
Hx
SP
FO
SA
N-E
tFO
SA
AP
FT
eDA
PF
Do
DA
PF
Un
DA
PF
DA
PF
NA
PF
OA
PF
BA
7:3
FT
CA
Nag
ato
(rat
n=
4)
YC
3M
ean
1.5
0.1
80
.02
0.4
32
.00
.38
0.3
30
.46
0.0
30
.08
SD
0.4
20
.13
0.0
40
.23
0.8
30
.10
0.2
70
.27
0.0
50
.12
Min
imu
m1
.10
.08
\0
.05
0.2
31
.30
.24
0.0
80
.30
\0
.05
\0
.05
Max
imu
m2
.00
.37
0.0
80
.73
3.1
0.4
60
.71
0.8
70
.10
0.2
5
n[
LO
Q0
40
41
04
44
44
12
Fu
ku
ok
aK
itak
yu
syu
(rat
n=
3)
FO
2M
ean
1.7
0.0
90
.43
0.1
20
.02
0.2
91
.10
.47
0.6
81
.10
.43
SD
0.3
00
.08
0.3
50
.03
0.0
10
.06
0.1
50
.09
0.2
50
.37
0.2
8
Min
imu
m1
.4\
0.0
50
.15
0.0
90
.01
0.2
30
.96
0.4
00
.39
0.7
70
.24
Max
imu
m1
.90
.17
0.8
30
.16
0.0
30
.36
1.2
0.5
70
.82
1.5
0.7
5
n[
LO
Q0
32
33
33
33
33
03
Nij
yo
(rat
n=
4)
FO
3M
ean
2.2
0.0
40
.12
0.1
60
.99
0.6
50
.67
0.4
90
.05
SD
1.7
0.0
70
.15
0.1
00
.71
0.5
50
.10
0.4
70
.07
Min
imu
m0
.65
\0
.1\
0.0
50
.08
0.4
50
.25
0.5
20
.15
\0
.05
Max
imu
m4
.60
.15
0.3
50
.28
2.0
1.4
0.7
41
.20
.14
n[
LO
Q0
40
13
04
44
44
02
Sag
aT
aku
(rat
n=
3)
SA
3M
ean
6.0
0.5
21
.20
.06
0.5
50
.23
0.4
00
.22
SD
2.6
0.5
12
.00
.06
0.2
70
.10
0.2
50
.28
Min
imu
m3
.40
.10
0.0
5\
0.0
50
.33
0.1
60
.13
\0
.05
Max
imu
m8
.61
.13
.50
.11
0.8
50
.34
0.6
10
.54
n[
LO
Q0
30
33
02
33
32
00
Oit
aN
akat
su(r
atn
=2
)O
I1M
ean
2.1
0.0
40
.02
0.3
51
.81
.11
.30
.20
SD
1.0
0.0
20
.03
0.3
01
.20
.77
1.0
0.0
8
Min
imu
m1
.4\
0.1
\0
.05
0.1
40
.96
0.5
80
.58
0.1
4
Max
imu
m2
.90
.05
0.0
40
.57
2.6
1.7
2.0
0.2
6
n[
LO
Q0
20
11
02
22
22
00
Nag
asak
iS
aseb
o(r
atn
=4
)N
S4
Mea
n5
.30
.97
0.4
70
.86
4.7
2.3
2.5
0.2
6
SD
0.5
50
.47
0.2
30
.26
2.4
1.3
3.9
0.2
6
Min
imu
m4
.60
.44
0.2
10
.64
2.4
0.7
40
.32
0.0
6
Max
imu
m5
.81
.50
.76
1.2
8.0
3.8
8.3
0.6
3
n[
LO
Q0
40
44
04
44
44
00
Miy
azak
iK
awam
inam
i(r
atn
=3
)M
Z1
SD
0.3
00
.01
0.1
10
.70
0.5
71
.60
.43
0.2
6
Min
imu
m1
.40
.03
0.3
93
.00
.95
0.2
50
.45
0.1
4
Max
imu
m2
.00
.05
0.6
14
.22
.03
.51
.20
.66
n[
LO
Q0
30
03
03
33
33
03
Ku
mam
oto
Kam
iam
aku
sa(r
atn
=3
)K
M1
Mea
n1
.50
.41
0.0
30
.42
1.5
0.7
31
.50
.96
0.3
1
SD
0.5
50
.46
0.0
50
.14
0.2
40
.35
1.2
0.5
60
.30
Min
imu
m0
.93
0.1
0\
0.0
50
.26
1.3
0.3
30
.09
0.3
2\
0.0
5
Max
imu
m2
.00
.94
0.0
80
.50
1.8
0.9
62
.31
.30
.59
n[
LO
Q0
30
31
03
33
33
02
160 Arch Environ Contam Toxicol (2013) 65:149–170
123

interfaced with a Micromass Quattro Ultima Pt Mass
Spectrometer (Waters, Milford, MA) operated in the elec-
trospray negative ionization mode. A 10-lL aliquot of the
extract was injected onto two different analytical columns.
One of the columns was a Keystone Betasil C18-column
(2.1 mm i.d. 9 50 mm length, 5-lm 100 A pore size, end-
capped) with 2 mM ammonium acetate and methanol as
mobile phase for the quantification of C6 to C18 PFASs.
Another column was ion exchange column RSpak JJ-50 2D
(2.0 mm i.d. 9 150-mm length; Shodex, Showa Denko
K.K., Kawasaki, Japan) with 50 mM ammonium acetate
and methanol as mobile phase and was employed for the
quantification of C3 to C5 PFASs. The PFAS concentra-
tions (C6–C18) determined by these two stationary phases
were checked against each other for confirmation. The
variations in PFAS concentrations determined between
these two columns were \10 %. The desolation gas flow
and temperature were kept at 610 L/h and 450 �C,
respectively. The collision energies, cone voltages, and
double mass spectrometry (MS/MS) parameters for the
instrument were optimized for individual analytes and were
similar to those reported elsewhere (Taniyasu et al. 2005,
2008).
TF and Organic Fluorine Analysis
An aliquot of blood was subjected to fractionation pro-
cedure for the analysis of TF and extractable organic
fluorine (EOF) according to the extraction methods
described in Yeung et al. (2009a, c). TF was determined by
taking 0.1 mL of wild rat blood on a silica boat and placing
it directly into the combustion ion chromatograph (CIC).
EOF from fraction 1 (the extract of Methyl tertiary butyl
ether [MTBE] fraction of ion-pairing) and EOF from
fraction 2 (hexane extraction of residue after ion-pairing
extraction) were quantified using CIC. The method
involves modifications to traditional CIC by the combina-
tion of an automated combustion unit (AQF-100 type
AIST; Dia Instruments) and an ion chromatography system
(ICS-3000 type AIST; Dionex, Sunnyvale, CA). The cus-
tomized instrument, combustion ion chromatograph for
fluorine (CIC-F), has been described in detail elsewhere
(Yeung et al. 2009a, c). The sample extract was set on a
silica boat and placed into a furnace at 900–1000 �C.
Combustion of the sample in the furnace converted organic
fluorine and inorganic fluoride into hydrogen fluoride (HF).
The HF was absorbed into sodium hydroxide solution
(0.2 mmol/L). The concentration of F- in the solution was
analyzed using ion chromatography. Sodium fluoride
(99 % purity; Wako) was used as a standard for quantifi-
cation. Five calibration standards were prepared routinely
at 0.2, 1, 5, 25, and 100 mg/L and injected at 1.5 mL to
check for linearity of the instrument. Quantification wasTa
ble
2co
nti
nu
ed
Co
un
try
PF
DS
PF
OS
PF
Hx
SP
FO
SA
N-E
tFO
SA
AP
FT
eDA
PF
Do
DA
PF
Un
DA
PF
DA
PF
NA
PF
OA
PF
BA
7:3
FT
CA
Kag
osh
ima
Mak
ura
zak
i(r
atn
=3
)K
S2
Mea
n1
.00
.03
0.1
70
.81
2.7
1.3
1.8
0.2
30
.44
SD
0.6
80
.06
0.0
90
.56
2.0
1.2
1.7
0.1
10
.11
Min
imu
m0
.38
\0
.10
.06
0.2
20
.77
0.3
80
.51
0.1
70
.34
Max
imu
m1
.70
.10
0.2
31
.34
.82
.73
.70
.36
0.5
6
n[
LO
Q0
30
10
33
33
33
30
Ok
inaw
aG
ino
wan
(rat
n=
5)
ON
3M
ean
16
0.3
83
.00
.14
4.6
0.9
42
13
.20
.15
SD
21
0.2
36
.30
.06
8.1
0.5
84
23
.90
.24
Min
imu
m1
.80
.14
\0
.05
0.0
60
.25
0.2
70
.14
0.2
0\
0.0
5
Max
imu
m5
30
.67
14
0.2
01
91
.79
79
.70
.57
n[
LO
Q0
55
02
05
55
55
03
Ari
thm
etic
mea
nis
giv
enfo
rth
e2
16
wh
ole
blo
od
sam
ple
s,th
esa
mp
les
low
erth
anL
OQ
sis
con
sid
ered
asa
zero
Arch Environ Contam Toxicol (2013) 65:149–170 161
123

based on the response of the external standards that brack-
eted the concentrations found in the samples. The analytical
parameters and conditions of the ion chromatography were
given in Yeung et al. (2009a, c). All solutions were prepared
in Milli-Q water, and the fluoride concentration in the Milli-
Q water was \0.025 mg/L. Furthermore, fluoride concen-
tration in the methanol was lower than the limit of quantifi-
cation (LOQ).
Quality Assurance/Quality Control
For individual PFASs, LOQs were defined as the lowest
mass of the compound injected that resulted in a reproduc-
ible measurement of the peak areas within ± 20 % of the
duplicate injection. The LOQ for each compound typically
ranged from 0.05–0.1 ng/mL for the blood samples and
0.02–0.50 ng/L for the water samples. LOQs were evaluated
based on several criteria, including (1) the smallest con-
centration of standard on the calibration curve that could be
accurately measured within ± 20 % of its theoretical value;
(2) a signal-to-noise ratio C 10; (3) the concentration factor;
and (4) the sample volume. PFAS concentrations were
quantified using external calibration curves consisting of a
concentration series of 2, 10, 50, 200, 1000, 5000, and
20,000 pg/mL. The standard calibration curve showed high
linearity (correlation coefficients [ 0.99). The linearity and
repeatability of these calibration curves were confirmed
before each batch of sample analysis. If the measured con-
centrations exceeded the range of the calibration curve,
the samples were diluted and reinjected into the liquid
chromatography-tandem mass spectrometer. A custom-
made standard solution (1 ng/mL) of target analytes,
including mass-labeled standards, was injected with every
10 sample injections to check for any shift and intensity
changes of peaks from the original retention time.
Procedural blanks were analyzed with every batch of
(n = 10) samples, and procedural recoveries were con-
ducted to check the accuracy of the methods used. Matrix
recovery tests (i.e., whole blood and water samples) were
also performed. Matrix recoveries were calculated by
IK1FI1 GM1 TG1
YN1 YN2
SO1AC1ME1
WY1
TS2
KG2 KG3EH2
KC3
ON3
TT1TT2
SN2 SN4YG1 YG3
OY3HS3 HS1
HK2HK3 HK1
IK1IK5 CB4
GF3
ST1TK4 CB5KG1
FS1
MG1
AM1
IT2
IT3YG2 AT1
AM2
NS4
KM1
MZ1
KS2
FO2FO3SA3
OI1OS1 NR2
HG3 SG3KT1
NG1NG3TY1TY3NN1
67.8
66.8
117
Low
High
High
High
High
Hokkaido
Tohoku
Kanto
Chubu
Kinki
Shikoku
Chugoku
Kyushu
Okinawa
Nine region andtheir boundary
PF
OS
PF
OSA
PF
OA
PF
NAC
once
ntra
tion
s(n
g/m
L) 20
10
0
Fig. 1 Concentrations of PFOS, PFOA, PFNA and PFOSA in the
blood of 216 wild rats from 47 prefectures in Japan (No bar indicates
sample below LOQ (0.05 ng/mL); blue, red and black colors circles
on the map indicates the rat species Rattus rattus, Apodemus specious
and Rattus norvegicus, respectively) (Color figure online)
162 Arch Environ Contam Toxicol (2013) 65:149–170
123

comparing the relative response factors of the spiked
samples with those of the nonspiked ones. All procedural
blanks were lower than the corresponding LOQs for the
blood and water samples. The recoveries ranged from 70 to
120 % for blood samples and 87 to 105 % for water
samples, whereas matrix spike recoveries for blood sam-
ples ranged from 58 to 122 % and for water samples ran-
ged from 83 to 117 %. All of the samples were extracted in
duplicate, and the relative standard deviations for duplicate
analysis were \10 %. Carbon-13 (13C)–labeled standards
were spiked into blood and water samples to evaluate
overall recoveries. Recoveries for the 13C-standards spiked
in blood and water samples were between 76 and 110 %.
PFAS concentrations in samples were not corrected for the
internal standard recoveries.
For TF and EOF analysis, because contaminants could
be present in the gases used for CIC, high-purity gases
(argon = 99.9999 %, oxygen = 99.9995 %) were used
(Yeung et al. 2009a, c). Ion chromatograph tubing, gas
lines, valves, and regulators, which contained materials or
parts made of polytetrafluoroethylene, were replaced with
stainless steel, polyetheretherketone, or polyethylene tub-
ing. Furthermore, a gas purifier containing activated carbon
was placed in the gas line to remove trace levels of fluo-
rine from the gases. Analyses of TF were conducted in
duplicate. In-house reference material (pig blood) was
injected before and after 10 CIC injections, and one of the
liver homogenates was injected before and after of daily
injection to check for the overall efficiency of the com-
bustion process.
Statistical Analysis
Pearson correlation analysis was used to evaluate the
relationships between PFASs in water and rat blood and
population density. The significant level was set at
a = 0.05. Because the data were not normally distributed,
all data, including PFAS concentrations measured in blood
and water as well as the population density, were log-
transformed for statistical analysis.
Rat
blo
od c
once
ntra
tion
(n
g/m
L)
Location (Geography)
Hok
kaid
o
Toh
oku
Kan
to
Chu
bu
Kin
ki
Shik
oku
Chu
goku
Kyu
shu
Oki
naw
a
PFDS
PFOS
PFHxS
PFOSA
N-EtFOSAA
PFTeDA
PFDoDA
PFUnDA
PFDA
PFNA
PFOA
PFHpA
PFHxA
PFPeA
PFBAPFPrA
0
20
40
60
80
100
120
140
HK
1H
K2
HK
3A
M1
AM
2IT
2IT
3A
T1
YG
2M
G1
FS1
GM
1T
G1
IR1
IR5
CB
4C
B5
ST1
TK
4K
G1
NG
1N
G3
YN
1Y
N2
SO1
NN
1A
C1
TY
1T
Y3
IR1
FK
1G
F3
ME
1SG
3N
R2
WY
1K
T1
OS1
HG
3K
G2
KG
3T
S2E
H2
KC
3O
Y3
HS1
HS3
TT
1T
T2
SN2
SN4
YG
1Y
G3
FO
2F
O3
SA3
OI1
NS4
MZ
1K
M1
KS2
ON
3
143 301
PFASs
Fig. 2 Individual PFAS concentrations (ng/mL) in wild rat blood samples from 47 prefectures in Japan
Arch Environ Contam Toxicol (2013) 65:149–170 163
123

Results and Discussion
Among 23 PFASs analyzed, 13 PFASs (% occurrence)
were detected in whole blood of wild rats: PFDS (detection
rate 28 %), PFOS (100 %), PFHxS (31 %), PFOSA (83 %),
N-EtFOSAA (53 %), PFTeDA (41 %), PFDoDA (95 %),
PFUnDA (100 %), PFDA (100 %), PFNA (100 %), PFOA
(95 %), PFBA (36 %), and 7:3 FTCA (55 %). The sum-
mary of minimum, maximum, arithmetic mean, and median
PFAS concentrations, as well as their frequency of detec-
tion, are listed in Table 2. PFDSi (\0.05 ng/mL), PFOSi
(\0.05 ng/mL), and PFHxSi (\0.05 ng/mL) were not
detected in any of the wild rat blood samples. PFHpA
(\0.05–2.02 ng/mL), PFHxA (\0.05–9.93 ng/mL), PFPeA
(0.05–0.263 ng/mL), and PFPrA (\0.2–0.276 ng/mL) were
detected in 10 % of the samples. PFBA and PFHxS were
detected in \40 % of the samples. PFSAs (mainly PFOS)
accounted for 45 % of total PFASs, whereas PFUnDA and
PFNA accounted for 20 and 10 % of total PFASs, respec-
tively. Median PFOS concentration was 5.7 ng/mL
followed by PFOSA at 0.48 ng/mL. Among PFCAs, odd-
number carbon-fluorine chain (i.e., PFNA [median 6.0 ng/
mL] and PFUnDA [median 2.5 ng/mL]) were greater than
those of even carbon-fluorine chain (PFDoDA [median
0.51 ng/mL], PFDA [median 1.3 ng/mL], and PFOA
[median 0.58 ng/mL]).
Japan has four major islands (i.e., Hokkaido, Honshu,
Shikoku, and Kyushu), which can be further divided into
nine regions (i.e., Hokkaido, Tohoku, Kanto, Kinki, Chubu,
Chugoku, Shikoku, Kyushu, and Okinawa). The geo-
graphical locations are characterized by different levels of
development and industrial activities. Average PFOS,
PFOSA, PFNA, and PFOA concentrations in wild rat blood
from 47 prefectures are shown in Figs. 1 and 2. A clear
geographical difference in PFAS distribution was observed
in Japan. Relatively lower PFAS concentrations were
found in Kyushu and Shikoku islands. The Kanto region in
Honshu island encompasses the largest industrial zone with
a wide range of commerce and heavy industries, such as
electronic production and semi-conductor industries, which
PFDS
PFOS
PFHxS
PFOSA
N-EtFOSAA
PFTeDA
PFDoDA
PFUnDA
PFDA
PFNA
PFOA
PFHpA
PFHxA
PFPeA
PFBAPFPrA
0
10
20
30
40
50
60
70
80
HK
1H
K2
HK
3A
M1
AM
2IT
2IT
3A
T1
YG
2M
G1
FS2
GM
1T
G1
IR1
IR5
CB
4C
B5
ST1
TK
4K
G1
NG
1N
G3
YN
1Y
N2
SO1
NN
1A
C1
TY
1T
Y3
IK1
FK
1G
F3
ME
1SG
3N
R2
WY
1K
T1
OS1
HG
3K
G2
KG
3T
S2
EH
2
KC
3
OY
3
HS1
HS3
TT
1
TT
2
SN2
SN4
YG
1
YG
3
FO
2
FO
3
SA3
OI1
NS4
MZ
1
KM
1
KS2
ON
2
Wat
er c
once
ntra
tion
s (
ng/L
)
Location (Geography)
Hok
kaid
o
Toh
oku
Kan
to
Chu
bu
Kin
ki
Shik
oku
Chu
goku
Kyu
shu
Oki
naw
a
180
PFASs
Fig. 3 Individual PFAS concentrations (ng/L) in water samples collected near the habitat of wild rats (n = 62) from 47 prefectures in Japan
164 Arch Environ Contam Toxicol (2013) 65:149–170
123
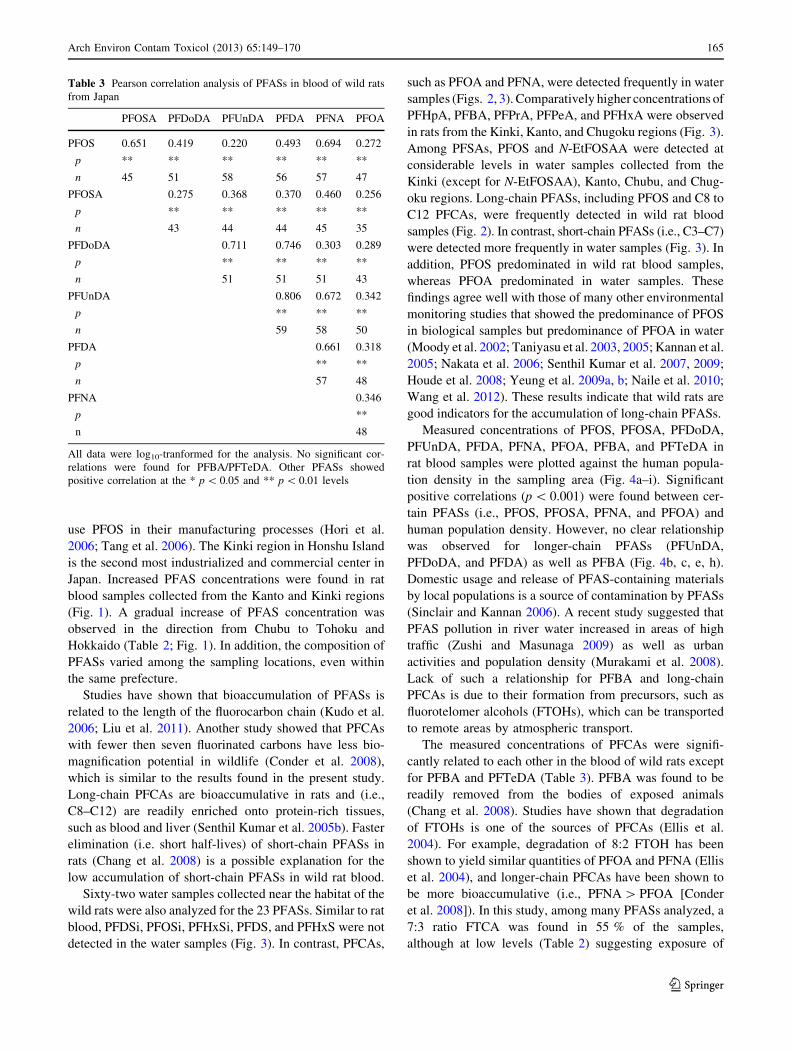
use PFOS in their manufacturing processes (Hori et al.
2006; Tang et al. 2006). The Kinki region in Honshu Island
is the second most industrialized and commercial center in
Japan. Increased PFAS concentrations were found in rat
blood samples collected from the Kanto and Kinki regions
(Fig. 1). A gradual increase of PFAS concentration was
observed in the direction from Chubu to Tohoku and
Hokkaido (Table 2; Fig. 1). In addition, the composition of
PFASs varied among the sampling locations, even within
the same prefecture.
Studies have shown that bioaccumulation of PFASs is
related to the length of the fluorocarbon chain (Kudo et al.
2006; Liu et al. 2011). Another study showed that PFCAs
with fewer then seven fluorinated carbons have less bio-
magnification potential in wildlife (Conder et al. 2008),
which is similar to the results found in the present study.
Long-chain PFCAs are bioaccumulative in rats and (i.e.,
C8–C12) are readily enriched onto protein-rich tissues,
such as blood and liver (Senthil Kumar et al. 2005b). Faster
elimination (i.e. short half-lives) of short-chain PFASs in
rats (Chang et al. 2008) is a possible explanation for the
low accumulation of short-chain PFASs in wild rat blood.
Sixty-two water samples collected near the habitat of the
wild rats were also analyzed for the 23 PFASs. Similar to rat
blood, PFDSi, PFOSi, PFHxSi, PFDS, and PFHxS were not
detected in the water samples (Fig. 3). In contrast, PFCAs,
such as PFOA and PFNA, were detected frequently in water
samples (Figs. 2, 3). Comparatively higher concentrations of
PFHpA, PFBA, PFPrA, PFPeA, and PFHxA were observed
in rats from the Kinki, Kanto, and Chugoku regions (Fig. 3).
Among PFSAs, PFOS and N-EtFOSAA were detected at
considerable levels in water samples collected from the
Kinki (except for N-EtFOSAA), Kanto, Chubu, and Chug-
oku regions. Long-chain PFASs, including PFOS and C8 to
C12 PFCAs, were frequently detected in wild rat blood
samples (Fig. 2). In contrast, short-chain PFASs (i.e., C3–C7)
were detected more frequently in water samples (Fig. 3). In
addition, PFOS predominated in wild rat blood samples,
whereas PFOA predominated in water samples. These
findings agree well with those of many other environmental
monitoring studies that showed the predominance of PFOS
in biological samples but predominance of PFOA in water
(Moody et al. 2002; Taniyasu et al. 2003, 2005; Kannan et al.
2005; Nakata et al. 2006; Senthil Kumar et al. 2007, 2009;
Houde et al. 2008; Yeung et al. 2009a, b; Naile et al. 2010;
Wang et al. 2012). These results indicate that wild rats are
good indicators for the accumulation of long-chain PFASs.
Measured concentrations of PFOS, PFOSA, PFDoDA,
PFUnDA, PFDA, PFNA, PFOA, PFBA, and PFTeDA in
rat blood samples were plotted against the human popula-
tion density in the sampling area (Fig. 4a–i). Significant
positive correlations (p \ 0.001) were found between cer-
tain PFASs (i.e., PFOS, PFOSA, PFNA, and PFOA) and
human population density. However, no clear relationship
was observed for longer-chain PFASs (PFUnDA,
PFDoDA, and PFDA) as well as PFBA (Fig. 4b, c, e, h).
Domestic usage and release of PFAS-containing materials
by local populations is a source of contamination by PFASs
(Sinclair and Kannan 2006). A recent study suggested that
PFAS pollution in river water increased in areas of high
traffic (Zushi and Masunaga 2009) as well as urban
activities and population density (Murakami et al. 2008).
Lack of such a relationship for PFBA and long-chain
PFCAs is due to their formation from precursors, such as
fluorotelomer alcohols (FTOHs), which can be transported
to remote areas by atmospheric transport.
The measured concentrations of PFCAs were signifi-
cantly related to each other in the blood of wild rats except
for PFBA and PFTeDA (Table 3). PFBA was found to be
readily removed from the bodies of exposed animals
(Chang et al. 2008). Studies have shown that degradation
of FTOHs is one of the sources of PFCAs (Ellis et al.
2004). For example, degradation of 8:2 FTOH has been
shown to yield similar quantities of PFOA and PFNA (Ellis
et al. 2004), and longer-chain PFCAs have been shown to
be more bioaccumulative (i.e., PFNA [ PFOA [Conder
et al. 2008]). In this study, among many PFASs analyzed, a
7:3 ratio FTCA was found in 55 % of the samples,
although at low levels (Table 2) suggesting exposure of
Table 3 Pearson correlation analysis of PFASs in blood of wild rats
from Japan
PFOSA PFDoDA PFUnDA PFDA PFNA PFOA
PFOS 0.651 0.419 0.220 0.493 0.694 0.272
p ** ** ** ** ** **
n 45 51 58 56 57 47
PFOSA 0.275 0.368 0.370 0.460 0.256
p ** ** ** ** **
n 43 44 44 45 35
PFDoDA 0.711 0.746 0.303 0.289
p ** ** ** **
n 51 51 51 43
PFUnDA 0.806 0.672 0.342
p ** ** **
n 59 58 50
PFDA 0.661 0.318
p ** **
n 57 48
PFNA 0.346
p **
n 48
All data were log10-tranformed for the analysis. No significant cor-
relations were found for PFBA/PFTeDA. Other PFASs showed
positive correlation at the * p \ 0.05 and ** p \ 0.01 levels
Arch Environ Contam Toxicol (2013) 65:149–170 165
123

Human population density (person/km2)
bloo
odco
ncen
trat
ion
( ng/
mL
)bl
ood
conc
entr
atio
n (n
g /m
L)
0.1
1
10
100
10 100 1000 10000
PFOS
R2 = 0.116**n = 58
0.01
0.1
1
10
10 100 1000 10000
PFDoDA
R2 = 0.011n = 51
R2 = 0.104*n = 58
0.01
0.1
1
10
10 100 1000 10000
PFDA
R2 = 0.150**n = 44
0.01
0.1
1
10
100
1000
10 100 1000 10000
PFOSA
R2 = 0.100*n = 60
0.1
1
10
100
10 100 1000 10000
PFUnDA
R2 = 0.172**n = 58
0.01
0.1
1
10
100
10 100 1000 10000
PFNA
Human population density (person/km2)
a
ed
cb
f
0.01
0.1
1
10
10 100 1000 10000
PFBA
Human population density (person/km2)
bloo
d co
ncen
trat
ion
(ng/
mL
) R2 = 0.147**n = 50
0.01
0.1
1
10
100
10 100 1000 10000
PFOA
R2 = 0.005n = 26
0.01
0.1
1
10 100 1000 10000
PFTeDA
R2 = 0.2138n = 33
agricultural area
animal center
clean center
forest
industrial area
lake basin
market place
park
parking
port
power plant
residential area
river basin
g ih
Fig. 4 The relationship between concentration of individual PFASs
in wild rat blood and population density. Strong correlations (Pearson
correlation significant at \0.05*, \0.001**), with human population
density were found for PFOS, PFOSA, PFNA and PFOA and no clear
relationship was found for both long chain (PFUnDA, PFDoDA,
PFDA) and short chain (PFBA) compounds
166 Arch Environ Contam Toxicol (2013) 65:149–170
123

rats to FTOHs; FTCA is a partial metabolic transformation
product of FTOHs.
Drinking water is a source of human exposure to
PFASs (Loos et al. 2007; Ericson et al. 2008; Mak et al.
2009; Quinones and Snyder 2009). Exposure of certain
populations to high PFOA concentrations has been
reported (Emmett et al. 2006; Skutlarek et al. 2006;
Paustenbach et al. 2007; Ericson et al. 2008). In the
present study, correlation was performed between PFASs
detected in wild rat blood and concentrations found in
water from rats’ habitats. Only significant correlation
(p \ 0.05) was observed for PFNA (R2 = 0.273) and
Organic fluorine
Total fluorine
Fig. 5 Contributions of known PFASs, unknown organic fluorine and inorganic fluorine to TF concentrations in wild rat blood from Japan
0.01
0.1
1
10
100
1000
0% 20% 40% 60%
PF
ASs
con
cent
rati
ons
[ng/
mL
]
known PFASs / TF
0.01
0.1
1
10
100
1000
0% 20% 40% 60% 80%
PF
C c
once
ntra
tion
s [n
g/m
L]
EOF/ TF
PFOS
PFHxS
PFOSA
PFDoDA
PFUnDA
PFDA
PFNA
PFOA
a b
Fig. 6 Ratios of individual PFASs concentrations in wild rat blood to TF (known PFASs/TF) or EOF/TF) as indicators sources of PFASs in rats.
Dotted line indicates general (non-specific) sources of pollution and solid line indicates specific source of pollution
Arch Environ Contam Toxicol (2013) 65:149–170 167
123
PFOA (R2 = 0.093). Several factors affect accumulation
of PFASs in rats, and dietary sources appear to be
important sources of PFASs in rats. Serum PFOS and PFOA
concentrations for the Japanese populations were in the
range of several tens of parts per billion (ppb) (Taniyasu
et al. 2003; Harada et al. 2004, 2007). Interestingly, con-
centrations of PFOS and PFOA in rat blood were similar to
those found in human serum. Furthermore, geographic
differences in PFAS concentrations were similar between
wild rats and humans. These results suggest that wild rats
can be good indicators of PFAS exposure in humans.
Inorganic fluorine is a naturally occurring element
(Zhang et al. 2010). Concentrations of known organic
fluorine (i.e., PFASs), EOF and inorganic fluorine were
analyzed in wild rat blood (Fig. 5). The proportion of
known organic fluorine, such as PFASs, was relatively
higher in the Shizuoka and Hokkaido regions than in other
regions in Japan. The proportion of EOF was relatively
greater in the Osaka region, and inorganic fluorine was
relatively greater in the Fukuoka, Hokkaido, and Okinawa
regions (Fig. 5). TF concentration in wild rat was variable,
and no significant relationship was found with the concen-
tration of individual PFASs. Fluorine readily forms com-
pounds with other elements, such as calcium, which can
affect bioavailability. In our previous study, we reported
that EOF concentrations (Fr1; MTBE extraction) in wild rat
blood ranged 61–134 ng-F/mL, whereas those in fraction 2
(Fr2; hexane) were lower than the LOQ (32 ng-F/mL); TF
concentrations in the blood of wild rats ranged from 60 to
192 ng-F/mL. The contribution of known PFASs in EOF-
Fr1 (MTBE) varied from 9 to 89 % (average 56 %), and
known PFAS concentrations in TF content were \25 %
(Yeung et al. 2009c). Miyake et al. (2007) reported that
nonextractable organofluorine concentrations in the blood
of the general human population in Japan were [70 % of
the TF. These results found for humans were similar to that
found for rat blood, which showed 45 to[95 % of nonex-
tractable organofluorines in rat blood.
The ratios of concentrations of individual PFAS with TF
and EOF were examined in rat blood as indicators of sources
of exposures (i.e., known PFASs/TF and EOF/TF). This
approach was useful to identify general (nonspecific sour-
ces) and specific sources of pollution by PFASs on a
regional scale (Fig. 6a, b). As shown in Fig. 6, the cluster
that indicated nonspecific sources of pollution was from
those samples that had PFASs/TF and EOF/TF ratios\40 %
(blue circle). The cluster that showed specific sources of
pollution was based on those samples with PFASs/TF ratios
of 60 % and EOF/TF ratios of 60 to 80 %. The general
nonspecific sources of PFASs pollution can be related to
environmental releases from human activities (e.g., use of
products such as wax, detergents, garbage, food, waste
water from residents), whereas specific sources of PFASs
pollution are related to industrial sources (e.g., metal and
fluoropolymer manufactures, industry wastewater).
In summary, a nationwide survey of a suite of PFASs,
including short- and long-chain compounds in wild rat
blood and water sources close to their habitat, was con-
ducted in Japan. Contamination profiles of PFASs in wild
rats showed high accumulation in the Kanto and Chiba
regions. There were strong correlations between human
population density and levels of PFOS, PFNA, PFOA and
PFOSA in wild rats. However, long- and short-chain
compounds showed no relationships with population den-
sity. Concentrations of PFASs in rat blood were compa-
rable with those found in human blood from Japan.
Therefore, we propose that wild rats are good indicators of
human exposure to PFASs.
Acknowledgments We thank to Paul Lam and staff in City Uni-
versity of Hong Kong for their support.
References
Abbott BD, Wolf CJ, Das KP, Schmid JE, Lau CS (2007) The
developmental toxicity of perfluorooetanoic acid (PFOA) in the
mouse requires expression of peroxisome proliferator activated
receptoralpha (PPAR). Birth defects research. Birth Defects Res
A Clin Mol Teratol 79:370
Ahrens L, Taniyasu S, Yeung LW, Yamashita N, Lam PK, Ebinghaus
R (2010) Distribution of polyfluoroalkyl compounds in water,
suspended particulate matter and sediment from Tokyo Bay,
Japan. Chemosphere 79:266–272
Ceruti R, Ghisleni G, Ferretti E, Cammarata S, Sonzogni O, Scanziani
E (2002) Wild rats as monitors of environmental lead contam-
ination in the urban area of Milan, Italy. Environ Pollut 117:
255–259
Chang SC, Das K, Ehresman DJ, Ellefson ME, Gorman GS, Hart JA
et al (2008) Comparative pharmacokinetics of perfluorobutyrate
in rats, mice, monkeys, and humans and relevance to human
exposure via drinking water. Toxicol Sci 104:40–53
Conder JM, Hoke RA, De Wolf W, Russell MH, Buck RC (2008) Are
PFCAs bioaccumulative? A critical review and comparison with
regulatory lipophilic compounds. Environ Sci Technol 42:995–
1003
Dai JY, Li M, Jin YH, Saito N, Xu MQ, Wei FW (2006)
Perfluorooctanesulfonate and perfluorooctanoate in red panda
and giant panda from China. Environ Sci Technol 40:5647–5652
Ellis DA, Martin JW, De Silva AO, Mabury SA, Hurley MD,
Andersen MPS et al (2004) Degradation of fluorotelomer
alcohols: a likely atmospheric source of perfluorinated carbox-
ylic acids. Environ Sci Technol 38:3316–3321
Emmett EA, Shofer FS, Zhang H, Freeman D, Desai C, Shaw LM
(2006) Community exposure to perfluorooctanoate: relationships
between serum concentrations and exposure sources. J Occup
Environ Med 48:759–770
Ericson I, Nadal M, van Bavel B, Lindstrom G, Domingo JL (2008)
Levels of perfluorochemicals in water samples from Catalonia,
Spain: is drinking water a significant contribution to human
exposure? Environ Sci Pollut Res 15:614–619
Fairley KJ, Purdy R, Kearns S, Anderson SE, Meade BJ (2007)
Exposure to the immunosuppressant, perfluorooctanoic acid,
168 Arch Environ Contam Toxicol (2013) 65:149–170
123
enhances the murine IgE and airway hyperreactivity response to
ovalbumin. Toxicol Sci 97:375–383
Giesy JP, Kannan K (2001) Global distribution of perfluorooctane
sulfonate in wildlife. Environ Sci Technol 35:1339–1342
Guruge KS, Manage PM, Yamanaka N, Miyazaki S, Taniyasu S,
Yamashita N (2008) Species-specific concentrations of perfluo-
roalkyl contaminants in farm and pet animals in Japan.
Chemosphere 73:S210–S215
Harada KH, Koizumi A (2009) Environmental and biological
monitoring of persistent fluorinated compounds in Japan and
their toxicities. Environ Health Prev Med 14:7–19
Harada K, Saito N, Inoue K, Yoshinaga T, Watanabe T, Sasaki S et al
(2004) The influence of time, sex and geographic factors on
levels of perfluorooctane sulfonate and perfluorooctanoate in
human serum over the last 25 years. J Occup Health 46:141–147
Harada K, Koizumi A, Saito N, Inoue K, Yoshinaga T, Date C et al
(2007) Historical and geographical aspects of the increasing
perfluorooctanoate and perfluorooctane sulfonate contamination
in human serum in Japan. Chemosphere 66:293–301
Higgins CP, Field JA, Criddle CS, Luthy RG (2005) Quantitative
determination of perfluorochemicals in sediments and domestic
sludge. Environ Sci Technol 39:3946–3956
Hori H, Nagaoka Y, Yamamoto A, Sano T, Yamashita N, Taniyasu S
et al (2006) Efficient decomposition of environmentally persis-
tent perfluorooctanesulfonate and related fluorochemicals using
zerovalent iron in subcritical water. Environ Sci Technol 40:
1049–1054
Houde M, Martin JW, Letcher RJ, Solomon KR, Muir DCG (2006)
Biological monitoring of polyfluoroalkyl substances: a review.
Environ Sci Technol 40:3463–3473
Houde M, Gertje Czub G, Small JM, Backus S, Wang X, Alaee M
et al (2008) Fractionation and bioaccumulation of perfluorooc-
tane sulfonate (PFOS) isomers in a Lake Ontario food web.
Environ Sci Technol 42:9397–9403
Ishizuka M, Takasuga T, Senthil Kumar K, Tanikawa T, Fujita S
(2005) Accumulation of persistent organochlorine pollutants and
polybrominated diphenyl ether in wild rats, and toxicogenomic
analyses of their effects. Organohalogen Compd 67:2435–
2436
ISO25101 (2009) Water quality—determination of perfluorooctane-
sulfonate (PFOS) and perfluorooctanoate (PFOA)—method for
unfiltered samples using solid phase extraction and liquid
chromatography/mass spectrometry. The International Organi-
zation for Standardization, Geneva, p 24
Kannan K (2011) Perfluoroalkyl and polyfluoroalkyl substances:
current and future perspectives. Environ Chem 8:333–338
Kannan K, Choi JW, Iseki N, Senthil Kumar K, Kim DH, Masunaga S
et al (2002) Concentrations of perfluorinated acids in livers of
birds from Japan and Korea. Chemosphere 49:225–231
Kannan K, Corsolini S, Falandysz J, Fillmann G, Senthil Kumar K,
Loganathan BG et al (2004) Perfluorooctanesulfonate and related
fluorochemicals in human blood from several countries. Environ
Sci Technol 38:4489–4495
Kannan K, Tao L, Sinclair E, Pastva SD, Jude DJ, Giesy JP (2005)
Perfluorinated compounds in aquatic organisms at various
trophic levels in a Great Lakes food chain. Arch Environ
Contam Toxicol 48:559–566
Keil DE, Mehlmann T, Butterworth L, Peden-Adams MM (2008)
Gestational exposure to perfluorooctane sulfonate suppresses
immune function in B6C3F1 mice. Toxicol Sci 103:77–85
Kudo N, Suzuki-Nakajima E, Mitsumoto A, Kawashima Y (2006)
Responses of the liver to perfluorinated fatty acids with different
carbon chain length in male and female mice: in relation to
induction of hepatomegaly peroxisomal beta-oxidation and
microsomal 1-acylglycerophosphocholine acyltransferase. Biol
Pharm Bull 29:1952–1957
Lau C, Anitole K, Hodes C, Lai D, Pfahles-Hutchens A, Seed J (2007)
Perfluoroalkyl acids: a review of monitoring and toxicological
findings. Toxicol Sci 99:366–394
Li XM, Yeung LWY, Taniyasu S, Li M, Zhang HX, Liu D et al
(2008) Perfluorooctanesulfonate and related fluorochemicals in
the Amur tiger (Panthera tigris altaica) from China. Environ Sci
Technol 42:7078–7083
Liu C, Gin KY, Chang VW, Goh BP, Reinhard M (2011) Novel
perspectives on the bioaccumulation of PFCs—the concentration
dependency. Environ Sci Technol 45:9758–9764
Liu S, Li R, Ni X, Cai Z, Zhang R, Sun X et al (2012)
Perfluorocarbon-facilitated CNS oxygen toxicity in rats: Rever-
sal by edaravone. Brain Res 1471:56–65
Loos R, Wollgast J, Huber T, Hanke G (2007) Polar herbicides,
pharmaceutical products, perfluorooctanesulfonate (PFOS), per-
fluorooctanoate (PFOA), and nonylphenol and its carboxylates
and ethoxylates in surface and tap waters around Lake Maggiore
in Northern Italy. Anal Bioanal Chem 387:1469–1478
Mak YL, Taniyasu S, Yeung LWY, Lu GH, Jin L, Yang YL et al
(2009) Perfluorinated compounds in tap water from China and
several other countries. Environ Sci Technol 43:4824–4829
Miyake Y, Yamashita N, So MK, Rostkowski P, Taniyasu S, Lam
PKS et al (2007) Trace analysis of TF in human blood using
combustion ion chromatography for fluorine: a mass balance
approach for the determination of known and unknown organo-
fluorine compounds. J Chromatogr A 1154:214–221
Moody CA, Martin JW, Kwan WC, Muir DC, Mabury SA (2002)
Monitoring perfluorinated surfactants in biota and surface water
samples following an accidental release of fire-fighting foam into
Etobicoke Creek. Environ Sci Technol 36:545–551
Murakami M, Takada H (2008) Perfluorinated surfactants (PFSs)
in size-fractionated street dust in Tokyo. Chemosphere 73:
1172–1177
Murakami M, Imamura E, Shinohara H, Kiri K, Muramatsu Y, Harada
A et al (2008) Occurrence and sources of perfluorinated
surfactants in rivers in Japan. Environ Sci Technol 42:6566–6572
Naile JE, Khim JS, Wang TY, Chen CL, Luo W, Kwon BO et al
(2010) Perfluorinated compounds in water, sediment, soil and
biota from estuarine and coastal areas of Korea. Environ Pollut
158:1237–1244
Nakata H, Kannan K, Nasu T, Cho HS, Sinclair E, Takemura A (2006)
Perfluorinated contaminants in sediments and aquatic organisms
collected from shallow water and tidal flat areas of the Ariake
Sea, Japan: environmental fate of perfluorooctane sulfonate in
aquatic ecosystems. Environ Sci Technol 40:4916–4921
Oakes KD, Sibley PK, Martin JW, MacLean DD, Solomon KR,
Mabury SA et al (2005) Short-term exposures of fish to
perfluorooctane sulfonate: acute effects on fatty acyl-CoA
oxidase activity, oxidative stress, and circulating sex steroids.
Environ Toxicol Chem 24:1172–1181
Paustenbach DJ, Panko JM, Scott PK, Unice KM (2007) A
methodology for estimating human exposure to perfluoroocta-
noic acid (PFOA): a retrospective exposure assessment of a
community (1951–2003). J Toxicol Environ Health A 70:28–57
Quinones O, Snyder SA (2009) Occurrence of perfluoroalkyl carbox-
ylates and sulfonates in drinking water utilities and related waters
from the United States. Environ Sci Technol 43:9089–9095
Raj B, Tanaka S, Fujii S, Hong LNP, Nozoe M, Kunacheva C et al
(2011) Perfluorinated compounds (PFCs) in Yodo River system,
Japan. Water Sci Technol 63:115–123
Scott JP (1966) Agonistic behavior of mice and rats: a review. Am
Zool 6:683–701
Seacat AM, Thomford PJ, Hansen KJ, Olsen GW, Case MT,
Butenhoff JL (2002) Subchronic toxicity studies on perfluorooc-
tanesulfonate potassium salt in cynomolgus monkeys. Toxicol
Sci 68:249–264
Arch Environ Contam Toxicol (2013) 65:149–170 169
123

Senthil Kumar K (2005) Fluorinated organic chemicals: a review. Res
J Chem Environ 9:50–79
Senthil Kumar K, Takasuga T, Ishizuka M, Tanikawa T, Fujita S
(2005a) Contamination profiles of UNEP POPs and PBDEs in
brown rat collected from urban and rural regions of Japan.
Organohalogen Compd 67:615–618
Senthil Kumar K, Watanabe K, Takemori H, Iseki N, Masunaga S,
Takasuga T (2005b) Analysis of UNEP priority POPs using
HRGC-HRMS and their contamination profiles in livers and
eggs of great cormorants (Phalacrocorax carbo) from Japan.
Arch Environ Contam Toxicol 48:538–551
Senthil Kumar K, Ohi E, Sajwan KS, Takasuga T, Kannan K (2007)
Perfluorinatedcompounds in water, sediment and biological samples
from Kyoto, Japan. Bull Environ Contam Toxicol 79:427–431
Senthil Kumar K, Zushi Y, Masunaga S, Gilligan M, Pride C, Sajwan
KS (2009) Perfluorinated organic contaminants in sediment and
aquatic wildlife, including sharks, from Georgia, USA. Mar
Pollut Bull 58:621–629
Sinclair E, Kannan K (2006) Mass loading and fate of perfluoroalkyl
surfactants in wastewater treatment plants. Environ Sci Technol
40:1408–1414
Skutlarek D, Exner M, Farber H (2006) Perfluorinated surfactants in
surface and drinking water. Environ Sci Pollut Res 13:299–307
So MK, Miyake Y, Yeung WY, Ho YM, Taniyasu S, Rostkowski P
et al (2007) Perfluorinated compounds in the Pearl River and
Yangtze River of China. Chemosphere 68:2085–2095
Takasuga T, Ishizuka M, Senthil Kumar K, Tanikawa R, Fujita S
(2004) Accumulation of chlorinated and brominated persistent
toxic substances (PTS) and their relationship to testosterone
suppression in Norway rats from Japan. Organohalogen Compd
66:3057–3064
Tang CYY, Fu QS, Robertson AP, Criddle CS, Leckie JO (2006) Use
of reverse osmosis membranes to remove perfluorooctane
sulfonate (PFOS) from semiconductor wastewater. Environ Sci
Technol 40:7343–7349
Taniyasu S, Kannan K, Horii Y, Hanari N, Yamashita N (2003) A
survey of perfluorooctane sulfonate and related perfluorinated
organic compounds in water, fish, birds, and humans from Japan.
Environ Sci Technol 37:2634–2639
Taniyasu S, Kannan K, So MK, Gulkowska A, Sinclair E, Okazawa T
et al (2005) Analysis of fluorotelomer alcohols, fluorotelorner
acids, and short- and long-chain perfluorinated acids in water and
biota. J Chromatogr A 1093:89–97
Taniyasu S, Kannan K, Yeung LWY, Kwok KY, Lam PKS,
Yamashita N (2008) Analysis of trifluoroacetic acid and other
short-chain perfluorinated acids (C2–C4) in precipitation by
liquid chromatography-tandem mass spectrometry: comparison
to patterns of long-chain perfluorinated acids (C5–C18). Anal
Chim Acta 619:221–230
UNEP (2008) Report of the persistent organic pollutants review
committee on the work its fourth meeting. Addendum to the risk
management evaluation for perfluorooctane sulfonate. UNEP/
POPS/POPRCS.4/15/Add.6Width1.2008
Wang Y, Yeung LWY, Yamashita N, Taniyasu S, So MK, Murphy
MB et al (2008) Perfluorooctane sulfonate (PFOS) and related
fluorochemicals in chicken egg in China. Chin Sci Bull 53:
501–507
Wang T, Wang Y, Liao C, Cai Y, Jiang G (2009) Perspectives on the
inclusion of perfluorooctane sulfonate into the Stockholm
Convention on Persistent Organic Pollutants. Environ Sci
Technol 43:5171–5175
Wang T, Lu Y, Chen C, Naile JE, Khim JS, Giesy JP (2012)
Perfluorinated compounds in a coastal industrial area of Tianjin,
China. Environ Geochem Health 34:301–311
Yamashita N, Kannan K, Taniyasu S, Horii Y, Petrick G, Gamo T
(2005) A global survey of perfluorinated acids in oceans. Mar
Pollut Bull 51:658–668
Yamashita N, Yeung LWY, Taniyasu S, Kwok KY, Petrick G, Gamo T
et al (2012) Global distribution of PFOS and related chemicals. In:
Loganathan BG, Lam PKS (eds) Global contamination trends of
persistent organic chemicals. CRC Press, Boca Raton, pp 593–628
Yeung LWY, Miyake Y, Wang Y, Taniyasu S, Yamashita N, Lam
PKS (2009a) Total fluorine, extractable organic fluorine,
perfluorooctane sulfonate and other related fluorochemicals in
liver of Indo-Pacific humpback dolphins (Sousa chinensis) and
finless porpoises (Neophocaena phocaenoides) from South
China. Environ Pollut 157:17–23
Yeung LWY, Taniyasu S, Kannan K, Xu DZY, Guruge KS, Lam PKS
et al (2009b) An analytical method for the determination of
perfluorinated compounds in whole blood using acetonitrile
and solid phase extraction methods. J Chromatogr A 1216:
4950–4956
Yeung LWY, Miyake Y, Li P, Taniyasu S, Kannan K, Guruge KS et al
(2009c) Comparison of total fluorine, extractable organic fluorine
and perfluorinated compounds in the blood of wild and pefluorooct-
anoate (PFOA)-exposed rats: evidence for the presence of other
organofluorine compounds. Anal Chim Acta 635:108–114
Zhang C, Li Z, Gu M, Deng C, Liu M, Li L (2010) Spatial and
vertical distribution and pollution assessment of soil fluorine in a
lead-zinc mining area in the Karst region of Guangxi, China.
Plant Soil Environ 56:282–287
Zushi Y, Masunaga S (2009) Identifying the nonpoint source of
perfluorinated compounds using a geographic information sys-
tem based approach. Environ Toxicol Chem 28:691–700
Zushi Y, Tamada M, Kanai Y, Masunaga S (2010) Time trends of
perfluorinated compounds from the sediment core of Tokyo Bay,
Japan (1950s–2004). Environ Pollut 158:756–763
170 Arch Environ Contam Toxicol (2013) 65:149–170
123