incorporation of recycled tire products in pavement-grade
TRANSCRIPT
crystals
Article
Incorporation of Recycled Tire Products in Pavement-GradeConcrete: An Experimental Study
Sayed Mohamad Soleimani *, Abdel Rahman Alaqqad, Adel Jumaah, Naser Mohammad and Alanoud Faheiman
�����������������
Citation: Soleimani, S.M.; Alaqqad,
A.R.; Jumaah, A.; Mohammad, N.;
Faheiman, A. Incorporation of
Recycled Tire Products in
Pavement-Grade Concrete: An
Experimental Study. Crystals 2021, 11,
161. https://doi.org/10.3390/
cryst11020161
Academic Editor: Piotr Smarzewski
Received: 19 January 2021
Accepted: 3 February 2021
Published: 6 February 2021
Publisher’s Note: MDPI stays neutral
with regard to jurisdictional claims in
published maps and institutional affil-
iations.
Copyright: © 2021 by the authors.
Licensee MDPI, Basel, Switzerland.
This article is an open access article
distributed under the terms and
conditions of the Creative Commons
Attribution (CC BY) license (https://
creativecommons.org/licenses/by/
4.0/).
Department of Civil Engineering, Australian College of Kuwait, P.O. Box 1411, Safat 13015, Kuwait;[email protected] (A.R.A.); [email protected] (A.J.); [email protected] (N.M.);[email protected] (A.F.)* Correspondence: [email protected]; Tel.: +965-1828225 (ext. 4046)
Abstract: The phenomenon of dumping used tires in Kuwait has reached critical levels, with a landfillcontaining millions of tires being formed in a remote area, which is a major environmental hazard.Nowadays, recycled rubber is used as a suitable and useful material in civil engineering applications,particularly in the production of “green concrete”. This study aims to see whether recycled tireby-products can be used to make “green concrete” for pavements. Each type of tire by-productwas tested individually to examine its properties and effects on a benchmark mix before creatinghybrid mixes that contain a combination of the materials. Eleven mixes containing different doses ofshredded or crumbed rubber or steel fibers contained within the tires were made to evaluate theirimpact on the concrete’s slump, compressive strength, split tensile strength, and modulus of rupture.Additionally, twelve hybrid concrete mixes containing different doses of various tire by-productswere developed. Preliminary results show that the incorporation of rubber products has a reductionon the concrete’s properties. The use of replacement materials sourced from recycled tires using thedosages investigated in this study does not detract from the usability of green pavement concretesuited for hot weather. The concrete produced in this study could be evaluated for specific propertiesrelating to its road safety in further studies. Additionally, long-term effects of using the concrete canbe studied using finite element analysis.
Keywords: green concrete; shredded rubber; crumbed rubber; steel fiber; recycled tire; pavement;waste materials; sustainability
1. Introduction
The management of used tires in Kuwait is considered as a significant environmentalchallenge [1]. Millions of used tires are dumped to open landfill in Kuwait, although thestorage of this type of waste could be a major environmental hazard [2]. As the temperaturein Kuwait commonly exceeds 50 ◦C during the summer, several massive fires previouslydestroyed the waste tires, causing serious environmental issues [3–6]. Additionally, thedisposal of waste tires in general represents an important environmental concern as thenatural degradation of rubber takes several years [7].
Due to an exponential growth in the use of cars in Kuwait, the accumulation ofused tires poses a serious risk to the ecosystem; therefore, recycling waste products isvital [8–10]. Recently, great effort has been directed toward finding alternate ways to usewaste materials emerging in the world [11–13]. Researchers have found that the recyclingof waste rubber tires has several environmental and economic advantages [11,14–16].Nowadays, the recycled rubber is considered as a suitable and useful material in civilengineering applications [7,17,18]. In general, the recycling of the waste tires goes througha process of shredding, separation of components, and granulation in order to convert thetires into ground tire rubber [19].
In most studies, the recycled rubber is classified into three main categories such asshredded rubber (also known as chipped rubber), crumb rubber, and ground rubber [18,20].
Crystals 2021, 11, 161. https://doi.org/10.3390/cryst11020161 https://www.mdpi.com/journal/crystals

Crystals 2021, 11, 161 2 of 19
According to an analytical review done by Lavanga et al., the mechanical response of rubberconcrete is affected by different factors such as the rubber content granulometry of boththe substituted mineral aggregate (coarse or fine) and the added rubber, the introductionof additives, the quantities of all components within the formulation, the water-to-cementratio, and the appropriate pre-treatments and surface coatings [13].
A study conducted by Aiello and Leuzzi [21] to investigate the properties of variousconcrete mixtures concluded that the waste rubber tire can be used toward making work-able rubberized concrete. The same study found that the rubberized concrete mixturesshowed lower unit weight compared to plain concrete [21]. The literature indicated thatthe compressive strength of rubberized concrete decreases by increasing the particle sizeand rubber content [11,17,18,22]. Moreover, several studies established an improvementin compressive and tensile strengths in the mixture containing coated rubber crumb andsilica fume [23–25].
Meddah et al. [2] recognized that adding shredded rubber can improve the perfor-mance of concrete by modifying the roughness of rubber particle surfaces. In addition, thesame study pointed that using rubber particles showed improvement in some characteris-tics such as porosity, ductility, and cracking resistance performance.
Khan and Singh [26] investigated the partial replacement of sand by tire crumbrubber with 5%, 10%, and 15% replacement. The compressive and tensile strengths of therubberized concrete were reduced by 15% and 43% respectively.
Sofi [27] tested high-strength concrete specimens by replacing 5%, 7.5%, and 10% ofaggregate with rubber and reported a reduction of 10–23% in the compressive strength.The same study showed that the modulus of elasticity of the rubberized concrete wasreduced by 17–25% and recommended a maximum replacement of 12.5% of fine aggregateby rubber for high strength concrete.
Akinwonmi and Seckley [28] investigated the change in compressive strength ofconcrete when the aggregates were replaced with shredded and crumb rubber. The resultsshowed that the replacement of 2.5% shredded rubber increased the compressive strengthby 8.5%, while any replacement of more than 2.5% rubber decreased the compressivestrength when compared to the control mix.
Issa and Salem [29] reported that partial replacement of the sand with crumb rubberup to 25% would result in an acceptable compressive strength for the concrete. He indicatedthat increasing the rubber content above this threshold would reduce the compressivestrength substantially that the mix would not be acceptable for structural or even non-structural applications.
Recently, Irmawaty et al. [30] investigated the flexural behavior of the concrete made inpart by using waste rubber tires. They tested specimens with 100 mm × 100 mm × 400 mmand with the replacement of 10%, 20%, and 30% of crumb rubber and tire chips. They con-cluded that rubberized concrete with 10% crumb rubber achieved the optimalenergy absorption.
The literature made it clear that the greater the amount of steel fibers in the concrete,the greater the value of strength and flexural toughness [31–34]. Therefore, the addition ofsteel fiber appears to improve the tensile and compressive strengths [32,34,35].
Gul and Nasser [32] conducted a study to investigate the behavior of concrete byusing the waste rubber tires as an alternative to steel fiber in fiber-reinforced concrete. Theyconcluded that by increasing the percentage replacement of rubber, the compressive andsplit tensile strengths of concrete decrease compared to specimens containing steel fiber.
Manufactured steel fibers and steel fibers extracted from tire waste have been used indifferent concrete mixes to compare their effectiveness [33]. The increase in both reusedand normal steel fibers showed less slump values for fresh concrete. The initial modulus ofelasticity increased by 7–8% for the mixes with normal steel fibers and 2–3% for the mixeswith reused steel fibers. The compressive strength of the mix with reused fibers increasedby a maximum of 12%, while the mix with normal fibers increased by a maximum of 20%.

Crystals 2021, 11, 161 3 of 19
No significant increase was noticed in the splitting tensile strength test between the twomixes while increasing the fiber dosage.
Some researchers examined the hybrid concrete mixes: for example, Noaman et al. [34]investigated the mechanical properties of rubberized concrete combined with steel fiber.They combined rubberized concrete with different replacement ratios of crumb rubber inplain and steel fiber concrete mixes via the partial replacement of fine aggregate (17.5%,20%, 22.5%, and 25%). The study indicated that a reduction in mechanical properties wasobserved by the increasing increment of crumb rubber in both mixes. The study suggestedusing a combination of steel fiber and crumb rubber due to the improvement of straincapacity under flexural loading.
As well, Eisa et al. [35] studied the effect of a combination of crumb rubber and steelfibers on the behavior of reinforced concrete beams under static loads. They concludedthat an acceptable level of performance of reinforced concrete beams could be obtainedby using crumb rubber as a partial replacement of fine aggregates by 5% and 10%. Thestudy also recommended the use of steel fibers with rubberized concrete, with percentagesof rubber over 10%, as this showed a significant improvement in the performance andtoughness of these mixtures.
As per the above literature review, researchers directed great attention to investigat-ing the utilization of recycled tire rubber in concrete in order to find a proper solutionfor minimizing tire waste and producing a green concrete. In spite of the reduction inmechanical properties due to increasing the rubber content in the mix [11,13,17,18,22,31], itis still recommended to use rubber particles in civil engineering applications, especially inpavement projects [2,11,15,17,20,35,36].
The objective of this study is to investigate whether recycled tire by-products canbe used to make a suitable “green concrete” to be used for pavement construction inhot-weather climates. To achieve optimal results, each type of tire by-product was testedindividually to observe its properties and effects on a benchmark mix before creating“hybrid” mixes that contain a combination of the materials; this is where the novelty of thisstudy lies.
2. Materials and Methods2.1. Benchmark Concrete Mix Design
In this study, a benchmark pavement-grade concrete mix with a 28-day compressivestrength of about 35 MPa has been designed and cast. Concrete pavements are preferred inKuwait due to their ability to resist high temperatures without causing permanent damageto the pavement itself. However, concrete used in hot climates is subjected to high rates ofevaporation, loss of moisture, and quick setting times [37]. As a result, concrete mixes usedin hot weather climates need to have a slump value at the higher end of the recommendedrange for pavements. This was achieved by introducing a superplasticizer in order toimprove the workability of the mix and reach the targeted 28-day compressive strengthwhile limiting the water/cement ratio to 0.55. The mix proportions of the benchmarkconcrete used for the study are shown in Table 1.
Table 1. Mix design propositions of benchmark pavement-grade concrete.
Material Quantity
Cement (kg/m3) 327Sand (kg/m3) 663
Coarse aggregates: 9.5 mm (kg/m3) 740Coarse aggregates: 12.5 mm (kg/m3) 442
Water (kg/m3) 180SIKAment®-500 OM Superplasticizer (% of binder weight) 2.00
Water/Cement ratio 0.55

Crystals 2021, 11, 161 4 of 19
To achieve the desired workability, SIKAment®-500 OM superplasticizer is used. Thisis important for hot climate places.
2.2. Recycled Tire Products
Crumb rubber (CR), shredded rubber (SR), and steel fibers (SF) were obtained byrecycling used tires (Figure 1). These products are easily available in the market, as tires arenow recycled around the world. The tire rubber used in this study is varied in source but isbelieved to contain percentages of natural and synthetic hydrophobic rubber optimizedfor automobile use. For this study, the recycled tire products were provided by the GreenRubber Tire Recycling Plant in Kuwait.
Crystals 2021, 11, x FOR PEER REVIEW 4 of 20
Table 1. Mix design propositions of benchmark pavement-grade concrete.
Material Quantity Cement (kg/m3) 327
Sand (kg/m3) 663 Coarse aggregates: 9.5 mm (kg/m3) 740
Coarse aggregates: 12.5 mm (kg/m3) 442 Water (kg/m3) 180
SIKAment®-500 OM Superplasticizer (% of binder weight) 2.00 Water/Cement ratio 0.55
To achieve the desired workability, SIKAment®-500 OM superplasticizer is used. This is important for hot climate places.
2.2. Recycled Tire Products Crumb rubber (CR), shredded rubber (SR), and steel fibers (SF) were obtained by
recycling used tires (Figure 1). These products are easily available in the market, as tires are now recycled around the world. The tire rubber used in this study is varied in source but is believed to contain percentages of natural and synthetic hydrophobic rubber op-timized for automobile use. For this study, the recycled tire products were provided by the Green Rubber Tire Recycling Plant in Kuwait.
Figure 1. Crumb rubber, shredded rubber, and steel fibers obtained by recycling used tires.
CR and SR are used as a partial replacement for the sand and coarse aggregates re-spectively. SF is used as an extra ingredient in different concrete mixes.
2.2.1. Crumb Rubber (CR) The density of CR used in this study is 552 kg/m3. The size distribution, by sieve
analysis, is shown in Figure 2 and is compared with the size distribution of the sand used in this project. The particle size distribution of the sand is close to being well-graded, whereas the CR is uniformly graded. Ideally, the CR would be introduced to replace a similarly sized portion of the sand; however, this is not feasible in real-life applications. Therefore, a direct replacement of sand with CR is used.
Figure 1. Crumb rubber, shredded rubber, and steel fibers obtained by recycling used tires.
CR and SR are used as a partial replacement for the sand and coarse aggregatesrespectively. SF is used as an extra ingredient in different concrete mixes.
2.2.1. Crumb Rubber (CR)
The density of CR used in this study is 552 kg/m3. The size distribution, by sieveanalysis, is shown in Figure 2 and is compared with the size distribution of the sand used inthis project. The particle size distribution of the sand is close to being well-graded, whereasthe CR is uniformly graded. Ideally, the CR would be introduced to replace a similarlysized portion of the sand; however, this is not feasible in real-life applications. Therefore, adirect replacement of sand with CR is used.
Crystals 2021, 11, x FOR PEER REVIEW 5 of 20
Figure 2. Size distribution of crumb rubber and sand used in this study.
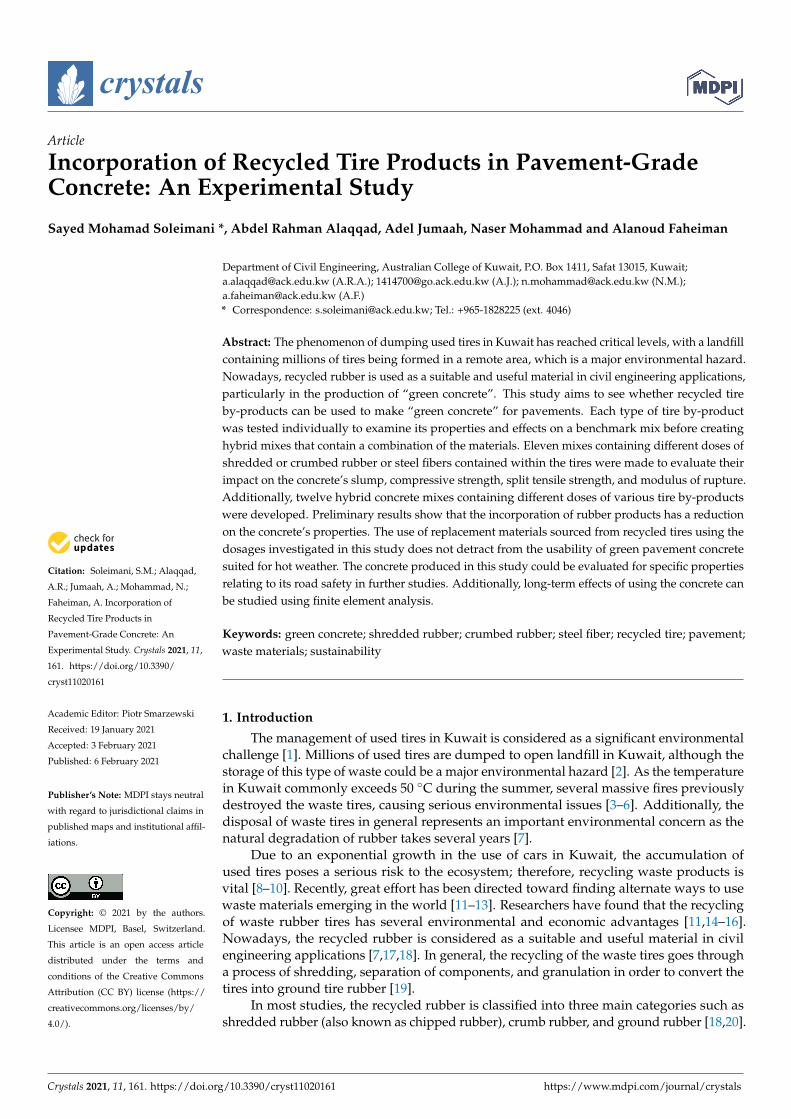
2.2.2. Shredded Rubber (SR) The density of SR used in this study is 566 kg/m3. SR obtained from the recycling
plant has been sieved, and particles smaller than 12.5 mm are used to make sure that similarly-sized SR particles are used in the partial replacement of the coarse aggregates. The size distribution of the SR, which is also compared with that of the coarse aggregates (9.5 mm and 12.5 mm), is shown in Figure 3. The particle size distribution for both sizes of coarse aggregate as well as the SR are more or less well-distributed, and interestingly, the particle size distribution of the SR fits in between the two sizes of coarse aggregates used in this study. Therefore, a direct replacement of both sizes of coarse aggregates with SR is used.
Figure 3. Size distribution of shredded rubber and coarse aggregates used in this study.
2.2.3. Steel Fibers (SF) The density of SR used in this study is 7850 kg/m3. The length and diameter of 100
randomly selected steel fibers have been measured, and the results are shown in Table 2.
Table 2. Steel fibers dimensions.
Dimension Average Standard Deviation Length (mm) 24 8.6
Diameter (mm) 0.34 0.076
0
20
40
60
80
100
0.01 0.1 1 10 100
Perc
enta
ge F
iner
(%)
Diameter (mm)
Particle Size Distribution for CR compared with Fine Aggregates
CR Sand
0
20
40
60
80
100
0.1 1 10 100
Perc
enta
ge F
iner
(%)
Diameter (mm)
Particle Size Distribution for SR compared with 9.5mm and 12.5mm aggregates
12.5mm Aggregates 9.5mm Aggregates Shredded Rubber
Figure 2. Size distribution of crumb rubber and sand used in this study.
Crystals 2021, 11, 161 5 of 19
2.2.2. Shredded Rubber (SR)
The density of SR used in this study is 566 kg/m3. SR obtained from the recyclingplant has been sieved, and particles smaller than 12.5 mm are used to make sure thatsimilarly-sized SR particles are used in the partial replacement of the coarse aggregates.The size distribution of the SR, which is also compared with that of the coarse aggregates(9.5 mm and 12.5 mm), is shown in Figure 3. The particle size distribution for both sizes ofcoarse aggregate as well as the SR are more or less well-distributed, and interestingly, theparticle size distribution of the SR fits in between the two sizes of coarse aggregates usedin this study. Therefore, a direct replacement of both sizes of coarse aggregates with SRis used.
Crystals 2021, 11, x FOR PEER REVIEW 5 of 20
Figure 2. Size distribution of crumb rubber and sand used in this study.
2.2.2. Shredded Rubber (SR) The density of SR used in this study is 566 kg/m3. SR obtained from the recycling
plant has been sieved, and particles smaller than 12.5 mm are used to make sure that similarly-sized SR particles are used in the partial replacement of the coarse aggregates. The size distribution of the SR, which is also compared with that of the coarse aggregates (9.5 mm and 12.5 mm), is shown in Figure 3. The particle size distribution for both sizes of coarse aggregate as well as the SR are more or less well-distributed, and interestingly, the particle size distribution of the SR fits in between the two sizes of coarse aggregates used in this study. Therefore, a direct replacement of both sizes of coarse aggregates with SR is used.
Figure 3. Size distribution of shredded rubber and coarse aggregates used in this study.
2.2.3. Steel Fibers (SF) The density of SR used in this study is 7850 kg/m3. The length and diameter of 100
randomly selected steel fibers have been measured, and the results are shown in Table 2.
Table 2. Steel fibers dimensions.
Dimension Average Standard Deviation Length (mm) 24 8.6
Diameter (mm) 0.34 0.076
0
20
40
60
80
100
0.01 0.1 1 10 100
Perc
enta
ge F
iner
(%)
Diameter (mm)
Particle Size Distribution for CR compared with Fine Aggregates
CR Sand
0
20
40
60
80
100
0.1 1 10 100
Perc
enta
ge F
iner
(%)
Diameter (mm)
Particle Size Distribution for SR compared with 9.5mm and 12.5mm aggregates
12.5mm Aggregates 9.5mm Aggregates Shredded Rubber
Figure 3. Size distribution of shredded rubber and coarse aggregates used in this study.
2.2.3. Steel Fibers (SF)
The density of SR used in this study is 7850 kg/m3. The length and diameter of 100 ran-domly selected steel fibers have been measured, and the results are shown in Table 2.
Table 2. Steel fibers dimensions.
Dimension Average Standard Deviation
Length (mm) 24 8.6Diameter (mm) 0.34 0.076
2.3. Concrete Mixes Containing Recycled Tire Products
A total of 24 concrete mixes are cast, including the benchmark. The mix codes anddescriptions are shown in Table 3. SR, CR, and SF in the concrete mix codes show thepresence of shredded rubber, crumb rubber, and steel fiber in the concrete mix respectively.When combinations of SF, CR, and SF are used in a concrete mix, the code starts withan “H.”
For each concrete mix, a total of 14 cylinders (100 mm diameter by 200 mm height) and3 beams (100 mm × 100 mm × 400 mm) are cast and sulfur-capped as per ASTM C617 [38].A minimum of 3 cylinders are tested to calculate the tensile strength at 28 days as perASTM C496 [39]. Similarly, a minimum of 3 cylinders are used to calculate the compressivestrength at 7 and 28 days (Figure 4) as per ASTM C39 [40]. For the benchmark concreteonly, 3 cylinders are tested at 3 days under compression.

Crystals 2021, 11, 161 6 of 19
Table 3. Concrete mixes and descriptions.
No. Code Description
1 BM Benchmark concrete with no recycled tire products
2 SR-1 5% (by volume) of coarse aggregates (9.5 and 12.5 mm) is replaced byshredded rubber
3 SR-2 10% (by volume) of coarse aggregates (9.5 and 12.5 mm) is replaced byshredded rubber
4 SR-3 15% (by volume) of coarse aggregates (9.5 and 12.5 mm) is replaced byshredded rubber
5 SR-4 20% (by volume) of coarse aggregates (9.5 and 12.5 mm) is replaced byshredded rubber
6 CR-1 5% (by volume) of sand is replaced by crumb rubber
7 CR-2 10% (by volume) of sand is replaced by crumb rubber
8 CR-3 15% (by volume) of sand is replaced by crumb rubber
9 CR-4 20% (by volume) of sand is replaced by crumb rubber
10 SF-1 0.1% steel fibers are added to BM (by volume of concrete)
11 SF-2 0.2% steel fibers are added to BM (by volume of concrete)
12 SF-3 0.3% steel fibers are added to BM (by volume of concrete)
13 H-15% (by volume) of coarse aggregates (9.5 and 12.5 mm) is replaced by
shredded rubber and 0.1% steel fibers (by volume of concrete) are added tothe mix
14 H-210% (by volume) of coarse aggregates (9.5 and 12.5 mm) is replaced by
shredded rubber and 0.1% steel fibers (by volume of concrete) are added tothe mix
15 H-315% (by volume) of coarse aggregates (9.5 and 12.5 mm) is replaced by
shredded rubber and 0.1% steel fibers (by volume of concrete) are added tothe mix
16 H-420% (by volume) of coarse aggregates (9.5 and 12.5 mm) is replaced by
shredded rubber and 0.1% steel fibers (by volume of concrete) are added tothe mix
17 H-5 5% (by volume) of sand is replaced by crumb rubber and 0.1% steel fibers(by volume of concrete) are added to the mix
18 H-6 10% (by volume) of sand is replaced by crumb rubber and 0.1% steel fibers(by volume of concrete) are added to the mix
19 H-7 15% (by volume) of sand is replaced by crumb rubber and 0.1% steel fibers(by volume of concrete) are added to the mix
20 H-8 20% (by volume) of sand is replaced by crumb rubber and 0.1% steel fibers(by volume of concrete) are added to the mix
21 H-95% (by volume) of coarse aggregates (9.5 and 12.5 mm) is replaced by
shredded rubber, 5% (by volume) of sand is replaced by crumb rubber, and0.1% steel fibers (by volume of concrete) are added to the mix
22 H-1010% (by volume) of coarse aggregates (9.5 and 12.5 mm) is replaced byshredded rubber, 10% (by volume) of sand is replaced by crumb rubber,
and 0.1% steel fibers (by volume of concrete) are added to the mix
23 H-11 5% (by volume) of coarse aggregates (9.5 and 12.5 mm) is replaced byshredded rubber and 5% (by volume) of sand is replaced by crumb rubber
24 H-12 10% (by volume) of coarse aggregates (9.5 and 12.5 mm) is replaced byshredded rubber and 10% (by volume) of sand is replaced by crumb rubber

Crystals 2021, 11, 161 7 of 19
Crystals 2021, 11, x FOR PEER REVIEW 7 of 20
and 0.1% steel fibers (by volume of concrete) are added to the mix
23 H-11 5% (by volume) of coarse aggregates (9.5 and 12.5 mm) is replaced by shredded rubber and 5% (by volume) of sand is replaced by crumb rubber
24 H-12 10% (by volume) of coarse aggregates (9.5 and 12.5 mm) is replaced by shredded rubber and 10% (by volume) of sand is replaced by crumb rubber
For each concrete mix, a total of 14 cylinders (100 mm diameter by 200 mm height) and 3 beams (100 mm × 100 mm × 400 mm) are cast and sulfur-capped as per ASTM C617 [38]. A minimum of 3 cylinders are tested to calculate the tensile strength at 28 days as per ASTM C496 [39]. Similarly, a minimum of 3 cylinders are used to calculate the com-pressive strength at 7 and 28 days (Figure 4) as per ASTM C39 [40]. For the benchmark concrete only, 3 cylinders are tested at 3 days under compression.
Third-point loading tests (Figure 5) are performed on the beams to obtain the mod-ulus of rupture of the concrete mix as per ASTM C78 [41].
(a) (b)
Figure 4. Test of a concrete cylindrical sample (a) Compression; and (b) Tension.
Figure 5. Third-point loading test to obtain the modulus of rupture.
Figure 4. Test of a concrete cylindrical sample (a) Compression; and (b) Tension.
Third-point loading tests (Figure 5) are performed on the beams to obtain the modulusof rupture of the concrete mix as per ASTM C78 [41].
Crystals 2021, 11, x FOR PEER REVIEW 7 of 20
and 0.1% steel fibers (by volume of concrete) are added to the mix
23 H-11 5% (by volume) of coarse aggregates (9.5 and 12.5 mm) is replaced by shredded rubber and 5% (by volume) of sand is replaced by crumb rubber
24 H-12 10% (by volume) of coarse aggregates (9.5 and 12.5 mm) is replaced by shredded rubber and 10% (by volume) of sand is replaced by crumb rubber
For each concrete mix, a total of 14 cylinders (100 mm diameter by 200 mm height) and 3 beams (100 mm × 100 mm × 400 mm) are cast and sulfur-capped as per ASTM C617 [38]. A minimum of 3 cylinders are tested to calculate the tensile strength at 28 days as per ASTM C496 [39]. Similarly, a minimum of 3 cylinders are used to calculate the com-pressive strength at 7 and 28 days (Figure 4) as per ASTM C39 [40]. For the benchmark concrete only, 3 cylinders are tested at 3 days under compression.
Third-point loading tests (Figure 5) are performed on the beams to obtain the mod-ulus of rupture of the concrete mix as per ASTM C78 [41].
(a) (b)
Figure 4. Test of a concrete cylindrical sample (a) Compression; and (b) Tension.
Figure 5. Third-point loading test to obtain the modulus of rupture. Figure 5. Third-point loading test to obtain the modulus of rupture.
3. Results3.1. Slump Test Results
For a pavement-grade concrete mix in a hot climate, a target slump of 70 mm ± 30 mmis set. The slump of the benchmark concrete, BM, was 75 mm, and the slump of all otherconcrete mixes were within the targeted range. The slump test results are compared inFigure 6. It is worth mentioning that in all mixes, oven-dried sand and aggregates are usedto ensure consistency in water-to-cement ratio. In addition, to improve the workability ofconcrete mixes, superplasticizer is used in all mixes (2.0% to 2.5% of the weight of cement).Since 2.0% is used for the benchmark, a minimum amount of 2.0% is used in all other mixes;if the workability is not desirable, an extra 0.5% is added to the mix.

Crystals 2021, 11, 161 8 of 19Crystals 2021, 11, x FOR PEER REVIEW 9 of 21
(a)
(b)
(c)
0102030405060708090
100
BM SR-1 SR-2 SR-3 SR-4
Slum
p (m
m)
Comparing Slump of BM with SR Mixes
0102030405060708090
100
BM CR-1 CR-2 CR-3 CR-4
Slum
p (m
m)
Comparing Slump of BM with CR Mixes
0102030405060708090
100
BM SF-1 SF-2 SF-3
Slum
p (m
m)
Comparing Slump of BM with SF Mixes
Figure 6. Cont.

Crystals 2021, 11, 161 9 of 19Crystals 2021, 11, x FOR PEER REVIEW 10 of 21
(d)
Figure 6. Comparing the slump test results of benchmark (75 mm) with (a) shredded rubber (SR); (b) crumb rubber (CR); (c) steel fibers (SF); and (d) Hybrid (i.e., H) mixes.
3.2. Density of Concrete The BM’s density is 2390 kg/m3. Replacing the coarse aggregates and sand by SR and
CR respectively reduces the density. For example, the density of SR-4 and CR-4 is 2317 kg/m3 and 2362 kg/m3, respectively. On the other hand, the addition of SF increases the density; for example, SF-3 has a density of 2425 kg/m3. In the hybrid mixes (i.e., H-1 to H-12), the maximum density is seen in H-5 (2402 kg/m3) and the minimum is seen in H-4 (2314 kg/m3).
3.3. Compressive Strength A minimum of 3 cylinders are tested in order to obtain the compressive strength.
Figure 7 shows the compressive strength of BM mix at 3, 7, and 28 days. All other mixes are tested at 7 and 28 days. The compressive strength of SR, CR, and SF mixes at these two ages are compared with those of the BM mix in Figure 8. Similarly, the compressive strength of hybrid mixes (H-1 to H-12) are compared with BM in Figure 9.
Figure 7. Compressive strength of the benchmark mix at 3, 7, and 28 days.
15
20
25
30
35
3 7 28Com
pres
sive
Stre
ngth
(MPa
)
Curing Age (days)
Compressive Strength of BM
BM
Figure 6. Comparing the slump test results of benchmark (75 mm) with (a) shredded rubber (SR); (b)crumb rubber (CR); (c) steel fibers (SF); and (d) Hybrid (i.e., H) mixes.
3.2. Density of Concrete
The BM’s density is 2390 kg/m3. Replacing the coarse aggregates and sand by SRand CR respectively reduces the density. For example, the density of SR-4 and CR-4 is2317 kg/m3 and 2362 kg/m3, respectively. On the other hand, the addition of SF increasesthe density; for example, SF-3 has a density of 2425 kg/m3. In the hybrid mixes (i.e., H-1 toH-12), the maximum density is seen in H-5 (2402 kg/m3) and the minimum is seen in H-4(2314 kg/m3).
3.3. Compressive Strength
A minimum of 3 cylinders are tested in order to obtain the compressive strength.Figure 7 shows the compressive strength of BM mix at 3, 7, and 28 days. All other mixesare tested at 7 and 28 days. The compressive strength of SR, CR, and SF mixes at thesetwo ages are compared with those of the BM mix in Figure 8. Similarly, the compressivestrength of hybrid mixes (H-1 to H-12) are compared with BM in Figure 9.
Crystals 2021, 11, x FOR PEER REVIEW 10 of 20
Figure 7. Compressive strength of the benchmark mix at 3, 7, and 28 days.
(a)
(b)
15
20
25
30
35
3 7 28Com
pres
sive
Stre
ngth
(MPa
)
Curing Age (days)
Compressive Strength of BM
BM
15
20
25
30
35
7 28Com
pres
sive
Stre
ngth
(MPa
)
Curing Age (days)
Compressive Strength of BM and SR Mixes
BM
SR-1
SR-2
SR-3
SR-4
15
20
25
30
35
7 28Com
pres
sive
Stre
ngth
(MPa
)
Curing Age (days)
Compressive Strength of BM and CR Mixes
BM
CR-1
CR-2
CR-3
CR-4
Figure 7. Compressive strength of the benchmark mix at 3, 7, and 28 days.

Crystals 2021, 11, 161 10 of 19
Crystals 2021, 11, x FOR PEER REVIEW 10 of 20
Figure 7. Compressive strength of the benchmark mix at 3, 7, and 28 days.
(a)
(b)
15
20
25
30
35
3 7 28Com
pres
sive
Stre
ngth
(MPa
)
Curing Age (days)
Compressive Strength of BM
BM
15
20
25
30
35
7 28Com
pres
sive
Stre
ngth
(MPa
)
Curing Age (days)
Compressive Strength of BM and SR Mixes
BM
SR-1
SR-2
SR-3
SR-4
15
20
25
30
35
7 28Com
pres
sive
Stre
ngth
(MPa
)
Curing Age (days)
Compressive Strength of BM and CR Mixes
BM
CR-1
CR-2
CR-3
CR-4
Crystals 2021, 11, x FOR PEER REVIEW 11 of 20
(c)
Figure 8. Comparing the compressive strength of the benchmark mix with (a) SR; (b) CR; and (c) SF mixes.
(a)
(b)
15
20
25
30
35
7 28Com
pres
sive
Stre
ngth
(MPa
)
Curing Age (days)
Compressive Strength of BM and SF Mixes
BM
SF-1
SF-2
SF-3
15
20
25
30
35
7 28Com
pres
sive
Stre
ngth
(MPa
)
Curing Age (days)
Compressive Strength of BM and Hybrid Mixes (H-1 to H-4)
BM
H-1
H-2
H-3
H-4
15
20
25
30
35
7 28Com
pres
sive
Stre
ngth
(MPa
)
Curing Age (days)
Compressive Strength of BM and Hybrid Mixes (H-5 to H-8)
BM
H-5
H-6
H-7
H-8
Figure 8. Comparing the compressive strength of the benchmark mix with (a) SR; (b) CR; and (c)SF mixes.

Crystals 2021, 11, 161 11 of 19
Crystals 2021, 11, x FOR PEER REVIEW 11 of 20
(c)
Figure 8. Comparing the compressive strength of the benchmark mix with (a) SR; (b) CR; and (c) SF mixes.
(a)
(b)
15
20
25
30
35
7 28Com
pres
sive
Stre
ngth
(MPa
)
Curing Age (days)
Compressive Strength of BM and SF Mixes
BM
SF-1
SF-2
SF-3
15
20
25
30
35
7 28Com
pres
sive
Stre
ngth
(MPa
)
Curing Age (days)
Compressive Strength of BM and Hybrid Mixes (H-1 to H-4)
BM
H-1
H-2
H-3
H-4
15
20
25
30
35
7 28Com
pres
sive
Stre
ngth
(MPa
)
Curing Age (days)
Compressive Strength of BM and Hybrid Mixes (H-5 to H-8)
BM
H-5
H-6
H-7
H-8
Crystals 2021, 11, x FOR PEER REVIEW 12 of 20
(c)
Figure 9. Comparing the compressive strength of the benchmark mix with hybrid mixes (a) H-1 to H-4; (b) H-5 to H-8; and (c) H-9 to H-12.
3.4. Tensile Strength A splitting tensile test is performed on 3 cylinders for each mix, and the average
tensile strength of the benchmark mix is compared with that of all other mixes in Figure 10.
(a)
(b)
15
20
25
30
35
7 28
Com
pres
sive
Stre
ngth
(MPa
)
Curing Age (days)
Compressive Strength of BM and Hybrid Mixes (H-9 to H-12)
BM
H-9
H-10
H-11
H-12
0.00
0.50
1.00
1.50
2.00
2.50
3.00
3.50
BM SR-1 SR-2 SR-3 SR-4
Tens
ile S
tren
gth
(MPa
)
Tensile Strength of BM and SR Mixes
0.00
0.50
1.00
1.50
2.00
2.50
3.00
3.50
BM CR-1 CR-2 CR-3 CR-4
Tens
ile S
tren
gth
(MPa
)
Tensile Strength of BM and CR Mixes
Figure 9. Comparing the compressive strength of the benchmark mix with hybrid mixes (a) H-1 toH-4; (b) H-5 to H-8; and (c) H-9 to H-12.
3.4. Tensile Strength
A splitting tensile test is performed on 3 cylinders for each mix, and the average tensilestrength of the benchmark mix is compared with that of all other mixes in Figure 10.

Crystals 2021, 11, 161 12 of 19Crystals 2021, 11, x FOR PEER REVIEW 13 of 21
(a)
(b)
(c)
0.00
0.50
1.00
1.50
2.00
2.50
3.00
3.50
BM SR-1 SR-2 SR-3 SR-4
Tens
ile S
tren
gth
(MPa
)
Tensile Strength of BM and SR Mixes
0.00
0.50
1.00
1.50
2.00
2.50
3.00
3.50
BM CR-1 CR-2 CR-3 CR-4
Tens
ile S
tren
gth
(MPa
)
Tensile Strength of BM and CR Mixes
0.00
0.50
1.00
1.50
2.00
2.50
3.00
3.50
BM SF-1 SF-2 SF-3
Tens
ile S
tren
gth
(MPa
)
Tensile Strength of BM and SF Mixes
Figure 10. Cont.

Crystals 2021, 11, 161 13 of 19Crystals 2021, 11, x FOR PEER REVIEW 14 of 21
(d)
Figure 10. Comparing the tensile strength of the benchmark mix (3.11 MPa) with (a) SR; (b) CR; (c) SF; and (d) Hybrid (i.e., H) mixes.
3.5. Modulus of Rupture A third-point loading test is performed on 3 beams for each mix, and the average
value relating to the modulus of rupture of the benchmark mix is compared with that of all other mixes in Figure 11.
(a)
(b)
0.00
0.50
1.00
1.50
2.00
2.50
3.00
3.50
Tens
ile S
tren
gth
(MPa
)
Tensile Strength of BM and Hybrid (H) Mixes
0
1
2
3
4
5
6
BM SR-1 SR-2 SR-3 SR-4
Mod
ulus
of R
uptu
re (
MPa
)
Modulus of Rupture of BM and SR Mixes
0
1
2
3
4
5
6
BM CR-1 CR-2 CR-3 CR-4
Mod
ulus
of R
uptu
re (
MPa
)
Modulus of Rupture of BM and CR Mixes
Figure 10. Comparing the tensile strength of the benchmark mix (3.11 MPa) with (a) SR; (b) CR; (c)SF; and (d) Hybrid (i.e., H) mixes.
3.5. Modulus of Rupture
A third-point loading test is performed on 3 beams for each mix, and the averagevalue relating to the modulus of rupture of the benchmark mix is compared with that of allother mixes in Figure 11.
Crystals 2021, 11, x FOR PEER REVIEW 14 of 21
(d)
Figure 10. Comparing the tensile strength of the benchmark mix (3.11 MPa) with (a) SR; (b) CR; (c) SF; and (d) Hybrid (i.e., H) mixes.
3.5. Modulus of Rupture A third-point loading test is performed on 3 beams for each mix, and the average
value relating to the modulus of rupture of the benchmark mix is compared with that of all other mixes in Figure 11.
(a)
(b)
0.00
0.50
1.00
1.50
2.00
2.50
3.00
3.50
Tens
ile S
tren
gth
(MPa
)
Tensile Strength of BM and Hybrid (H) Mixes
0
1
2
3
4
5
6
BM SR-1 SR-2 SR-3 SR-4
Mod
ulus
of R
uptu
re (
MPa
)
Modulus of Rupture of BM and SR Mixes
0
1
2
3
4
5
6
BM CR-1 CR-2 CR-3 CR-4
Mod
ulus
of R
uptu
re (
MPa
)
Modulus of Rupture of BM and CR Mixes
Figure 11. Cont.

Crystals 2021, 11, 161 14 of 19
Crystals 2021, 11, x FOR PEER REVIEW 15 of 21
(c)
(d)
Figure 11. Comparing the modulus of rupture of the benchmark mix (5.04 MPa) with (a) SR; (b) CR; (c) SF; and (d) Hybrid (i.e., H) mixes.
4. Discussion 4.1. Slump Test
Figure 6a,c show the slump test results for mixes containing SR and SF, respectively. The results shown in the figures are inconclusive, as they do not clearly indicate a trend with the introduction of either of the materials. However, the reduction in slump due to the incorporation of SF into the concrete mix was corroborated by findings by other re-searchers [33]. Additionally, all SR and SF mixes presented acceptable slump values that are within the target slump range for pavements (70 mm ± 30 mm).
Figure 6b shows the slump test results for mixes containing CR. As shown in the figure, the introduction of CR initially decreased the slump but then increases with ad-ditional doses. This trend is the case for doses up to and including 15%. The introduction of 20% CR reverses the trend but still maintains a slump value similar to the benchmark. The conclusions of this family of concrete are similar to that of other researchers [34].
Figure 6d shows the slump test results for the hybrid mixes, containing combina-tions of SR, CR, and SF. The figure shows four “families” of hybrid mixes: combinations of SR and SF are shown in red, combinations of CR and SF are shown in blue, combina-tions of SR, CR, and SF are shown in yellow, and combinations of SR and CR are shown in green. The results in red show that with the exception of H2, there is a clear and in-creasing trend in the slump of concrete. Initially, the slump significantly decreased but then increases, with the last mix reaching the benchmark’s slump. The results in blue
0
1
2
3
4
5
6
BM SF-1 SF-2 SF-3
Mod
ulus
of R
uptu
re (
MPa
)
Modulus of Rupture of BM and SF Mixes
0
1
2
3
4
5
6
Mod
ulus
of R
uptu
re (M
Pa)
Modulus of Rupture of BM and Hybrid (H) Mixes
Figure 11. Comparing the modulus of rupture of the benchmark mix (5.04 MPa) with (a) SR; (b) CR;(c) SF; and (d) Hybrid (i.e., H) mixes.
4. Discussion4.1. Slump Test
Figure 6a,c show the slump test results for mixes containing SR and SF, respectively.The results shown in the figures are inconclusive, as they do not clearly indicate a trendwith the introduction of either of the materials. However, the reduction in slump dueto the incorporation of SF into the concrete mix was corroborated by findings by otherresearchers [33]. Additionally, all SR and SF mixes presented acceptable slump values thatare within the target slump range for pavements (70 mm ± 30 mm).
Figure 6b shows the slump test results for mixes containing CR. As shown in the figure,the introduction of CR initially decreased the slump but then increases with additionaldoses. This trend is the case for doses up to and including 15%. The introduction of 20%CR reverses the trend but still maintains a slump value similar to the benchmark. Theconclusions of this family of concrete are similar to that of other researchers [34].
Figure 6d shows the slump test results for the hybrid mixes, containing combinationsof SR, CR, and SF. The figure shows four “families” of hybrid mixes: combinations of SRand SF are shown in red, combinations of CR and SF are shown in blue, combinations ofSR, CR, and SF are shown in yellow, and combinations of SR and CR are shown in green.The results in red show that with the exception of H2, there is a clear and increasing trendin the slump of concrete. Initially, the slump significantly decreased but then increases,with the last mix reaching the benchmark’s slump. The results in blue show that the slumpremained somewhat consistent, hovering in the range of 85–100 mm. This excludes theresults of H8, which can be considered anomalous. The results in yellow show that there isa slight increase in the slump at the higher dosage of H10, but this remains significantly

Crystals 2021, 11, 161 15 of 19
lower than the benchmark’s slump. The results in green show that there is a slight increasein the slump at the higher dosage of H12, but this remains lower than the benchmark’sslump and outperforms the results in yellow. All slump test results were within the targetslump range for pavements.
4.2. Compressive Strength
Figure 8a shows the variation of compressive strength of samples containing SR com-pared with the benchmark at the 7- and 28-day marks. As shown in the figure, compressivestrength is directly affected by the introduction of SR into the mix, where larger quantitiesof SR present in the mix lead to a decrease in the 7- and 28-day compressive strength in analmost proportional fashion. The samples also exhibit similar rates of compressive strengthgain to the benchmark mix, as shown by the slope of the lines. Comparable studies statedthat the introduction of SR would reduce the compressive strength by up to 23% [27,29],where the compressive strength reduction in the results of this study ranged between 13%and 36%. There is some correlation between the results of the study and existing literature,with variations in the upper/lower bounds of compressive strength reduction. However,the results stand in contrast to the findings of some other researchers [13] who found thatcompressive strength, among other properties, was improved by the introduction of SRinto the mix.
Figure 8b shows the variation of compressive strength of samples containing CRcompared with the benchmark at the 7- and 28-day marks. As shown in the figure,there is no clear correlation between the amount of CR present in the sample and thecompressive strength at any age. However, the introduction of CR lowers both 7- and 28-day compressive strength. It is worth mentioning that all concrete mixes in this figure haveacceptable 28-day compressive strengths, ranging from 26.4 MPa (for CR4) to 31.1 MPa (forCR2). Comparable studies stated that the introduction of CR would reduce the compressivestrength by 15% [26], where the compressive strength reduction in the results of this studyranged between 8% and 30%. It is worth mentioning that the replacements considered inthis study are within the bounds of acceptable replacement of conventional materials [29].
Figure 8c shows the variation of compressive strength of samples containing SFcompared with the benchmark at the 7- and 28-day marks. As shown in the figure, an in-teresting observation occurs at SF2, where the 7-day compressive strength was higher thanthe benchmark and the 28-day compressive strength was very similar to the benchmark.Other than that, both SF1 and SF3 performed similarly to each other, both being slightlylower than the benchmark and having similar rates of compressive strength gain to eachother. This comes at odds with the conclusions of other researchers who had success inincreasing mechanical properties (such as compressive strength) with increasing dosagesof SF [30].
Figure 9a shows the variation of compressive strength of samples containing a combi-nation of SR and SF compared with the benchmark at the 7- and 28-day marks. As shown inthe figure, higher doses of SR with the introduction of 0.1% SF into the mix decrease the 7-and 28-day compressive strength. However, there is no impact on the rate of compressivestrength gain in any of the samples, exhibiting similar slopes to that of the benchmark.
Figure 9b shows the variation of compressive strength of samples containing a com-bination of CR and SF compared with the benchmark at the 7- and 28-day marks, andFigure 9c shows the variation of compressive strength of samples containing a combinationof SR, CR, and SF compared with the benchmark at the 7- and 28-day marks. An interestingobservation can be seen across the two figures above, where the compressive strengthsof the samples converge to the same value at the 28-day mark. The rate of compressivestrength gain is expected to decrease as the proportion of the replacement materials increasein the mixes.
All mixes used in this study exhibit acceptable levels of 28-day compressive strength,with a minimum of 21.3 MPa (H-4) and a maximum of 33.1 MPa (SF-2).

Crystals 2021, 11, 161 16 of 19
4.3. Tensile Strength
Figure 10a shows the variation of split tensile strength of samples containing SRcompared with the benchmark. The results show a very clear decreasing trend as thepercentage of SR increases in the mix. The results of SR3 can be considered anomalous.
Figure 10b shows the variation of split tensile strength of samples containing CRcompared with the benchmark. The results show a very clear decreasing trend as the per-centage of CR increases in the mix. Comparable studies stated that the introduction of CRwould reduce the tensile strength by up to 43% [2,26], where the tensile strength reductionin the results of this study ranged around 22%. While this is a marked improvement overexisting literature, it still represents a significant drop in the tensile strength of concrete.
Figure 10c shows the variation of split tensile strength of samples containing SFcompared with the benchmark. The results show very consistent tensile strength resultsthat are close to the benchmark’s results, regardless of the dosage of SF present in theconcrete. The results of this test indicate that there is no advantage in incorporatingadditional doses of steel fibers beyond 0.1%. This, coupled with the fact that higherdosages of SF led to a significant decrease in the slump, justifies the use of this dosage inthe hybrid mixes.
Figure 10d shows the tensile strength test results for the hybrid mixes, containingcombinations of SR, CR, and SF. The figure shows four “families” of hybrid mixes: combi-nations of SR and SF are shown in shades of green, combinations of CR and SF are shownin shades of orange, combinations of SR, CR, and SF are shown in shades of blue, andcombinations of SR and CR are shown in shades of yellow. The results in green show thatthere is a clear decreasing trend in the tensile strength of the samples as the proportionof SR increases in the samples. The results in orange indicate a clear trendline showingthat the values are almost consistent throughout the samples tested. However, the sampleshave tensile strength values that are lower than the benchmark’s. The results in blue showthat there is a slight increase in the tensile strength at the higher dosage of H10. The resultsin yellow show that there is a slight decrease in the tensile strength at the higher dosageof H12.
4.4. Modulus of Rupture
Figure 11a shows the variation of modulus of rupture of samples containing SRcompared with the benchmark. The results show a very clear trend where the modulus ofrupture remains consistent for all four dosages of SR tested.
Figure 11b shows the variation of modulus of rupture of samples containing CRcompared with the benchmark. The results show a very clear trend where the modulusof rupture decreases with increasing dosages of crumb rubber. The results of CR3 can beconsidered anomalous. The findings of the CR trials match closely with the findings ofother researchers, who have stated that the incorporation of rubber products has a negativeeffect on mechanical properties [2].
Figure 11c shows the variation of modulus of rupture of samples containing SFcompared with the benchmark. Initially, this does not have an impact on the modulus ofrupture at a low dosage. However, with increasing dosages of SF, there is a clear trend ofdecreasing modulus of rupture. As was the case with the tensile test results, the results ofthis test also indicate that there is no advantage in incorporating additional doses of steelfibers beyond 0.1%. Again, this comes at odds with the conclusions of other researcherswho had success in increasing mechanical properties (such as flexural strength) withincreasing dosages of SF [30].
Figure 11d shows the test results for the modulus of rupture for the hybrid mixes,containing combinations of SR, CR, and SF. The figure shows four “families” of hybridmixes: combinations of SR and SF are shown in shades of blue, combinations of CR andSF are shown in shades of green, combinations of SR, CR, and SF are shown in shades ofyellow, and combinations of SR and CR are shown in shades of orange. The results in blueshow that there is a clear decreasing trend in the modulus of rupture of the samples as the
Crystals 2021, 11, 161 17 of 19
proportion of SR increases in the samples. The results in green show that there is a cleardecreasing trend in the modulus of rupture of the samples as the proportion of CR increasesin the samples. However, results up to and including H7 are very close to the modulusof rupture of the benchmark, which is similar to the findings of other researchers [2,35].The results in yellow show that there is a sharp drop in the modulus of rupture valuesas the dosage of replacement materials increases, while noting the improvement in themodulus of rupture for H-9 compared with the benchmark mix, which proves the benefitsof including all replacement materials in the concrete mix. The results in orange show thatthere is a sharp increase in the modulus of rupture values as the dosage of replacementmaterials increases.
5. Conclusions
After analyzing the results presented above, and despite the reduction in fresh proper-ties due to the introduction of recycled tire products in the concrete mix, it has been shownthat multiple tire by-products (shredded/crumb rubber and recovered steel fibers) can besuccessfully hybridized to produce a novel pavement-grade green concrete that is suitedfor use in hot-weather climates. This is important, as it achieves two goals in one: to be ableto produce a sustainable construction material that is tailored for use in Kuwait’s climateand to also reduce the number of tires going to landfill.
• The incorporation of CR has a detrimental effect on all concrete properties consideredin this study. However, the effects on tensile strength and modulus of rupture werethe most evident.
• The introduction of SR into a benchmark concrete mix has a noticeable, almost propor-tional effect on the 7 and 28-day compressive strength and tensile strength.
• The introduction of 0.1% and 0.2% SF managed to increase the modulus of ruptureand the 7-day compressive strength of the benchmark, respectively. On the otherhand, excessive use of SF leads to the concrete having significantly weaker propertiescompared to a benchmark mix.
• The preliminary results from the individual tire products were used to determineoptimal dosages of each material for use in a hybrid mix, which has not been attemptedby many researchers. It is interesting to note how the hybrid mixes exhibit very similartrends to their constituent replacement materials. The incorporation of each materialat a low dosage (5% for rubber products and 0.1% for steel fibers) was able to maintainthe properties of the benchmark mix, if not improve on them.
All mixes, whether individual replacement or hybrid mixes, exhibited acceptableproperties for pavement-grade concrete for use in hot climates. The conclusions of thisstudy show that it is possible to hybridize all materials sourced from recycled tires inthe production of a feasible pavement-grade concrete suited for hot weather. Possibleextensions of the project could include the investigation of other properties to evaluatethe usefulness of the hybrid concrete, such as measuring skid resistance and modulusof elasticity. Further, long-term effects of using this concrete could be modeled usingfinite-element analysis software packages, which could be used to predict the behavior ofthe concrete while it is being used at a selected intersection in Kuwait.
Author Contributions: Conceptualization, S.M.S., A.R.A., A.J., N.M. and A.F.; methodology, S.M.S.;formal analysis, S.M.S., A.R.A., A.J. and N.M.; investigation, A.R.A., A.J. and N.M.; resources, A.R.A.;data curation, A.J.; writing—original draft preparation, S.M.S., A.R.A., A.J., N.M. and A.F.; writing—review and editing, S.M.S., A.R.A., A.J., N.M. and A.F.; supervision, S.M.S.; project administration,A.F.; funding acquisition, S.M.S. All authors have read and agreed to the published version ofthe manuscript.
Funding: This project was funded “partially” by Kuwait Foundation for the Advancement of Sciencesunder project code: PR19-15EV-02.
Institutional Review Board Statement: Not applicable.

Crystals 2021, 11, 161 18 of 19
Informed Consent Statement: Not applicable.
Data Availability Statement: The data presented in this study are available on request from thecorresponding author.
Acknowledgments: The authors would like to acknowledge Tahir Afrasiab for his contributions,hard work and dedication while preparing the concrete mixes for this study. The authors wouldlike to thank Sameer Hamoush of North Carolina A&T State University for his input and advicethroughout the course of the project. The authors would also like to express their gratitude to GreenRubber Recycling Co. for providing samples of their recycled tire products to be used in this study.The authors are grateful to Sika for providing the team with the superplasticizer used in the study.
Conflicts of Interest: The authors declare no conflict of interest.
Abbreviations
CR crumb rubberKg kilogramMm millimeterMPa megapascalm3 cubic meterSF steel fiberSR shredded rubber
References1. Arab Times. Available online: https://www.arabtimesonline.com/news/red-tape-proper-planning-dearth-delays-shifting-of-
huge-tire-dump/ (accessed on 1 January 2021).2. Meddah, A.; Miloud, B.; Bali, A. Use of shredded rubber tire aggregates for roller compacted concrete pavement. J. Clean. Prod.
2014, 72, 187–192. [CrossRef]3. Kuwait News Agency. Available online: https://www.kuna.net.kw/ArticleDetails.aspx?id=2931763&language=en (accessed on
1 January 2021).4. Arab Times. Available online: https://www.arabtimesonline.com/news/millions-of-tires-destroyed-in-fire/ (accessed on 1
January 2021).5. Kuwait News Agency. Available online: https://www.kuna.net.kw/ArticleDetails.aspx?id=2367062&Language=en (accessed on
1 January 2021).6. Kuwait News Agency. Available online: https://www.kuna.net.kw/ArticleDetails.aspx?id=2234353&Language=en (accessed on
1 January 2021).7. Fazli, A.; Rodrigue, D. Waste Rubber Recycling: A Review on the Evolution and Properties of Thermoplastic Elastomers. Materials
2020, 13, 782. [CrossRef] [PubMed]8. Debrah, J.K.; Vidal, D.G.; Dinis, M.A.P. Raising Awareness on Solid Waste Management through Formal Education for Sustain-
ability: A Developing Countries Evidence Review. Recycling 2021, 6, 6. [CrossRef]9. Kassim, S.M. The Importance of Recycling in Solid Waste Management. Macro. Symp. 2012, 320, 34–50. [CrossRef]10. Assadi, M.H.N.; Sahajwalla, V. Recycling End-of-Life Polycarbonate in Steelmaking: Ab Initio Study of Carbon Dissolution in
Molten Iron. Ind. Eng. Chem. Res. 2014, 53, 3861–3864. [CrossRef]11. Yazdi, M.A.; Yang, J.; Yihui, L.; Su, H. A Review on Application of Waste Tire in Concrete. Int. Sch. Sci. Res. Innov. 2015, 9,
1656–1661.12. Toghroli, A.; Shariati, M.; Sajedi, F.; Ibrahim, Z.; Koting, S.; Mohamad, E.T.; Khorami, M. A review on pavement porous concrete
using recycled waste materials. Smart Struct. Syst. 2018, 22, 433–440.13. Lavagna, L.; Nisticò, R.; Sarasso, M.; Pavese, M. An Analytical Mini-Review on the Compression Strength of Rubberized Concrete
as a Function of the Amount of Recycled Tires Crumb Rubber. Materials 2020, 13, 1234. [CrossRef] [PubMed]14. Forrest, M.J. Recycling and Re-Use of Waste Rubber, 2nd ed.; De Gruyter: Berlin, Germany, 2019; pp. 1–20.15. Bulei, C.; Todor, M.P.; Heput, T.; Kiss, I. Directions for material recovery of used tires and their use in the production of new
products intended for the industry of civil construction and pavements. IOP Conf. Ser. Mater. Sci. Eng. 2018, 294, 012064.[CrossRef]
16. Oliveira Neto, G.C.d.; Chaves, L.E.C.; Pinto, L.F.R.; Santana, J.C.C.; Amorim, M.P.C.; Rodrigues, M.J.F. Economic, Environmentaland Social Benefits of Adoption of Pyrolysis Process of Tires: A Feasible and Ecofriendly Mode to Reduce the Impacts of ScrapTires in Brazil. Sustainability 2019, 11, 2076. [CrossRef]
17. Al-Fakih, A.; Mohammed, B.S.; Liew, M.S. Tires Rubber as a Useable Material in Civil Engineering Applications: An Overview.Int. J. Adv. Res. Eng. Technol. 2020, 11, 315–325.

Crystals 2021, 11, 161 19 of 19
18. Senin, M.S.; Shahidan, S.; Abdullah, S.R.; Guntor, N.A.; Leman, A.S. A review on the suitability of rubberized concrete forconcrete bridge decks. IOP Conf. Ser. Mater. Sci. Eng. 2017, 271, 012074. [CrossRef]
19. Hejna, A.; Zedler, Ł.; Przybysz-Romatowska, M.; Cañavate, J.; Colom, X.; Formela, K. Reclaimed Rubber/Poly(ε-caprolactone)Blends: Structure, Mechanical, and Thermal Properties. Polymers 2020, 12, 1204. [CrossRef]
20. Alfayez, S.; Suleiman, A.R.; Nehdi, M.L. Recycling Tire Rubber in Asphalt Pavements: State of the Art. Sustainability 2020,12, 9076. [CrossRef]
21. Aiello, M.A.; Leuzzi, F. Waste tyre rubberized concrete: Properties at fresh and hardened state. Waste Manag. 2010, 30, 1696–1704.[CrossRef] [PubMed]
22. Gupta, T.; Chaudhary, S.; Sharma, R.K. Mechanical and durability properties of waste rubber fiber concrete with and withoutsilica fume. J. Clean. Prod. 2016, 112, 702–711. [CrossRef]
23. Obinna, O.; Panesar, D.K. Hardened properties of concrete mixtures containing pre-coated crumb rubber and silica fume. J. Clean.Prod. 2014, 82, 125–131.
24. Guneyisi, E.; Gesoglu, M.; Ozturan, T. Properties of rubberized concretes containing silica fume. Cem. Concr. Res. 2004, 34,2309–2317. [CrossRef]
25. Kanmalai Williams, C.; Partheeban, P. Experimental investigation on recycled rubber filled concrete. Int. J. Earth Sci. Eng. 2016, 9,170–175.
26. Khan, S.; Singh, A. Behavior of Crumb Rubber Concrete. Int. J. Res. Eng. 2018, 8, 86–92.27. Sofi, A. Effect of Waste Tyre Rubber on Mechanical and Durability Properties of Concrete—A review. Ain Shams Eng. J. 2018, 9,
2691–2700. [CrossRef]28. Akinwonmi, A.S.; Seckley, E. Mechanical Strength of Concrete with Crumb and Shredded Tyre As Aggregate Replacement. Int. J.
Eng. Res. Appl. 2013, 3, 1098–1101.29. Issa, C.A.; Salem, G. Utilization of Recycled Crumb Rubber as Fine Aggregates in Concrete Mix Design. Constr. Build. Mater. 2013,
42, 48–52. [CrossRef]30. Irmawaty, R.; Parung, H.; Abdurrahman, M.A.; Nur Qalbi, I. Flexural toughness of concrete with aggregate substitution (steel
fiber, crumb rubber and tire chips). IOP Conf. Ser. Earth Environ. Sci. 2020, 419, 012038. [CrossRef]31. Chen, Y.; Liang, X.; Liang, L. Application research of steel fiber rubber regenerated concrete engineering. IOP Conf. Ser. Earth
Environ. Sci. 2020, 526, 012087. [CrossRef]32. Gul, S.; Nasser, S. Concrete Containing Recycled Rubber Steel Fiber. Procedia Struct. Integr. 2019, 18, 101–107. [CrossRef]33. Samarakoon, S.M.S.M.K.; Ruben, P.; Pedersen, J.W.; Evangelista, L. Mechanical Performance of Concrete Made of Steel Fibers
from Tire Waste. Case Stud. Constr. Mater. 2019, 11, e00259. [CrossRef]34. Noaman, A.; Abu Bakar, B.H.; Akil, H.M. Investigation on the mechanical properties of rubberized steel fiber concrete. Eng.
Struct. Technol. 2017, 9, 79–92. [CrossRef]35. Eisa, A.S.; Elshazli, M.T.; Nawar, M.T. Experimental investigation on the effect of using crumb rubber and steel fibers on the
structural behavior of reinforced concrete beams. Constr. Build. Mater. 2020, 252, 119078. [CrossRef]36. Mohammad, B.M.; Adamu, M.; Shafiq, N. A review on the effect of crumb rubber on the properties of rubbercrete. Int. J. Civ. Eng.
Technol. 2017, 8, 599–617.37. Hot Weather Concrete—American Concrete Institute. Available online: https://www.concrete.org/topicsinconcrete/topicdetail/
hot%20weather%20concrete?search=hot%20weather%20concrete (accessed on 29 January 2021).38. ASTM C617/C617M-15. Standard Practice for Capping Cylindrical Concrete Specimens; ASTM International: West Conshohocken,
PA, USA, 2015. Available online: www.astm.org (accessed on 3 February 2021).39. ASTM C496/C496M-17. Standard Test Method for Splitting Tensile Strength of Cylindrical Concrete Specimens; ASTM International:
West Conshohocken, PA, USA, 2017. Available online: www.astm.org (accessed on 3 February 2021).40. ASTM C39/C39M-20. Standard Test Method for Compressive Strength of Cylindrical Concrete Specimens; ASTM International: West
Conshohocken, PA, USA, 2020. Available online: www.astm.org (accessed on 3 February 2021).41. ASTM C78/C78M-18. Standard Test Method for Flexural Strength of Concrete (Using Simple Beam with Third-Point Loading); ASTM
International: West Conshohocken, PA, USA, 2018. Available online: www.astm.org (accessed on 3 February 2021).