income, cohort effects, and occupational mobility: a new look at immigration to the united states at...
TRANSCRIPT

Income, Cohort Effects, and Occupational Mobility:A New Look at Immigration to the United States
at the Turn of the 20th Century
Chris Minns1
Department of Economics, McGill UniversityE-mail: [email protected].
How did turn-of-the-20th-century immigrants perform in the American economy rela-tive to native-born Americans? This article reassesses this question using data from the1900 and 1910 American census files. I find in both cross sections that Americanimmigrants perform well in blue-collar and white-collar occupations, with either fastergrowth in earnings or an outright earnings advantage over native-born Americans in thesame occupational sector. Estimates of within-cohort growth reveal that the cross-sectional results do not overstate immigrant progress due to cohort effects. Immigrantsalso exhibit a high degree of mobility into the well-paid white-collar sector of theAmerican economy, and the progress of the immigrant population as a whole was notslowed by the emergence of the “new” immigration.© 2000 Academic Press
Introduction
The turn of the 20th century saw a massive flow of population from the OldWorld to the New, with over 25 million immigrants entering the United Statesbetween 1881 and 1924 (Borjas, 1994). This article assesses the fate of theseimmigrant arrivals in America: How did the foreign-born perform in the U.S.labor market relative to native-born Americans? This question has been of greatinterest to both present-day economic historians and contemporaries of themigration period.
Recent studies of late-19th- and early-20th-century immigrants in America aredivided on the issue of whether immigrants were able to achieve economicassimilation with the native-born. Some authors (for example, Hatton, 1997;Blau, 1980) have found that immigrants had faster wage growth than native-born
1 Special thanks to Tim Hatton and Roy Bailey for valuable advice and suggestions on earlier draftsof this article. I have also received useful comments from Ken Burdett and seminar participants at theUniversity of Essex; the University of Cambridge; the 1999 Economic History Society AnnualConference at St. Catherine’s College, Oxford; and the 1999 Canadian Economic History Meetingsat Kananaskis, Alberta. I also thank two anonymous referees and the editor of this journal. Anyremaining errors are mine.
Explorations in Economic History37, 326–350 (2000)doi:10.1006/exeh.2000.0746, available online at http://www.idealibrary.com on
326
0014-4983/00 $35.00Copyright © 2000 by Academic PressAll rights of reproduction in any form reserved.

Americans, enabling them to “catch up” to the native-born level of earningswithin 20 or 25 years. Others (Hannon, 1982a; Eichengreen and Gemery, 1986;Hanes, 1996) claim that wage growth among immigrants was actually slowerthan for native-born workers, implying that there would be no convergence inearnings between the two groups. While there have been a range of estimates forthe earnings growth of the foreign-born in America, these results are based on theanalysis of single cross sections of data. George Borjas (1985) brought attentionto the fact that cross-sectional regression estimates may not be representative ofearnings growth over the life cycle if there is a change in the labor marketabilities of successive immigrant cohorts. No studies to date have calculatedrelative within-cohort earnings growth for immigrants in turn-of-the-20th-cen-tury United States.
Another difficulty is that most of the literature on the economic performanceof pre-World War I immigrants does not address the issue that drew the mostattention when the migration was taking place: the (possible) differences in therate of assimilation between “old” immigrants from northwestern Europe and“new” immigrants from southern and eastern Europe. The United States Immi-gration Commission presented an unfavourable view of new immigrants in its1911 report, a sentiment that was reinforced by Jeremiah Jenks and J. B. Lauck’sThe Immigration Problem(1926) and Madison Grant’sThe Passing of the GreatRace(1925). The literature to date suggests that, relative to immigrants fromnorthwestern Europe, the arrivals from southern and eastern Europe did suffer awage penalty upon entry to the United States. It is unclear, however, how thewage growth thereafter of the new immigrants compared to that of immigrantsfrom old sources.
This article reexamines the performance of immigrants in turn-of-the-20th-century America with rich data sources: the 1900 and 1910 IPUMS Censusmanuscripts. After initial estimates of cross-sectional regressions in separatesectors of the American economy for foreign-born and native-born workers, Iexamine the issue of changes in immigrant “quality” between cohorts by calcu-lating within-cohort earnings growth for successive immigrant and native-borncohorts between 1900 and 1910. The tracking of population cohorts also allowsme to examine mobility among different occupational classifications between1900 and 1910. Finally, I turn to the new and old immigrants, to determine howthe labor market performances of these two groups fits into the overall picture ofimmigrant economic performance in America.
Immigration Assimilation in Theory and History
Work on recent immigration history into the United States has produced twoprincipal views on the immigrant assimilation process into host economies. Theargument espoused by Barry Chiswick (1978) is that immigrants experiencemore rapid wage growth than do native-born workers, despite an initial earningsdisadvantage upon entry into the American economy. Chiswick attributes theeconomic success of American immigrants to the fact that they have been
327IMMIGRATION TO THE UNITED STATES

positively self-selected from source economies. Positive self-selection impliesthat only the most motivated individuals move in response to economic oppor-tunities. Chiswick found that immigrants in fact had greater incomes than didnative-born workers once they had acquired the specific human capital necessaryto perform in the United States labor market.
Chiswick’s ideas have been challenged by George Borjas (1985), who claimsthat (self-)selection may be either positive or negative, depending on the relativewage dispersion in the source and host countries. Borjas also argues that evidencesupporting rapid wage growth among immigrant workers may be an illusioncaused by declining labor-market quality between successive immigrant cohorts.Estimates of wage growth over the life cycle made from a single cross section ofdata will be biased upward if, for example, a recent immigrant cohort possessesless human capital or has lower unobserved quality than did an earlier wave ofarrivals. In the most recent United States census, young immigrants arriving after1985 had lower wages than older immigrants who arrived between 1975 and1980. Claiming that the wage difference between these two groups representswage growth for immigrants is misleading if the young immigrants entering after1985 do not possess the human capital necessary to achieve the wage levels ofthe earlier cohort after 10 years in the United States. Borjas’ technique tounderstand the “true” level of immigrant wage growth over time is to trackparticular cohorts across several cross sections of data. However, this approachmay also be subject to a source of bias. Jasso and Rosenzweig (1988) note thatimmigrant cohorts may be “trimmed” over time by emigration from the UnitedStates. If this emigration is selective, in that it is the low or high achievers whosystematically leave the United States, estimates of wage growth made fromcross-sectional regressions or from comparisons of cohorts across successivedata sets will not provide an accurate picture of relative immigrant progress.
No consensus has emerged regarding the performance of American immi-grants over the period 1890–1910. There are three predominant data sources forthis work. The extensive inquiries of the United States Immigration Commissionfrom 1907 to 1911 have left a valuable collection of data on turn-of-the-centuryimmigration history. Using the Immigration Commission data, Robert Higgs(1971) found that there was little difference in earnings between native-born andimmigrant workers after controlling for differences in literacy and English-language ability. Paul McGouldrick and Michael Tannen (1977) argued that theImmigration Commission data revealed that immigrants from southern andeastern Europe were disadvantaged relative to those from northwestern Europe,who themselves suffered no wage penalty relative to native-born Americans.Francine Blau (1980) found that while all immigrants had an initial earningsdisadvantage relative to native-born Americans, this differential was greater for“new” immigrants from southern and eastern Europe, and that the new immi-grants took longer than “old” immigrants to achieve wage parity with similarlyskilled native-born Americans.
State-level industry surveys have also provided material for economic histo-rians interested in the immigration question. Joan Hannon (1982a,b) and
328 CHRIS MINNS

Barry Eichengreen and Henry Gemery (1986) employed state labor bureau datafrom various industries in Michigan and Iowa in the 1880s and 1890s. The partialeffect of foreign birth on earnings was found to be about 6 to 7% in these states,and immigrant wage growth with experience was much slower than in studiesusing the Immigration Commission Data. These findings were reinforced byChris Hanes’ (1996) work with an 1892 survey for California as well as twoMichigan surveys from the 1890s. He discovered, as had Eichengreen andGemery, that for the most part immigrants had slower wage growth withexperience than native-born workers.
Hanes also assessed immigrant performance in an early versions of the1900 United States Census Public Use Manuscript data file. Using an occu-pational prestige index included in the data file to analyze the performance ofimmigrants in the 1900 Census, Hanes found that if agricultural workers areomitted from the analysis, immigrants experienced slower growth in occu-pational prestige with increasing age than did native-born Americans. Usingthe same PUMS sample of the 1900 census, Barry Chiswick (1991) found thatthe foreign-born in 1900 never achieve parity with natives in occupationalprestige scores, although the native-born/foreign-born gap closes with timespent in the United States.
A more recent article by Tim Hatton (1997) observed that the simple quadraticformulation in age or experience with 1890s data from Michigan and Californiaresults in an earnings profile which is far more “humped” than the pattern ofactual earnings across the life cycle. Another point brought out in Hatton’s articleis that immigrants arriving in the United States as children may have quitedifferent experiences in the American labor market than those who arrived asadults. Comparing native-born wage growth to that of all immigrants (includingthose who arrived as children) may give a misleading picture of how immigrantsperformed in the U.S. economy. Regression results that account for theseadjustments suggest faster immigrant wage growth than was reported in previouswork with micro-level data.
Many of the studies listed above do estimate the lifetime wage growth ofimmigrants relative to the native-born. However, there are good reasons to behesitant about the conclusions that can be drawn from the data sources used inthese articles. The grouped data of the Immigration Commission contains only asmall number of highly aggregated observations. State labor bureau surveys fromMichigan, California, and Iowa provide more plentiful and more detailed datathan the returns of the Immigration Commission, but these surveys suffer in thatthey cover only specific industries in specific states. These state surveys containrelatively few new immigrants or foreign-born working in white-collar occupa-tions across the country. The census data used by Chiswick and Hanes does coverthe entire breadth of the American economy, but their results are dependent onthe assimilation process being equivalent in prestige scores and income.
While cross-sectional wage growth has been measured in the work to date onearly American immigration, there has been no formal accounting for the
329IMMIGRATION TO THE UNITED STATES

possibility of cohort effects.2 The results of existing studies are therefore sus-ceptible to bias if the labor market quality of immigrants had been changing overtime or if there was selective return migration. Hatton’s (1997) observation thatregression results from single cross sections are highly sensitive to functionalform is a further indication that cohort growth should be considered to obtain anaccurate picture of immigrant assimilation in America.
The IPUMS Census Data
I use the Integrated Public Use manuscripts of the 1910 and 1900 Censuses ofPopulation to reassess immigrant performance in the United States at the turn of20th century. The IPUMS are large samples of micro-level data; the 1910 surveyis a 1-in-250 sample of the United States population, while in 1900 1-in-760observations are included in the public sample. Census interviewers gatheredinformation on a wide range of personal and household characteristics. Personalinformation provided by respondents includes age, gender, birthplace, and parentorigins. The census interviewers also made inquiries into the economic status ofthe American population. Respondents were asked about their current employ-ment status and whether they had been unemployed in the previous year. Theoccupation of respondents was also recorded, with responses being subsequentlytranslated into the 1950 occupational structure where an occupational prestigescore and an annual income score has been estimated for each occupation.3
One might wonder if 1950-based income scores are appropriate for analyzingeconomic performance in 1900 and 1910. Goldin and Margo (1992) report thatthere was significant compression in the American wages in the 1940s, suggest-ing that using the income scores provided in the IPUMS data could understatedifferences in occupational incomes in 1900 and 1910. With this in mind, Imodified the IPUMS data to better reflect actual incomes in 1900 and 1910, usingthe work of Sobek (1995) and Preston and Haines (1991) to create a table ofannual incomes by occupation at 1890 levels.4
One difficulty with the IPUMS data is that the measure of individual incomeused is an income score that corresponds directly to the respondent’s occupation.This means that all individuals classified in the same occupational category willhave the same income for my analysis. While I have no way to control for
2 Hanes (1996) does discuss the issue of cohort effects and selective migration, but without aquantitative assessment of their possible impact on his results.
3 The occupational prestige scale was developed by Reiss (1961). Matthew Sobek (1996) hasestimated 1950-equivalent annual income scores. Both these measures have been appended to the1900 and 1910 IPUMS data files.
4 As mentioned earlier, The IPUMS census data includes Matthew Sobek’s (1996) estimates of1950-based occupational income scores. However, I preferred a dependent variable that more closelyreflected occupational pay at the turn of the century. I constructed an income score/occupation tablebased primarily on Sobek’s (1995) comprehensive estimates of income by occupation in 1890. I usedPreston and Haines’s (1991) earlier table of income by occupation in 1900 to supplement Sobek’sdata for occupations not covered in Sobek’s study. Note that these sources provide national ratherthan region-specific estimates of income by occupation.
330 CHRIS MINNS

variations in income across individuals within occupations,5 using income scoresas the dependent variable is not entirely without merit. For one, income scoreswould seem to be a more direct measure of economic success than the prestigescores employed as the dependent variables by Chiswick (1991) and Hanes(1996). An advantage to using 1890-based income estimates by occupation ratherthan individually reported incomes is that the same income score is assigned toan occupation in both the 1900 and 1910 census sets. Therefore there is no needto be concerned with variations in the relative pay of certain occupations betweenthe census years. However, it is possible to capture the variability in individualincome due to periods of unemployment. I used information provided in thecensus data on unemployment in the previous year to scale the annual incomescores by months or weeks employed for each individual.6 My final alteration tothe original IPUMS census data was for individuals engaged in farming in 1900or 1910. The estimated annual income for farmers is lower than for almost allurban occupations, but this was offset somewhat in that the cost of living in ruralareas was also noticeably lower than in urban America at the turn of the century(Hatton and Williamson, 1991). Thus, the recorded annual income of farm-dwelling Americans would be lower relative to urban-based Americans than theirreal annual income earned once differences in the cost of living are considered.To compensate farm workers for cost-of-living differences I adjusted the wage offarm employees (both owner-farmers and day labor) by an appropriate urban/rural differential.7
Annual Income for Native and Foreign-Born Americans—1900 and 1910
The analysis of economic status of 1900 and 1910 census respondents waslimited to males between the ages of 16 and 65 years who reported theiroccupation to the census interviewer. These individuals were then divided intosix categories. The first category consists of native-born American men whoseparents were both born in the United States. Native-born individuals of nativeparentage are therefore at least two generations removed from any origins outsidethe United States. The second group includes all foreign-born males who enteredthe United States as adults.8 I placed immigrants who arrived as children into aseparate group to explore the possibility that the assimilation process differed forthose who entered American society at a young age. The fourth group containsnative-born Americans who are the children of immigrants to the United States.9
5 While income within a given occupation is held fixed in my study, I do have annual incomes for192 different occupations. This provides me with enough detail to capture changes in income asindividuals advance up the occupational ladder within an industry.
6 The 1900 census includes months unemployed in 1899; the 1910 census includes weeksunemployed in 1909.
7 I increased farm income by 18.5%, corresponding to the urban/rural cost-of-living differencefound in 1892 Michigan by Hatton and Williamson (1991).
8 I considered those ages 16 or higher to be adults.9 In this study the second-generation group consists of native-born Americans whose father is of
foreign birth.
331IMMIGRATION TO THE UNITED STATES
There is some evidence (Chiswick, 1977) that these “second-generation immi-grants” outperform native-born Americans with native-born parents in the UnitedStates labor market, possibly due to the transmission of positive characteristics(as a result of self-selection) from immigrant parents to their children. On theother hand, Joan Hannon (1982a) argued that the disadvantage of being foreign-born in Michigan copper mines was somehow transmitted to the children of theforeign born, who themselves entered the labor market with an earnings disad-vantage relative to those of native parentage. The immigrant population wasfurther subdivided into two geographical categories based on source countries.“Old” immigrants are those who arrived from areas in northern and westernEurope, which by 1900 had a long-established history of sending people to theUnited States. “New” immigrants consisted of arrivals from southern and easternEurope, areas that had not contributed much to the immigrant flow prior to1900.10
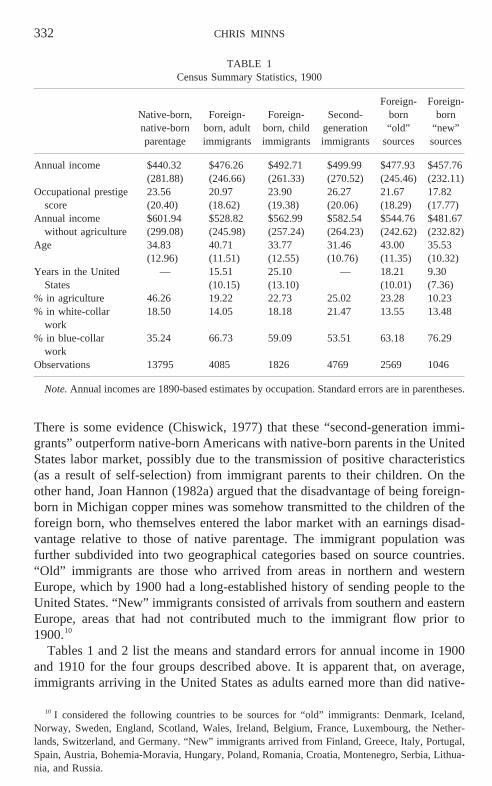
Tables 1 and 2 list the means and standard errors for annual income in 1900and 1910 for the four groups described above. It is apparent that, on average,immigrants arriving in the United States as adults earned more than did native-
10 I considered the following countries to be sources for “old” immigrants: Denmark, Iceland,Norway, Sweden, England, Scotland, Wales, Ireland, Belgium, France, Luxembourg, the Nether-lands, Switzerland, and Germany. “New” immigrants arrived from Finland, Greece, Italy, Portugal,Spain, Austria, Bohemia-Moravia, Hungary, Poland, Romania, Croatia, Montenegro, Serbia, Lithua-nia, and Russia.
TABLE 1Census Summary Statistics, 1900
Native-born,native-bornparentage
Foreign-born, adultimmigrants
Foreign-born, childimmigrants
Second-generationimmigrants
Foreign-born“old”
sources
Foreign-born
“new”sources
Annual income $440.32(281.88)
$476.26(246.66)
$492.71(261.33)
$499.99(270.52)
$477.93(245.46)
$457.76(232.11)
Occupational prestigescore
23.56(20.40)
20.97(18.62)
23.90(19.38)
26.27(20.06)
21.67(18.29)
17.82(17.77)
Annual incomewithout agriculture
$601.94(299.08)
$528.82(245.98)
$562.99(257.24)
$582.54(264.23)
$544.76(242.62)
$481.67(232.82)
Age 34.83(12.96)
40.71(11.51)
33.77(12.55)
31.46(10.76)
43.00(11.35)
35.53(10.32)
Years in the UnitedStates
— 15.51(10.15)
25.10(13.10)
— 18.21(10.01)
9.30(7.36)
% in agriculture 46.26 19.22 22.73 25.02 23.28 10.23% in white-collar
work18.50 14.05 18.18 21.47 13.55 13.48
% in blue-collarwork
35.24 66.73 59.09 53.51 63.18 76.29
Observations 13795 4085 1826 4769 2569 1046
Note.Annual incomes are 1890-based estimates by occupation. Standard errors are in parentheses.
332 CHRIS MINNS

born Americans of native parentage in both 1900 and 1910. The third and fourthcolumns in both tables reveal an occupational earnings advantage for immigrantsentering the United States as children and second-generation immigrants. This isinteresting in light of the fact that child immigrants and second-generationimmigrants are younger on average than adult immigrants or the native-born ofnative parentage and thus would probably be expected to be at a lower point onthe lifetime age-earnings profile. Adult immigrants maintained their occupationalearnings advantage in 1910 despite the influx of immigrants from new sourcesbetween 1900 and 1910. This would seem a sharp contrast to the conventionalview (Hannon, 1982a; McGouldrick and Tannen, 1977) that new immigrantssuffered a noticeable wage penalty in the American labor market. As Tables 1and 2 show, the average new immigrant managed to earn more than the averageAmerican-born male of native parentage.
However, the picture of relative immigrant performance based on summarystatistics is heavily dependent on the distribution of both immigrants and native-born Americans across different sectors of the economy. Tables 1 and 2 dividethe American working population into three occupational categories.11 The firstcategory is agriculture, which incorporates self-employed farmers and nontenantagricultural labor. The second grouping consists of blue-collar workers. This
11 This scheme roughly follows the classification guidelines originally set out by Alba Edwards(1917).
TABLE 2Census Summary Statistics, 1910
Native-born,native-bornparentage
Foreign-born, adultimmigrants
Foreign-born, childimmigrants
Second-generationimmigrants
Foreign-born“old”
sources
Foreign-born
“new”sources
Annual income $483.23(298.54)
$508.49(259.32)
$548.99(281.53)
$545.58(297.85)
$513.41(263.26)
$497.97(249.22)
Occupational prestigescore
25.65(22.08)
21.84(19.72)
27.05(21.18)
29.30(22.15)
23.97(19.77)
19.20(18.71)
Annual incomewithout agriculture
$651.33(285.09)
$550.06(254.06)
$609.61(269.96)
$641.58(278.08)
$586.18(251.02)
$515.07(246.94)
Age 34.95(13.09)
38.27(12.09)
33.93(12.46)
33.29(12.02)
43.27(11.88)
33.51(10.20)
Years in the UnitedStates
— 13.19(11.07)
25.14(13.33)
— 18.92(11.49)
7.93(7.45)
% in agriculture 41.01 13.40 16.69 23.81 21.37 5.92% in white-collar
work22.68 15.05 23.05 27.63 16.32 12.54
% in blue-collarwork
36.31 71.55 60.26 48.56 62.31 81.54
Observations 53257 18674 6152 18422 7764 9038
Note.Annual incomes are 1890-based estimates by occupation. Standard errors are in parentheses.
333IMMIGRATION TO THE UNITED STATES
group includes operatives, craftsmen, and other laboring occupations. I alsoincluded service workers in the blue-collar group. Professionals are members ofthe third group, white-collar workers, along with managers, officials, salespeople,and clerical workers. Tables 1 and 2 show that over 40% of native-bornAmericans of native parentage were engaged in agriculture in 1900 and 1910.Immigrant groups were less inclined to enter agricultural pursuits, focusinginstead on the blue-collar sectors of the economy. This trend is even morepronounced for the new immigrants surveyed in the 1910 census (Table 1). Thevariation in sectoral distribution between native-born Americans and immigrantsplays a large role in determining the difference in average incomes among thesegroups. The sixth row of Tables 1 and 2 show how average occupational incomechanges when agricultural workers are excluded from the sample. Native-bornAmericans employed in white-collar or blue-collar occupations in 1900 and 1910earned much higher incomes than did immigrant workers employed in nonagri-cultural sectors. The occupational earnings advantage seen in Tables 1 and 2 forsecond-generation immigrants and immigrants who arrived as children does nothold when the sample is restricted to nonagricultural workers.
Regression Analysis—1900 and 1910
To compare the relative performance of adult male immigrants and native-born, native-parentage Americans in the United States labor market in the early20th century, I estimated earnings profiles over the life cycle for the maleAmerican working population. The logarithm of occupational income served asthe dependent variable. Age was included as an explanatory variable, as it is theonly proxy for experience available in the IPUMS data set. The square of age wasalso included to capture the notion of decreasing returns to experience inearnings. I follow Hatton (1997) in including two additional age terms, (age-25)and (age-25)-squared. These terms allow for the possibility that workers underthe age of 25 have a rapidly rising income profile, as a model including only thestandard quadratic in age has been shown to be an inappropriate functional formwith other historical data (Hatton, 1997).12 For nonnatives the number of yearssince migration to the United States is included as a second explanatory variable.This variable measures the rate of assimilation into the United States labormarket, as one would expect an immigrant’s income to rise as he acquired thespecific human capital necessary for success in the United States.
I estimated this simple regression model for the blue-collar and white-collarsectors of the American economy in 1900 and 1910, with different regressions torepresent the sectors separately as well as a combined regression that includes allnonagricultural workers. Why choose this particular framework to approach theproblem of the economic performance of immigrants relative to native-bornAmericans of native parentage? Comparing the entire employed immigrant and
12 Note that the variable (age-25) is restricted to a value of zero at all ages below 25. Thus it shouldbe technically written as Max[0, (age-25)] and its square as (Max[0, (age-25)])2.
334 CHRIS MINNS

native-born, native-parentage populations would be misleading due to the muchhigher proportion of natives engaged in the agricultural sector. Immigrants wouldclearly out-earn the native-born on aggregate, though they might actually havelower earnings and slower earnings growth within all three occupational sectors.In addition, almost all of the existing research on immigrant performance in thelate 19th and early 20th centuries is based on sources providing subsets of theblue-collar sector.13 The formulation I adopt below allows my results to becompared with articles limited to blue-collar occupations, while also determiningwhat contribution (if any) employment in white-collar occupations may havemade to changing the relative labor market outcomes of immigrants and native-born, native-parentage workers.
Regression results for 1900 and 1910 are seen in Tables 3 and 4. Althoughthere is quite a bit of variation across the different population groups andregression formulations, the adjustedR2 figures are well in line with the resultsdrawn from the 1910 IPUMS data by Chiswick (1991) and Hanes (1996).Turning to specific coefficient estimates, note first that in both samples thecoefficient measuring years spent in the United States is significant at the 5%level for adult immigrants in all but one case.14 When the adult immigrantpopulation is split into those from new and old sources, years in the United Statesretains its significance in at least two of the three regressions for both old and newimmigrants in 1900 and is significant in all old and new immigrant regressionsin 1910. These results underline the importance of U.S.-specific human capitalformation for adult immigrants. The estimates for the effect of years spent in theUnited States for immigrants arriving as children confirm that “assimilationeffects” for this group were much weaker; years spent in the United States wassignificant in only one regression in 1910, and the coefficient estimates for thisvariable are of a much lower magnitude for immigrants who arrived in the UnitedStates as children. This suggests that immigrants arriving in the United States aschildren were integrated into American society to a greater extent before enteringthe labor market. Labor market experience (as proxied by age) emerges as asignificant factor in the earning power of native-born Americans in 1910, as theage and age-squared terms are significant in 1910 for the native-born of native-parentage and second-generation immigrants in all three regressions. The ma-jority of the terms representing the effect of work experience on income in Tables
13 The 1911 Immigration Commission data used by Higgs (1971), McGouldrick and Tannen(1977), Blau (1980), and Hatton (2000) contains information on “over half a million employees in avariety of manufacturing and mining industries in 1909” (Hatton, 2000). Hannon (1982a,b), Eichen-green and Gemery (1986), Hanes (1996), and Hatton (1997) draw results from late-19th century StateLabor Bureau reports in Michigan, Iowa, and California that are all restricted to specific subsets ofwhat I have defined as the blue-collar sector.
14 In the regression for foreign-born adult immigrants in the white-collar sector in 1910, thecoefficient for years spent in the United States just fails to be significant at the 10% level, with apvalue of 0.104.
335IMMIGRATION TO THE UNITED STATES

TABLE 3Regression Results, 1900
Factor
Native-born,native
parentage
Foreign-born,adult
immigrants
Foreign-born,child
immigrants
Second-generationAmericans
Foreign-born“old”
sources
Foreign-born“new”sources
Allage 0.035826
(0.0529769)0.2466324(0.1929237)
0.1149136(0.0958351)
0.1136008(0.0627295)
20.2713656(0.3239153)
0.3723264(0.2536332)
age2 20.0000243(0.0012464)
20.0053326(0.0043592)
20.0020509(0.002269)
20.0019748(0.0014902)
0.006517(0.0072853)
20.0081776(0.0057555)
age25 20.0236265(0.0110163)
0.01588(0.0277266)
20.0086681(0.0212965)
20.0065121(0.014085)
20.0561569(0.0450006)
0.025795(0.0381643)
age252 20.0002237(0.0012313)
0.0052584(0.0043455)
0.0020871(0.0022365)
0.0017725(0.0014663)
20.0066439(0.0072692)
0.0082309(0.0057274)
yus — 0.0214485(0.0029881)
0.0044699(0.0057652)
— 0.009585(0.0046308)
0.0169674(0.0053226)
yus2 — 20.0002482(0.000074)
20.00007(0.0001013)
— 20.0000381(0.0001038)
0.0002317(0.0001794)
constant 5.386035(0.5536307)
3.191881(2.110098)
4.58469(0.9940705)
4.664893(0.6476614)
8.852199(3.564541)
1.809162(2.760281)
F test age terms 110.98 11.43 6.90 44.52 6.40 7.21F test yus terms — 63.51 0.30 — 14.26 46.29F test all terms 110.98 25.97 15.42 44.52 6.61 16.69Adj. R2 0.0560 0.0434 0.0578 0.0464 0.0168 0.0912
Observations 7414 3300 1411 3576 1971 939
Blue-collarage 0.0573504
(0.0480013)0.1171802(0.1569963)
0.1218342(0.0818231)
0.110596(0.0597582)
20.2878044(0.269848)
0.1944088(0.2054155)
age2 20.0008338(0.0011312)
20.0024171(0.0035526)
20.0024507(0.0019415)
20.0020374(0.0014208)
0.0069853(0.0060728)
20.0041508(0.0046669)
age25 20.0068715(0.0101643)
20.0012092(0.0228521)
0.0016223(0.0185996)
20.0057987(0.0135444)
20.0653692(0.0378445)
0.0051278(0.0312994)
age252 0.0005321(0.0011162)
0.0023645(0.0035409)
0.0024044(0.0019113)
0.0019117(0.001397)
20.0070648(0.0060588)
0.0041461(0.0046426)
yus — 0.0164952(0.0025497)
0.0030598(0.0051149)
— 0.008707(0.0040819)
0.0070615(0.0049447)
yus2 — 20.0002418(0.0000645)
20.0000341(0.0000928)
— 20.0001142(0.0000928)
0.0001793(0.0001958)
constant 5.154489(0.5008341)
4.565974(1.714111)
4.549931(0.8468414)
4.637831(0.6165351)
8.918464(2.968168)
3.722938(2.232447)
F test age terms 46.89 14.48 3.72 21.85 923 6.77F test yus terms — 37.30 0.25 — 5.26 12.10F test all terms 46.89 17.41 5.05 21.85 7.86 5.80Adj. R2 0.0364 0.0349 0.0220 0.0317 0.0248 0.0348
Observations 4862 2726 1079 2552 1623 798
White-collarage 0.1166048
(0.0808249)0.4764618(0.7742452)
0.3337458(0.2083423)
0.1567686(0.0985307)
20.0885984(0.9061307)
0.3003418(2.211961)
age2 20.0017035(0.0018944)
20.0110443(0.0171206)
20.0064185(0.004885)
20.002817(0.0023357)
0.0022861(0.0203113)
20.0097601(0.0480417)
age25 20.0198125(0.0161841)
0.07642(0.0914093)
20.0067066(0.0418757)
20.0034448(0.0216133)
20.0191777(0.1187592)
0.1636008(0.2126249)
age252 0.001498(0.0018754)
0.0109137(0.0170873)
0.0064248(0.0048377)
0.0026774(0.0023021)
20.0024944(0.0202776)
0.0100834(0.0479419)
yus — 0.0152311(0.0076671)
20.0052839(0.010506)
— 0.0080557(0.0093827)
0.037402(0.0172864)
yus2 — 20.0001475(0.0001746)
0.0000612(0.0001683)
— 20.0000227(0.0001989)
20.0004911(0.0004469)
336 CHRIS MINNS

3 and 4 are not statistically significant, butF tests against models excluding theseterms reject their exclusion in most cases.15
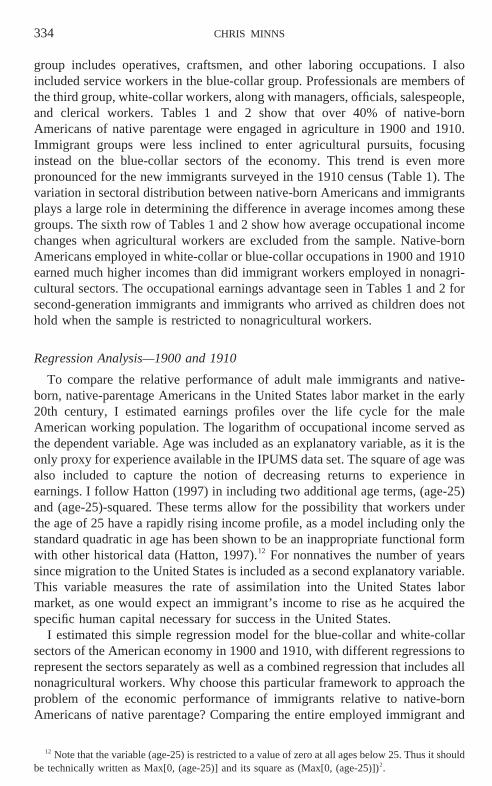
Graphical representations of the predicted age-income profiles are perhaps thebest way to use the results in Tables 3 and 4 to assess the economic performanceof immigrants and native-born workers. Figure 1 compares native-born Ameri-cans of native parentage with adult immigrants in both the blue-collar andwhite-collar sectors in 1900, while Fig. 2 presents the earnings profile for theregression combining the sectors. Figs. 3 and 4 apply the same structure to the1910 sample.
Figure 1 shows that in 1900 the foreign-born adult immigrants employed inblue-collar work managed to “catch up” and out-earn native-born Americansbefore the end of the life cycle. In the white-collar sector, adult immigrants didnot completely close the gap with native-born, native-parentage Americans,although they did experience faster income growth after arrival in the UnitedStates. The income gap at age 25, which is approximately the average age ofarrival for adult immigrants in 1900 and 1910, is less than 10% in both blue- andwhite-collar sectors. This difference on arrival is less than has typically beenreported in immigrant assimilation studies for both present-day and turn-of-the-century migration (Chiswick, 1978; Blau, 1980). However, income growth afterarrival is slower than predicted in much of the literature on immigrant perfor-mance in the United States. Foreign-born adult immigrants occupied in blue-collar and white-collar work still trailed their native-born native parentagecounterparts by 3.8 and 4.7% after 15 years in the U.S. labor market. Figure 2
15 The reader may still be wary of the lack of significance seen in the coefficients in the aboveregressions. This seems to be a consequence of several factors. Separating the sectors eliminates theeffect of advancement over the life cycle due to movement between sectors of the economy. We willsee later that immigrant and native-born cohorts were able to achieve income growth by movingbetween sectors over time. The most significant problem appears to be the inclusion of the (age-25)terms. These are highly significant for native-born native-parentage Americans in 1910, but for theother groups they serve to compromise the significance of the remaining variables. To be consistentI used the formulation that best fits the native-born of native parentage in 1910 in all other groups.
TABLE 3—Continued
Factor
Native-born,native
parentage
Foreign-born,adult
immigrants
Foreign-born,child
immigrants
Second-generationAmericans
Foreign-born“old”
sources
Foreign-born“new”sources
constant 4.809288(0.847814)
1.555771(8.690354)
2.449173(2.183605)
4.48217(1.019243)
7.37164(9.99838)
5.090112(25.33687)
F test age terms 77.43 1.19 7.96 43.04 0.42 4.07F test yus terms 6.72 0.16 — 2.66 6.64F test all terms 77.43 2.70 10.35 43.04 1.98 3.23Adj. R1 0.1070 0.0174 0.1449 0.1412 0.0167 0.0873
Observations 2552 574 332 1024 348 141
Note.Standard errors in parentheses.F tests evaluate the joint significance of the age terms andtheir squares, years in the United States and its’ square, or all of the variables in the regression.Figures significant at the 5% level are in bold.
337IMMIGRATION TO THE UNITED STATES

TABLE 4Regression Results, 1910
Native-born,native-
parentage
Foreign-born,adult
immigrants
Foreign-born,child
immigrants
Second-generationAmericans
Foreign-born“old”
sources
Foreign-born“new”sources
Allage 0.1202777
(0.0224511)20.0183038(0.0574121)
0.0070959(0.0511375)
0.1114071(0.0309465)
0.1277517(0.1398052)
20.0544877(0.065568)
age2 20.0021758(0.0005279)
0.0005013(0.0012987)
0.0004104(0.0012082)
20.0019974(0.0007348)
20.0026071(0.0031429)
0.0012166(0.0014861)
age25 0.0023321(0.0046479)
20.0020411(0.0086309)
20.0226733(0.0111254)
0.0034264(0.0069111)
0.0061266(0.0196423)
20.0038897(0.0102425)
age252 0.0018925(0.0005216)
20.0006534(0.0012912)
20.000557(0.0011899)
0.0016565(0.0007233)
0.0024211(0.0031328)
20.0012327(0.0014736)
yus — 0.0201027(0.0011661)
0.0056712(0.0027273)
— 0.0088341(0.0020907)
0.0239417(0.001932)
yus2 — 20.0003158(0.0000315)
20.0000586(0.0000497)
— 20.0000758(0.0000474)
20.0003904(0.0000676)
constant 4.688765(0.2347683)
6.183828(0.6279755)
5.815067(0.530471)
4.794484(0.3198476)
4.621148(1.539978)
6.593693(0.7158524)
F test age terms 582.11 7.74 13.49 287.40 9.13 3.18F test yus terms — 242.78 3.32 — 26.41 173.99F test all terms 582.11 198.55 52.91 287.40 20.07 113.25Adj. R2 0.0689 0.0683 0.0573 0.0755 0.0184 0.0734
Observations 31417 16171 5125 14035 6105 8503
Blue-collarage 0.1011452
(0.0194763)20.0099254(0.0441076)
0.0152448(0.0415845)
0.0808462(0.0284527)
0.1009564(0.1125353)
20.0191471(0.0488562)
age2 20.0019788(0.0004591)
0.0003179(0.0009983)
20.0000197(0.0009824)
20.0015111(0.0006757)
20.0020034(0.0025292)
0.0004661(0.0011081)
age25 0.0042487(0.0041197)
20.0051842(0.0066889)
20.015829(0.0091199)
0.0027039(0.0064077)
20.0018373(0.0158186)
20.0034545(0.0077256)
age252 0.0018023(0.0004531)
20.0003942(0.0009491)
20.0000438(0.0009663)
0.0012739(0.0006646)
0.0019455(0.0025207)
20.0005225(0.0010977)
yus — 0.0101212(0.0009491)
0.0036005(0.0022433)
— 0.0049716(0.0017494)
0.0073084(0.0015505)
yus2 — 20.0001489(0.0000263)
20.0000143(0.0000423)
— 20.0000819(0.0000404)
20.0001118(0.0000568)
constant 4.869443(0.2031001)
6.065681(0.4822083)
5.749239(0.4314962)
5.089132(0.2941589)
4.874643(1.240079)
6.181989(0.5330245)
F test age terms 170.03 7.16 7.49 89.03 7.11 1.18
F test yus terms — 101.69 4.13 — 5.14 27.13F test all terms 170.03 58.78 18.37 89.03 7.79 12.52Adj. R2 0.0338 0.0253 0.0273 0.0379 0.0084 0.0093
Observations 19336 13361 3707 8945 4838 7370
White-collarage 0.1382994
(0.0324079)0.2318604(0.1508061)
0.2692586(0.0819436)
0.2546742(0.0444685)
0.5765199(0.3164143)
20.1294762(0.1544311)
age2 20.0023076(0.000758)
20.0047479(0.0033963)
20.0048378(0.0019366)
20.0049333(0.0010556)
20.0126464(0.0071335)
0.0035081(0.0034747)
age25 20.0072055(0.0064191)
0.0122637(0.0212993)
20.015147(0.0174352)
0.006877(0.0097842)
0.0634166(0.0449149)
20.0417465(0.0219003)
age252 0.0020204(0.0007501)
0.0045985(0.003385)
0.0046051(0.0019129)
0.004676(0.0010405)
0.0124534(0.0071167)
20.0036165(0.0034599)
yus — 0.0035017(0.0021503)
20.0103208(0.0043294)
— 0.0100429(0.0038709)
0.0065407(0.0029255)
yus2 — 20.0000644(0.0000518)
0.0001246(0.0000724)
— 20.0001149(0.0000821)
20.0001518(0.0000863)
338 CHRIS MINNS

shows that when the blue-collar and white-collar sectors are pooled to createcombined earnings profiles, there is a noticeable increase in the gap in earningsbetween native-born, native-parentage Americans and foreign-born adult immi-grants. The foreign-born trail native-parentage Americans by over 24.1% ofincome at age 25, with the gap falling to 16.3% after 15 years in the UnitedStates. This earnings differential is larger than what has typically been reportedin immigrant assimilation studies at the end of the 19th or beginning of the 20thcenturies, as previous research generally excludes the well-paid white-collaroccupations included in the pooled regressions drawn upon in Fig. 3. My resultsfor the 1900 census suggest that, contrary to Hanes (1996) findings, adultimmigrants did see their occupational incomes rise faster than the native-born ofnative parentage. Within occupational sectors, immigrant incomes were converg-ing to the earnings of native-born, native-parentage Americans, though a muchsmaller fraction of the immigrant population were engaged in well-paid white-collar work.
In 1910, foreign-born adult immigrants working in the blue-collar sector (Fig.
FIG. 1. Blue-collar and white-collar income by cohort, 1900.
TABLE 4—Continued
Native-born,native-
parentage
Foreign-born,adult
immigrants
Foreign-born,child
immigrants
Second-generationAmericans
Foreign-born“old”
sources
Foreign-born“new”sources
constant 4.647712(0.3409709)
3.95127(1.656706)
3.230183(0.8483572)
3.391018(0.459216)
0.1055823(3.471087)
7.919505(1.699228)
F test age terms 562.55 6.77 41.46 382.83 2.01 6.83F test yus terms — 1.63 3.45 — 7.53 3.00F test all terms 562.55 11.08 55.42 328.83 10.77 10.18Adj. R2 0.1568 0.0211 0.1873 0.2049 0.0443 0.0464
Observations 12081 2810 1418 5090 1267 1133
Note.Standard errors in parentheses.F tests evaluate the joint significance of the age terms andtheir squares, years in the United States and its’ square, or all of the variables in the regression.Figures significant at the 5% level are in bold.
339IMMIGRATION TO THE UNITED STATES

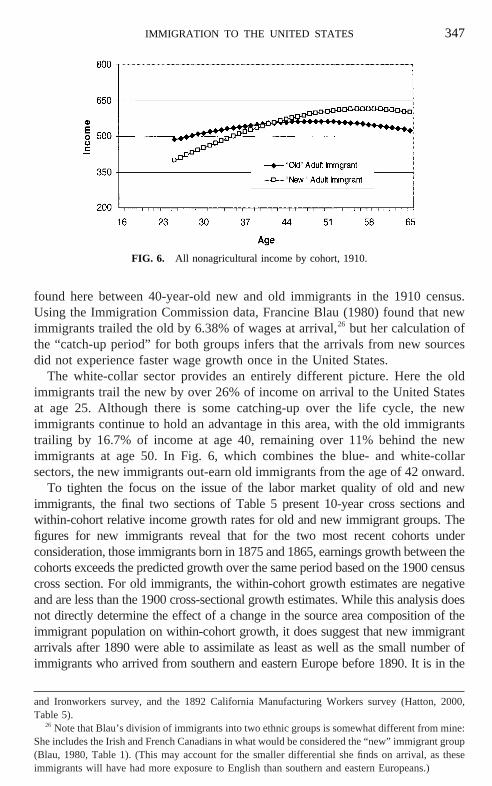
3) had lower relative occupational incomes upon entry to the United States thanin the 1900 sample, though adult immigrants did experience slightly fasterrelative wage growth in the blue-collar sector in 1910. At the age of 25foreign-born adult immigrants would be predicted to earn 14.5% less thannative-born, native-parentage Americans in blue-collar occupations; despitesomewhat faster income growth across the cross section than in 1900, theimmigrant group was still 8.9% behind native-born Americans in the same sectorat the age of 40. For white-collar workers the pattern of predicted income overthe life cycle has completely changed in 1910. In the later census, it is theforeign-born adult immigrants who hold an edge over native-born, native-parentage Americans. This gap falls slowly with increasing age, from a maxi-mum of 11.7% at age 25 to 5.2% at age 40, but the native-born do not catch upentirely over the normal working lifetime. Finally, Fig. 6 reveals that in thepooled regression adult immigrants trail native-parentage Americans by 29.6% atage 25, with the gap closing to 17.3% by age 40. This picture is fairly similar to
FIG. 2. All nonagricultural income by cohort, 1900.
FIG. 3. Blue-collar and white-collar income by cohort, 1910.
340 CHRIS MINNS

that seen in Fig. 2 for the 1900 cross section; there is a somewhat larger incomedifferential both on arrival and at age 40, though the rate of relative “catch-up”over the 15 years in between is quicker than in 1900.16
Cross-Sectional Growth vs Cohort Growth
My results to this point are drawn from single cross-sectional regressions andthus could be subject to bias due to cohort effects. It would be invalid to infer any“catching up” on the part of immigrants from a single cross section if recentimmigrant cohorts did not experience positive relative income growth betweenthe 1900 and 1910 census samples. Do cohort effects in the immigrant populationundermine the results of my sectoral analysis of the 1900 and 1910 IPUMScensus data? I can test this proposition by following the progress of immigrantcohorts across the two censuses.
Table 5 uses results from the regressions for 1900 and 1910 seen in Tables 3and 4 to determine the cross-sectional income growth of immigrants relative tonative-born Americans over 10-year periods under the assumption that immi-grants arrive at age 25. For example, the 1900 cross section predicts relativeincome growth of 3.70% after 10 years in the United States for newly arrived
16 While the regressions discussed do not control for differences in observable characteristicsbetween immigrants and native-parentage Americans, I have estimated earnings regressions (notshown in this article) which include measures of literacy and English language ability. Based oncombined blue-collar and white-collar regressions, if foreign-born adult immigrants were to have thesame level of literacy and English proficiency as the native-born, native-parentage population, adultimmigrants would trail native-parentage earnings by 13.7% on arrival in 1900, with the gap closingto 13.4% by age 40. In 1910, the earnings differential would be 16.8% at age 25, closing to 13.2%by age 40. In the blue-collar sector, controlling for differences in literacy and English language abilityreduces the earnings differential at age 40 to 2.2% in 1900 and to 6.6% in 1910. In white-collar workthe differential at age 40 in 1900 falls to 4.1%, while the immigrant advantage over the native-bornin this sector in 1910 is reduced to 4.3%. I have written another article (Minns, 2000) which providesa deeper investigation into the effect of English language ability on immigrant labor marketoutcomes.
FIG. 4. All nonagricultural income by cohort, 1910.
341IMMIGRATION TO THE UNITED STATES
25-year-old immigrants in blue-collar and white-collar occupations. Cross-sec-tional income growth estimates can then be compared to the progress of partic-ular immigrant cohorts between the 1900 and 1910 surveys. The counterpart tothe cross-sectional result listed above is the relative change in income between anewly arrived 25-year-old immigrant blue-collar worker in 1900 and a 35-year-old immigrant blue-collar worker in 1910 who had been in the United States for10 years.
The first section of Table 5 reveals that estimates of relative within-cohortgrowth for foreign-born adult immigrants between 1900 and 1910 are quite closeto cross-sectional growth estimates from the 1900 and 1910 censuses. Forimmigrants cohorts born in 1855 or later, the 1900 cross-section regressionpredicts relative earnings growth of 2.6 to 5.6% over the next 10 years, while therelative income of the same immigrant cohorts increased by 1.2 to 3.7% betweenthe censuses. These figures suggest that adult immigrants did experience positiveincome growth relative to native-born native parentage at rates only slightlyoverstated by findings based on cross-section regressions. The second and thirdsections of Table 5 separate the analysis into the blue-collar and white-collarsectors. In blue-collar work the cross-sectional relative growth estimates rangefrom 1.0 to 3.2% over 10 years, while within-cohort growth is found to benegative over the 10-year span. In the white-collar sector, cross-sectional relativegrowth rates of up to 3.6% in 1900 are accompanied by estimates of relativegrowth between the cohorts of between 4.8 and 16.5%. What these two sectionsmake clear is that the earnings convergence achieved by foreign-born adultimmigrant cohorts came not through advance within blue-collar industrial andmanufacturing occupations (which, as noted, are the focus of most previousresearch on immigrant performance in this period), but rather by attaining highlypaid white-collar occupations.
Mobility Between Sectors
The preceding paragraphs have revealed that the relative income growthexperienced by American adult immigrants in the early 20th century was largelydriven by rising immigrant incomes in white-collar occupations. To complete thestory one must also consider whether the opportunities for occupational mobilitybetween sectors were similar for immigrants and native-born Americans. Indeed,some writers have argued that the economic attainment of immigrants washampered by discrimination that specifically limited occupation mobility. Han-non (1982a, p. 48) wrote that“ . . . theforeign born were denied opportunities foracquiring the skills necessary for advancement or they were denied access to theupper rungs of the occupational ladder . . ..” In her subsequent article Hannonargued that immigrant occupational mobility was constrained particularly inMichigan’s large cities (Hannon, 1982b). On the other hand, Thomas Kessner(1977) found a great degree of occupational mobility between occupationalsectors among Jewish and Italian immigrants in New York City at the turn of the20th century. Kessner claims that results for New York City may be more
342 CHRIS MINNS

representative of the immigrant experience in America than studies based onsmaller centers which received fewer emigrants from Europe. Joe Ferrie’s (1997)study of European immigrants arriving between 1840 and 1850 also foundsubstantial occupational mobility among the new arrivals in the United States.Ferrie’s data reveal that 44% of immigrants who reported being unskilledlaborers in Europe had moved to higher status occupations by the 1850 census,while 25% of those in while-collar and skilled or semiskilled trades in Europewere employed as unskilled workers in the 1850 American census. The degree ofupward and downward mobility appears to differ among immigrant nationalities,with British and German arrivals more likely to move to higher status occupa-tions (and less likely to move to lower status occupations) than their Irishcounterparts.
TABLE 5Within-Cohort Growth vs Cross-Sectional Growth
10-year cross-sectionalgrowth, 1990
10-year cross-sectionalgrowth, 1910
Within cohort growth,1900 to 1910
All nonagriculture1900 arrival 0.056024 0.054650 0.0369641890 arrival 0.041144 0.017730 0.0355901880 arrival 0.026264 20.019190 0.0121761870 arrival 0.011384 — 20.033277Blue-Collar
1900 arrival 0.028953 0.029917 20.0231001890 arrival 0.030413 0.020177 20.0221361880 arrival 0.031873 0.010437 20.0323721870 arrival 0.016904 — 20.053808
White-Collar1900 arrival 0.035546 20.032811 0.1649961890 arrival 0.021026 20.018131 0.0966401880 arrival 0.006506 20.003451 0.0574821870 arrival 7.15E-05 — 0.047526
New immigrant, allnonagriculture
1900 arrival 0.005543 0.088785 0.0296431890 arrival 0.112143 0.064145 0.1128851880 arrival 0.218743 0.039505 0.0648871870 arrival 0.325343 — 20.11435
Old immigrant, allnonagriculture
1900 arrival 20.02242 20.00817 20.037491890 arrival 20.00582 20.002387 20.023241880 arrival 0.01078 0.000426 20.02131870 arrival 0.02738 — 20.03185
Note.All growth rates are calculated over 10-year periods. The figures indicate the income growthof immigrants relative to the income of native-born, native-parentage Americans of the same age inthe same sector.
343IMMIGRATION TO THE UNITED STATES

Were immigrants able to combine high incomes within white-collar work withthe ability to enter this sector of the American economy between 1900 and 1910?Table 6 follows the distribution of immigrant arrival cohorts among the threesectors of the economy in the 1900 and 1910 censuses. These figures suggest thatadult immigrants were able to move across sectors when opportunities presentedthemselves, as the proportion of each cohort engaged in the white-collar sectorincreased between 1900 and 1910. Comparing adult immigrant cohorts to sim-ilarly aged native-born Americans17 shows that the immigrants arriving since1885 were more adept at moving into the higher earning white-collar sectorbetween censuses than the comparable group in the native-born Americanpopulation. There is an increase of over 10% in the share of workers in thewhite-collar sector between 1900 and 1910 for the 1886–1900 immigrant co-horts. The white-collar gains between the surveys for similarly aged native-born,native-parentage Americans (aged less than 34 in 1900) are less than 8.1%.
These results would seem to dispel the myth that immigrants were somehowmore constrained in their occupational opportunities than native-born, native-parentage Americans. However, there remains the difficulty of accounting forreturn migration out of the United States. High rates of return migration toEurope have been reported for certain immigrant groups.18 The results aboveshowing immigrants moving to the well-paid white-collar sector between the1900 and 1910 censuses is biased if many immigrants in agriculture and theblue-collar sector in 1900 were returning to their source countries before the
17 The average age of arrival for adult immigrants was approximately 25; thus it seems reasonableto compare the 1896–1900 immigrant cohort of the 1900 census with native-born, native-parentageAmericans aged 25 to 29 years in the same census.
18 Hanes (1996, Table 6) cites data from Kuznets and Rubin (1954) suggesting that out-migrationof the foreign-born was equal to 15.3% of the foreign-born population residing in the United Statesin 1910, with much higher rates for immigrants other than the British, Irish, or Germans.
TABLE 6Movement into the White-Collar Sector between 1900 and 1910
Cohort
% Increasein white-
collar(all imm.)
% Increasein white-
collar(all imm.,adjusted)
% Increasein white-
collar(old imm.,adjusted)
% Increasein white-
collar(new imm.,adjusted)
% Increasefor the
comparablen.b. cohort
1896–1900 11.82 10.35 2.65 12.49 8.081891–1895 12.51 10.42 11.23 14.70 8.081886–1890 11.75 9.38 6.06 10.78 4.951881–1885 6.57 3.91 4.04 7.79 7.491876–1880 5.83 2.63 7.09 21.00 7.39
Note. Figures list the increase in the share of each population engaged in white-collar workbetween 1900 and 1910. The comparable native-born cohorts are in the same age bracket as theimmigrant cohort, i.e., 25–30 years old for the 1896–1900 cohort.
344 CHRIS MINNS

second census. As noted earlier, substantial return migration will also taintestimates of income growth in single cross-sectional regressions and in analysestracking cohort growth across successive surveys. I tried to tease out a roughestimate of return migration from the census returns by comparing the ratio ofparticular immigrant and native-born cohort populations in the 1910 and 1900surveys.19 Assuming that mortality rates were the same for adult immigrants andnative-born Americans in the same age brackets, differences in the “increase” inthe size of the cohort between immigrants and the native-born from 1900 to 1910should indicate the magnitude of return migration to Europe on the part ofAmerican immigrants.20 My calculations reveal that the 1910 census contains2.91 times as many Americans born between 1860 and 1875 (i.e., ages 25–40 in1900) as the 1900 survey. For immigrants this ratio is smaller, with the 1910census containing 2.78 times as many old immigrants born between 1860 and1875 as in 1900 and 2.46 times as many new immigrants of the same ages as in1900.21 If mortality rates were the same for male adult immigrants and native-born American males of native parentage, and the census sample does notunderrepresent immigrant populations, the figure above implies that 4.5% of theold immigrants had emigrated out of the United States by 1900. For newimmigrants, the estimate of out migration rises to 15.5%.22
It would seem, however, that advancement through the sectors of the Amer-ican economy remains a strong feature of immigrant performance despite out-migration up to 16% in some sections of the immigrant population. Even if 4.5%of old immigrants and 15.5% of all immigrants departed between 1900 and1910,23 and all of these departures came from the lower paid agricultural andblue-collar sectors, I still find that adult immigrants were highly mobile betweenthe sectors of the American economy (second column of Table 6).
19 The age group I examine consists of those ages 25–40 in 1900. For immigrants only those whoarrived by 1900 were included in the 1910 samples.
20 Note that due to the larger sample drawn from the 1910 census means that the cohort populationsfor 1910 will be larger than 1900 despite mortality and return migration.
21 I chose not to break down the immigrant groups into individual nationalities. One problem withsubdividing the immigrant population to this extent is that some of the national/age group cohortswould be quite small, making implied estimates of return migration sensitive to sampling error.Another difficulty is that the definition used by the census Bureau for the boundaries of some of thesource countries changed over this period.
22 This figure also assumes that there was equal out-migration by native-born Americans and adultimmigrants to regions other than immigrant source countries (i.e., any migration to Canada duringthis period). Note also that the figures here and in Table 6 do not change significantly if immigrantmortality rates differ somewhat from those of native-born Americans. If immigrants suffered highermortality rates than native-born Americans the estimated rates of return migration to Europe arelower than what I have calculated, and there is therefore the correction for return migration in Table6 should actually be smaller than I have indicated. I also experimented with lower mortality rates forimmigrants, finding that the rate of return migration my either old or new immigrants would increaseby only 4 to 5% had there beenno mortality within cohorts between 1900 and 1910.
23 This figure, which is the estimate return migration rate for new immigrants, surely overstatesactual return migration among the cohorts of Table 6, as they include old immigrants with theircorrespondingly lower return migration rates.
345IMMIGRATION TO THE UNITED STATES
“Old” vs “New” Immigrants in 1910
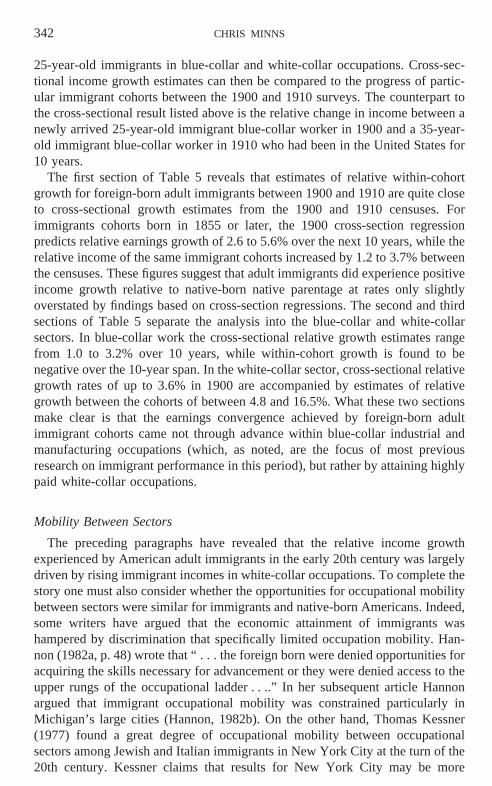
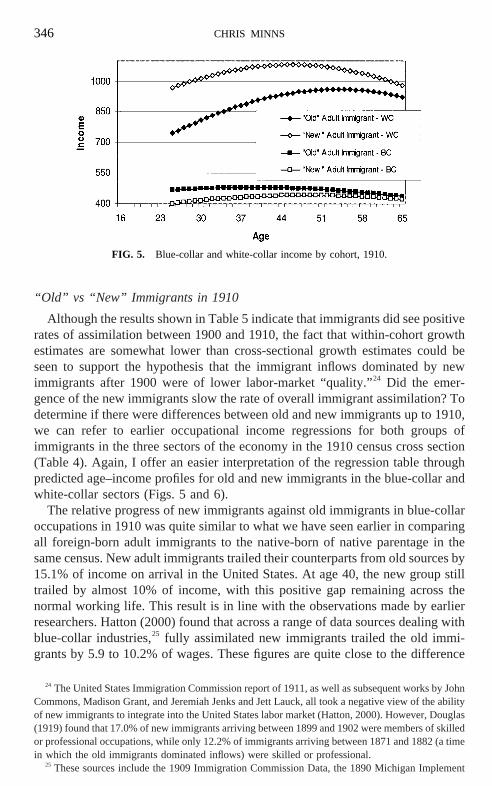
Although the results shown in Table 5 indicate that immigrants did see positiverates of assimilation between 1900 and 1910, the fact that within-cohort growthestimates are somewhat lower than cross-sectional growth estimates could beseen to support the hypothesis that the immigrant inflows dominated by newimmigrants after 1900 were of lower labor-market “quality.”24 Did the emer-gence of the new immigrants slow the rate of overall immigrant assimilation? Todetermine if there were differences between old and new immigrants up to 1910,we can refer to earlier occupational income regressions for both groups ofimmigrants in the three sectors of the economy in the 1910 census cross section(Table 4). Again, I offer an easier interpretation of the regression table throughpredicted age–income profiles for old and new immigrants in the blue-collar andwhite-collar sectors (Figs. 5 and 6).
The relative progress of new immigrants against old immigrants in blue-collaroccupations in 1910 was quite similar to what we have seen earlier in comparingall foreign-born adult immigrants to the native-born of native parentage in thesame census. New adult immigrants trailed their counterparts from old sources by15.1% of income on arrival in the United States. At age 40, the new group stilltrailed by almost 10% of income, with this positive gap remaining across thenormal working life. This result is in line with the observations made by earlierresearchers. Hatton (2000) found that across a range of data sources dealing withblue-collar industries,25 fully assimilated new immigrants trailed the old immi-grants by 5.9 to 10.2% of wages. These figures are quite close to the difference
24 The United States Immigration Commission report of 1911, as well as subsequent works by JohnCommons, Madison Grant, and Jeremiah Jenks and Jett Lauck, all took a negative view of the abilityof new immigrants to integrate into the United States labor market (Hatton, 2000). However, Douglas(1919) found that 17.0% of new immigrants arriving between 1899 and 1902 were members of skilledor professional occupations, while only 12.2% of immigrants arriving between 1871 and 1882 (a timein which the old immigrants dominated inflows) were skilled or professional.
25 These sources include the 1909 Immigration Commission Data, the 1890 Michigan Implement
FIG. 5. Blue-collar and white-collar income by cohort, 1910.
346 CHRIS MINNS
found here between 40-year-old new and old immigrants in the 1910 census.Using the Immigration Commission data, Francine Blau (1980) found that newimmigrants trailed the old by 6.38% of wages at arrival,26 but her calculation ofthe “catch-up period” for both groups infers that the arrivals from new sourcesdid not experience faster wage growth once in the United States.
The white-collar sector provides an entirely different picture. Here the oldimmigrants trail the new by over 26% of income on arrival to the United Statesat age 25. Although there is some catching-up over the life cycle, the newimmigrants continue to hold an advantage in this area, with the old immigrantstrailing by 16.7% of income at age 40, remaining over 11% behind the newimmigrants at age 50. In Fig. 6, which combines the blue- and white-collarsectors, the new immigrants out-earn old immigrants from the age of 42 onward.
To tighten the focus on the issue of the labor market quality of old and newimmigrants, the final two sections of Table 5 present 10-year cross sections andwithin-cohort relative income growth rates for old and new immigrant groups. Thefigures for new immigrants reveal that for the two most recent cohorts underconsideration, those immigrants born in 1875 and 1865, earnings growth between thecohorts exceeds the predicted growth over the same period based on the 1900 censuscross section. For old immigrants, the within-cohort growth estimates are negativeand are less than the 1900 cross-sectional growth estimates. While this analysis doesnot directly determine the effect of a change in the source area composition of theimmigrant population on within-cohort growth, it does suggest that new immigrantarrivals after 1890 were able to assimilate as least as well as the small number ofimmigrants who arrived from southern and eastern Europe before 1890. It is in the
and Ironworkers survey, and the 1892 California Manufacturing Workers survey (Hatton, 2000,Table 5).
26 Note that Blau’s division of immigrants into two ethnic groups is somewhat different from mine:She includes the Irish and French Canadians in what would be considered the “new” immigrant group(Blau, 1980, Table 1). (This may account for the smaller differential she finds on arrival, as theseimmigrants will have had more exposure to English than southern and eastern Europeans.)
FIG. 6. All nonagricultural income by cohort, 1910.
347IMMIGRATION TO THE UNITED STATES

old immigrant population where there is evidence of wage growth slower thannative-born Americans and a possible decline in labor-market quality.
Why did the new immigrant cohorts do so well relative to old immigrant cohorts?The third and fourth columns of Table 6 break the immigrant population into old andnew immigrant groups and calculate the increase in the white-collar sector betweencensuses for various cohorts after adjusting for out-migration. For old immigrantcohorts, the percentage increase in the white-collar sector between the censusesexceeds that of similarly aged native-born Americans for three of five cohorts underconsideration. For new immigrants the results are quite remarkable: after adjustingfor a return migration rate of 15.5% out of agriculture and the blue-collar sector, Ifound that among those arriving between 1891 and 1900 there was still an increaseof over 12% in the share working in the white-collar sector. New immigrants arrivingbetween 1881 and 1890 also were more able to find their way into white-collar workthan their old immigrant or native-born counterparts. The new immigrants arrivingfrom the 1890s onward were therefore able to combine higher earnings withinwhite-collar work (as seen in Fig. 5) with a greater propensity to enter this sector overtime then the old immigrant population.
It would seem that the emergence of new immigrants by the 1910 census is drivingthe changes in relative performance of all adult immigrants seen in Figs. 3 and 4. In1910, progress in the blue-collar sector for the adult foreign-born appears to havebeen slowed by the performance of the “new” adult immigrants highlighted in Fig.5. These immigrants start with a greater occupational income disadvantage inblue-collar work than do old immigrants and do not come as close to achievingincome parity with natives despite somewhat faster income growth over the lifecycle. At the same time, the stunning results for the white-collar sector seen in Fig.4 are clearly a result of the success of the new immigrants in this sector. As well asoutperforming old immigrants and the native-born in white-collar work, the newimmigrants were more likely to move into this sector with time spent in the UnitedStates.
Conclusions
The analysis above carries several important messages regarding turn-of-the-century migration to the United States. One is that all sectors of the Americaneconomy must be considered to gain a true understanding of immigrant assim-ilation in the United States in this period. Failing to distinguish between thesectors leads to an incorrect picture of life-cycle income for native-born, native-parentage Americans, who were much more likely to be engaged in agriculturalpursuits than their immigrant counterparts. At the same time, it is not adequateto limit our attention to blue-collar occupations, as the white-collar sector was asource of high earnings for the foreign-born.
A second theme is the relatively strong performance of immigrants in cross-sectional regressions. The 1900 sample reveals that immigrants were not far offof the predicted income level for native-born Americans within the blue-collarand white-collar sectors, while enjoying positive earnings growth relative to
348 CHRIS MINNS

native-born native parentage Americans. Immigrants fare somewhat worse in the1910 cross sections for blue-collar work, but manage to out-earn the native-bornin the white-collar sector. It appears that this change is driven by the emergenceof immigrants from new sources, who have slightly lower earnings than oldimmigrants in blue-collar work while holding a distinct advantage in the white-collar sector.
Furthermore, the cross-sectional results are not rendered invalid by cohorteffects due to changing immigrant quality between 1900 and 1910. Immigrantsdid experience positive relative earnings growth between the two census surveys,though at slightly lower rates then reported in the cross-sectional analysis. Thechange in immigrant sources to southern and eastern Europe did not reducerelative earnings growth, as immigrants from these regions experienced earningsgrowth over the cohort at rates exceeding estimates based on cross-sectionalregressions. Nor were immigrants particularly restricted in their ability to movebetween the sectors of the American economy. Even after an extreme adjustmentfor possible return migration to Europe, foreign-born adult immigrants appear tohave been equally if not more able to move into the high-income white-collarsector than their native-born counterparts. The remarkable results for intersec-toral mobility suggest that highly skilled immigrants may have entered theUnited States labor market in blue-collar occupations, moving on to white-collaroccupations once they had acquired U.S.-specific human capital, such as masteryof the English language.
While the case for the “optimistic” view of immigrant progress in Americais strengthened in the analysis above, particularly for the new immigrantsfrom southern and eastern Europe, there remain some unsettled questions asto why particular sections of the immigrant population were able to prosperto such a degree in the United States. In particular, the stunning success of thenew immigrants in the white-collar sector is an intriguing result, particularlywhen combined with their less impressive performance in blue-collar occu-pations. My finding of a strong immigrant presence in white-collar occupa-tions suggests a change is in order toward the study of immigrant progress inAmerica. There is a need for greater understanding of immigrant historiesoutside of the industrial and manufacturing areas under focus in most of thequantitative studies. Work in this area would provide a fresh perspective onthe performance of immigrants as a whole as well as unlock the issue of howsome new immigrants came to find such high earnings in white-collar work.
REFERENCES
Blau, F. (1980), “Immigration and Labor Earnings in Early Twentieth Century America.”Researchin Population Economics2, 21–41.
Borjas, G. (1985), “Assimilation, Changes in Cohort Quality, and the Earnings of Immigrants.”Journal of Labor Economics3, 463–489.
Borjas, G. (1994), “The Economics of Immigration.”Journal of Economic Literature32,1667–1717.Chiswick, B. (1977), “Sons of Immigrants: Are They at an Earnings Disadvantage?”American
Economic Review Papers and Proceedings67, 376–380.
349IMMIGRATION TO THE UNITED STATES

Chiswick, B. (1978), “The Effect of Americanization on the Earnings of Foreign-born Men.”Journalof Political Economy86, 897–921.
Chiswick, B. (1991), “Jewish Immigrant Skill and Occupational Attainment at the Turn of theCentury.”Explorations in Economic History28, 64–86.
Douglas, P. (1919), “Is the New Immigration More Unskilled than the Old?”Journal of the AmericanStatistical Association16, 393–403.
Edwards, A. (1917), “Social-Economic Groups of the United States.”Journal of the AmericanStatistical Association12, 643–661.
Eichengreen, B., and Gemery, H. (1986), “The Earnings of Skilled and Unskilled Immigrants at theEnd of the Nineteenth Century.”Journal of Economic History46, 441–454.
Ferrie, J. (1997), “The Entry into the U.S. labor Market of Antebellum European Immigrants,1840–1860.”Explorations in Economic History34, 295–330.
Goldin, C., and Margo, R. (1992), “The Great Compression: The Wage Structure in the United Statesat Mid-century.”Quarterly Journal of Economics107,1–34.
Grant, M. (1925),The Passing of the Great Race.London: G. Bell and Sons.Hanes, C. (1996), “Immigrants’ Relative Rate of Wage Growth in the Late 19th Century.”Explo-
rations in Economic History33, 35–64.Hannon, J. (1982a), “Ethnic Discrimination in a 19th-Century Mining District: Michigan Copper
Mines, 1988.”Explorations in Economic History19, 28–50.Hannon, J. (1982b), “City Size and Ethnic Discrimination: Michigan Agricultural Implements and
Iron Working Industries, 1890.”Journal of Economic History42, 825–845.Hatton, T., and Williamson, J. (1991), “Wage Gaps between Farm and City: Michigan in the 1890s.”
Explorations in Economic History28, 381–408.Hatton, T. (1997), “The Immigrant Assimilation Puzzle in Late Nineteenth-Century America.”
Journal of Economic History57, 34–62.Hatton, T. (2000), “How Much Did Immigrant “Quality” Decline in Late Nineteenth Century
America?”Journal of Population Economics(forthcoming).Higgs, R. (1971), “Race, Skills, and Earnings: American Immigrants in 1909.”Journal of Economic
History 32, 420–428.Jasso, G., and Rosenzweig, M. (1988), “How Well Do US Immigrants Do? Vintage Effects,
Emigration Selectivity, and Occupational Mobility.”Research in Population Economics6,229–253.
Jenks, J., and Lauck, W. (1926),The Immigration Problem(6th ed.). New York: Huebsch.Kessner, T. (1977),The Golden Door: Italian and Jewish Immigrant Mobility in New York City
1880–1915.New York: Oxford Univ. Press.McGouldrick, P., and Tannen, M. (1977), “Did American Manufacturers Discriminate Against
Immigrants Before 1914?”Journal of Economic History37, 723–746.Minns, C. (2000), “English Language Skills and Labor Market Performance Among American
Immigrants in 1910.” Unpublished manuscript, University of Essex.Preston, S., and Haines, M. (1991),Fatal Years: Child Mortality in Late Nineteenth-Century
America.Princeton, NJ: Princeton Univ. Press.Reiss, A. (1961),Occupations and Social Status.New York: Free Press of Glencoe.Ruggles, S., and Sobek, M. (1997),Integrated Public Use Microdata Series: Version 2.0.Minne-
apolis: Historical census Projects, Univ. of Minnesota.Sobek, M. (1995), “The Comparability of Occupations and the Generation of Income Scores.”
Historical Methods28, 47–51.Sobek, M. (1996), “Work, Status, and Income: Men in the American Occupational Structure since the
Late Nineteenth Century.”Social Science History20, 169–207.
350 CHRIS MINNS