inactivation of urease by 1,4-benzoquinone: chemistry at the protein surface · 2016-03-02 ·...
TRANSCRIPT
Inactivation of Urease by 1,4-Benzoquinone: Chemistry at the Protein Surface
Luca Mazzei,[a] Michele Cianci,[b] Francesco Musiani,[a] and Stefano Ciurli*[a]
[a] L. Mazzei, Dr. F. Musiani, Prof. S. Ciurli. Department of Pharmacy and Biotechnology, University of Bologna. Viale G. Fanin 40, I-40127, Bologna, Italy. [b] Dr. M. Cianci. European Molecular Biology Laboratory, DESY. Notkestraße 85, 22607 Hamburg, Germany.
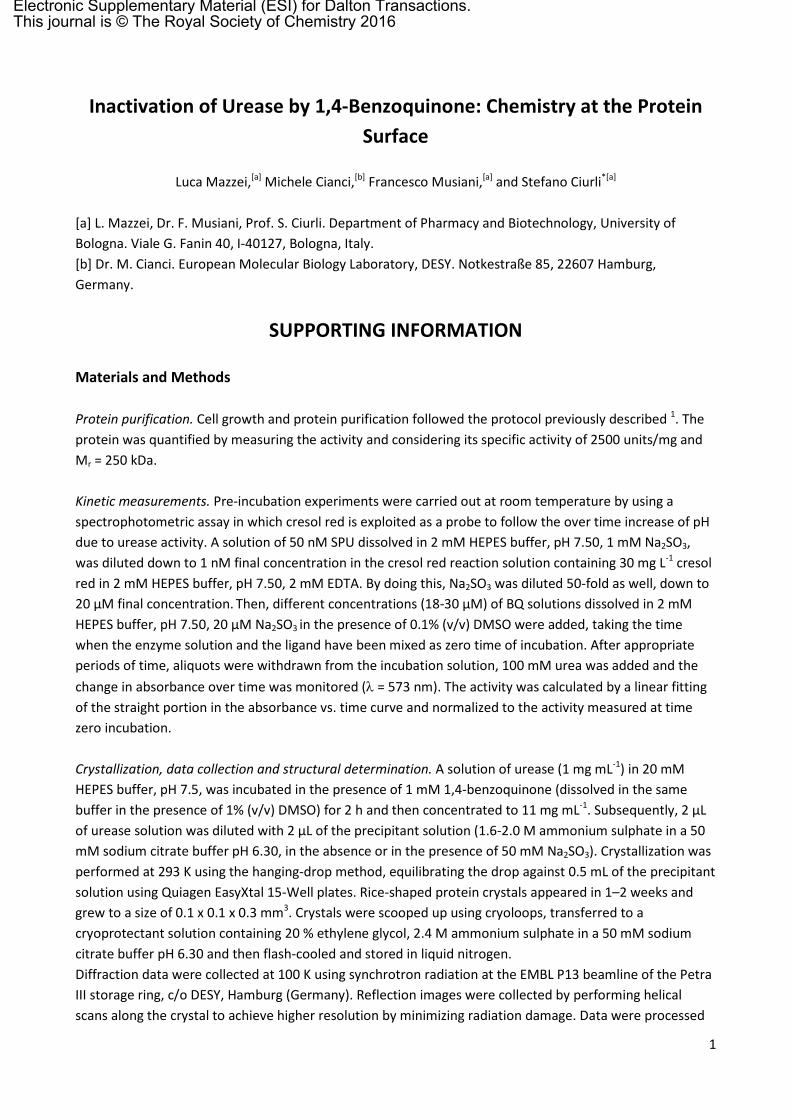
SUPPORTING INFORMATION Materials and Methods Protein purification. Cell growth and protein purification followed the protocol previously described 1. The protein was quantified by measuring the activity and considering its specific activity of 2500 units/mg and Mr = 250 kDa. Kinetic measurements. Pre-incubation experiments were carried out at room temperature by using a spectrophotometric assay in which cresol red is exploited as a probe to follow the over time increase of pH due to urease activity. A solution of 50 nM SPU dissolved in 2 mM HEPES buffer, pH 7.50, 1 mM Na2SO3, was diluted down to 1 nM final concentration in the cresol red reaction solution containing 30 mg L-1 cresol red in 2 mM HEPES buffer, pH 7.50, 2 mM EDTA. By doing this, Na2SO3 was diluted 50-fold as well, down to 20 µM final concentration. Then, different concentrations (18-30 µM) of BQ solutions dissolved in 2 mM HEPES buffer, pH 7.50, 20 µM Na2SO3 in the presence of 0.1% (v/v) DMSO were added, taking the time when the enzyme solution and the ligand have been mixed as zero time of incubation. After appropriate periods of time, aliquots were withdrawn from the incubation solution, 100 mM urea was added and the change in absorbance over time was monitored (λ = 573 nm). The activity was calculated by a linear fitting of the straight portion in the absorbance vs. time curve and normalized to the activity measured at time zero incubation. Crystallization, data collection and structural determination. A solution of urease (1 mg mL-1) in 20 mM HEPES buffer, pH 7.5, was incubated in the presence of 1 mM 1,4-benzoquinone (dissolved in the same buffer in the presence of 1% (v/v) DMSO) for 2 h and then concentrated to 11 mg mL-1. Subsequently, 2 µL of urease solution was diluted with 2 µL of the precipitant solution (1.6-2.0 M ammonium sulphate in a 50 mM sodium citrate buffer pH 6.30, in the absence or in the presence of 50 mM Na2SO3). Crystallization was performed at 293 K using the hanging-drop method, equilibrating the drop against 0.5 mL of the precipitant solution using Quiagen EasyXtal 15-Well plates. Rice-shaped protein crystals appeared in 1–2 weeks and grew to a size of 0.1 x 0.1 x 0.3 mm3. Crystals were scooped up using cryoloops, transferred to a cryoprotectant solution containing 20 % ethylene glycol, 2.4 M ammonium sulphate in a 50 mM sodium citrate buffer pH 6.30 and then flash-cooled and stored in liquid nitrogen. Diffraction data were collected at 100 K using synchrotron radiation at the EMBL P13 beamline of the Petra III storage ring, c/o DESY, Hamburg (Germany). Reflection images were collected by performing helical scans along the crystal to achieve higher resolution by minimizing radiation damage. Data were processed
1
Electronic Supplementary Material (ESI) for Dalton Transactions.This journal is © The Royal Society of Chemistry 2016

using XDS 2 and AIMLESS 3. The crystals are isomorphous with those of native urease and other complexes of the same enzyme. The model of SPU with its highest resolution available so far, that is in complex with citrate (PDB code 4AC7, 1.50 Å resolution) 4, devoid of water molecules and ligands, was used as a starting model for the rigid body refinement of the single αβγ protein trimer, carried out using Refmac 5. The model building and the water or ligand addition/inspection were conducted using Coot 6. The structures were isotropically refined, including the hydrogen atoms in the riding positions. The diffraction data and final refinement statistics are given in Table 1. The structures were deposited in the Protein Data Bank under the accession code 5FSE (in the absence of sulphite) and 5FSD (in the presence of sulphite). Figures were generated using Chimera 7, PyMol 8 and CrystalMaker (http://www.crystalmaker.com). Quantum mechanical calculations. Density functional theory (DFT) computations were carried out using the program ORCA 3.0.3 9 and the Becke three-parameter hybrid functional combined with Lee–Yang–Parr correlation functional (B3LYP/G) 10 as defined in the Gaussian software 11. All atoms were described by the Dunning correlation-consistent polarized triple zeta basis set with the inclusion of diffuse functions (aug-cc-pVTZ) 12. Frequency computations were executed to determine the nature of the critical points.
2
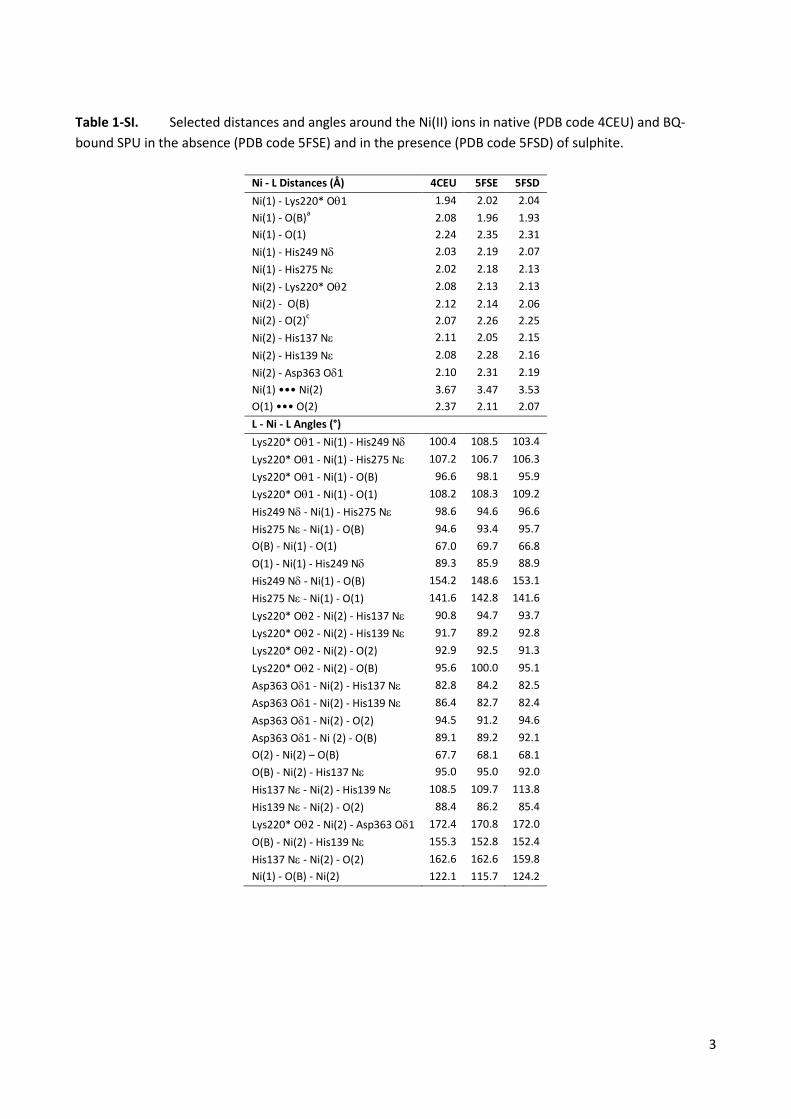
Table 1-SI. Selected distances and angles around the Ni(II) ions in native (PDB code 4CEU) and BQ-bound SPU in the absence (PDB code 5FSE) and in the presence (PDB code 5FSD) of sulphite.
Ni - L Distances (Å) 4CEU 5FSE 5FSD Ni(1) - Lys220* Oθ1 1.94 2.02 2.04 Ni(1) - O(B)a 2.08 1.96 1.93 Ni(1) - O(1) 2.24 2.35 2.31 Ni(1) - His249 Nδ 2.03 2.19 2.07 Ni(1) - His275 Nε 2.02 2.18 2.13 Ni(2) - Lys220* Oθ2 2.08 2.13 2.13 Ni(2) - O(B) 2.12 2.14 2.06 Ni(2) - O(2)c 2.07 2.26 2.25 Ni(2) - His137 Nε 2.11 2.05 2.15 Ni(2) - His139 Nε 2.08 2.28 2.16 Ni(2) - Asp363 Oδ1 2.10 2.31 2.19 Ni(1) ••• Ni(2) 3.67 3.47 3.53 O(1) ••• O(2) 2.37 2.11 2.07 L - Ni - L Angles (°) Lys220* Oθ1 - Ni(1) - His249 Nδ 100.4 108.5 103.4 Lys220* Oθ1 - Ni(1) - His275 Nε 107.2 106.7 106.3 Lys220* Oθ1 - Ni(1) - O(B) 96.6 98.1 95.9 Lys220* Oθ1 - Ni(1) - O(1) 108.2 108.3 109.2 His249 Nδ - Ni(1) - His275 Nε 98.6 94.6 96.6 His275 Nε - Ni(1) - O(B) 94.6 93.4 95.7 O(B) - Ni(1) - O(1) 67.0 69.7 66.8 O(1) - Ni(1) - His249 Nδ 89.3 85.9 88.9 His249 Nδ - Ni(1) - O(B) 154.2 148.6 153.1 His275 Nε - Ni(1) - O(1) 141.6 142.8 141.6 Lys220* Oθ2 - Ni(2) - His137 Nε 90.8 94.7 93.7 Lys220* Oθ2 - Ni(2) - His139 Nε 91.7 89.2 92.8 Lys220* Oθ2 - Ni(2) - O(2) 92.9 92.5 91.3 Lys220* Oθ2 - Ni(2) - O(B) 95.6 100.0 95.1 Asp363 Oδ1 - Ni(2) - His137 Nε 82.8 84.2 82.5 Asp363 Oδ1 - Ni(2) - His139 Nε 86.4 82.7 82.4 Asp363 Oδ1 - Ni(2) - O(2) 94.5 91.2 94.6 Asp363 Oδ1 - Ni (2) - O(B) 89.1 89.2 92.1 O(2) - Ni(2) – O(B) 67.7 68.1 68.1 O(B) - Ni(2) - His137 Nε 95.0 95.0 92.0 His137 Nε - Ni(2) - His139 Nε 108.5 109.7 113.8 His139 Nε - Ni(2) - O(2) 88.4 86.2 85.4 Lys220* Oθ2 - Ni(2) - Asp363 Oδ1 172.4 170.8 172.0 O(B) - Ni(2) - His139 Nε 155.3 152.8 152.4 His137 Nε - Ni(2) - O(2) 162.6 162.6 159.8 Ni(1) - O(B) - Ni(2) 122.1 115.7 124.2
3

Table 2-SI. Selected distances and angles in the BQ-bound SPU in the absence (PDB code 5FSE) and in the presence (PDB code 5FSD) of sulphite.
Distances (Å) 5FSE 5FSD C1 - Cys322 Sγ 2.79 2.72 C2 - Cys322 Sγ 1.64 1.70 C3 - Cys322 Sγ 2.60 2.71 C4 - Cys322 Sγ 3.93 4.04 C5 - Cys322 Sγ 4.47 4.66 C6 - Cys322 Sγ 4.02 4.05 O1 - Cys322 Sγ O4 - Cys322 Sγ
3.16 5.00
2.99 5.10
C1 - Cys555 Sγ 2.79 2.87 C2 - Cys555 Sγ 1.67 1.71 C3 - Cys555 Sγ 2.56 2.67 C4 - Cys555 Sγ 3.89 4.02 C5 - Cys555 Sγ 4.56 4.68 C6 - Cys555 Sγ 4.09 4.10 O1 - Cys555 Sγ O4 - Cys555 Sγ
3.08 4.89
3.25 4.97
Angles and torsion angles (°) C2 - Cys322 Sγ - Cys322 Cβ 99.0 112.5 Cys322 Sγ - C2 - C1 124.7 121.3 Cys322 Sγ - C2 - C3 116.5 120.5 C1 - C2 - Cys322 Sγ - Cys322 Cβ 109.1 95.5 C3 - C2 - Cys322 Sγ - Cys322 Cβ 99.7 106.7 O1 - C1 - C2 - Cys322 Sγ 180.3 169.8 C2 - Cys555 Sγ - Cys555 Cβ 109.5 113.7 Cys555 Sγ - C2 - C1 128.6 128.4 Cys555 Sγ - C2 - C3 112.8 117.2 C1 - C2 - Cys555 Sγ - Cys555 Cβ 82.4 80.5 C3 - C2 - Cys555 Sγ - Cys555 Cβ 80.3 71.1 O1 - C1 - C2 - Cys555 Sγ 178.6 170.7
Scheme 1-SI. Ligand’s atom numeration.
4
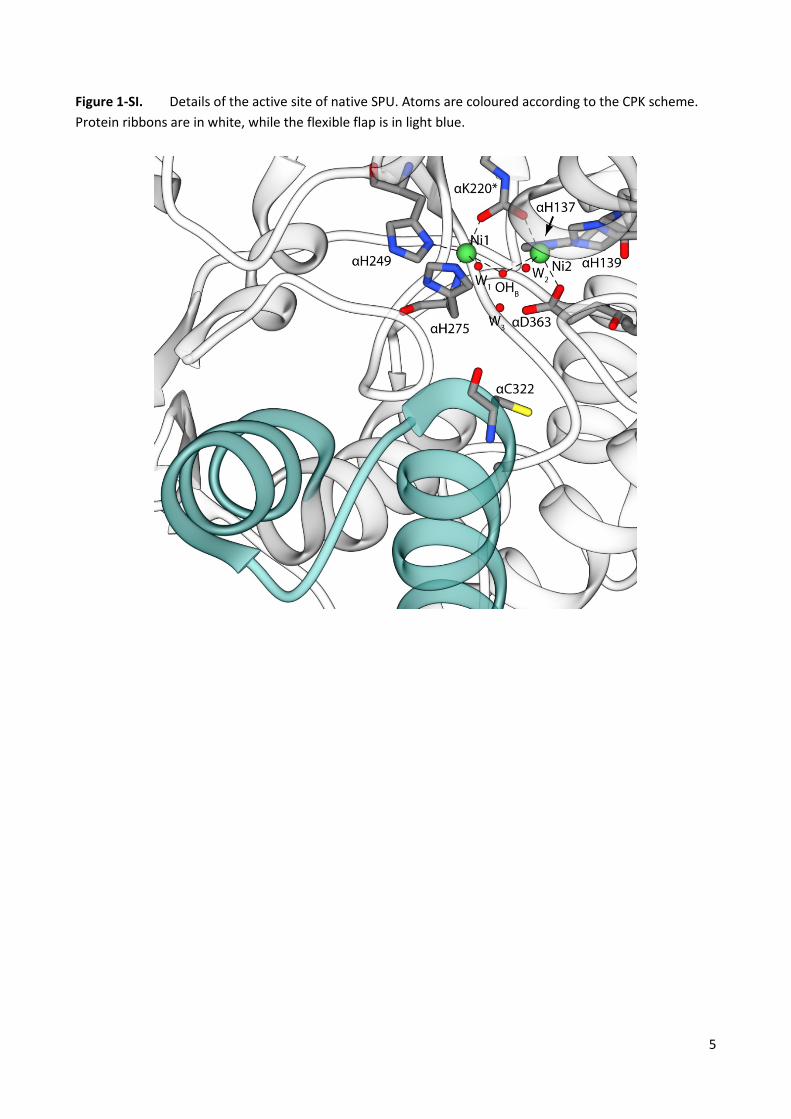
Figure 1-SI. Details of the active site of native SPU. Atoms are coloured according to the CPK scheme. Protein ribbons are in white, while the flexible flap is in light blue.
5
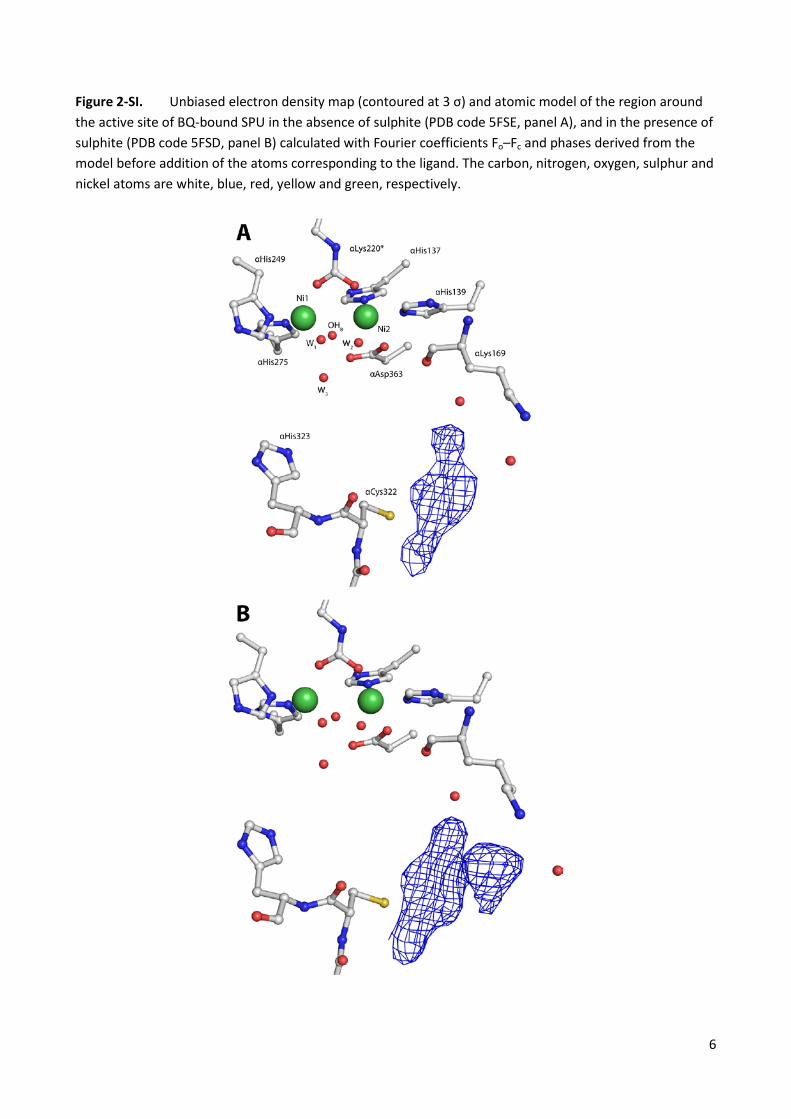
Figure 2-SI. Unbiased electron density map (contoured at 3 σ) and atomic model of the region around the active site of BQ-bound SPU in the absence of sulphite (PDB code 5FSE, panel A), and in the presence of sulphite (PDB code 5FSD, panel B) calculated with Fourier coefficients Fo–Fc and phases derived from the model before addition of the atoms corresponding to the ligand. The carbon, nitrogen, oxygen, sulphur and nickel atoms are white, blue, red, yellow and green, respectively.
6
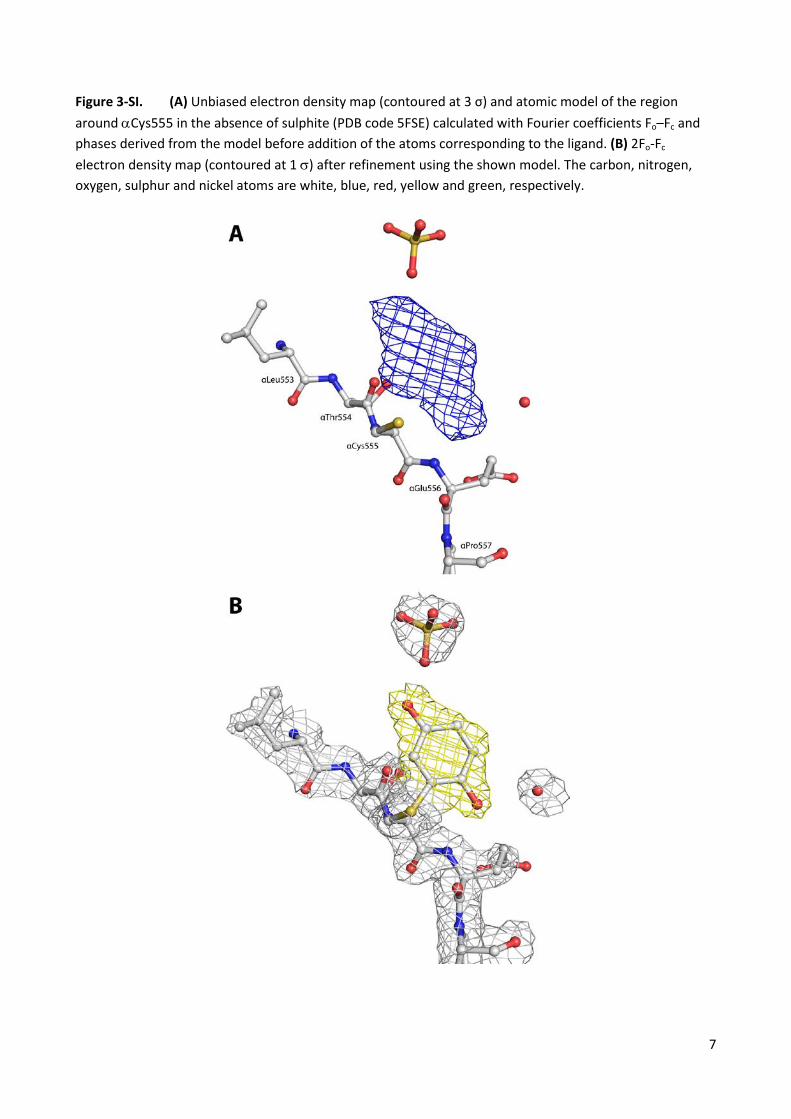
Figure 3-SI. (A) Unbiased electron density map (contoured at 3 σ) and atomic model of the region around αCys555 in the absence of sulphite (PDB code 5FSE) calculated with Fourier coefficients Fo–Fc and phases derived from the model before addition of the atoms corresponding to the ligand. (B) 2Fo-Fc electron density map (contoured at 1 σ) after refinement using the shown model. The carbon, nitrogen, oxygen, sulphur and nickel atoms are white, blue, red, yellow and green, respectively.
7

Figure 4-SI. (A) Unbiased electron density map (contoured at 3 σ) and atomic model of the region around αCys555 in the presence of sulphite (PDB code 5FSD) calculated with Fourier coefficients Fo–Fc and phases derived from the model before addition of the atoms corresponding to the ligand. (B) 2Fo-Fc electron density map (contoured at 1 σ) after refinement using the shown model, which entails an occupancy of 80 % for the aromatic ring and 20 % for the sulphonate group. The carbon, nitrogen, oxygen, sulphur and nickel atoms are white, blue, red, yellow and green, respectively.
8

Figure 5-SI. Details of the protein surface in the proximity of the active-site cavity of native (A) (PDB code 4CEU), DAP inhibited (B) (PDB code 4UBP), and BQ bound SPU in the absence (C) (PDB code 5FSE) and in the presence (D) (PDB code 5FSD) of sulphite. The water molecules in the bimetallic centre and the inhibitors are represented as spheres coloured accordingly to the CPK code. The protein surface has been drawn with a probe sphere of 1.4 Å using USCF Chimera 13.
9
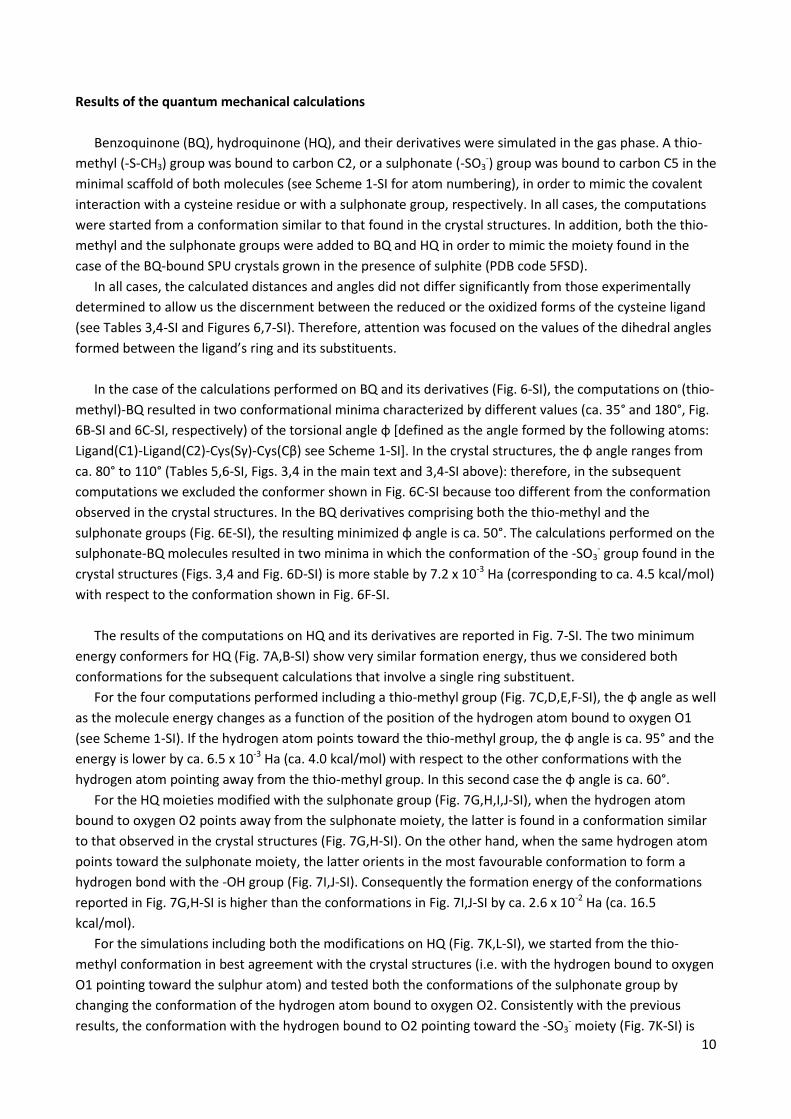
Results of the quantum mechanical calculations
Benzoquinone (BQ), hydroquinone (HQ), and their derivatives were simulated in the gas phase. A thio-methyl (-S-CH3) group was bound to carbon C2, or a sulphonate (-SO3
-) group was bound to carbon C5 in the minimal scaffold of both molecules (see Scheme 1-SI for atom numbering), in order to mimic the covalent interaction with a cysteine residue or with a sulphonate group, respectively. In all cases, the computations were started from a conformation similar to that found in the crystal structures. In addition, both the thio-methyl and the sulphonate groups were added to BQ and HQ in order to mimic the moiety found in the case of the BQ-bound SPU crystals grown in the presence of sulphite (PDB code 5FSD).
In all cases, the calculated distances and angles did not differ significantly from those experimentally determined to allow us the discernment between the reduced or the oxidized forms of the cysteine ligand (see Tables 3,4-SI and Figures 6,7-SI). Therefore, attention was focused on the values of the dihedral angles formed between the ligand’s ring and its substituents.
In the case of the calculations performed on BQ and its derivatives (Fig. 6-SI), the computations on (thio-
methyl)-BQ resulted in two conformational minima characterized by different values (ca. 35° and 180°, Fig. 6B-SI and 6C-SI, respectively) of the torsional angle φ [defined as the angle formed by the following atoms: Ligand(C1)-Ligand(C2)-Cys(Sγ)-Cys(Cβ) see Scheme 1-SI]. In the crystal structures, the φ angle ranges from ca. 80° to 110° (Tables 5,6-SI, Figs. 3,4 in the main text and 3,4-SI above): therefore, in the subsequent computations we excluded the conformer shown in Fig. 6C-SI because too different from the conformation observed in the crystal structures. In the BQ derivatives comprising both the thio-methyl and the sulphonate groups (Fig. 6E-SI), the resulting minimized φ angle is ca. 50°. The calculations performed on the sulphonate-BQ molecules resulted in two minima in which the conformation of the -SO3
- group found in the crystal structures (Figs. 3,4 and Fig. 6D-SI) is more stable by 7.2 x 10⁻³ Ha (corresponding to ca. 4.5 kcal/mol) with respect to the conformation shown in Fig. 6F-SI.
The results of the computations on HQ and its derivatives are reported in Fig. 7-SI. The two minimum
energy conformers for HQ (Fig. 7A,B-SI) show very similar formation energy, thus we considered both conformations for the subsequent calculations that involve a single ring substituent.
For the four computations performed including a thio-methyl group (Fig. 7C,D,E,F-SI), the φ angle as well as the molecule energy changes as a function of the position of the hydrogen atom bound to oxygen O1 (see Scheme 1-SI). If the hydrogen atom points toward the thio-methyl group, the φ angle is ca. 95° and the energy is lower by ca. 6.5 x 10⁻³ Ha (ca. 4.0 kcal/mol) with respect to the other conformations with the hydrogen atom pointing away from the thio-methyl group. In this second case the φ angle is ca. 60°.
For the HQ moieties modified with the sulphonate group (Fig. 7G,H,I,J-SI), when the hydrogen atom bound to oxygen O2 points away from the sulphonate moiety, the latter is found in a conformation similar to that observed in the crystal structures (Fig. 7G,H-SI). On the other hand, when the same hydrogen atom points toward the sulphonate moiety, the latter orients in the most favourable conformation to form a hydrogen bond with the -OH group (Fig. 7I,J-SI). Consequently the formation energy of the conformations reported in Fig. 7G,H-SI is higher than the conformations in Fig. 7I,J-SI by ca. 2.6 x 10⁻² Ha (ca. 16.5 kcal/mol).
For the simulations including both the modifications on HQ (Fig. 7K,L-SI), we started from the thio-methyl conformation in best agreement with the crystal structures (i.e. with the hydrogen bound to oxygen O1 pointing toward the sulphur atom) and tested both the conformations of the sulphonate group by changing the conformation of the hydrogen atom bound to oxygen O2. Consistently with the previous results, the conformation with the hydrogen bound to O2 pointing toward the -SO3
- moiety (Fig. 7K-SI) is 10

lower by ca. 2.7 x 10⁻² Ha (ca. 16.8 kcal/mol) with respect to the other conformer (Fig. 7L-SI). The φ angle in both conformations is ca. 93°.
The results of these calculations suggest that i) the crystal structures correspond to the reduced form of
the ligand, with the H atom on O1 pointing towards the Sγ atom of αCys322 or αCys555, ii) the H atom on O2 in the crystal structure does not make a H-bond with the sulphonate group but rather a hydrogen bond with the Nζ atom on the side chain of αLys169 and with an additional water molecule (see Fig. 4), thus compensating the energy loss due to the unfavourable conformation of the sulphonate group observed in the crystal structure of BQ-bound SPU crystals in the presence of sulphite (PDB code 5FSD).
11

Figure 6-SI. B3LYP/G aug-cc-pVTZ energies, optimized heavy atoms bond distances, and φ torsional angles of selected 1,4-benzoquinones (atoms defining the φ angle are highlighted with a * symbol). Atoms are coloured accordingly to the CPK scheme.
12

Figure 7-SI. B3LYP/G aug-cc-pVTZ energies, optimized heavy atoms bond distances, and φ torsional angles of selected 1,4-hydroquinones (atoms defining the φ angle are highlighted with a * symbol). Atoms are coloured accordingly to the CPK scheme.
13
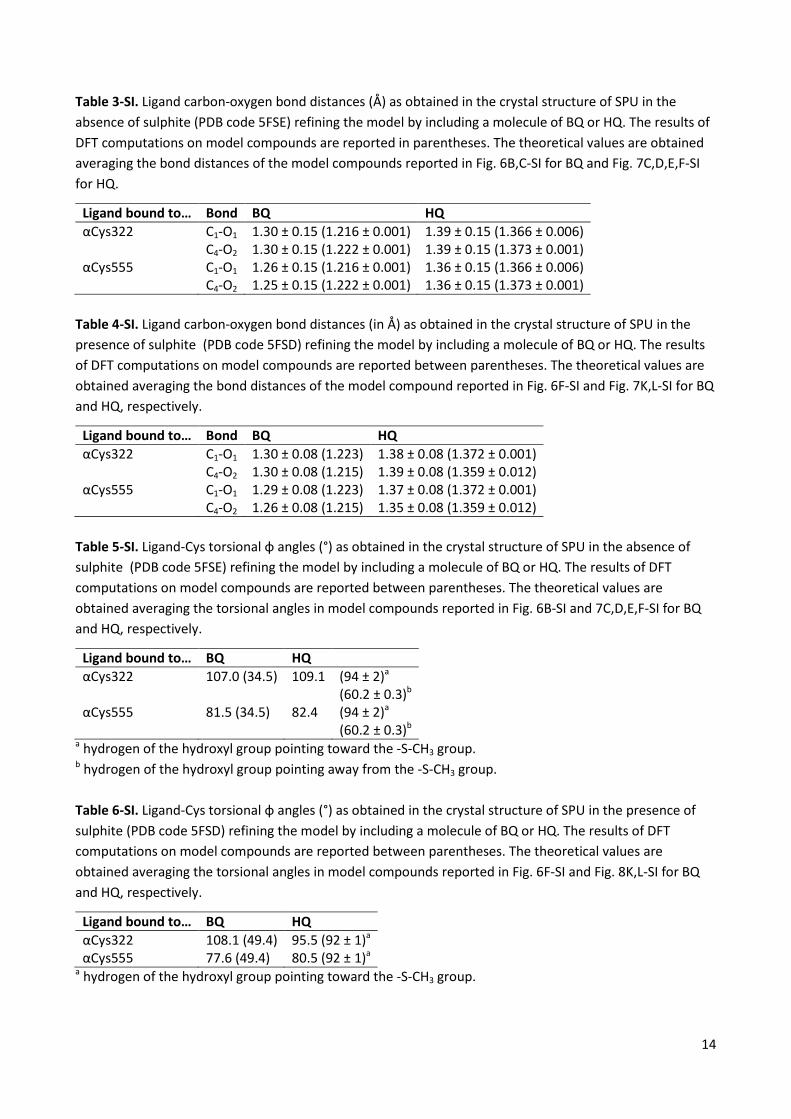
Table 3-SI. Ligand carbon-oxygen bond distances (Å) as obtained in the crystal structure of SPU in the absence of sulphite (PDB code 5FSE) refining the model by including a molecule of BQ or HQ. The results of DFT computations on model compounds are reported in parentheses. The theoretical values are obtained averaging the bond distances of the model compounds reported in Fig. 6B,C-SI for BQ and Fig. 7C,D,E,F-SI for HQ.
Ligand bound to… Bond BQ HQ αCys322 C1-O1 1.30 ± 0.15 (1.216 ± 0.001) 1.39 ± 0.15 (1.366 ± 0.006) C4-O2 1.30 ± 0.15 (1.222 ± 0.001) 1.39 ± 0.15 (1.373 ± 0.001) αCys555 C1-O1 1.26 ± 0.15 (1.216 ± 0.001) 1.36 ± 0.15 (1.366 ± 0.006) C4-O2 1.25 ± 0.15 (1.222 ± 0.001) 1.36 ± 0.15 (1.373 ± 0.001)
Table 4-SI. Ligand carbon-oxygen bond distances (in Å) as obtained in the crystal structure of SPU in the presence of sulphite (PDB code 5FSD) refining the model by including a molecule of BQ or HQ. The results of DFT computations on model compounds are reported between parentheses. The theoretical values are obtained averaging the bond distances of the model compound reported in Fig. 6F-SI and Fig. 7K,L-SI for BQ and HQ, respectively.
Ligand bound to… Bond BQ HQ αCys322 C1-O1 1.30 ± 0.08 (1.223) 1.38 ± 0.08 (1.372 ± 0.001) C4-O2 1.30 ± 0.08 (1.215) 1.39 ± 0.08 (1.359 ± 0.012) αCys555 C1-O1 1.29 ± 0.08 (1.223) 1.37 ± 0.08 (1.372 ± 0.001) C4-O2 1.26 ± 0.08 (1.215) 1.35 ± 0.08 (1.359 ± 0.012)
Table 5-SI. Ligand-Cys torsional φ angles (°) as obtained in the crystal structure of SPU in the absence of sulphite (PDB code 5FSE) refining the model by including a molecule of BQ or HQ. The results of DFT computations on model compounds are reported between parentheses. The theoretical values are obtained averaging the torsional angles in model compounds reported in Fig. 6B-SI and 7C,D,E,F-SI for BQ and HQ, respectively.
Ligand bound to… BQ HQ αCys322 107.0 (34.5) 109.1 (94 ± 2)a
(60.2 ± 0.3)b αCys555 81.5 (34.5) 82.4 (94 ± 2)a
(60.2 ± 0.3)b a hydrogen of the hydroxyl group pointing toward the -S-CH3 group. b hydrogen of the hydroxyl group pointing away from the -S-CH3 group. Table 6-SI. Ligand-Cys torsional φ angles (°) as obtained in the crystal structure of SPU in the presence of sulphite (PDB code 5FSD) refining the model by including a molecule of BQ or HQ. The results of DFT computations on model compounds are reported between parentheses. The theoretical values are obtained averaging the torsional angles in model compounds reported in Fig. 6F-SI and Fig. 8K,L-SI for BQ and HQ, respectively.
Ligand bound to… BQ HQ αCys322 108.1 (49.4) 95.5 (92 ± 1)a αCys555 77.6 (49.4) 80.5 (92 ± 1)a
a hydrogen of the hydroxyl group pointing toward the -S-CH3 group.
14
REFERENCES 1. L. Mazzei, M. Cianci, S. Benini, L. Bertini, F. Musiani and S. Ciurli, J. Inorg. Biochem., 2016, 154, 42-49. 2. W. Kabsch, Acta Cryst. D, 2010, 66, 125-132. 3. P. Evans, Acta Cryst. D, 2006, 62, 72-82. 4. S. Benini, P. Kosikowska, M. Cianci, L. Mazzei, A. G. Vara, L. Berlicki and S. Ciurli, J. Biol. Inorg. Chem.,
2013, 18, 391-399. 5. (a) G. N. Murshudov, A. A. Vagin and E. J. Dodson, Acta Cryst. D, 1997, 53, 240-255; (b) G. N.
Murshudov, A. A. Vagin, A. Lebedev, K. S. Wilson and E. J. Dodson, Acta Cryst. D, 1999, 55, 247-255. 6. (a) P. Emsley and K. Cowtan, Acta Cryst. D, 2004, 60, 2126-2132; (b) P. Emsley, B. Lohkamp, W. G. Scott
and K. Cowtan, Acta Cryst. D, 2010, 66, 486-501. 7. E. F. Pettersen, T. D. Goddard, C. C. Huang, G. S. Couch, D. M. Greenblatt, E. C. Meng and T. E. Ferrin, J.
Comput. Chem., 2004, 25, 1605-1612. 8. Schrodinger, LLC, 2010. 9. F. Neese, Wiley Interdisciplinary Reviews: Computational Molecular Science, 2012, 2, 73-78. 10. (a) A. D. Becke, J. Chem. Phys., 1993, 98, 1372-1377; (b) C. Lee, W. Yang and R. G. Parr, Phys. Rev. B,
1988, 37, 785-789. 11. M. J. Frisch, G. W. Trucks, H. B. Schlegel, G. E. Scuseria, M. A. Robb, J. R. Cheeseman, G. Scalmani, V.
Barone, B. Mennucci, G. A. Petersson, H. Nakatsuji, M. Caricato, X. Li, H. P. Hratchian, A. F. Izmaylov, J. Bloino, G. Zheng, J. L. Sonnenberg, M. Hada, M. Ehara, K. Toyota, R. Fukuda, J. Hasegawa, M. Ishida, T. Nakajima, Y. Honda, O. Kitao, H. Nakai, T. Vreven, J. A. Montgomery Jr., J. E. Peralta, F. Ogliaro, M. J. Bearpark, J. Heyd, E. N. Brothers, K. N. Kudin, V. N. Staroverov, R. Kobayashi, J. Normand, K. Raghavachari, A. P. Rendell, J. C. Burant, S. S. Iyengar, J. Tomasi, M. Cossi, N. Rega, N. J. Millam, M. Klene, J. E. Knox, J. B. Cross, V. Bakken, C. Adamo, J. Jaramillo, R. Gomperts, R. E. Stratmann, O. Yazyev, A. J. Austin, R. Cammi, C. Pomelli, J. W. Ochterski, R. L. Martin, K. Morokuma, V. G. Zakrzewski, G. A. Voth, P. Salvador, J. J. Dannenberg, S. Dapprich, A. D. Daniels, Ö. Farkas, J. B. Foresman, J. V. Ortiz, J. Cioslowski, D. J. Fox, Gaussian, Inc., Wallingford, CT, USA, 2009.
13. E. F. Pettersen, T. D. Goddard, C. C. Huang, G. S. Couch, D. M. Greenblatt, E. C. Meng and T. E. Ferrin, J. Comput. Chem., 2004, 25, 1605-1612.
15