in south east europe and...
TRANSCRIPT

Dd
Railway Reform in South East Europe and Turkey
On the Right Track?
Carolina Monsalve WORLD BANK

Railway Reform in South East Europe and Turkey
On the Right Track?
Transport Unit, Sustainable Development
Europe and Central Asia Region
Report No. 60223-ECA
March 2011
Document of the World Bank

©2011 The International Bank for Reconstruction and Development / The World Bank
1818 H Street NW
Washington DC 20433
Telephone: 202-473-1000
Internet: www.worldbank.org
Cover photo: Elyce Feliz/Flickr/2009 licensed under a Creative Commons Attribution License.
This report was prepared by the staff of the International Bank for Reconstruction and Development / The World
Bank. The findings, interpretations, and conclusions expressed in it do not necessarily reflect the views of the
Executive Directors of The World Bank or the governments they represent.
The World Bank does not guarantee the accuracy of the data included in this work. The boundaries, colors,
denominations, and other information shown on any map in this work do not imply any judgement on the part of
The World Bank concerning the legal status of any territory or the endorsement or acceptance of such boundaries.

CURRENCY EQUIVALENTS
(Exchange Rate Effective February 28, 2011)
Currency Unit - EURO
EUR 1 = US$ 1.383
WEIGHT AND MEASURES
Metric system
FISCAL YEAR
January 1 – December 31
Vice President, Europe and Central Asia: Philippe H. Le Houerou
Director, Strategy and Operations, ECAVP: Theodore O. Ahlers
Sector Director, ECSSD: Peter D. Thomson
Sector Manager, Transport: Henry G.R. Kerali
Task Team Leader: Carolina Monsalve

ABBREVIATIONS AND ACRONYMS
AFER Romanian Railway Authority
AII Agreement on Infrastructure Interconnection
BCA Border-crossing Agreement
BCC Border-crossing Commission
BCP Border-crossing Point
BDZ EAD Bâlgarski Dârzhavni Zheleznitsi, Bulgarian Railway Operating Company
BH Bosnia and Herzegovina
BHŢJK Bosanskohercegovačka Željeznička Javna Korporacija, BH Rail Coordinating Body
BOL Bill of Lading
BRC Bulgarian Railway Company
CARDS Community Assistance for Reconstruction, Development and Stabilization
CDL Commercial Dispatch Level
CER Community of European Railway and Infrastructure Companies
CFR Căile Ferate Române or Romanian Railways
COTIF Convention Concerning the International Transport of Goods by Rail
CUU Contrat Uniforme d'Utilisation des Wagons, Standard Contract for the Use of Wagons (often called AVV)
CTC Centralized Traffic Control
DB Deutsche Bahn, German National Railways
DEKAK Railroad Accident Investigation Board
DETAŞ Turkish Railways Transportation Corporation
DG Directorate General
DMU Diesel Multiple Unit
EBRD European Bank for Reconstruction and Development
EC European Commission
EDI Electronic Data Interchange
EEC European Economic Community
EIB European Investment Bank
EPR European Performance Regime
ERA European Railway Agency
EU European Union
FBH Federation of Bosnia and Herzegovina
FTE Forum Train Europe
FYR Former Yugoslav Republic
GDP Gross Domestic Product
GTZ Deutsche Gesellschaft für Technische Zusammenarbeit, German Agency for Technical Cooperation
GFR Grup Feroviar Roman, Romanian Rail Group, a private freight operator
HSH Hekurudha Shquiptare, Albanian Railways
HŢ Hrvatske Željeznice, Croatian Railways
IAS International Accounting Standards
IASB International Accounting Standards Board
IFI International Financial Institution
IFRS International Financial Reporting Standards
IT Information Technology
IPA Instrument for Pre-Accession
JŽ Jugoslovenske Železnice, Yugoslav Railways
KM Kilometer
KR Hekurudhat e Kosovës, Kosovo Railways
KUGM Land Transport General Directorate
MC+ Marginal cost plus mark-up

MKD Macedonian Denars
MOPWTT Ministry of Public Works, Transport and Telecommunication MOT Ministry of Transport
MTC Ministry of Transport and Communications
MoU Memorandum of Understanding
MŢ Makedonski Železnici, Macedonian Railways
MŢ-T Macedonian Railways Transport
MŢ-I Macedonian Railways Infrastructure
MSTI Ministry of Sea, Transport, and Infrastructure
NRIC National Railway Infrastructure Company
OBB Österreichische Bundesbahnen, Austrian Federail Railways
ODL Operational Dispatch Level
OECD Organization for Economic Cooperation and Development
PSO Public Service Obligation
PSC Public Service Contract
PKP Polskie Koleje Panstowowe, Polish State Railways
PLK Polskie Linie Kolejowe, Polish Railway Infrastructure Manager
PPIAF Public-Private Infrastructure Advisory Facility PPP Public Private Partnership
RFID Radio Frequency Identification
RNE RailNetEurope
RoRo Roll On, Roll Off
RRB Railway Regulatory Body
RRLB Romanian Railway Licensing Body
RRSA Romanian Railway Safety Authority
RS Republika Srpska
RSD Serbian dinar
SAAF Romanian Railway Assets Administration Company
SMF Romanian Railway Management Services Company
SEE South East Europe
SEETO South East Europe Transport Observatory
SOP-T Sector Operational Programme for Transport SŢ Slovenske Železnice, Slovenian Railways
SNCFR Societatae Nationala a Cailor Ferate Române, former vertically integrated Romanian Railways
SNCF Société Nationale des Chemins de Fer Français, French National Railway Company
SPAD Signal Passed at Danger
TAC Track Access Charge
TCDD Türkiye Cumhuriyeti Devlet Demiryollari, Turkish Railways
TEN-T Trans European Transport Network
TFG Transferoviar Grup SA, private Romanian freight and passenger operator
TPM Train Performance Management
TU Traffic Unit
UIC Union des Chemins de Fer, International Railways Union
UNECE United Nations Economic Commission for Europe
UNMIK United Nations Interim Administration Mission in Kosovo
VAT Value Added Tax
ŢCG Željeznice Crne Gore or Montenegrin Railways
ŢICG Željeznička Infrastruktura Crne Gore, Montengro Infrastructure Railway Company
ŢPCG Željeznički Prevoz Crne Gore, Montenegro Railways Passenger Company
ŢFBH Željeznice Federacije Bosne i Hercegovine, Federation of Bosnia and Herzegovina Railways
ŢRS Željeznice Republike Srpske, Republika Srpska Railways
ŢS Železnice Srbije, Serbian Railways
ŢTP Železnicko Transportno Preduzece Beograd, predecessor to Serbian Railways

TABLE OF CONTENTS
Executive Summary ...................................................................................................................................... 1
Introduction ................................................................................................................................................. 17
Progress in Institutional Reform ................................................................................................................. 23
Introduction ............................................................................................................................................ 23 Bulgaria and Romania ............................................................................................................................ 29 Turkey .................................................................................................................................................... 35 Albania ................................................................................................................................................... 37 Bosnia and Herzegovina ........................................................................................................................ 38 Croatia .................................................................................................................................................... 40 FYR Macedonia ..................................................................................................................................... 42 Kosovo ................................................................................................................................................... 44 Montenegro ............................................................................................................................................ 45 Serbia ..................................................................................................................................................... 47 The Need for Continued Institutional Reform ....................................................................................... 51
Conclusions - Continuing Necessary Institutional and Regulatory Reform ......................................... 55
A Comparative Assessment of Operating and Financial Performance ....................................................... 58
Introduction ............................................................................................................................................ 58 Traffic Trends ........................................................................................................................................ 59 Operational Performance ....................................................................................................................... 66 Financial Performance ........................................................................................................................... 73 Conclusions - Improving Operating and Financial Performance ........................................................... 80
The State of International Integration ......................................................................................................... 87
Introduction ............................................................................................................................................ 87 International Rail Corridors in South East Europe ................................................................................ 88 Overview of Recent Initiatives to Improve Rail Corridor Performance ................................................ 92 Corridor Performance along TEN-T/Pan-European Corridors IV and X .............................................. 97 Improving the Institutional and Regulatory Environment ................................................................... 104 A European Perspective on International Freight Corridors ................................................................ 109 Conclusions – Improving Integration................................................................................................... 110
Conclusions and Recommendations ......................................................................................................... 113
Annex 1: The Incumbent Railway Companies ......................................................................................... 128
Albanian Railways ............................................................................................................................... 128 The Railways of Bosnia and Herzegovina ........................................................................................... 137 The Railways of Bulgaria .................................................................................................................... 153 Croatian Railways ................................................................................................................................ 165 The Railways of FYR Macedonia ........................................................................................................ 177 Kosovo Railways ................................................................................................................................. 187 The Railways of Montenegro ............................................................................................................... 196 The Railways of Romania .................................................................................................................... 204

Serbian Railways.................................................................................................................................. 216 Turkish Railways ................................................................................................................................. 229
Annex 2: The Three EU Rail Packages .................................................................................................... 240
The First EU Railway Package ............................................................................................................ 240 The Second EU Railway Package ........................................................................................................ 241 The Third EU Railway Package ........................................................................................................... 242
Annex 3: EU Legislation Applicable to the Rail Sector........................................................................... 244
Annex 4: Framework Border-crossing Agreement .................................................................................. 247
Annex 5: Model Agreement on Infrastructure Interconnection ............................................................... 256
References ................................................................................................................................................. 262

ACKNOWLEDGEMENTS
This report was written by Carolina Monsalve (Transport Economist), Task Team Leader, with support
from Raül Vinyes Raso (Junior Professional Associate), Martin Humphreys (Program Team Leader) from
the Transport Unit of the Europe and Central Asia Region of the World Bank and Vasile Olievschi (Lead
Railway Specialist) of the Transport Anchor of the World Bank. A substantial contribution to the report
was also provided by Klaus-Juergen Uhl of Vienna Consult, who undertook a review of practice at a
selected number of border-crossings in the region.
The team was supported by Nadia Badea (Operations Analyst, Romania), Vesna Francić (Senior
Operations Officer, Bosnia and Herzegovina), Senad Sacić (Program Assistant, Bosnia and Herzegovina)
Artan Guxho (Project Officer, Albania), Hana Huzjak (Operations Analyst, Croatia), Stjepan Gabrić
(Senior Operations Officer, Croatia), Eolina Petrova Milova (Operations Officer, Bulgaria), Alptekin
Orhon (Consultant, Turkey), Liljana Sekerinska (Transport Specialist, FYR Macedonia), Danijela
Vukajlović-Grba (Economist, Montenegro), and Svetlana Vukanović (Transport Specialist, Serbia).
The team would like to acknowledge the contribution of Frank Jost and François Begeot, from the
Directorate-General for Mobility and Transport of the European Commission, for their contributions to
the Final Report.
Thanks are also given to Henry G.R. Kerali (Sector Manager, Transport, ECSSD), together with Peer
Reviewers, John Carter Scales (Lead Transport Specialist, EASCS) and Atul Agarwal (Transport
Specialist, SASDT) for their helpful contributions to the draft of this paper. Useful comments were also
provided by Mohammed Dalil Essakali (Senior Infrastructure Economist, ECSSD), Martha B. Lawrence
(Senior Transport Specialist, ECSSD), Jean-François Marteau (Senior Transport Specialist, ECSSD),
Vesna Kostić (Senior Communications Officer, ECCYU), and Katryn E. Schrader (Senior
Communications Officer, ECAEX).
The team would also like to take this opportunity to acknowledge the considerable assistance provided
during the course of the study, both formally and informally, from representatives of the respective
governments, railways of South East Europe and Turkey, and RailNetEurope.

Railway Reform in South East Europe and Turkey: On the Right Track? Main Report
1
EXECUTIVE SUMMARY
Introduction
The railways of South East Europe and Turkey experienced significant declines in traffic volumes
in 2009.1 This reflected the impact of the international financial crisis unleashed in the last quarter
of 2008 and its contractionary impact on the economies of the region and elsewhere. Lower
traffic volumes translated in most cases into a serious deterioration of the financial performance
of the state-owned railways. This brought home the costs of failing to implement essential
reforms to improve the operational and financial performance of the sector when the economy
was strong. In Romania in 2010, large-scale layoffs were announced at short notice for the state
rail companies. The situation is similar for the Bulgarian state rail incumbents—they face an
acute liquidity crisis, and will require additional state aid merely to keep running. The lesson of
these events is clear: it is unwise to delay implementing state railway sector reforms during good
economic times—because the consequences can be too severe if a financial downturn occurs
before those reforms have been taken and properly implemented.
The three main reasons why the countries covered in this report should prioritize the reform of the
rail sector are:
To ensure compliance with the requirements of relevant European Union (EU) directives
for the railway sector contained within the acquis communautaire (hereafter the EU rail
acquis);
To reap the envisaged benefits of adopting this institutional framework; and
To ensure that when competition is introduced, state rail incumbents are able to compete
with new entrants, and do not require increased levels of support from the state.
With the exception of Bulgaria and Romania, which are already EU member states, all of the
countries covered in this report aspire to join the EU: they are either candidate countries or
potential candidate countries. This means that one of their fundamental goals is compliance with
the relevant EU directives for the railway sector contained within the EU rail acquis—unless
specific derogations have been agreed upon. Transposition of EU rail directives is a complex and
time-consuming process. It requires not only the adoption of primary and secondary legislation,
but also the establishment of specific institutional and organizational arrangements in line with
the requirements of the directives. For those countries that are candidate countries, there is
particular urgency in progressing with the EU rail acquis. For potential candidate countries there
is more time. However, precisely because those countries are further behind, there is a compelling
need to start now in accelerating the reform process.
1 For the purposes of this report the countries in the South East Europe region include Albania, Bosnia and
Herzegovina, Bulgaria, Croatia, Kosovo, Montenegro, Former Yugoslav Republic of Macedonia, Romania,
and Serbia.

Railway Reform in South East Europe and Turkey: On the Right Track? Main Report
2
In addition to improving their chances of being accepted into the EU, there are many intrinsic
economic benefits for these countries to gain by adopting this institutional framework. The main
objectives behind the rail reforms introduced in Europe in the 1990s were: (i) to improve
competition; (ii) to create more and better integrated international freight rail services; (iii) to
improve the efficient use of infrastructure capacity; (iv) to facilitate the creation of a single
European rail space; and (v) to reduce the declining modal share of railways. These objectives are
as relevant, if not more so, to the countries covered in this report as they are to the EU member
states themselves.
The third reason to prioritize reform is to ensure that when competition is introduced, state rail
incumbents are able to compete with new entrants, and do not require increased levels of support
from the state. Failure to engage in significant reforms—including corporate governance
reforms—prior to opening up the market, would expose the state rail incumbents to the risk of
rapidly declining market shares, and more significantly, to the risk of a significant worsening of
financial results. From a public policy perspective, a gradual set of reforms aimed at turning
around the financial results of the state rail incumbents is less costly socially and politically, than
dramatic layoffs at a time of acute crisis. In addition to implementing the required legislation,
state rail companies need to change their cultures in order to become more business-oriented.
They need to focus on meeting customer needs, and providing efficient, cost-effective services.
This cultural change is unlikely to take place as long as rail companies are protected by the state
and there is no intra-modal competition. Monopolies are not particularly nimble at responding to
market-oriented demand, especially if they are protected from facing the pressures of the market.
The ultimate aim of the reforms is to improve railway transport services in the study countries.
The greater the efficiency of the rail sector, the larger the range of markets in which the rail
companies can successfully compete. Rail freight services are critical to the production, trade, and
distribution of bulk and other semi-bulk materials, including coal, iron ores and minerals, oil
products, grains, chemicals, iron and steel, cement, timber, sand, and gravel. Over sufficiently
long distances, railways can provide efficient transport solutions for general freight and for high
volume movements from ports. With regard to passenger services, railways can perform valuable
economic and social roles in dense inter-city corridors—for suburban transport in major cities and
sufficiently populated rural areas. In many cases, these roles can only be transferred to road
transport at a high cost in terms of pollution and greenhouse gas emissions from vehicles, traffic
congestion, and traffic accidents.
The main objective of this report is to serve as a wake up call to the relevant authorities—which
include transport and finance ministries as well as rail companies—of the urgent need for
stepping up the reform process. Those countries that aspire to be members of the EU need to
understand that moving quickly on these reforms will greatly increase their chances of receiving a
positive opinion from the EU regarding rail transport regulations. And, bearing in mind the
sizeable subsidies and other forms of public monies the rail sector receives, there is too much to
be lost fiscally in failing to act. Scarce public resources should be used efficiently and effectively
to finance necessary upgrades to rail infrastructure and socially necessary passenger rail services.
They should not be used to prop up inefficient state railways weighed down by excessive
employee numbers and outdated management practices.

Railway Reform in South East Europe and Turkey: On the Right Track? Main Report
3
The 2005 Rail Report on the Western Balkans
In December 2005, the World Bank published Railway Reform in the Western Balkans
(henceforth the 2005 Report), a study that examined the challenges facing the railways of the
Western Balkans region. The 2005 Report was intended to act as a benchmark for the reform of
the railway sector in the Western Balkans region, which is defined to include Albania, Bosnia and
Herzegovina, Croatia, the former Yugoslav Republic of Macedonia (FYR Macedonia), Serbia,
Montenegro, and Kosovo. The report made clear the similarities of the countries covered in terms
of shared history, geography, and socio-economic characteristics, and common aspirations to join
the EU. The region‘s railways were found to have many common problems. These included
limited size, fragmentation, aged infrastructure and rolling stock, and poor operating and financial
performance.
The 2005 Report starkly illustrated the challenge facing the railways of the region: How were
they to sustain an ‗atomised‘ railway network of much the same network density (track km per
square km) as Western Europe, with less than half the traffic density, a third of the total labor
productivity, and a fraction of the per capita income? This was particularly urgent for two
reasons: (i) all of these countries aspired to EU membership, which required them to reform their
institutional framework and integrate their domestic rail markets with those of the EU member
states; and (ii) the fiscal and debt position of these countries was becoming increasingly
compromised by the substantial level of state-sponsored operating subsidies together with
projected investment needs.
The 2005 Report made the following recommendations, under the overall umbrella of
institutional reform, to meet the requirements of the EU rail acquis and improve the long-term
prospects of the railway sector:
(i) Infrastructure should be rationalized to better reflect current and forecast traffic, and
a harmonized system of access prices should be introduced across neighboring
national networks to prevent the emergence of barriers to competition;
(ii) Railway operators should be commercialized in order to reduce costs, retrench
excess labor, improve marketing, introduce a profit center organizational structure,
create a more rigorous and objective investment planning, and divest non-core
activities;
(iii) Socially desirable but loss-making services should be, where possible, tendered, or
at the very least supported by a public service contract to make explicit the cost of
running these services;
(iv) Regional integration is strongly recommended. The various countries involved
should devise arrangements to support regional rail services. This would include
joint marketing of services, pooling of equipment for a given service, coordinated
running of locomotives and drivers, establishment of joint ventures to operate
international services, and improvement of border-crossing procedures; and
(v) These reforms should be supported by selective capital investment to renew the
‗right‘ railway assets. The ‗right‘ assets are those that the downsized, self-sustaining
railway undertakings and infrastructure managers would choose in a rigorous and
objective capital planning process.
Railway Reform in South East Europe and Turkey: On the Right Track? Main Report
4
The current report revisits the railways of the region five years later to assess the progress made
by the state rail incumbents in: (i) institutional reform; (ii) operating and financial performance;
and (iii) integration. During the course of these five years, there was initially a period of
economic plenty, which was followed by a period of severe economic crisis. The current report
delineates the extent of any progress with integration, both within the region, and within the
broader railway market of the EU. It also aspires to provide a new benchmark for the prospective
Western Balkan Transport Community Treaty. This treaty aims to help to accelerate the
integration of transport systems and to harmonize rules on safety, environmental protection and
services. The set of 10 countries in the new report includes those in the 2005 Report, together
with Bulgaria, Romania, and Turkey. Bulgaria and Romania joined the EU on January 1, 2007,
and have made considerable progress in regard to railway reform. Their inclusion provides
interesting, and in some cases salutary, lessons for the other countries in the region. Turkey is not
only an EU candidate country and therefore moving towards compliance with the EU rail acquis,
but an increasingly important economic origin and destination for the region itself, and for the
broader markets of the EU.
Progress in Institutional Reform
The substantive implementation of the necessary institutional reforms to bring national legislation
in line with the requirements of the EU rail acquis has been disappointing in the Western Balkan
countries and Turkey. Where there has been legislative progress, operational establishment lags
considerably behind. The best reformers—Bulgaria and Romania—have implemented the EU rail
acquis, but even they have only partially implemented the reform of state-owned operators and
infrastructure managers. They missed the window of opportunity that existed prior to the
economic crisis, and they have been required to make painful cuts at short notice as performance
has deteriorated in 2009-2010.
The separation of accounts between infrastructure managers and transport services as foreseen in
Directive 91/440/EEC is one of the key rail directives, because it entails ending the status of a
railway as a state-owned monopoly. In Albania, Bosnia and Herzegovina, Serbia, and Turkey,
there have been no changes in the rail legal framework since 2005 to facilitate an unbundling of
services. All of these countries continue to have vertically integrated rail incumbents. In 2008,
Kosovo adopted a rail law. In 2010, it adopted a legal act separating infrastructure and transport
services. This act was aimed at separating Kosovo Railways into two joint stock companies.
However, this change has yet to be implemented. Croatia, FYR Macedonia, and Montenegro
have created separate joint stock rail companies for infrastructure and transport services. But
apart from Bulgaria and Romania, no other country in the report has opened its domestic market,
even on a reciprocal basis. Thus, the state incumbents continue to retain their monopoly power.
Montenegro is in the process of privatizating its freight operator—this would represent the first
private rail undertaking in the Western Balkans.
There has been some progress with the establishment of the regulatory institutions in the South
East Europe Transport Observatory (SEETO) countries. These institutions are required to be
independent in order to act in a fair and non-discriminatory fashion. Unfortunately, those
regulatory bodies that have been established often lack sufficient staff in terms of number and
competence, and are for the most part not independent—either in terms of decision-making
capacity or in terms of budget. Thus, they have limited authority. One of the key functions of the

Railway Reform in South East Europe and Turkey: On the Right Track? Main Report
5
regulator is to monitor competition in the rail service market and hear appeals regarding possible
discrimination by the infrastructure manager and complaints about path allocation, level and
structure of track access charges. Having fully operational regulatory institutions will become
critical in the future, particularly when SEETO countries and Turkey open their markets. In
countries such as Albania, Bosnia and Herzegovina, Kosovo, and Serbia, where the incumbent
rail companies remain vertically integrated, the need may appear less pressing at present. For
smaller rail sectors, appropriate solutions need to be developed in order to reduce the financial
cost of establishing and running all the rail regulatory institutions foreseen in the EU rail
directives.
The Western Balkan members of SEETO are signatories to an Addendum to a Memorandum of
Understanding aimed at enhancing the South East European Railway Transport Area. On
December 4, 2008, the SEETO countries adopted a timetable for the implementation of
legislative and structural changes to the rail sector. The timetable accounted for the need to go
beyond the adoption of primary laws in accord with the EU rail acquis. Successful reform also
required the adoption of secondary legislation, the establishment of required institutional,
organizational, and financial arrangements, the issuance of operational decisions, and the staffing
of new institutions. The deadline for implementation varies by country. For the region as a whole,
it was 2010—in most cases that deadline has been missed.
By contrast, progress in Bulgaria and Romania has been substantial. Both countries have
transposed the First Railway Package. By 2007, rail liberalization was considered in some
respects more advanced in Bulgaria and Romania than in a number of the EU-15 countries, such
as France, Greece, Ireland, and Luxembourg. One of the key impacts of the reforms has been in
terms of opening up actual access to the rail market. In fact, one of the most significant changes
has been the emergence of new participants in the rail freight market. These new participants
have taken a sizeable market share: in Romania, that share exceeded 40 percent by the end of
2009.
On the other hand, the incumbents—BDZ EAD in Bulgaria and CFR Marfa in Romania—
delayed implementing the sort of market-driven business strategies recommended in the 2005
Report. As a consequence, they are struggling to compete in the freight market with the new
entrants. Large financial losses in both companies—made more pronounced by the impact of the
financial crisis since the last quarter of 2008—have forced them to make painful cuts. What has
now become clear is that successful implementation of the EU rail acquis will create a level-
playing field by opening up the market to challengers. However, it will not in and of itself lead to
improvements in the financial results of state rail companies—those improvements will only
come with sound strategies and smart managerial decision-making.
Passenger services in Bulgaria and Romania remain restricted to the state incumbents. Despite
public service obligation (PSO) contracts, these remain loss-making enterprises—as is the case
for the infrastructure managers. The continued poor financial performance of these state-owned
companies reflects an inability to respond to changing market conditions. In addition, the
introduction of necessary reforms—such as public service contracts and track access charges—
without a corresponding implementation of concrete measures to contain costs and improve
performance, has exacerbated poor financial and operating performance. The experiences of both
of these countries hold important lessons for the Western Balkan countries and Turkey as they
Railway Reform in South East Europe and Turkey: On the Right Track? Main Report
6
proceed with the reform process. In particular, it is important to bear in mind that improving the
performance of state rail companies and implementing the EU rail aquis are two separate
objectives, which should be pursued in parallel.
Progress in Operating and Financial Performance
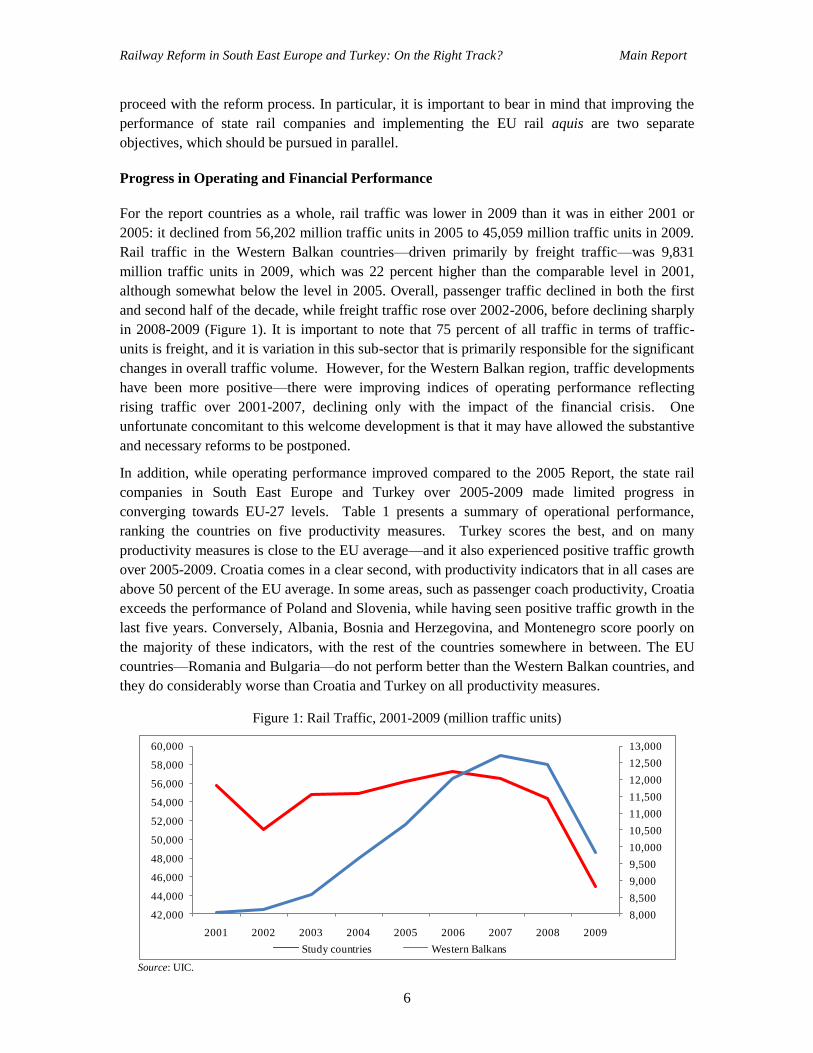
For the report countries as a whole, rail traffic was lower in 2009 than it was in either 2001 or
2005: it declined from 56,202 million traffic units in 2005 to 45,059 million traffic units in 2009.
Rail traffic in the Western Balkan countries—driven primarily by freight traffic—was 9,831
million traffic units in 2009, which was 22 percent higher than the comparable level in 2001,
although somewhat below the level in 2005. Overall, passenger traffic declined in both the first
and second half of the decade, while freight traffic rose over 2002-2006, before declining sharply
in 2008-2009 (Figure 1). It is important to note that 75 percent of all traffic in terms of traffic-
units is freight, and it is variation in this sub-sector that is primarily responsible for the significant
changes in overall traffic volume. However, for the Western Balkan region, traffic developments
have been more positive—there were improving indices of operating performance reflecting
rising traffic over 2001-2007, declining only with the impact of the financial crisis. One
unfortunate concomitant to this welcome development is that it may have allowed the substantive
and necessary reforms to be postponed.
In addition, while operating performance improved compared to the 2005 Report, the state rail
companies in South East Europe and Turkey over 2005-2009 made limited progress in
converging towards EU-27 levels. Table 1 presents a summary of operational performance,
ranking the countries on five productivity measures. Turkey scores the best, and on many
productivity measures is close to the EU average—and it also experienced positive traffic growth
over 2005-2009. Croatia comes in a clear second, with productivity indicators that in all cases are
above 50 percent of the EU average. In some areas, such as passenger coach productivity, Croatia
exceeds the performance of Poland and Slovenia, while having seen positive traffic growth in the
last five years. Conversely, Albania, Bosnia and Herzegovina, and Montenegro score poorly on
the majority of these indicators, with the rest of the countries somewhere in between. The EU
countries—Romania and Bulgaria—do not perform better than the Western Balkan countries, and
they do considerably worse than Croatia and Turkey on all productivity measures.
Figure 1: Rail Traffic, 2001-2009 (million traffic units)
Source: UIC.
8,000
8,500
9,000
9,500
10,000
10,500
11,000
11,500
12,000
12,500
13,000
42,000
44,000
46,000
48,000
50,000
52,000
54,000
56,000
58,000
60,000
2001 2002 2003 2004 2005 2006 2007 2008 2009
Study countries Western Balkans

Railway Reform in South East Europe and Turkey: On the Right Track? Main Report
7
Table 1: Summary of Operational Performance (EU 27=100), 2009
Country Traffic
Density
Productivity
Average Coach Wagon Locomotive Labor
Turkey 56 100 89 109 84 88
Croatia 53 85 64 68 58 66
FYR Macedonia 30 34 61 47 38 42
Romania 45 48 31 29 40 39
Bulgaria 41 41 30 34 28 35
Serbia 28 18 49 38 29 32
Kosovo 7 51 36 28 28 30
Montenegro 27 36 24 24 20 26
BH 33 8 35 24 23 25
Albania 6 9 14 5 7 8 Sources: UIC, Kosovo Railways; World Bank calculations.
Figure 2: Cost Recovery Ratio, 2008
(percentages)
Figure 3:Viability Ratio, 2008
(percentages)
Source: State rail companies. Source: State rail companies.
The cost recovery ratio for the state rail undertakings reveals that the majority remain significant
loss-makers, even with state funding—even if the extent of support has fallen in terms of the
51
58
59
73
77
82
84
86
87
98
102
105
107
112
117
FYROM MZ-I
MG ZICG
Turkey (TCDD)
BG NRIC
BH ZFBH
RO CFR Calatori
Albania Railways
FYROM MZ-T
Serbian Railways
RO CFR
RO CFR Marfa
BG BDZ
BH ZRS
Kosovo Railways
Croatian Railways
20
28
39
42
45
50
55
61
65
73
74
86
93
94
102
MG ZICG
Turkey (TCDD)
RO CFR Calatori
FYROM MZ-I
BG NRIC
Serbian Railways
Albania Railways
BH ZFBH
BH ZRS
Croatian Railways
BG BDZ
FYROM MZ-T
RO CFR
Kosovo Railways
RO CFR Marfa

Railway Reform in South East Europe and Turkey: On the Right Track? Main Report
8
share of GDP from the levels reported in 2005.2 Figure 2 presents the cost recovery ratio for the
15 state rail companies; for five of these the cost recovery ratio exceeded 100 percent, indicating
that they met total operating costs from their revenues. For the bottom three companies—
Turkey‘s TCDD, Montenegro‘s ZICG, and FYR Macedonia‘s MŢ-I—the cost recovery ratio was
under 60 percent, a very low level. For most rail companies, these ratios deteriorated dramatically
in 2009 due to the impact of the international financial crisis on demand. But even prior to 2009,
few state rail incumbents were in a position to finance operating costs from total revenues. With
one exception—Romania‘s CFR Marfa—all of the state rail companies included in the report
were unable to meet operating costs from commercial revenues—that is to say a viability ratio of
less than 100 (Figure 3).
Progress in Integration
Progress in integration has also been rather limited, despite the significant and growing market
segment for international rail freight transport, particularly along the main international corridors.
The expansion of the EU rail networks to the new member, candidate, and accession countries
has created a significant opportunity for rail freight. This is illustrated by the 1-2 percent share of
the total freight market between Turkey and the EU currently carried by the railways. However,
this potential remains unrealized in the study countries, due in part to strong competition from
other modes, but also due to a number of other more attainable factors, particularly at the border-
crossings, many of which could be addressed at little expense.
The current report commissioned an audit of a number of key border-crossing points (BCPs). The
audit compared current practice in study country BCPs with European harmonized framework
border-crossing agreements (BCAs), such as those between Switzerland and Germany, Germany
and Austria, and Austria and Hungary. The findings show that the critical element in reducing
border-crossing times is effective cooperation among incumbent rail undertakings and rail
infrastructure managers—particularly across national boundaries. The Bosphorus Europe
Express test run along rail Corridor X revealed that commercial speeds and reliability can rise
dramatically when border-crossing delays are reduced, without major and expensive
improvements to the rail infrastructure.
The EU‘s adoption in 2010, of a regulation concerning a corridor approach focusing on
international rail freight has important lessons for the study countries. Romania and Bulgaria will
need to implement the regulation in due course. For the remaining eight countries, it is crucial to
approach rail freight investments and performance from a corridor perspective with enhanced
cross-border coordination, in order to improve rail freight performance and increase its
attractiveness to potential freight customers. The idea of a one-stop shop was recommended in the
2005 Report and remains an essential element in significantly reducing border-crossing times.
2 The cost recovery ratio is defined as the degree of coverage of total operating costs with total revenue,
including state support. The viability ratio is defined as the ratio of commercial revenue divided by total
operating costs.

Railway Reform in South East Europe and Turkey: On the Right Track? Main Report
9
Bosphorus Europe Express
The objective of the test run of the Bosphorus Europe Express was to reduce transit time between Ljubljana
and Istanbul to 35 hours by creating a new and faster rail product that would be more attractive to potential
clients. According to the timetable prior to the test run, a train from Ljubljana to Kapikule took 60 hours
and 43 minutes, with long delays in Dimitrovgrad (over three hours) and Kapikule (over four hours). The
test run was successful: stoppage time was reduced from 19 hours to 6 hours, which brought the total travel
time down to the targeted 35 hours. The testers decided to amend the timetable to 45 hours of travel time,
because they recognized that the exceptional conditions of the test run could not be matched in practice.
The testers had been given six months of preparation, with a remit to work exclusively on making the test
run train a reality. The test train set benchmarks, but this did not mean that those benchmarks could be
easily obtained in the normal day-to-day business.
Source: Uhl (2010).
The Conclusions of the Report
There are a number of reasons for the limited progress in rail reform in South East Europe and
Turkey. Most of the state railways are heavily overstaffed; reform would require layoffs, which
can be politically sensitive with the powerful trade unions. The financial crisis at the end of 2008
had a major impact on rail traffic and financial performance in Bulgaria and Romania: it led to
major layoffs and restructuring plans for the state railway companies. Protectionism has acted as
a powerful factor in slowing down the pace of change, because rail reforms lead to competition
from foreign participants and domestic private operators, requiring the state incumbent companies
to quickly adapt or else lose market share.
However, there are powerful levers for ensuring progress on the rail reform agenda going
forward. The first is EU accession—because candidate countries must adopt the EU transport
acquis before they can become member states. This lever is most powerful with the candidate
Svilengrad/Kapikule
Istanbul/Halkali
Serbia
Turkey
Bulgaria
Slovenia
Croatia
Bosnia-
Herzegovina
Ljubljana
Zagreb
Belgrade
Sofia
Tovarnik/Sid
Dobova/Savski Maraf
Nis
Dimitrovgrad /Dragoman
MihailovaMontenegro
3 kV DC
25 kV/50 Hz
diesel
Bosphorus Europe Express on Pan-european Corridor X
*BAC – Business Advisory Council South-East Eurpoe
total length : 1577 km (out of it 260 km of non-electrified railway
lines, 200 km of single tracks, on some sections gradients up to
29%o
crossing 5 countries
4 (x 2) border-crossings, EU and non-EU borders
different power supply systems
8 times changing the locomotives
different max train length (520 – 570 m) and weight (1200-1800
tonnes)
Description of the route

Railway Reform in South East Europe and Turkey: On the Right Track? Main Report
10
countries closest to accession, particularly Croatia, but also FYR Macedonia and Montenegro. A
second lever is potential fiscal pressures on state budgets stemming from loss-making state rail
companies. This includes the threat of bankruptcy, which, the Romanian state company CFR
Marfa experienced in 2010. The Bulgarian state company BDZ EAD is currently facing a similar
situation—BDZ EAD has required state aid to stave off imminent liquidity problems. The
pressures are lower for countries that are years away from joining the EU, are less effected by the
international financial crisis, and whose state railways are not facing the threat of bankruptcy.
However, this does not mean that there is no urgency to speed up the institutional reform process
and strengthen the operational and financial performance of state rail incumbents. On the
contrary, reforms take time to fully implement, and thus, the need to step up efforts must start
now. The EU, SEETO, and international financial institutions have key roles to play in catalyzing
reforms in the region.
Government transport policy should place rail and road transportation on an equal footing: the
legal provisions and the level of financial contribution of the state for railway and road
infrastructure should be equivalent. This will allow users to make the socially optimal choice
between the two modes for each trip. As long as the financial support of the state is reflected in an
unbiased manner in the transportation tariffs for competing modes of transport, the market will
generate enough resources to cover infrastructure operation needs.
The current report concludes with a set of recommendations, which to a significant extent echo
the recommendations made in the 2005 Report. This in itself testifies to the modest progress
made in implementing substantive rail reform over the past five years. While rail reform has been
largely moving on the right track, there is an urgent need to accelerate the pace of reforms.
Continuing Necessary Institutional Reform
Ensure managerial independence of the infrastructure manager. Governments need
to unbundle the infrastructure management from any rail operator. Ownership rights
should be exerted by different, independent authorities or ministries.
Where unbundling has occurred, ensure that relations between the infrastructure
manager and operator(s) are placed on a contractual basis. These contracts should be
based on transparent and equal access conditions to the infrastructure, and should be
published in regularly updated network statements. Framework agreements providing
certainty of capacity available on a horizon of several years would be a positive
development.
Set a charging framework based on the direct costs of operating a service. Within
this framework, the infrastructure manager can then set the track access charge (TAC) in
accordance with European rules. The level of charges for freight trains needs to be kept in
line with what they can bear in order to make them competitive vis-à-vis other freight
transport modes. Any such charges need to be coordinated with charges levied in other
countries to ensure that they do not distort international traffic across rail corridors or
create a negative externality. Freight trains should not have to cross-subsidize passenger
trains by way of different infrastructure charges, when the former are not able to bear
such high charges relative to competition.

Railway Reform in South East Europe and Turkey: On the Right Track? Main Report
11
Review passenger fare regulations. In many cases, the existing fare regulations limit
the ability of the railways to implement commercial pricing systems. The use of yield-
management techniques to try to maximize the sale of unused seats needs to be permitted
within the pricing framework, in order to improve revenues per railcar-km. Where
subsidies are paid in block or when a PSC pays the difference between revenue and cost,
there are limited incentives to collect fares and reduce fare evasion.
Permit passenger operators to set ticket prices for services not under public service
obligation. Fare discounts and regulatory policy should focus on providing options for
poorer travels, but should not otherwise determine pricing. The State should compensate
operators for loss of revenues that may result from fare discounts or price restrictions.
Encourage passenger operators to provide web-based timetable information and
ticket sale applications. Railways should also seek to offer trip chains integrated with
coach operators. Ticket and fare integration with urban and airport access services may
attract new passengers for railways in the major agglomerations.
Improve corporate governance in state rail companies. A number of countries have
changed the legal status of their rail undertakings to that of joint-stock companies, which
is a corporate structure selected to ensure managerial independence and commercially-
orientated behavior. However, in practice this has often led to the creation of joint-stock
companies on paper, with significant interference from transport ministries in day-to-day
decision making, which prevents the kinds of decision-making that can be expected from
operating in a more commercially-oriented environment.
Require financial accounts to be prepared and audited according to International
Financial Reporting Standards—and require that they be published. In order to
assess the financial performance of rail companies, systematic and comprehensive
financial accounts need to be prepared according to International Financial Reporting
Standards (IFRS) and audited by independent audit companies on a line-of-business
basis.3 EU laws require the publishing of accounts by activity for each rail company,
including the production of balance sheets and income statements—although they do not
provide detailed guidance on the presentation of accounts, nor do they set accounting
standards. Without explicit guidelines, there are significant variations in the way accounts
are presented, and in the way governments report state contributions to the sector. This
makes it difficult to make direct comparisons between rail companies.
Strengthening Regulation of the Rail Sector
Strengthen licensing bodies as foreseen in EU rail directives. Licensing bodies should
award licenses to railway undertakings that satisfy EU requirements—these licenses
should be published. Governments should set minimum coverage requirements relative to
accidents.
3 See van Greuning, Hennie, Scott, Darrel, and Terblanche, Simone (2011), International Financial
Reporting Standards: A Practical Guide. World Bank Training Series. World Bank: Washington DC.

Railway Reform in South East Europe and Turkey: On the Right Track? Main Report
12
Put an end to self-regulated rail monopolies. Place critical access conditions under the
control of a safety authority and regulatory body, as envisaged under EU rail directives.
These authorities should control the conditions for awarding train driver licenses, as well
as access to training facilities.
Establish pro-active and strong regulators. Guaranteeing fair competitive conditions
will encourage market-entry of new operators. Rail regulators should cooperate across
borders, along rail corridors, and at a regional and EU level.
Require authorization of rolling stock by a safety authority. On the basis of cross-
acceptance rules, tests passed in other countries should be accepted across national
borders—this eliminates the need for time-consuming retesting. The safety authority
should establish and publish a complete collection of national safety rules, and abandon
any such rules that are incompatible or redundant with EU rules.
Ensure that prices for rail-related services are transparent. Rail-related services,
such as terminals in inland or sea ports, passenger stations, fueling, towing, and supply of
traction current, are essential for market access. Consequently, prices and access
conditions should be transparent and based on conditions controlled by the regulatory
body.
Improving the Quality of Rail Infrastructure and the Performance of Infrastructure Managers
Refocus rail network development plans. Governments should prepare rail network
development plans with investment decisions based on cost-benefit analysis, rather than
focusing excessively on past traffic density; a distinction must be made between
upgrading, rehabilitation, and light maintenance of rail infrastructure in these plans.
Governments are strongly advised to develop a strategy for the modernization of the core
network that carries the bulk of the traffic, for the achievement of inter-operability with
the European railways, and for increasing rail safety and labor productivity.
Consider the need for network rationalization and focus maintenance on high-
density lines. A network rationalization program needs to be defined and implemented in
a manner that reduces excess railway track and concentrates on the network where rail
performs the most useful transport role. This rationalization, or definition of a ‗core
network‘, will help bring rail traffic density closer to the EU average. More importantly,
it will improve the financial sustainability of the rail sector through the reduction of
infrastructure costs. Shifting to high-density corridors, and focusing maintenance on these
lines while closing low-density routes is probably the only way to improve the
performance of the rail sector from a cost perspective. This could be complemented with
the tendering of low traffic lines, where there is market interest, or their replacement with
more cost-effective bus services.
Utilize multi-annual contracts for rail infrastructure development. The state
contribution for the development of rail infrastructure and for partial coverage of
maintenance costs must be allocated in a transparent way. It should be based on a multi-
annual contract signed between transport ministries and the infrastructure
manager/holding company. There should be specific provisions regarding: (i) the public
Railway Reform in South East Europe and Turkey: On the Right Track? Main Report
13
money allocated; (ii) the destination of the allocated funds—clearly distinguishing
network development from network maintenance; (iii) the responsibilities of the
infrastructure company regarding the availability of infrastructure; and (iv) the quality of
services (punctuality, technical speed, capacity offered for operation).
Set infrastructure charges at a level that is not excessive. Care must be taken to ensure
that underspending on the part of the state is not compensated for by excessively high
TACs, which undermine the viability and competitiveness of rail freight vis-à-vis other
transport modes. Such charges should not be fixed in multi-annual contracts and cannot
compensate for underfinancing without a negative impact on traffic volumes.
Establish a system for measuring and charging traction current. This system should
be set up to measure and charge traction current according to consumption—and it should
be inter-operable with other infrastructure managers. This may reduce consumption and
costs of operation.
Encourage infrastructure managers to publish network statements via
RailNetEurope. The latter is an association that was set up by a majority of European
Rail infrastructure managers and allocation bodies to enable fast and easy access to
European rail. Infrastructure managers should use the umbrella of RailNetEurope to
publish their network statements and access conditions, and to coordinate the
construction of international train paths.
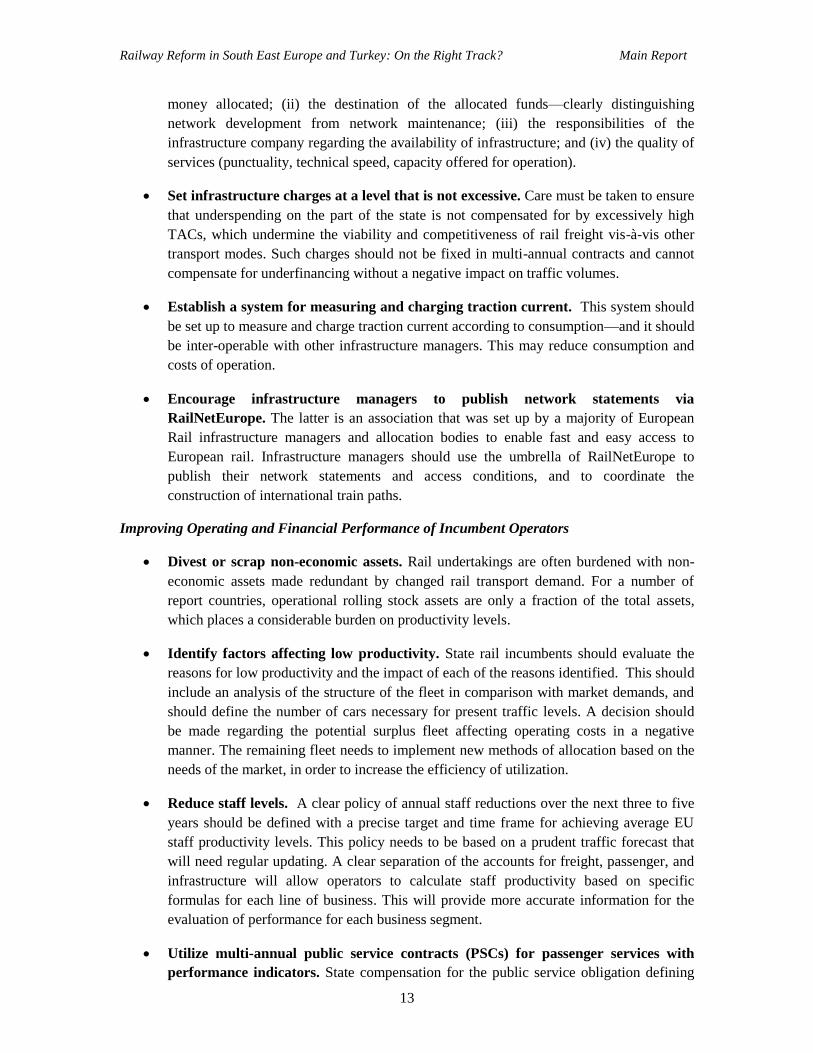
Improving Operating and Financial Performance of Incumbent Operators
Divest or scrap non-economic assets. Rail undertakings are often burdened with non-
economic assets made redundant by changed rail transport demand. For a number of
report countries, operational rolling stock assets are only a fraction of the total assets,
which places a considerable burden on productivity levels.
Identify factors affecting low productivity. State rail incumbents should evaluate the
reasons for low productivity and the impact of each of the reasons identified. This should
include an analysis of the structure of the fleet in comparison with market demands, and
should define the number of cars necessary for present traffic levels. A decision should
be made regarding the potential surplus fleet affecting operating costs in a negative
manner. The remaining fleet needs to implement new methods of allocation based on the
needs of the market, in order to increase the efficiency of utilization.
Reduce staff levels. A clear policy of annual staff reductions over the next three to five
years should be defined with a precise target and time frame for achieving average EU
staff productivity levels. This policy needs to be based on a prudent traffic forecast that
will need regular updating. A clear separation of the accounts for freight, passenger, and
infrastructure will allow operators to calculate staff productivity based on specific
formulas for each line of business. This will provide more accurate information for the
evaluation of performance for each business segment.
Utilize multi-annual public service contracts (PSCs) for passenger services with
performance indicators. State compensation for the public service obligation defining

Railway Reform in South East Europe and Turkey: On the Right Track? Main Report
14
the passenger transportation services must be allocated based on a multi-annual contract.
This contract must be signed between transport ministries with the passenger
company/holding company defining the type of services to be offered, the volume
(number of trains, composition of trains), and selected quality indicators. The PSC
should specify the train-km purchased on all routes. In addition to output targets, it
should contain input performance targets in order to create incentives to seek efficiency
improvements. The PSC should avoid over-compensation and should be awarded by
competititive tendering. Profitable passenger and freight services should not benefit from
state finance.
Utilize performance indicators by lines of business. Progress must be measured based
on specific indicators for each of the lines of business: infrastructure, passengers, cargo—
and in the case of Bulgaria and Croatia, traction. The annual budget of state incumbents
must be approved for each line of business containing specific targets. In the case of
holding companies, the daughter companies should sign performance contracts with the
management of the holding company, and should be held directly accountable for
operational and financial results.
Organize around customer service centers instead of territorial structures. Many
European railways have successfully implemented a business model based on profit
centers that manage each major type of commodity and passenger service. It is highly
recommended that freight services be structured around customer service centers for each
of these types of products, and that passenger rail undertakings be structured around
specific passenger services. Infrastructure managers can organize activities around traffic
management, power, and telecommunication, in order to attract more clients.
Reassess the logic of maintaining traction companies. Efficiency gains depend on
being in touch with market demands. Monopolistic traction companies in Bulgaria and
Croatia lack direct contact with the market—tariffs are not established through
interaction with clients, which prevents successful implementation of market-based
railway activities. There is a need to elaborate a methodology for the calculation of unit
tariffs for services offered by traction companies, with annual contracts signed between
the traction company and its clients based on established tariffs, in order to ensure that
traction is made available to all companies on a non-discriminary basis.
Improving Integration in Service and Network Provision
Improve border-crossing arrangements. The border-crossing audit indicated the need
for a number of institutional and regulatory improvements, based on the harmonized
framework border-crossing agreement (BCA) that has been developed for SEETO
countries. The BCA has five key principles: (i) compliance with open access standards
that are required by EU directives in force; (ii) introduction of the concept of a Joint
Border Zone; (iii) cooperation between border authorities—in particular, the possibility
for the border authority of one country to be active in a neighboring country; (iv) police
and customs control over moving trains; and (v) establishment of Border-crossing
Commissions (BCCs) for open access border-crossings. Within the Joint Border Zone,
the following should be introduced:

Railway Reform in South East Europe and Turkey: On the Right Track? Main Report
15
(i) Single window principle for freight customs. All customs services should be
carried out by the customs authorities of both countries at one location in the
Joint Border Zone.
(ii) One Stop Shop for the use of rail infrastructure in the Joint Border Zone. A
One Stop Shop in this context means a body that designs an international
train path. The applicant receives all information, including the timetable,
fees and technical parameters that enable one to use the path. Any licensed
rail undertaking can purchase rail infrastructure border services—such as
path, shunting, and communication—from one of the two infrastructure
managers. The rules and regulations of the One Stop Shop are specified in a
joint network statement, which can be an annex to the network statement
demanded by Directive 2001/14/EC.
(iii) Passenger control on moving trains. Border police and customs of both
states carry out controls while the train is moving. The zone in which such a
control is carried out might be different from the zone in which the
commercial and technical dispatching is done by the rail undertakings and
infrastructure managers.
Utilize Agreements of Infrastructure Interconnection (AIIs) in order to expedite
border-crossings. These are agreements that are signed between infrastructure managers.
A good example is the agreement proposed by SEETO to be found in Annex 5, which
was approved by the SEETO Commission representing the transport ministries of the
Western Balkan countries.
If necessary, utilize selective investments in order to establish joint border stations
or move clearance to defined inland terminals. A potential investment measure could
be the transfer of certain border-crossing activities to major inland terminals. From this
perspective, international trains should only be inspected/shunted/split at a limited
number of inland terminals in order to: (i) reduce border-crossing times; (ii) achieve
higher commercial speed for trains; and (iii) streamline border procedures. However, this
notion is based on conventional single wagonload or wagon groups which are typical of
the incumbent state-owned railways. With the entry of non-state private undertakings, the
rail concept changes to one with block train systems: (i) from sidings to sidings in
conventional block trains; (ii) from sidings to terminals or vice versa in conventional
block trains; and (iii) from terminal to terminal in conventional block trains—as is the
case with the Schenker-Proodos trains, Express-Interfracht trains, and terminal to
terminal traffic in combined transport as is done by Intercontainer, AdriaKombi on the
two corridors.
Coordinate marketing of services across rail corridors. The fragmentation of the rail
market in South East Europe continues to be a reality. The current market structure is
largely characterized by incumbent rail undertakings operating national networks, while
trade flows have increasingly become cross-border in nature. This is a particular
stumbling block for the Western Balkan rail undertakings, given the small size of the
national networks and the number of border-crossings involved in transfering goods out

Railway Reform in South East Europe and Turkey: On the Right Track? Main Report
16
of the region. A number of initiatives announced in 2010 suggest that there is momentum
for change, and a belated recognition of the need to increase regional cooperation and
coordination. Coordination of rail operators along corridors should be established to
improve and develop services, while ensuring the independence of the partners as regards
pricing of service and avoiding foreclosure.
Ensure coordination of TACs across freight corridors within the region. Excessively
high freight TACs across one segment of a corridor can shift freight rail traffic onto
trucks. This not only affects the given domestic market, but also has knock-on effects
throughout the corridor. This suggests the need to develop coordinated TAC regimes
across major European freight corridors, in order to make international rail freight flows
easier to manage and to ensure that the high TACs of one country do not pose negative
externalities for other countries along the corridor.
Introduce a pilot scheme to test EDI transmission between select border stations. At
present, communication across BCPs is limited to telephones, faxes, and e-mails, as well
as manual copying of documentation, as noted above. The main potential of EDI is in the
reduction of dispatching times. This would require IT equipment to be installed: (i)
within the border stations and EDI between the border stations in the Joint Border Zone;
(ii) between rail undertakings and infrastructure managers; (iii) between neighboring
infrastructure managers, and (iv) between shippers/forwarders and rail undertakings. This
would allow pre-approval messages in an electronic format to be generated automatically
when a train is on route. It would apply to requests for locomotives and handover trains,
and electronic transmission of all necessary commercial and train documents.

Railway Reform in South East Europe and Turkey: On the Right Track? Main Report
17
INTRODUCTION
1. The railways of South East Europe and Turkey experienced significant declines in traffic
volumes in 2009.4 This reflected the impact of the international financial crisis unleashed in the
last quarter of 2008 and its contractionary impact on the economies of the region and elsewhere.
Lower traffic volumes translated in most cases into a serious deterioration of the financial
performance of the state-owned railways. This brought home the costs of failing to implement
essential reforms to improve the operational and financial performance of the sector when the
economy was strong. In Romania in 2010, large-scale layoffs were announced at short notice for
the state rail companies. The situation is similar for the Bulgarian state rail incumbents—they
face an acute liquidity crisis, and will require additional state aid merely to keep running. The
lesson of these events is clear: it is unwise to delay implementing state railway sector reforms
during good economic times—because the consequences can be too severe if a financial
downturn occurs before those reforms have been taken and properly implemented.
2. The three main reasons why the countries covered in this report should prioritize the reform
of the rail sector are:
To ensure compliance with the requirements of relevant European Union (EU) directives
for the railway sector contained within the acquis communautaire (hereafter the EU rail
acquis);
To reap the envisaged benefits of adopting this institutional framework; and
To ensure that when competition is introduced, state rail incumbents are able to compete
with new entrants, and do not require increased levels of support from the state.
3. With the exception of Bulgaria and Romania, which are already EU member states, all of
the countries covered in this report aspire to join the EU: they are either candidate countries or
potential candidate countries. This means that one of their fundamental goals is compliance with
the relevant EU directives for the railway sector contained within the EU rail acquis—unless
specific derogations have been agreed upon. Transposition of EU rail directives is a complex and
time-consuming process. It requires not only the adoption of primary and secondary legislation,
but also the establishment of specific institutional and organizational arrangements in line with
the requirements of the directives. For those countries that are candidate countries, there is
particular urgency in progressing with the EU rail acquis. For potential candidate countries there
is more time. However, precisely because those countries are further behind, there is a compelling
need to start now in accelerating the reform process.
4. In addition to improving their chances of being accepted into the EU, there are many
intrinsic economic benefits for these countries to gain by adopting this institutional framework.
4 For the purposes of this report the countries in the South East Europe region include Albania, Bosnia and
Herzegovina, Bulgaria, Croatia, Kosovo, Montenegro, Former Yugoslav Republic of Macedonia, Romania,
and Serbia.
Railway Reform in South East Europe and Turkey: On the Right Track? Main Report
18
The main objectives behind the rail reforms introduced in Europe in the 1990s were: (i) to
improve competition; (ii) to create more and better integrated international freight rail services;
(iii) to improve the efficient use of infrastructure capacity; (iv) to facilitate the creation of a single
European rail space; and (v) to reduce the declining modal share of railways. These objectives are
as relevant, if not more so, to the countries covered in this report as they are to the EU member
states themselves.
5. The third reason to prioritize reform is to ensure that when competition is introduced, state
rail incumbents are able to compete with new entrants, and do not require increased levels of
support from the state. Failure to engage in significant reforms—including corporate governance
reforms—prior to opening up the market, would expose the state rail incumbents to the risk of
rapidly declining market shares, and more significantly, to the risk of a significant worsening of
financial results. From a public policy perspective, a gradual set of reforms aimed at turning
round the financial results of the state rail incumbents is less costly socially and politically, than
dramatic layoffs at a time of acute crisis. In addition to implementing the required legislation,
state rail companies need to change their cultures in order to become more business-oriented.
They need to focus on meeting customer needs, and providing efficient, cost effective services.
This cultural change is unlikely to take place as long as rail companies are protected by the state
and there is no intra-modal competition. Monopolies are not particularly nimble at responding to
market-oriented demand, especially if they are protected from facing the pressures of the market.
6. The ultimate aim of the reforms is to improve railway transport services in the study
countries. The greater the efficiency of the rail sector, the larger the range of markets in which the
rail companies can successfully compete. Rail freight services are critical to the production, trade,
and distribution of bulk and other semi-bulk materials, including coal, iron ores and minerals, oil
products, grains, chemicals, iron and steel, cement, timber, sand, and gravel. Over sufficiently
long distances, railways can provide efficient transport solutions for general freight and for high
volume movements from ports. With regard to passenger services, railways can perform valuable
economic and social roles in dense inter-city corridors—for suburban transport in major cities and
sufficiently populated rural areas. In many cases, these roles can only be transferred to road
transport at a high cost in terms of pollution and greenhouse gas emissions from vehicles, traffic
congestion, and traffic accidents.
7. The main objective of this report is to serve as a wake up call to the relevant authorities—
which include transport and finance ministries as well as rail companies—of the urgent need for
stepping up the reform process. Those countries that aspire to be members of the EU need to
understand that moving quickly on these reforms will greatly increase their chances of receiving a
positive opinion from the EU regarding rail transport regulations. And, bearing in mind the
sizeable subsidies and other forms of public monies the rail sector receives, there is too much to
be lost fiscally in failing to act. Scarce public resources should be used efficiently and effectively
to finance necessary upgrades to rail infrastructure and socially necessary passenger rail services.
They should not be used to prop up inefficient state railways weighed down by excessive
employee numbers and outdated management practices.

Railway Reform in South East Europe and Turkey: On the Right Track? Main Report
19
The 2005 Rail Report on the Western Balkans
8. In December 2005, the World Bank published Railway Reform in the Western Balkans
(henceforth the 2005 Report), a study that examined the challenges facing the railways of the
Western Balkans region. The 2005 Report was intended to act as a benchmark for the reform of
the railway sector in the Western Balkans region, which is defined to include Albania, Bosnia and
Herzegovina, Croatia, the former Yugoslav Republic of Macedonia (FYR Macedonia), Serbia,
Montenegro, and Kosovo. The report made clear the similarities of the countries covered in terms
of shared history, geography, and socio-economic characteristics, and common aspirations to join
the EU. The region‘s railways were found to have many common problems. These included their
limited size, fragmentation, aged infrastructure and rolling stock, and poor operating and financial
performance.
9. The 2005 Report starkly illustrated the challenge facing the railways of the region: How
were they to sustain an ‗atomised‘ railway network of much the same network density (track km
per square km) as Western Europe, with less than half the traffic density, a third of the total labor
productivity, and a fraction of the per capita income? This was a particularly urgent for two
reasons: (i) all of these countries aspired to EU membership, which required them to reform their
institutional framework and integrate their domestic rail markets with those of the EU member
states; and (ii) the fiscal and debt position of these countries was becoming increasingly
compromised by the substantial level of state-sponsored operating subsidies, together with
projected investments needs.
10. The 2005 Report made the following recommendations, under the overall umbrella of
institutional reform, to meet the requirements of the EU rail acquis and improve the long-term
prospects of the railway sector:
(i) Infrastructure should be rationalized to better reflect current and forecast traffic, and
a harmonized system of access prices should be introduced across neighboring
national networks to prevent the emergence of barriers to competition;
(ii) Railway operators should be commercialized in order to reduce costs, retrench
excess labor, improve marketing, introduce a profit center organizational structure,
create a more rigorous and objective investment planning, and divest non-core
activities;
(iii) Socially desirable but loss-making services should be, where possible, tendered, or
at the very least supported by a public service contract to make explicit the cost of
running these services;
(iv) Regional integration is strongly recommended. The various countries involved
should devise arrangements to support regional rail services. This would include
joint marketing of services, pooling of equipment for a given service, coordinated
running of locomotives and drivers, establishment of joint ventures to operate
international services, and improvement of border-crossing procedures; and
(v) These reforms should be supported by selective capital investment to renew the
‗right‘ railway assets. The ‗right‘ assets are those that the downsized, self-sustaining
railway undertakings and infrastructure managers would choose in a rigorous and
objective capital planning process.

Railway Reform in South East Europe and Turkey: On the Right Track? Main Report
20
11. The current report revisits the railways of the region five years later to assess the progress
made by the state rail incumbents in: (i) institutional reform; (ii) operating and financial
performance; and (iii) integration. During the course of these five years, there was initially a
period of economic plenty, which was followed by a period of severe economic crisis. The
current report delineates the extent of any progress with integration, both within the region, and
within the broader railway market of the EU. It also aspires to provide a new benchmark for the
prospective Western Balkan Transport Community Treaty. This treaty aims to help to accelerate
the integration of transport systems and to harmonize rules on safety, environmental protection
and services. The set of 10 countries in the new report includes those in the 2005 Report, together
with Bulgaria, Romania, and Turkey. Bulgaria and Romania joined the EU on January 1, 2007
and have made considerable progress in regard to railway reform. Their inclusion provides
interesting, and in some cases salutary, lessons for the other countries in the region. Finally, the
report also includes Turkey is not only an EU candidate country and therefore moving towards
compliance with the EU rail acquis, but an increasingly important economic origin and
destination for the region itself, and for the broader markets of the EU.
12. Apart from the differences in where they are with regard to EU accession, the ten countries
included in the report vary considerably when it comes to their rail sectors. A first difference
consists of size: (i) Bulgaria, Romania, and Turkey have larger rail networks with significant
opportunities; (ii) Croatia and Serbia have medium size networks; and (iii) Albania, Bosnia and
Herzegovina, FYR Macedonia, Kosovo, and Montenegro have small networks. An additional
difference between the countries is that Bulgaria and Romania have large private rail freight
operators, which means that developments in the rail sector reflect the performance of both state
and private rail undertakings. In the other countries, the state incumbents retain their monopoly
over rail transport services. In the case of Bulgaria and Romania, traffic developments are
assessed with regard to total traffic volumes, but the focus on the functioning of the rail
undertakings is on the state rail companies, not the private ones.
Figure 4: Quality of Rail Infrastructure (2009-2010)
Note: Ranking out of 116 countries.
Source: World Economic Forum.
21 2228
33 3643
48 4954
62 6368 70
81
93 95
109
Slo
vak
ia
Cze
ch R
epu
bli
c
Lit
hu
ania
Lat
via
Esto
nia
Hu
nga
ry
Cro
atia
Slo
ven
ia
Bu
lgar
ia
Po
lan
d
Tu
rkey
Mo
nte
negro
Ro
man
ia
FY
R M
aced
on
ia
Ser
bia
BH
Alb
an
ia

Railway Reform in South East Europe and Turkey: On the Right Track? Main Report
21
13. One of the main obstacles facing rail clients in the region is the low quality of rail
infrastructure. Since the 1990s, the annual volume of track renewal works has been much lower
than necessary, and the accumulated backlog imposes speed restrictions on many lines for traffic
safety reasons. Similar backlogs have accumulated in the modernization of telecommunication
systems, signaling systems, power supply, catenaries and interlocking systems. The average age
of rail assets contributes to higher operating and maintenance costs. At the same time, in a
number of countries inadequate funding from the state for maintenance works has contributed to
the declining condition of rail infrastructure. Figure 4 presents the ranking of countries (out of
116 countries) in terms of the quality of rail infrastructure from the World Economic Forum‘s
Global Competitiveness Report 2009-2010. With the exception of Croatia and Bulgaria, all
countries included in the report are in the bottom half of the ranking—with Serbia, Bosnia and
Herzegovina and Albania among the bottom quarter decile (Figure 4). The poor quality of rail
infrastructure impacts negatively on the global competitive position of economies.
14. This Report aims to enhance the collaboration of the World Bank and the EU in supporting
the reform agenda and improving the financial and operational performance of railways in the
concerned countries. An important input for the legal and institutional reform implementation
aspect of the report are the peer review reports prepared by the European Commission. The
purpose of these peer review reports is to assess reform of the railway sector by country, in
particular, the practical implementation and application of the Community legal framework, i.e.
the EU rail acquis. These reports also aim to evaluate the institutional framework and the
administrative capacity of governments to ensure the successful progress of the restructuring
progress. To date, peer review reports have been completed for Serbia, Croatia, and FYR
Macedonia. These have been supplemented with the European Commission‘s Progress Reports,
which monitor and assess the achievements of each of the candidate and potential candidates over
a 12-month period, and include sections on rail transport policy.
15. In order to assess progress with regard to railway reforms and examine changes in
operational and financial performance since 2005—in light of the recovery of the freight market
and the recent downturn—the report focuses on:
Implementation of the EU rail acquis. A review of countries‘ compliance with the
institutional framework for railway operations, as defined by the EU rail acquis, will also
be undertaken, both from a national as well as a regional perspective. Performance at a
national level will be measured by comparison with a number of pre-defined criteria
based on the EC Directives, including, inter alia: (i) separation of infrastructure from
operations (no progress, accounting separation, full separation); (ii) establishment of
appropriate track access charges and access for international operators; (iii) extent of
regional co-operation; (iv) clear demarcation and independence of regulatory
responsibilities.
Organizational structure. A review of the railway in each of the countries, in terms of
organizational structure and form, institutional context, management structure, degree of
commercial thinking and focus.

Railway Reform in South East Europe and Turkey: On the Right Track? Main Report
22
Operational performance. A review of the operational performance of the state
railways in order to provide a comparative indication of performance. Comparative
performance will be assessed in relation to a number of pre-defined criteria, where
possible. These criteria including: (i) labor productivity per traffic km (freight and
passenger); (ii) average revenue per traffic unit (freight and passenger); (iii) utilization of
locomotives and rolling stock; (iv) rolling stock productivity; and (v) total and active
fleet where available, density (traffic units per route km).
Financial performance. A review of the financial performance of the state railways in
order to provide a comparative indication of performance. Comparative performance will
be assessed in relation to a number of pre-defined indicators. These including: (i) cost
recovery; (ii) viability and working ratios; (iii) labor costs as a proportion of total
revenue; (iv) operating revenues as a proportion of total costs; (v) recurrent subsidy as a
proportion of total costs; and (vi) type and extent of subsidy by traffic type (data
availability permitting).
Evaluation of operational performance along selected rail corridors. A review of
corridor performance for Corridor IV (Romania, Bulgaria, and Turkey) and Corridor X
(Bulgaria, Serbia, Turkey). This focuses particularly on border-crossing points and
border-crossing arrangements, as the former represent the most important source of
delays in rail transit along corridors and one of the main impediments to a rise in transit
and international traffic along rail corridors in South East Europe and Turkey.
16. This Report begins by assessing implementation of the EU legal and institutional
framework and the state of institutional reform in South East Europe and Turkey. It then turns to
a comparative assessment of the operational and financial performance of the rail sector in each
of the 10 countries over 2005-2009, comparing the report countries with the EU-27 benchmark
and three EU countries—Germany, Poland, and Slovenia. The report then moves on to the issue
of rail corridor performance, with a specific focus on improving the institutional and regulatory
environment at border-crossing points, before offering some conclusions. The first annex focuses
on the performance of the incumbent state-owned railways of South East Europe and Turkey in
much greater detail.

Railway Reform in South East Europe and Turkey: On the Right Track? Main Report
23
PROGRESS IN INSTITUTIONAL REFORM
INTRODUCTION
17. The rail liberalization process in the EU was formally initiated by a series of directives
issued in 1991 and 1995 (see Box 1 for a summary). Since that time, the EU has progressively
built a large body of legislation that focuses on: (i) the gradual opening of the rail market by
regulating access to the infrastructure and interoperability of the European rail network; (ii)
separation of infrastructure from transport operations; and (iii) a common approach on rail safety.
This body of legislation includes a diversity of acts, which are binding on all member, accession
and applicant countries unless specific derogations have been agreed.
18. In 1996, the EU White Paper on the rail sector highlighted the need for more pronounced
reform to give the rail sector a chance of success in the European internal market—particularly
vis-à-vis the road sector.5 The first railway package presented by the Commission in 1998
focused on the shortcomings of Directive 91/440/EEC and was comprised of three Directives.
Implementation of the directives creates an institutional framework allowing any rail undertaking
that has been licensed in accordance with EU criteria to have access to rail infrastructure on fair,
non-discriminatory terms to offer pan-European services, starting with international freight
services on the trans-European rail freight network.
19. The 2001 White Paper on European transport policy highlighted the need for continuous
reforms to make the European railway area a reality.6 The second railway package was proposed
by the European Commission in January 2002, and adopted in April 2004. It called for more
extensive opening up of the freight market, a directive on railway safety, a regulation establishing
a European Railway Agency, and other measures to speed up interoperability between the
national networks. The European Commission put forward new proposals in March 2004, aimed
at liberalizing the international passenger transport market by 2010, as well as measures aimed at
certification of on-board staff and passenger rights. The European Parliament endorsed these
proposals in September 2005, and political agreement was reached in the Council on December 5,
2005.
20. In 2006, the European Commission prepared a report on the implementation of the first rail
package.7 The latter consists of three Directives of the European Parliament and the Council
(2001/12/EC, 2001/13/EC and 2001/14/EC), which are closely interlinked and which were due to
be transposed by the EU member states no later than March 15, 2003 and by the then 8 new
member states which had a rail system by May 1, 2004—the date of their accession to the EU.
The 2006 Report summarizes the main aspects of the reforms envisaged:
5 European Community (1996), White Paper: A Strategy for Revitalising the Community‘s Railways, COM
(96) 421, Brussels, July 30, 1996. 6 European Commission (2001), White Paper: European Transport Policy for 2010: Time to Decide, COM
(2001) 370 final, Brussels, September 12, 2001. 7 European Commission (2006), Report from the Commission to the European Parliament, the Council, the
European Economic and Social Committee and the Committee of the Regions on the Implementation of the
First Railway Package, COM (2006) 189 final, Brussels, May 3, 2006.
Railway Reform in South East Europe and Turkey: On the Right Track? Main Report
24
Separation of accounts for rail transport services and infrastructure management,
with an additional distinction being made—in the case of the accounts for the
supply of transport services—between those related to passenger transport and
those concerning freight. Cross-subsidization is to be avoided.
Separation between essential functions, these being capacity allocation, charging,
licensing and the monitoring of public service obligations as regards transport
activities. The aim is to ensure that the infrastructure manager acts neutrally in
allocating capacity and charging for infrastructure use—in particular where the
separation of functions is not guaranteed by means of institutional separation.
Access to infrastructure must be transparent and non-discriminatory.
Establishment of an independent regulatory body to monitor the rail market and
to act as an agency to settle disputes between the infrastructure manager and rail
undertakings. This body must have human, financial and administrative resources
on a sufficient scale to enable it to play an active part in market supervision.
Infrastructure access rights, including access rights to the necessary services,
granted on a fair and non-discriminatory basis to all railway undertakings that wish
to offer international freight services on the trans-European rail freight. The
European Commission encouraged the gradual introduction of standard contracts
between the infrastructure manager and rail undertaking to facilitate access.
Introduction of an infrastructure charging system based on the marginal cost
principle, with mark-ups under certain circumstances. To attain the objectives of
the first railway package, it is important to avoid cross-funding between freight
trains and passenger trains through the infrastructure charging system.
Harmonized conditions for the granting of licenses for rail undertakings which
are valid throughout the EU. While the costs and periods of time involved in
obtaining these licenses may vary from one member state to another, greater
transparency regarding the conditions to obtain a license is necessary.
21. The 2006 Report argued that formal transposition of the first rail package had been delayed
and had not led to new entrants in the rail sector in a number of EU member states. In other
words—apart from delays in transposition—the fact of formally transposing the directives did
not automatically lead to enhanced competition in the rail sector or to positive developments in
the rail sector in general, in terms of reversing the decline in modal share. This is an important
point to keep in mind. Although the first step is the transposition of directives in order to ensure
compliance with the EU rail acquis, this in and of itself will not lead to the expected increase in
passenger and freight rail traffic or increased competition between rail undertakings, if secondary
legislation is not put in place, and if national rail incumbents continue to act in ways that hinder
non-discrimination and free competition. A second report on developments in the EU rail sector
found that while all member states had transposed the directives contained in the First Rail
Package, there was incorrect transposition in 24 of the 27 member states.8
8 European Commission (2009), Report from the Commission to the Council and the European Parliament,
Second Report on Monitoring Development of the Rail Market, COM (2009) 676 final, Brussels,
December 18, 2009.

Railway Reform in South East Europe and Turkey: On the Right Track? Main Report
25
Box 1: Summary of Key EU Directives in the Rail Sector
The European Commission initiated a revolution in the railway industry in Europe by adopting, in a step-by-
step approach, a number of directives to amend the regulation of rail transport. By tradition, the national
railway companies were, to a large extent, self-regulated entities, playing simultaneously the roles of
business units, state regulators and supervisory authorities. The new approach has fundamentally changed the
rules of the game as the legal framework is now largely defined by European law.
The turning point in the development of the railway sector in Europe was the adoption of Directive
91/440/EEC. It created a new legal framework ending the status of a railway as a state-owned monopoly and
establishing a European railway market. New principles were established for the sector: (i) accounting
separation between rail infrastructure and train operators; (ii) public money for one sector cannot be used to
cross-subsidize the other; (iii) the railways must be managed on a commercial basis, driven by market
demand, and independent from the state; and (iv) mandatory non-discrimination in access to railway
infrastructure. The member states were also required to address the problem of the historical debt of the
railway companies and to take all necessary measures to develop the national railway infrastructure. This
directive was complemented in 1995 by Directive 95/18/EC on the licensing of railway undertakings and
Directive 95/19/EC on the allocation of railway infrastructure capacity and the levying of charges.
Based on the implementation of Directive 91/440/EEC, in 2001 the EC issued the First Railway Package to
be implemented by the member states by March 15, 2003. The components of the First Railway Package
were: (i) Directive 2001/12/EC amending Directive 91/440/EEC, (ii) Directive 2001/13/EC amending
Directive 95/18/EC, and (iii) Directive 2001/14 for infrastructure capacity allocation and charging, and safety
certification. The First Railway Package was the first step in liberalizing the railway sector through the
introduction of open access on the Trans-European Rail Freight Network (TERFN) (representing 50 percent
of EU railway networks and 80 percent of traffic).
A lack of interoperability was, and remains, a major constraint in implementing open access in Europe, with
specific national norms for signaling, electrification, and operation forming significant barriers to a seamless
railway transport market. As a consequence, the EC acted to eliminate technical barriers by issuing Directive
96/48/EC for the interoperability on trans-European high speed rail system, and Directive 2001/16/EEC for
interoperability on the trans-European conventional rail system.
On January 23, 2002, the EC proposed the Second Railway Package to open both national and international
freight services on the entire European network from January 1, 2007. The Second Railway Package also
enhanced safety and interoperability, primarily by establishing the European Railway Agency (ERA) to
oversee technical standards on these matters. The components of the Second Railway Package are: (i)
Directive 2004/51 further amending Directive 91/440/EEC; (ii) Directive 2004/49/EC—the safety directive;
(iii) Directive 2004/50/EC amending interoperability Directives 96/48/EC and 2001/16/EC; and (iv)
Regulation 881/2004—the European Railway Agency. Full market liberalization for freight transport in
Europe implemented since January 2007 was an important achievement of the reform process.
On October 23, 2007, the Third Railway Package was issued, having as its main goal the complete
liberalization of the railway market by including regulation of passenger services in Europe. The Third
Railway Package stipulates the obligation for opening the market of international passenger transport starting
on January 1, 2010 (with exceptions for some member states until 2012) and the protection of the rights of
rail passengers. The components of the Third Railway Package are: (i) Directive 2007/58 amending Directive
91/440/EEC and Directive 2001/14/EC; (ii) Regulation (EC) 1371/2007 on rail passenger‘s rights and
obligations; and (iii) Directive 2007/59/EC on the certification of train drivers operating locomotives and
trains on the railway system in the Community. More details on each package can be found in Annex 2.
Source: World Bank.

Railway Reform in South East Europe and Turkey: On the Right Track? Main Report
26
22. This report includes two sets of countries, EU member states and countries aspiring to join
the EU, with the latter group being subdivided between candidate and pre-accession countries. In
the case of Bulgaria and Romania, progress with implementation of the EU rail acquis must focus
not exclusively on the formal transposition of EU rail directives—a requirement for EU member
states—but on issues raised by the European Commission regarding correct implementation and
on the actual transformation of the rail sector after the adoption of the EU rail acquis.
Implementation of the EU legal framework for the rail sector in Bulgaria and Romania should be
compared with implementation in other EU member states, in order to assess where these two
countries stand in terms of reforms in the rail sector.
23. For the non-EU member states, with the exception of Turkey, the remaining seven
countries are members of the South East Europe Transport Observatory (SEETO). SEETO is the
regional transport organization established by the Memorandum of Understanding for the
development of the Core Regional Transport Network (MoU) signed on June 11, 2004 by the
Governments of Albania, Bosnia and Herzegovina, Croatia, the former Yugoslav Republic of
Macedonia (FYR Macedonia), Montenegro and Serbia and the United Nations Mission in Kosovo
and the European Commission. An Addendum to the Memorandum of Understanding on the
Development of the South East Europe Core Regional Transport Network was signed on
December 4, 2007, with the aim of enhancing regional cooperation in the South East European
Railway Transport Area.9 The Addendum concentrates, more particularly, on improving rail
market access, on opening the national market, on facilitating border-crossings and on ensuring a
high level of technical interoperability between the partners (Box 2).
24. The Addendum to the MoU serves as a guide to rail reform for regional signatories, as
these countries agreed to gradually aligning their domestic rail legislation with EU rail law.
Signatory countries committed to adopting and implementing domestic legislation and
restructuring their railway sector focusing on: (i) institution building; (ii) separation, management
independence and market orientation of railway undertakings; (iii) fair conditions for access,
safety and interoperability; (iv) financial stability and transparent involvement of governments;
(v) border-crossings; and (vi) social dimension.
25. The Addendum also allows for the European Commission to organize peer reviews to
assess progress with regard to the objectives of the Addendum. More recently, during the Fourth
Annual Meeting of Ministers on the Development of the South East Europe Core Regional
Transport Network held on December 4, 2008, SEETO countries adopted the Timetable for the
implementation of the Addendum of the MoU on the Development of the Core Regional
Transport Network regarding the South East Europe Railway Transport Area.10
This timetable
recognizes that special attention needs to be paid to effective implementation, and not only the
adoption of primary laws in line with the EU rail acquis.
9 The Addendum can be found at:
http://ec.europa.eu/transport/rail/doc/third_countries_2007_mou_seeto_addendum.pdf 10
The conclusions on the implementation of the MoU and the annex with the timetable can be found at:
http://ec.europa.eu/transport/rail/doc/2008_12_04_4th_meeting_conclusions.pdf

Railway Reform in South East Europe and Turkey: On the Right Track? Main Report
27
Box 2: Addendum to the MoU on the Development of the SEE Core Regional Transport
Network
An Addendum to the Memorandum of Understanding on the Development of the South East Europe
Core Regional Transport Network was signed on December 4, 2007. Its objective is to establish and
implement the legal and institutional framework for a gradual market-opening of rail transport in SEE
based on achievement of the following targets:
Target 1: Effective regulatory institutions for the rail sector
a) To establish independent and competent public institutions and foster their cooperation across
borders; to establish administrative and judicial appeal procedures; to establish railway
licensing bodies responsible for issuing licenses to railway undertakings in a competitive
market;
b) To establish regulatory bodies in charge of allocating railway infrastructure capacity and
levying charges for the use of railway infrastructure, and of safety certification;
c) To establish safety authorities responsible for issuing safety certificates to all railway
undertakings; and
d) To accept notified bodies for implementing the procedures involved in assessing conformity
with or suitability regarding European interoperability norms.
Target 2: Separation, management independence, and market orientation
To prepare for a competitive rail market providing high-quality rail services by separating
infrastructure management and provision of transport services, including separate financial accounts; to
grant management independence to both activities in a business-oriented environment.
Target 3: Access to the market, interoperability and railway safety
To define and implement harmonized rules and procedures governing the operation of railway
transport in an open market; to maintain the existing high level of interoperability, and develop it in
line with the EU‘s interoperability legislation; to manage rail safety on the basis of safety targets and
safety management systems.
Target 4: Financial stability and transparency
To put railways on a financially sound basis; to place relations with public authority on a contractual
basis, whereby obligations for passenger transport and infrastructure provision are duly compensated,
subject to compliance with performance standards that are defined in advance and subject to
monitoring.
Target 5: Facilitate border-crossing
To reduce delays at borders involving all actors (mainly the railways, but also the various public
authorities); to revise bilateral border-crossing agreements, bringing them into line with EU legislation.
To remove discriminatory practices with regard to foreign or new-entrant railway undertakings.
Target 6: Social dimension and social dialogue
To monitor working conditions and the social and employment impact of implementing the South East
European Railway Transport Area. To reinforce the social dimension, namely by referring to the
existing EU provisions governing workers‘ fundamental rights, labor laws, health and safety issues at
work, and equal opportunities. To involve the social partners by promoting social dialogue in relation
to monitoring and implementation of the South East European Railway Transport Area and its effects.
The Addendum then presents a list of measures to be implemented in order for signatories to gradually
align their domestic railway legislation with EU rail law.
Note: Available at http://ec.europa.eu/transport/rail/doc/third_countries_2007_mou_seeto_addendum.pdf.
Source: SEETO.

Railway Reform in South East Europe and Turkey: On the Right Track? Main Report
28
26. The timetable breaks down implementation into six steps: (i) primary law adopted and in
effect; (ii) secondary law adopted and in effect; (iii) budgetary and financial framework
established; (iv) institutional and organizational arrangements established; (v) staff in office in
sufficient number and competence; and (vi) operational decisions issued and/or published. The
level of detail recognizes that in the past legislation has been adopted, but has never become
operational. The SEETO timetable refers to the implementation of the Addendum to the MoU to
target times when measures are to be made operational. The target time for implementation of the
reform process is 2010 for the region as a whole (Table 2), but has been missed in most cases.
The table does not include the details on the six preliminary steps, but only presents a summary of
key target dates, without going into the detailed measures required for each addendum item
number.
Table 2: Timetable for Implementation of Addendum to MoU (December 2008)
Source: SEETO.
27. This chapter is structured as follows: It will begin by reviewing the implementation of the
legal and institutional rail framework in Bulgaria and Romania—countries that joined the EU on
January 1, 2007—and Turkey. Then it will turn to the SEETO countries. It will do so by
reviewing documentation submitted by rail authorities, as well as information in EU reports on
implementation of the first rail package and EU peer review reports where available. The focus
will not only be on formal and correct transposition of the EU rail directives, but on ‗effective
implementation‘, as defined by the SEETO Annex to the Conclusions on Implementation of the
MoU until the end of 2008, including staffing and budgeting issues. This means that
implementation of the EU rail legislation will not only assess adoption of primary laws, but also
effective implementation.
Adddendum
Item NumberMeasure Albania
Bosnia and
HerzegovinaCroatia
FYR
MacedoniaMontenegro Serbia Kosovo Region
2.1 Institution Building Jun-2009 2008 Dec-2009 Jun-2009 Jul-2009 2006 Feb-2010 Feb-2010
2.2
Separation, management,
independence and market
orientation
Jun-2009 Feb-2009 Mar-2008 Feb-2008 Sep-2008 2010 Apr-2010 Apr-2010
2.3
Fair infrastructure access,
safety, and
interoperability
2010 2010 - Dec-2010 2010 2010 Dec-2010 Dec-2010
2.4 Financial stability Jan-2009 2009 Jan-2007 Jan-2009 Jan-2009 2010 Dec-2009 2010
2.5 Border crossing N/A 2009 - Jun-2009 Dec-2008 2010 Jun-2009 2010
2.6Social dimension and
social dialogueJan-2009 2008 - Dec-2009 2009 2010 2003 2010

Railway Reform in South East Europe and Turkey: On the Right Track? Main Report
29
BULGARIA AND ROMANIA
28. On January 1, 2002, the new Bulgarian Railway Transport Act entered into force, passed by
the National Assembly of the Republic of Bulgaria.11
This split the National Company Bulgarian
State Railways into two separate enterprises—a rail undertaking, Bulgarian State Railways EAD
(Bâlgarski Dârzhavni Zheleznitsi; BDZ EAD), and an infrastructure manager, National Railway
Infrastructure Company (NRIC). In 2007, BDZ EAD was reorganized as a holding structure, with
three subsidiaries as legal independent companies along three lines of business—freight,
passenger, and traction—all 100 percent owned by the holding company, which in turn remains
fully owned by the Bulgarian state. These changes eliminate the possibility of cross-subsidies
between freight and passenger services, enhance accounting transparency, and establish a
contractual basis for the relationship between the parent company and subsidiaries. In the future,
a restructuring plan envisages the traction subsidiary merging with the parent company BDZ
EAD.
29. These changes have galvanized the freight market—at present the Bulgarian Railway
Company (BRC), Bulmarket, Gastrade, Unitranscom, DB Schenker Rail Bulgaria, and Express
Service have all obtained licenses to operate in Bulgaria. While external rail undertakings have
open access to the commercial rail passenger transport market, this is not financially attractive, as
state-regulated ticket prices do not cover costs of operation. This explains why BDZ Passenger
remains the only operator for passenger rail services, despite liberalization. Following a
government decision in July 2009, BDZ will remain the country's public passenger railway
carrier for the next 15 years—because it was the only company bidding for the public service
contract. However, as of 2012, foreign railway companies meeting the EU requirements will also
be allowed to transport passengers and freight in Bulgaria.
30. The Railway Administration Executive Agency functions as a regulatory authority in rail
transport and a national authority on safety in rail transport. As a regulatory body, it: (i) controls
access to rail infrastructure and implementation of the public service obligation; (ii) verifies the
implementation of the requirements for issuing licenses and permits; (iii) collects fees for issuing
licenses and permits; (iv) issues qualification documents to rail transport personnel, keeps records
and collects statistics data on activities in rail transport; (v) develops and provides the Minister of
Transport draft legislation in the field of railways; (vi) carries out supervisory responsibilities in
this law, including the introduction into service of structural subsystems of the railway system;
and (vii) suggests to the Minister of Transport measures to prevent and overcome the
consequences of disasters and accidents affecting rail infrastructure. The regulatory body‘s
activities are financed through fees for licenses and permits, funds from fines and penalties, and
its own revenue. The Railway Administrative Executive Agency also acts as the notification
authority.
11
Promulgated in the State Gazette (SG), No. 97/00 of 28 November 2000; amended, SG, No.47/02 of
10 May 2002; amended, SG No. 96/02 of 11 October 2002; amended, SG No. 70/04 of 10 August 2004;
amended, SG No. 115/04 of 30 December 2004; amended SG No.77/05 of 27 September 2005; amended,
SG No. 88/05 of 4 November 2005; amended SG No. 36/06 of 2 May 2006; amended, SG No.37/06 of
5 May 2006; amended, SG No.62/06 of 1 August 2006; amended, SG No.92/06 of 14 November 2006.

Railway Reform in South East Europe and Turkey: On the Right Track? Main Report
30
31. Bulgaria has created the legal framework for a liberalized rail market and transposed the
first and second rail packages into national law. Vertical unbundling of services separating
infrastructure from rail transport services took place in 2002—track access charges were
introduced, and public service contracts were signed. The first public service obligation (PSO)
contract covered the period 2004-2009 and was signed between BDZ Passenger and the state.
Since January 2007, open access for national rail undertakings to both the national rail freight
transport market and the commercial rail transport has been regulated by law. While the legal
framework is generally in line with the EU rail acquis, the European Commission formally
warned Bulgaria in May 2010 for failing to implement the EU rail directives with regard to track
access charges.
32. Romania began reforming the rail sector in 1998, following Ordinance 12/1998 which split
the then incumbent SNCFR into five companies. The three most important of these companies are
CFR Infrastructure (infrastructure manager), CFR Marfa (rail freight operator), and CFR Calatori
(rail passenger operator).12
These joint stock companies are still wholly owned by the state,
although CFR Marfa is scheduled to be privatized in 2011. There is full institutional separation
between infrastructure and transport services on the one hand, and between passenger and freight
rail services on the other. Romania transposed the requirements of Directive 2004/51/EC into
national law through Ordinance 155/2005, which gives both domestic and foreign rail freight
operators the right to access the Romanian rail network.13
Article 15(2) of Ordinance 12/1998
allows foreign rail passenger operators to have access to the Romanian network, while Article
5(2) of the ordinance states that rail passenger operators can obtain access to passenger transport
services under public service contracts through tender procedures.
33. The Railway Supervision Council, which is part of the Romanian Ministry of Transport,
Construction, and Tourism, acts as the regulatory body as defined in Directive 2001/14/EC. It is
an ad hoc commission that meets when complaints are filed by rail operators. The structure,
competencies, and responsibilities of the Railway Supervision Council are detailed in Article 30
of Ordinance 89/2003 and in Government Decision No. 812/2005.14
The main tasks of the
regulatory authority are the following: (i) examination of the network statement; (ii) monitoring
the train path allocation process and results; (iii) examination of the infrastructure access charging
system; (iv) examination of the infrastructure charges; and (v) examination of the issuing of
safety certificates and compliance with safety regulations. Decisions of the regulatory authority
are binding and can only be revoked by a court—and as per Government Decision No.812/2005,
it can impose fines.
34. The Romanian Railway Authority (AFER) is responsible for issuing safety certificates,
licenses, and rolling stock homologation. The Romanian Railway Licensing Body (RRLB) is part
of AFER and is the body responsible for licensing. Following Order of Transportation Minister
No. 535/26.06.2007, licenses are valid for an indefinite period of time and verification is done
12
CFR stands for Căile Ferate Române (Romanian Railways). 13
This section on Romania is largely based on the analysis taken from IBM Global Services (2007) Rail
Liberalisation Index 2007. Market Opening: Comparison of the Rail Markets of the Member States of the
European Union, Switzerland and Norway. A study conducted by IBM Global Business Services in
collaboration with Professor Christian Kirchner, Humboldt University, Berlin. Brussels: October 17, 2007. 14
IBM Global Services (2007), ibid.

Railway Reform in South East Europe and Turkey: On the Right Track? Main Report
31
every two years—the licensing itself is legally prescribed to 30 days. The Romanian Railway
Safety Authority (RRSA) is also part of AFER, and is the institution responsible for issuing
safety certificate and for homologation of rolling stock, following Ordinance 55/2006. Part A of
Safety Certificates and homologation certificates issues by other EU member states are
recognized.
35. CFR Infrastructure is a member of RailNetEurope (RNE), and information on train paths
can be found through RNE‘s one-stop-shop. The infrastructure manager publishes its network
statement in English. Ordinance No.89/2003 governs train path regulation. Article 6 of Directive
2001/14/EC requires member states to lay down conditions so that—under normal business
conditions and over a reasonable time frame—the financial accounts of an infrastructure manager
shall at least balance income from infrastructure charges, surpluses from other commercial
activities and state funding on the one hand, and infrastructure expenditure on the other. In
practice however, CFR Infrastructure suffers from structural financial deficits, and has been
unable to break even in the last five years. In turn, this impacts on the low levels of investment
per track km in Romania. As the European Commission noted in its 2009 report on the rail
market, the new EU member states—the EU-12—spend about five times less funds for the
maintenance of railway lines on a km basis than the EU-15 countries.15
36. The practical experience of passenger and freight rail liberalization has been contrasted.
Transport contracts for rail passenger services under a public service contract are renewed every
four years and are awarded on the basis of public invitations to tender—although to date CFR
Calatori has always won such tenders. There are three active rail passenger operators offering
services on secondary lines rented out by the incumbent, although their market share is very
small—1.2 percent in 2006. The commercial passenger service market segment has not developed
significantly in recent years, because it must compete with services provided under the public
service contract, and is therefore not financially attractive to potential rail undertakings. Rail
freight liberalization has been very successful to date. There are over 24 rail freight operators
since the opening of the market, with a very significant and growing market share. In 2009,
private rail freight operators held 42 percent of the market, and this share has been rising sharply
in recent years. This is a concrete illustration of the successful liberalization of the freight market
and the implementation of Directive 2004/51/EC.
37. The financial performance of CFR Calatori, CFR Marfa, and CFR Infrastructure has been
poor in recent years. Article 4 of Directive 2001/12/EC requires EU member states to take
measures to ensure that the management, administration and internal control over administrative,
economic and accounting matters of railway undertakings have independent status. While this is
formally the case in Romania, in practice, corporate governance in these state-owned companies
suffers from a series of shortcomings that adversely affects operational and financial performance
and the ability to make autonomous decisions. An absence of strategic vision and commercially-
skilled guidance by their boards—which are overwhelmingly dominated by transport ministry
career officials—has prevented the rail companies from making difficult decisions to improve
15
European Commission (2009), Report from the Commission to the Council and the European Parliament,
Second Report on Monitoring Development of the Rail Market, COM(2009) 676 final, Brussels, December
18, 2009.

Railway Reform in South East Europe and Turkey: On the Right Track? Main Report
32
efficiency and has contributed to a long-term decline in the three companies‘ key performance
indicators. These companies often do not have sufficient autonomy for making important
business decisions—for example, concerning the politically sensitive issue of redundancies—
because the state, through company board membership, can actively guide key policy decisions.
Corporate governance could be strengthened by the nomination of smaller but more professional
and more independent boards of directors.
38. To put progress with the implementation of the legal and institutional framework in
Bulgaria and Romania into an international perspective requires a comparison being made with
other EU member states. In 2009, the European Commission prepared a second report on
developments of the rail sector in the EU.16
It found that although all 27 EU member states had
transposed the directives contained in the First Rail Package, incorrect transposition was an issue
for a number of them, leading the European Commission to send out letters of formal notice to 24
EU countries in June 2008 and reasoned opinions to 21 of them in October 2008. Accompanying
the second report is a working paper providing extensive details regarding developments in the
rail sector. 17
Annex 3 of the working paper provides an overview of infringement procedures
concerning Directives 1991/440/EEC and 2001/14/EC, as of October 2009. In the case of
Romania, it found that: (i) the railway regulatory body—the Railway Supervision Council—was
insufficiently independent from the incumbent rail undertaking and/or the infrastructure manager;
and (ii) the regulatory body is part of the same ministry—the Ministry of Transport, Construction
and Tourism—that performs controlling rights in the state rail undertaking.18
To put this in
perspective, it should be noted that the lack of independence of the rail regulatory body was also
found to be an issue in Denmark, France, Greece, Italy, Lithuania, Luxembourg, Slovenia, and
Spain.
39. Although Bulgaria was not listed in Annex 3 of the second rail report, the European
Commission sent out a letter of formal notice to Bulgaria in June 2008 concerning lack of full
implementation of the First Rail Package. The outstanding issue was the system of track access
charges, which should be set, in principle, at the cost that is directly incurred as a result of
operating the train service.19
Bulgaria modified its method of calculating track access charges
following the formal notice. However, the European Commission found in 2010 that the
Bulgarian infrastructure manager did not implement a methodology for the calculation of charges
that complies with the EU rail directives, and sent on May 5, 2010 a reasoned opinion regarding
this issue. On June 24, 2010 the European Commission decided to take legal action against the
following 13 member states for failing to fully implement the First Rail Package: Austria, Czech
Republic, Germany, Greece, France, Hungary, Ireland, Italy, Luxembourg, Poland, Portugal,
16
European Commission (2009), Report from the Commission to the Council and the European Parliament,
Second Report on Monitoring Development of the Rail Market, COM (2009) 676 final, Brussels,
December 18, 2009. 17
European Commission (2009), Commission Staff Working Document accompanying document to the
Report from the Commission to the Council and the European Parliament, Second Report on Monitoring
Development of the Rail Market, SEC(2009) 1687, Brussels, December 18, 2009. 18
In February 2011 the Romanian government announced that it would transfer the railway sector
supervision body from the Ministry of Transport to the Competition Council, in order, to avoid an
infringement procedure from the European Commission. Romania was supposed to ensure the supervision
body‘s independence by the end of September 2010. 19
European Commission (2010), Rail transport: Commission warns Bulgaria over lack of implementation
of the ‗first rail package‘, IP/10/509, Brussels, May 5, 2010.

Railway Reform in South East Europe and Turkey: On the Right Track? Main Report
33
Slovenia and Spain—excluding both Bulgaria and Romania.20
In the opinion of the European
Commission, the most frequent reason for failure to implement the first rail package was due to
‗not sufficiently ensuring the independence of the rail infrastructure manager, through inadequate
implementation of the provisions concerning rail access charging and/or due to a failure to set up
an independent regulatory body‘, with the emphasis being on the word independent.
40. Another way of putting the performance of Bulgaria and Romania in perspective with
regard to rail liberalization is to refer to a report conducted in 2007 by IBM Global Business
Services.21
The Rail Liberalisation Index presents information on the relative degree of market
opening in the European rail transport markets within the EU-27 and also includes Norway and
Switzerland, as observed in May 2007. The study provides information on the progress of rail
liberalization and represents a benchmark for the legal and practical market access barriers seen
from the viewpoint of an external rail undertaking seeking access. According to their scores,
countries are classified into three groups: Advanced (800 to 1000 points), On Schedule (600 to
799 points), and Delayed (300 to 599 points). The maximum score is 1000 points. Although three
years old, the Rail Liberalisation Index provides a relevant and timely overview of progress on
opening the rail market in the EU.
41. The liberalization (LIB) index is composed of two sub-indices: a legal access index (LEX)
with a weight of 20 percent, and a practical access index (ACCESS) with a weight of 80 percent.
Within the LEX Index, the subject area regulation of market access (45 percent) has been
evaluated with the greatest weight, followed by powers of the regulatory authority (30 percent)
and organizational structures of the incumbent (25 percent). The ACCESS Index analyses,
evaluates, compares and aggregates the practical market access conditions of the individual
countries. It includes practical access conditions, such as barriers to information (5 percent),
administrative and operational barriers (70 percent) and, in particular, the share of the market that
is accessible to external rail undertaking (25 percent).
42. In 2007, rail liberalization was more advanced in Bulgaria and Romania than in some of the
EU-15 member states, even if both countries became EU member states at the start of that year.
Figure 5 presents the results of the 2007 rail liberalization index, with both Romania and Bulgaria
doing better than some of the large EU-15 countries and classified as ―on schedule‖ in terms of
rail reforms, in contrast to Luxembourg, France, Greece and Ireland which are in the ―delayed‖ or
laggards group. In terms of the legal access index, Romania scores quite high, with 822 points,
while Bulgaria scores higher than Spain, Switzerland or France, to name just a few countries.
20
European Commission (2010) Rail services: Commission legal action against 13 Member States for
failing to fully implement first railway package. Press release IP/10/509, Brussels, June 24, 2010. 21
The third edition of the Rail Liberalisation Index was published in 2007 and, as the first two editions of
December 2002 and May 2004, has been conducted by IBM Global Business Services for and on behalf of
Deutsche Bahn AG. The new framework conditions for the European rail transport market that have been
implemented now since January 1, 2007, in particular the complete liberalization of the rail freight
transport market and the enlargement of the European Union by the accession of Bulgaria and Romania,
made it necessary to update the Rail Liberalisation Index, which subsequently took place between May and
August 2007. Further information can be found in the study Rail Liberalisation Index 2007 from IBM
Global Business Services in collaboration with Prof. Christian Kirchner (Berlin Humboldt University) at http://www.deutschebahn.com/site/bahn/en/press /information__material/rail__liberalisation__index2007.html.

Railway Reform in South East Europe and Turkey: On the Right Track? Main Report
34
This suggests that implementation of the legal and institutional regime is quite advanced in the
most recent EU member states.
Figure 5: Rail Liberalisation Index 2007 (rail freight and passenger transport)
Source: IBM Global Business Services (2007)
43. Market access regimes suggest the importance of analyzing access to the market in
practice, and not simply in terms of legal options available. For example, while tendering
procedures may allow passenger services under a public service obligation, in practice direct
contract awards may be more common. The access index examines: (i) information barriers
(process duration for obtaining information, train path allocation, licenses, safety certificates and
homologation); (ii) administrative barriers (licensing, issuing of safety certificates and rolling
stock homologation; (iii) operational barriers (track access conditions, infrastructure charging
system, other service facilities and services); and (iv) accessible market and the terms and
conditions of contract awards evaluated between January 2004 and May 2007. Overall, the
median score of the access index is lower than the legal index, suggesting practical market access
conditions for non-incumbent rail undertakings are not as advanced as the legal framework would
suggest. In the case of Romania, the practical access index score is 697, considerably below the
legal access index, although it remains in the top 10 countries. Bulgaria scores 635, better than
333
559
574
581
630
636
637
649
650
652
665
676
684
691
698
700
707
722
738
739
757
788
788
809
825
826
827
Ireland
Greece
France
Luxembourg
Spain
Finland
Hungary
Belgium
Latvia
Bulgaria
Slovenia
Italy
Lithuania
Estonia
Norway
Slovakia
Portugal
Romania
Czech Republic
Poland
Switzerland
Austria
Denmark
Netherlands
Sweden
Germany
Great Britain
Ad
van
ced
On
Sch
edu
leD
elay
ed
Railway Reform in South East Europe and Turkey: On the Right Track? Main Report
35
eight other countries—Belgium, Hungary, Finland, Spain, Luxembourg, France, Greece, and
Ireland. Overall, both Bulgaria and Romania perform well in the rail liberalization front vis-à-vis
a number of EU-15 states.
TURKEY
44. The Republic of Turkey General Directorate of State Railways Administration (TCDD)
operates rail services in Turkey.22
TCDD is a state-economic enterprise affiliated to the Ministry
of Transport with monopoly powers to provide rail services in Turkey. TCDD is organized on a
functional and regional basis and is vertically integrated, with a single set of accounts and no
accounting separation of infrastructure and rail transport operations or services provided under
public service obligation. TCDD owns and operates three affiliated companies responsible for the
manufacture of locomotives, passenger coaches and freight wagons, as well as several ports that
have rail access. The ports are the only part of TCDD that operate profitably, and are cross-
subsidizing rail operations. Given the existing organizational structure, it is difficult to assess the
financial performance and profitability of its constituent parts—particularly for determining
subsidy requirements for rail services. Needless to say, the current legal and institutional
framework governing the rail sector is not at present aligned to the EU rail acquis. The European
Commission‘s 2008 Progress Report noted progress in the preparation of a new rail law, but no
progress with its adoption. It also stressed the importance of ensuring that the new legal
framework is aligned with the EU rail acquis.23
Meanwhile, the 2010 Progress Report states that
rail transport is the only sub-sector where transport policy has shown no progress.24
45. A technical assistance grant provided by the EU to the Turkish Government for the
preparation of two laws started in early 2005.25
This included the preparation of a Railway Law
providing a new legal framework for rail activity and a TCDD Law supporting reorganization
through the separation and eventual privatization of the affiliated companies and ports operations,
and the reshaping of the labor force and the reduction of redundant staff. A commission was
formed within TCDD on January 16, 2008 in order to complete technical work necessary for
drafting of the General Railroad Framework Law and the TCDD Law. The commission reviewed
the draft laws prepared, consultative discussions were held with various public institutions to
solicit views, and various models were discussed on the structure and status that TCDD may have
at the end of the restructuring process.
46. The TCDD commission envisages the creation of a railroad regulatory authority and safety
authority within the Land Transport General Directorate (KUGM) and a railroad accidents
22
TCDD stands for Türkiye Cumhuriyeti Devlet Demiryolları. 23
European Commission (2008), Turkey 2008 Progress Report, accompanying the Communication from
the Commission to the European Parliament and the Council: Enlargement Strategy and Main Challenges
2008-2009, Commission Staff Working Paper, COM SEC (2008) 2699, Brussels, November 5, 2008, p. 55. 24
European Commission (2010), Turkey 2010 Progress Report, accompanying the Communication from
the Commission to the European Parliament and the Council: Enlargement Strategy and Main Challenges
2010-2011, Commission Staff Working Paper, COM SEC (2010) 1327, Brussels, November 9, 2010, p. 62. 25
See Standard Project Fiche Project number TR 0303.07 available at:
http://ec.europa.eu/enlargement/fiche_projet/document/TR%200303.07%20Turkish%20rail%20sector%20r
estructuring.pdf

Railway Reform in South East Europe and Turkey: On the Right Track? Main Report
36
investigation board (DEKAK)—both under the Ministry of Transport. In the new organizational
structure for the rail sector, TCDD would become the infrastructure manager, continuing to
operate as a public enterprise. A new joint stock company—Turkish Railway Transportation
Corporation, DETAŞ—would be created as a rail undertaking, providing passenger and freight
rail services as a subsidiary of TCDD. The proposed co-location of the regulatory, safety, and rail
accident investigation functions within the Ministry of Transport raises a number of conflict of
interest questions with regard to the independence of essential functions, enshrined under
European legislation. At the same time, the creation of a railway undertaking as a subsidiary of
the infrastructure manager raises similar questions concerning the required level of economic
separation under EU law. For these reasons, development along such lines is a matter on which
Turkey should seek European Commission advice.
47. The new railway framework and TCDD law have not been passed. This means that the
legal basis does not exist for key elements of the EU rail acquis, including the accounting
separation of infrastructure and operation and introduction of public service obligation for
passenger train services. Improvements in TCDD‘s financial performance anticipated from
implementing the new laws cannot be achieved without these being passed. Many services and
lines, in addition to those subsidized, would not be operated if TCDD were functioning on a
commercial basis. Similarly, necessary staff reductions depend on legal provisions for TCDD to
be able to offer incentives for early retirement and voluntary departures. There is a general
consensus that TCDD‘s financial and operational performance requires structural changes—in
particular a commercial structure—that would create incentives and opportunities to increase
traffic and productivity.
48. The railway commission proposal moves TCDD toward lines of business structure, thereby
improving transparency, and allows for additional organizational change, including the separation
of passenger and freight, which are positive steps forward. However, they stop short of giving the
rail companies commercial legal status, and opt instead for the legal status of a state enterprise,
which would allow subsidies to be paid to infrastructure, passenger and freight—and the latter is
not allowed under EU rules. By contrast, commercial legal status would require the payment of
subsidies through public service contracts, linking subsidy levels to quality of service. As a state
enterprise it will be more difficult to reduce high subsidy levels and increase rail market share.
Corporate governance will be improved if the railways have a commercial legal structure,
creating the right commercial incentives for operating the railways—this will minimize
government involvement in day-to-day management, and should increase the independence of the
board.26
Failure to establish adequate principles of corporate governance have adversely affected
Bulgarian and Romanian rail companies, and there is a risk that this could be replicated in Turkey
with the existing institutional and legal reforms currently on the table.
26
See OECD (2004), OECD Guidelines of Corporate Governance, Paris: OECD and OECD (2005),
Guidelines on Corporate Governance of State-owned Enterprises, Paris: OECD.

Railway Reform in South East Europe and Turkey: On the Right Track? Main Report
37
ALBANIA
49. Albania‘s rail sector is governed by the railway law adopted in 2004.27
According to Article
12 of the code, Albanian Railways (Hekurudha Shqiptare; HSH) is a vertically integrated joint-
stock company, whose assets are fully owned by the state. The law allows for other rail
undertakings, after obtaining the necessary license from the Ministry of Public Works and
Transport (MPWT) —although to date, Albanian Railways is the only operator. At present the
statute governing Albanian Railways does not allow for a holding structure—this would be a first
step toward ensuring the separation of accounts as foreseen by Directive 2001/12/EC and
Directive 91/440/EEC.28
In turn, a change in Albanian Railways‘ statutes would require
amending the railway code. The railway law does not mention institutional arrangements between
the state and the rail sector, and introduction of EU safety regulations would require amendments
to it. In addition, the law does not regulate planning and budgeting, nor does it lay out the relation
between the state and separate railway companies for infrastructure, passenger, and freight.
50. A 2006 government decision relating to the implementation of the stabilization association
agreement with the EU laid out an ambitious agenda for reform.29
This consisted of a series of
measures for the rail sector, including drawing up an action plan to separate the accounts of the
infrastructure manager from transport services by December 2006, and preparing a study on the
institutional separation of infrastructure from transport services by December 2007. A 2007
government decision was approved relating to changing the rail subsidy—this proposed the
conclusion of a public service obligation contract between the Ministry of Public Works,
Transport, and Telecommunications with Albanian Railways, separate accounting for passenger
rail services, the possibility of adjusting tariff in cases where compensation does not cover the full
amount necessary for public service, as well as the separation of infrastructure management from
rail services.30
Restructuring proposals were prepared, but were then put on hold from April 2008
to spring 2009, during which time Albanian Railways was allowed to continue a process of
internal restructuring. Despite the reorganization, the top management structure remains
unchanged, because the statutes of the company have not changed. In terms of reforming the rail
legal and institutional framework in line with the EU rail directives—regulatory bodies,
legislation, financing contracts—work has yet to start. A first draft network statement was
produced in 2009, despite the absence of both a legal basis, and important technical data.
51. The 2009 Albania Progress Report prepared by the European Commission notes limited
progress in the rail sector.31
One positive development has been the Regulation for the Albanian
Railway Authority, which was approved in January 2009, establishing business units for
27
Railway Code of the Republic of Albania, adopted with law No. 9317, November 18, 2004. Official
Gazette No. 95/2004. 28
This section is largely based on European Union‘s CARDS Programme for the Western Balkans (2009b),
Technical Assistance to the Ministry of Public Works, Transport and Telecommunications of Albania in the
Field of Transport. Final Report. Vol. 1 – Main Report. December 2009. 29
Decision No. 46 dated July 5, 2006 on Adoption of the National Plan for Implementation of the
Stabilisation and Association Agreement. 30
Decision No 8 dated February 2, 2007, on the Existing Scheme of the Railway Subsidy. 31
European Commission (2009), Albania 2009 Progress Report, accompanying the Communication from
the Commission to the European Parliament and the Council. Commission Staff Working Document,
SEC(2009) 1337, Brussels, October 14, 2009.

Railway Reform in South East Europe and Turkey: On the Right Track? Main Report
38
passengers, freight, infrastructure management, and maintenance. Progress with the rail action
plan or timetable required by the 2007 Addendum to the Memorandum of Understanding on the
Core Regional Transport Network has been limited; initial deadlines, which assumed
implementation by 2009 or 2010, will not be met. Given the number of changes to the railway
law that would be required to ensure compliance with the First Rail Package and EU rail
directives more generally, the European Commission is financing technical assistance to the
Ministry of Public Works, Transport and Telecommunications. Among its work is the drafting of
a new rail code, which could be approved by the Albanian parliament in 2011 at the earliest. A
2010 European Commission report highlights the need to accelerate efforts to align and
implement the EU rail acquis.32
52. A number of actions are required to further the legal and regulatory framework reform
agenda, as noted in a recent report.33
These include the financial framework for the rail sector,
including the PSO and infrastructure financing, as well as the institutional set-up with the various
regulatory bodies and market opening. Second, Albanian Railways should be transformed into a
holding company to begin with, and eventually be separated in a later phase. Third, there is a
need to develop a passenger service model that would support a given service level for a
reasonable subsidy. Fourth, there should be the introduction of the legal basis for network
statement publication, open access procedures, and eventually harmonization in line with SEETO.
Fifth, concerning infrastructure, there is a need to finalize the restructuring and ownership of
infrastructure, as well as the need to develop a multi-annual plan with the infrastructure manager
based on asset management and project development plans. Last, there is a need to update safety
regulations to bring them in compliance with EU regulations and to set up an infrastructure
register.
BOSNIA AND HERZEGOVINA
53. Reflecting the political structure of Bosnia and Herzegovina, the rail sector legal
framework is governed by a state rail law and two entity rail laws—one for the Federation of
Bosnia and Herzegovina (FBH) and the other for the Republika Srpska (RS).34
The State Law on
Railways of Bosnia and Herzegovina was adopted in 2005. It regulates the overall structure and
operation of railway transport in BH, the conditions and manner of management of the railway
infrastructure, conduct of rail transport, control, supervision, regulatory and appellate functions,
and other issues relevant to the work and functioning of the rail transport system.35
It is consistent
with the relevant EU directives, requiring the separation of transport services and infrastructure
32
European Commission (2010), Analytical Report accompanying the Communication from the
Commission to the European Parliament and the Council, Commission Opinion on Albania‘s application
for membership of the European Union. Commission Staff Working Paper, SEC(2010) 1335, November 9,
2010. 33
European Union‘s CARDS Programme for the Western Balkans (2009), Albanian Railways Network:
Infrastructure and Signaling Improvement Project, TA-ALB-06, Infrastructure Projects Facility in the
Western Balkans. Draft Final Report, Vol 1 – Main Report, November 2009. 34
This section is based in part on Annex 3 of the World Bank‘s Bosnia and Herzegovina: The Road to
Europe, Transport Sector Review, Transport Unit, Sustainable Development Department, Europe and
Central Asia Region, Report No. 54406-BH, May 2010. 35
State Law on Railways of Bosnia and Herzegovina, Official Gazette of Bosnia and Herzegovina,
No.52/05, August 2, 2005.
Railway Reform in South East Europe and Turkey: On the Right Track? Main Report
39
management, the obtaining of a license and a safety certificate to operate, and requires the
establishment of a Railway Regulatory Board (RRB), and the introduction of track access charges
for the infrastructure.36
54. One of the key aspects of the First Rail Package, the separation of accounts to ensure
independence of rail undertakings from infrastructure managers, has not yet happened. In the
FBH, the railway system is operated by one railway company—Željeznice Federacije Bosne i
Hercegovine (ŢFBH), while in the RS, the railway is operated by one company—Željeznice
Republike Srpske (ŢRS). The current rail legislation mandates the split between rail transport
operations and infrastructure management, but this obligation has not been implemented in either
entity. The separation of infrastructure and operations is in progress, and the separation of
accounts for transport and infrastructure, albeit within the same rail company, can be considered a
first step towards the full separation between operations and infrastructure. Neither of the rail
companies meets the preconditions for functioning as vertically separated companies in line with
the EU rail acquis, since independent audits for effective separation between infrastructure
managers and rail undertakings within each company have not been conducted to date. According
to the BH 2010 Progress Report, the separation of operational functions from infrastructure
management in the two vertically integrated companies has yet to be implemented.37
55. The FBH Railway Law issued in 2001 states that the network is open to other operators,
provided that they provide traction, have a license, and pay a fee which is determined by Bosne i
Hercegovine i Bosanskohercegovacke Željeznice Javne Korporacije (BHŢJK), the state-level
coordinating body. Article 15 states that the Government of the FBH or Cantons must pay for
non-profitable transport that may be imposed on ŢFBH.38
The RS Railway Law issued in 2001
states that ŢRS is both the infrastructure manager and operator and the Law states that there is
only one railway infrastructure manager. Certificates are delivered by the RS Ministry of
Transport and Communications—and the RS budget pays for infrastructure maintenance. A law
amending the Railway Law of 2001 was adopted on June 4, 2008. One of the main changes is to
Article 3, which has a new item stating that ŢRS—as the infrastructure manager—shall be
required to submit an application within five years to the RRB for the issue of a permit for
infrastructure management and safety certification. Article 4 has been amended so that the duties
of the railway transport operator and those of the infrastructure manager are clearly separated.
Article 6 has been changed so that that the use of budget funds from the Government of RS shall
be regulated by a contract signed between ŢRS and the Government of RS. At present, ŢFBH
does not operate in the RS, and ŢRS does not operate in FBH—reflecting limited progress in
terms of opening an already fragmented national rail market.
36
The role of BHŢJK is to verify technical standards of infrastructure, while the role of RRB is to
guarantee on a fair basis that rules are applied and respected by all bodies concerned. The RRB is also in
charge of supervising the separation of accounts between operations and infrastructure and between freight
and passenger services. 37
European Commission (2010), Bosnia and Herzegovina 2010 Progress Report, accompanying the
Communication from the Commission to the European Parliament and the Council. Commission Staff
Working Document, SEC(2010) 1331, Brussels, November 9, 2010. 38
According to the 2003 law on railway infrastructure financing and subsidies of passenger and intermodal
transport—Official Gazette of the FBH, No. 57/03—ZFBH contracts on an annual basis contracts on rail
infrastructure maintenance and contracts on subsidizing operations of passenger transport with the Ministry
of Transport and Communications of FBH.

Railway Reform in South East Europe and Turkey: On the Right Track? Main Report
40
56. As noted in the Bosnia and Herzegovina 2010 Progress Report, there has been ―uneven
progress‖ in the field of rail transport policy. The state level Railways RRB was formally
established in 2008 as an administrative organization under the State Ministry of
Communications and Transport, financed by the state budget and with 16 staff. The Second
Railway Package directives on rail safety have been partly implemented through the issuance of
instructions by RBB.39
The estimation of infrastructure costs to facilitate the introduction of a
track access regime remains in the preparation stage. The preparation of a harmonized network
statement remains under preparation, despite the regional work funded by the EU and managed
by SEETO. The required work on train driver certification, interoperability and safety
management systems, all remain at the preparation stage. In addition, an explicit public service
obligation (PSO) contract has yet to be defined, let alone introduced. Coordinated harmonization
of legislation at a state level is needed in order to achieve full interoperability in line with the
Addendum to the MoU on the Development of the South East Europe Core Regional Transport
Network for a South East European Railway Transport Area. The deadlines set out in the
timetable for the implementation of the Addendum to the MoU in Bosnia and Herzegovina will
not be met—most items had 2008 and 2009 deadlines, with the exception of fair infrastructure
access, safety, and interoperability, which have a 2010 deadline.
CROATIA
57. The rail landscape in Croatia was transformed with the Railway Act and Croatian Railways
(Hrvatske Željeznice; HŽ) division law.40
Adopted in 2005, the act on the division of Croatia
Railways created four independent companies—HŢ Transport, HŢ Cargo, HŢ Traction, and HŢ
Infrastructure—coordinated and monitored by a fifth company, HŢ Holding. After the adoption
of the Railway Act, a number of ordinances followed in 2005 and 2006: on railway infrastructure
on conditions and manner of issuing a license for providing railway transport services and a
license for railway infrastructure management, and a decision on classification of railway lines.
The Railway Act is aligned with the First Railway Package. Its objectives are to: (i) reorganize
regulation of rail services; (ii) liberalize the market for rail transport services; (iii) allow for the
establishment of an independent regulatory body; (iv) separate infrastructure from transport
services; (v) allow the establishment of independent rail companies; (vi) set the conditions for
access and establishment of other transport undertakings; and (vii) establish modes of financing
for maintaining rail infrastructure. The functional separation of HŢ Infrastructure and HŢ
Holding is under implementation, based on the amended Railway Act. The rail market is not fully
liberalized, with the market open only to Croatian rail undertakings and rail access to maritime
39
Instructions issued in 2007 and 2008 include (i) Instruction on the procedure and manner of issuing
permits for the railway vehicles, devices, parts and equipment for railway vehicles and devices, parts and
equipment for railway infrastructure (Official Gazette of Bosnia and Herzegovina, No.82/07, October 30,
2007), (ii) Instruction on conditions for issuing license for provision of railway transport (Official Gazette
of Bosnia and Herzegovina, No. 20/08, March 10, 2008), (iii) Instruction on the conditions for issuing and
contents of permits for management of railway infrastructure (Official Gazette of Bosnia and Herzegovina,
No. 20/08, March 10, 2008); and (iv) instruction on the production, use and protection of the seal for the
verification of technical documentation (Official Gazette of Bosnia and Herzegovina, No. 20/08, March 10,
2008). 40
Railway Act (Official Gazette of Croatia No.123/03, No.194/03 and No. 30/04) and the Croatian
Railways Division Law (Official Gazette of Croatia 153/05).

Railway Reform in South East Europe and Turkey: On the Right Track? Main Report
41
and inland waterways ports open for the existing state-run railways. At present, there are no other
rail operators apart from HŢ Transport and HŢ Cargo.
58. The Railway Safety Act sets the conditions for safe provision of rail transport services but
was not fully aligned with the EU rail safety directives. The new Railway Transport Safety Act,
which was adopted by the Parliament in March 2007, transposes Directives 2004/49/EC,
Directive 96/48/EC, Directive 2001/16/EC and Directive 2004/50/EC, removing the competence
for adopting regulations from the rail companies and transferring such competence to the line
ministry. Based on this new act, drafting of the necessary implementation rulebooks started
shortly thereafter. Both the Railway Safety Agency and the accident investigation body have been
established, but management bodies have not yet been appointed and the agencies are not yet
properly functioning.41
59. There has been progress with a number of other items of the EU rail acquis.42
In June 2009,
the members of the Council of the regulatory body were appointed. Following the confirmation of
its statutes, it started to act as a regulator from July 30, 2009.43
The amendment of the law on the
rail regulatory body has improved its functioning, and the regulatory body has taken a number of
decisions to date and is fully operational. Although the Rail Market Regulatory Agency is
financed through the state budget, the idea is that in the future it will be financed by fees,
collected from rail undertakings. A notification body has not yet been established, but bylaws
could be ready by 2011. The Ministry of Sea, Transport and Infrastructure (MSTI) is the licensing
body, and has about 11 staff—although it should be a separate body. Concerning the issue of
indebtedness of rail undertakings and infrastructure managers, debt accumulated as of January 1,
2006 was taken over by the state through the restructuring of the rail company and afterwards
loans to the rail companies have benefited from state guarantees. Border-crossing agreements are
not at present aligned with EU standards.
60. The PSO is currently not in line with the provisions of EU directives. Compensation of
PSO through annual public service contracts have been in place between HŢ Transport and MSTI
since 2007—the contract covers expenses for the difference between the real cost of services and
income, and does not provide cost efficiency incentives. Contracts are through direct negotiation
and not through tender, and contract information is not published. Furthermore, there is no track
access charge system for the PSO services. The 2009 PSO contract includes performance targets
in terms of service quality.44
The state is considering moving from annual to multi-annual
contracts in the future. Purchases of rolling stock, as well as renewals and modernization are paid
directly by the state, for both passenger and freight services, while maintenance for passenger
rolling stock is financed annually through the state budget.
41
European Commission (2010), Croatia 2010 Progress Report, accompanying the Communication from
the Commission to the European Parliament and the Council. Commission Staff Working Document,
SEC(2010) 1326, Brussels, November 9, 2010. 42
Since 2007, Croatia has benefited from the PHARE 2006 program funded by the EU ―Restructuring and
Development of Croatian Railway System within the Framework of EU Legislation.‖ 43
European Commission (2009), Second Peer Review on Rail Transport Policy in Croatia 2009. Report of
November 2009, Brussels. 44
European Commission (2009), Second Peer Review on Rail Transport Policy in Croatia 2009. Report of
November 2009, Brussels, p.24.
Railway Reform in South East Europe and Turkey: On the Right Track? Main Report
42
61. Infrastructure access contracts have existed since 2007, and are annual. However, at
present, fees are fixed as a lump sum and not on the basis of the provisions spelled out in the EU
rail aquis. Actual contracts between HŢ Infrastructure and rail undertakings include a minimum
access package and access to all services. Multi-annual contracts between HŢ Infrastructure and
MSTI have been signed since 2008. There are no cost incentives in place between the state and
HŢ Infrastructure, although certain quality standards are included. The rail network statement has
been published for a number of years now and is generally aligned to the RailNetEurope
statement. Nevertheless, the network statement does not state separate charges for terminal use—
HŢ Infrastructure owns most cargo terminals—and these are included in the minimum package
even when such services are not required. Since 2009, HŢ Infrastructure publishes the network
statement and path allocation forms in both Croatian and English.
62. As noted in the 2010 Progress Report, there has been good progress achieved with regard to
rail transport policy, but only limited progress with restructuring HŢ Holding and privatizing
subsidiaries—only two out of eight subsidiaries were privatized and one underwent bankruptcy
procedures.45
More importantly, the rail companies continue to receive high levels of budget
support, reflecting continued weaknesses in operational and financial performance. Improving the
performance of the state-owned rail companies requires implementing measures to increase
efficiency and decrease the number of workers currently employed. Failure to do so could mean
that when the rail market is eventually opened to new entrants, Croatian Railways will risk
significant losses in market share and its financial situation will become more precarious—as
illustrated by the recent experience in Bulgaria and Romania.
FYR MACEDONIA
63. FYR Macedonia adopted a new railway law and rail safety law in 2010, both of which
entered into force on April 17, 2010.46
These two new laws have been enacted with a view to
bringing further alignment with the EU rail acquis. The new railway law incorporates the First
Rail Package directives and directives on railway safety, and partly includes the provisions of
Directive 2004/51/EC on the development of the railways and Directive 2007/58/EC on the
allocation of rail infrastructure. The new law regulates: (i) the development of rail traffic and rail
infrastructure; (ii) the organization of the rail system; (iii) the method and conditions for the
performance of rail transport; (iv) access to rail infrastructure; (v) the collection of track access
charges; (vi) assignment of infrastructure capacity; (vii) the network statement; (viii)
establishment of an independent and autonomous regulatory body; (ix) financing of rail
infrastructure; and (x) PSO in rail passenger transport. The new rail safety law regulates safety
requirements as a whole, including safety management of infrastructure and traffic operations and
collaboration between rail undertakings and the infrastructure manager and is in line with rail
safety Directive 2008/110/EC and Directive 2007/59/EC on train driver certification. The new
rail safety law foresees the creation of a new Directorate for Safety within the Ministry of
Transport and Communications (MTC) and a committee acting as an accident investigation body.
45
European Commission (2010), Croatia 2010 Progress Report, accompanying the Communication from
the Commission to the European Parliament and the Council. Commission Staff Working Document,
SEC(2010) 1326, Brussels, November 9, 2010. 46
Law on Railway System, Official Gazette of the Republic of Macedonia, No.48/2010, April 9, 2010 and
Law on Railway System Safety, Official Gazette of the Republic of Macedonia, No.48/2010, April 9, 2010.

Railway Reform in South East Europe and Turkey: On the Right Track? Main Report
43
64. Since 2007, there are two independent rail companies as successors to Macedonian
Railways—Public Enterprise Macedonian Railways Infrastructure (MZ Infrastructure) and the
joint-stock company Macedonian Railways Transport (MZ Transport). The separation of
accounts between the infrastructure manager and the rail undertaking is ensured through the legal
separation into two companies, in line with Directive 2001/12/EC. The separation of accounts
between passenger and freight services within MZ Transport was started in 2010, following the
decision of the management committee in late September 2010 to divide passenger and freight
accounts. Management independence of the rail undertakings and the infrastructure management
is formally guaranteed through the independent status of both rail companies.
65. The regulatory body has become operational in its role as a market regulator and licensing
body.47
The regulatory agency is currently dependent on the budget for its financing, but it is
envisaged that starting in 2011 the actors in the railway market (infrastructure manager and
railway undertakings) will pay an annual fee for regulating the market of rail services. Two rail
operators have applied for licenses as railway undertakings to date, although neither has received
a license. This may reflect a lack of clear guidance for applicants, and is complicated by the fact
that the safety authority is not yet fully functional and the procedures for issuing safety
procedures are not currently in place.48
A recently approved EBRD loan will provide technical
assistance for the establishment of a safety authority. The committee acting as an accident
investigation body was formed as a permanent body in May 2010, and consists of three
investigators appointed by the government. The committee will be independent in its organization
and decision-making and will be independent of the infrastructure manager, rail undertakings,
safety authority, railway regulator and the MTC.
66. The entry into force of the new railway law has removed any impediments for the
introduction of the public service obligation. A PSO contract was signed between MZ Transport
and the MTC in 2010, following a decision adopted by the government in July 2010, covering
August 1-December 14, 2010. In the future it is expected that a contract will be signed each year.
An EBRD loan approved in 2010 is expected to assist in defining an appropriate level and
structure of the PSO going forward—the aim is to restructure the PSO in a manner that improves
transparency and efficiency of financing and will allow for future private sector involvement,
through a franchise, for example. Although the PSO is currently being performed by MZ
Transport, the new rail law envisages that this could change with the eventual liberalization of
passenger rail services.
67. The principles for determining the track access charged changed in 2009 and 2010. The
system of track access charging used to be based on a fixed percentage of the relevant rail
undertaking‘s revenue, instead of a direct cost of infrastructure plus a mark-up. That is to say,
from the separation of Macedonian Railways in 2007 up to January 2009, 40 percent of revenues
47
A Law on the Agency for Regulation of the Railway Services Market was adopted in January 2008 and
the agency works in line with the amended 2010 railway law. 48
European Commission (2010), The Former Yugoslav Republic of Macedonia 2010 Progress Report,
accompanying the Communication from the Commission to the European Parliament and the Council.
Commission Staff Working Document, SEC(2010) 1332, Brussels, November 9, 2010.

Railway Reform in South East Europe and Turkey: On the Right Track? Main Report
44
of MŢ-Transport were paid to MŢ-Infrastructure as the track access charge—this was not in line
with the EU rail acquis. From February 2009 to January 2010, a revised track access charge
methodology was adopted, based on a level that allowed for covering the difference between the
state contribution and financial cost. However, since January 26, 2010 a new method for
calculating the track access charge was adopted, based on marginal costs together with a mark-up
(MC+) in order to limit the state contribution and bring the basis of the charge in line with the
principles of charging laid out in Articles 7 and 8 of Directive 2001/14/EC. The methodology for
calculating the TAC is set out in the network statement, published at the end of each calendar
year by MZ Infrastructure. According to the 2010 Progress Report of the European Commission,
the level of TAC ―exceeds direct costs and therefore renders competition of rail with road
transport difficult‖, although this claim is disputed by the MTC.49
68. The new rail law envisages publishing the balance sheets and profit and loss accounts of the
rail undertakings and the infrastructure manager. These are expected to be prepared and published
by February 28, 2011, for both MZ Transport and MZ Infrastructure. The new rail law also
foresees rail undertakings to keep and publish separate financial accounts for passenger and
freight services. The new law foresees the infrastructure manager preparing each year a three year
business plan—the law prescribes mechanisms to reduce its debts to a level that can create the
conditions for cost-effective financial operations and a gradual improvement of financial
performance. The accounts of the infrastructure manager must be balanced, by ensuring that
revenues—collected from track access charges, revenues from other commercial activities
performed, and the funds provided from the state—match costs. Infrastructure access contracts
are negotiated annually. There has also been some progress on solving the indebtedness of the rail
undertakings and infrastructure managers, with a decision for solving the debts of MZ
Infrastructure and MZ Transport adopted in 2009.50
69. Although there are no new entrants as of yet in the Macedonian rail market, there has been
significant progress in reforming the legal and institutional rail landscape in recent years. Notable
achievements include the following: (i) establishment of a regulatory body that functions
independently from MTC; (ii) unbundling of infrastructure management as of 2007; (iii) signing
of an annual PSO contract; and (iv) introduction of a new track access charging methodology. All
aspects of the new rail law have yet to be fully implemented, but compared to other countries in
the region, these represent positive steps. In terms of border-crossing agreements, a requirement
of the SEETO Addendum to the MoU, an agreement with Kosovo, based on the harmonized
regional model developed by SEETO, is ready to be initialed.
KOSOVO
70. Kosovo adopted Railway Law No.03/L-76 on June 5, 2008—prior to that, a regulation set
out the basic legal framework for the operation and use of railways in Kosovo. Kosovo Railways
manages the rail infrastructure in Kosovo, and operates both passenger and freight rail services.
In December 2005, Kosovo Railways, which was previously known as UNMIK Railways, was
49
European Commission (2010), The Former Yugoslav Republic of Macedonia 2010 Progress Report,
accompanying the Communication from the Commission to the European Parliament and the Council.
Commission Staff Working Document, SEC (2010) 1332, Brussels, November 9, 2010, p. 46. 50
Official Gazette of the Republic of Macedonia, No.26/09, February 24, 2009.

Railway Reform in South East Europe and Turkey: On the Right Track? Main Report
45
transformed into a vertically integrated joint stock company. Article 33 of the railway law
requires the separation of Kosovo Railways into an infrastructure manager and a railway operator
as separate legal entities within 120 days of the law entry in force. In 2010, a legal act separating
the infrastructure and operations side of Kosovo Railways was adopted, which foresees the
creation of two joint stock companies, Infrakos and Trainkos, as legal successors. Preparation of
the legal documents for separating Kosovo Railways into an infrastructure manager and railway
operator has already started. Meanwhile, a consolidated law covering all aspects of the rail sector,
and bringing it into line with the EU rail acquis, is being prepared—with a second draft version of
the new Railway Law prepared in December 2010.51
71. According to the railway law, an independent Railway Regulatory Authority is to be
created to regulate the rail sector. Within its mandate, it: (i) issues, revokes, and monitors
compliance with licenses, safety certificates, and permits; (ii) approves rail equipment; (iii)
conducts and reports on safety inspections; and (iv) investigates accidents.52
In 2007 and 2008 no
budget was planned for the creation of the Railway Regulatory Authority. The regulatory body
has a Governing Board and a Director General of Railways—however, this organization is not yet
fully operational. The president of the board and the Director-General have been selected, but
only nine of 16 employees have been hired. Railway related issues are handled by the Ministry of
Transport and Communication (MTC) within the Railway and Civil Aviation Division by two
employees. In order to take the lead with the legal and institutional reforms required by the EU
rail acquis, it is important to ensure the establishment of a strong rail department within the MTC.
Concerning the requirement of a network statement, the 2012 network statement is being
prepared.53
72. These actions suggest some progress on the rail legal and institutional reform agenda.
However, in terms of the SEETO timetable, progress on the rail reform, not only in terms of
adoption of primary law but actual implementation, is significantly delayed. The December 2008
timetable foresaw adoption of primary laws and actual implementation, including the institutional
and organizational arrangements being in place, and all measures made operational by December
2010. One exception to this concerns border-crossing agreements, where the agreement with FYR
Macedonia has been harmonized along the lines of the regional model developed by SEETO, and
is in the final stages of procedures in both countries.
MONTENEGRO
73. The rail landscape in Montenegro has changed considerably over 2007-2010. With the
unbundling of infrastructure and operations of state railway companies, Montenegro has met a
51
European Commission Liaison Office in Kosovo (2010), Railway Law, Technical Report V2.1, Support
in the Implementation of Transport Community Agreement (EU TCA). Report prepared by EGIS BCEOM,
December 3, 2010. 52
European Commission Liaison Office to Kosovo (2008). Railway Transport in Republic of Kosovo,
Draft Report, Review of the Current Situation. Technical Support to the Ministry of Transport and
Communications to continue the development of a Multi-Modal Transport Strategy and Action Plan,
December 2008. 53
European Commission (2010), Kosovo 2010 Progress Report, accompanying the Communication from
the Commission to the European Parliament and the Council. Commission Staff Working Document,
SEC(2010) 1320, Brussels, November 9, 2010, p.43.

Railway Reform in South East Europe and Turkey: On the Right Track? Main Report
46
major requirement of the EU rail legislation. The legal framework for the rail sector in
Montenegro is governed by the 2004 Law on Railways; amendments to the law were adopted in
2009.54
This law regulates management of infrastructure and operation of rail transport, and is
founded on the principle of the separation of infrastructure from operations—opening up the
market to potential new entrants. In September 2007, the Government of Montenegro adopted the
Restructuring Strategy of the Railway of Montenegro, which opted for the full separation of
railway undertakings from the infrastructure manager as the model to be followed. This Strategy
is being implemented in line with the adopted Action Plan in three phases: (i) audit of financial
statements; (ii) separation of companies; and (iii) privatization of parts of the rail companies. In
accordance with the Law on Railways, the rail incumbent Željeznice Crne Gore (ŢCG) ceased to
exist on December 31, 2008 and was replaced by two joint stock companies: Railway
Infrastructure of Montenegro (ŢICG) and Railway Transport of Montenegro (ŢPCG). The
government has assumed Euro 138.2 million of debts and financial obligations accumulated up to
December 31, 2008.
74. In June 2009, ŢPCG was further restructured by spinning off the freight transport division
and establishing Montecargo as a fully independent joint-stock company. On October 21, 2009,
the Government of Montenegro issued a tender to sell the state‘s stake (87.6 percent) in
Montecargo. On March 17, 2011, Montenegro‘s Privatisation Council cancelled the tender talks
with the sole bidder, Romania‘s consortium Grampet, after failure to reach agreement. The
Restructuring Strategy envisages further spin offs from ŢICG and ŢPCG—at present there are
activities ongoing for separating the Sector for Infrastructure Maintenance from ŢICG, and the
Sector for Maintenance of Rolling Stock from ŢPCG. Privatization of the rail infrastructure
maintenance activities is meant to introduce competition, and thus foster innovation in relation to
work procedures and technology in a sector that for a long time has been operating as a
monopoly. In the future, the operation and commercial development of the railway stations
owned by ŢICG are expected to be tendered for operation either via a concession or through a
lease.
75. In September 2010, the Ministry of Transport, Maritime Affairs, and Telecommunications
(MOT) started activities for the preparation of a new Law on Railways and for amending the Law
on Railway Transport Safety, which will be transposed with the relevant EU rail acquis, in
particular the directives on train driver licenses and interoperability.55
A new law on railway
transport contracts came into force in August 2010, and is compliant with the EU Regulation
1371/2007 concerning rail passengers‘ rights and obligations under the Convention concerning
International Carriage by Rail (COTIF). The Railway Directorate began operating in March
2010, and it is in charge of safety and regulation. However, it is not fully operational due to lack
of staff—there are at present 6 staff—and resources.56
According to a recent assessment by the
54
Official Gazette of Montenegro No. 21/2004 and Official Gazette of Montenegro No.54/2009. 55
European Commission (2010), Analytical Report accompanying the Communication from the
Commission to the European Parliament and the Council. Commission Opinion on Montenegro‘s
application for membership of the European Union. Commission Staff Working Document, SEC(2010)
1334, Brussels, November 9, 2010. 56
A number of rulebooks have been issued to date: (i) Rulebook on licensing for railway infrastructure
management; (ii) Rulebook on issuing licenses for railway transport; (iii) Rulebook on issuing safety
certificates for railway infrastructure management, and (iv) Rulebook on issuing safety certificate for
railway transport. These can be found in the Official Gazette of Montenegro 56/08.

Railway Reform in South East Europe and Turkey: On the Right Track? Main Report
47
European Commission, the remit of the Railway Authority needs to be enhanced by allowing it to
impose penalties and to request information, as well as enforce decisions. An independent
accident investigation body and a relevant appeal mechanism also need to be established. At
present, the Railway Authority is not fully independent—as the manager is appointed based on a
proposal made by the MOT and is dependent on state funding.
76. A number of key rail reforms remain pending at present, although there has been progress
recently in other areas. Concerning infrastructure access charging, at present there is no charging
for passenger trains—which does not comply with EU law.57
PSO contracts have yet to be
introduced—technical assistance for the preparation of such a contract will be provided through
an EBRD loan. The 2010 network statement has been published on the website of ŢICG, and
infrastructure access contracts have been signed between the infrastructure manager and rail
operator. There has been some progress with item 2.5 of the SEETO Addendum to the MoU
concerning border-crossings, with a new bilateral agreement on border-crossing control between
Montenegro and Serbia having been ratified in 2010—although not fully compliant with EU
legislation—and preparation of a new agreement on border-crossing control between Montenegro
and Albania is in progress. There are plans to reduce the number of employees in ŢICG and
ŢPCG, which will be funded by the state budget and EBRD. There is continuous social dialogue
with representatives of the rail trade unions, with a new collective agreement in the process of
negotiations with ŢPCG, in line with Montenegro‘s commitments under item 2.6 of the SEETO
Addendum to the MoU.
SERBIA
77. Serbia started reforming the rail sector five years ago through the establishment of the
public enterprise Železnice Srbije (Serbian Railways).58
Serbian Railways was created as a
vertically integrated public enterprise performing activities of public interest with state-owned
assets, and is a legal successor to ZTP Belgrade. The articles of incorporation divide the
organizational structure of the company in two—an Infrastructure Directorate and a Transport
Directorate, with the existence of joint services as well. The 2005 rail law indicates that public
rail infrastructure is owned by Serbia, but is open to all licensed rail transporters. Initially,
Serbian Railways is the public rail infrastructure manager, but the law allows for licensing of
other infrastructure managers. In a report on rail transport issues in Serbia prepared in 2008 by
the European Commission, it is noted that ―the process of aligning national law to EU directives
seems to have stopped in 2006‖ with no new further legislative alignment.59
As noted in the 2009
Progress Report of the European Commission, there has been no progress towards the gradual
57
European Commission (2010), Analytical Report accompanying the Communication from the
Commission to the European Parliament and the Council. Commission Opinion on Montenegro‘s
application for membership of the European Union. Commission Staff Working Document, SEC(2010)
1334, Brussels, November 9, 2010. 58
The company was established following the adoption of the Decision on Establishment of the Public
Enterprise for Management of the Public Railways Infrastructure and Performing Railway Transport,
Official Gazette of the Republic of Serbia No. 78/2004, October 8, 2004 and Official Gazette of the
Republic of Serbia No. 19/2005, February 26, 2005. 59
European Commission (2008), Peer Review 2008: Evaluation Mission on Rail Transport issues in
Serbia. Ref. 31088. Technical Assistance Information Exchange Unit, DG Enlargement, in close
cooperation with DG TREN. Brussels: European Commission. This section is largely based on this report.

Railway Reform in South East Europe and Turkey: On the Right Track? Main Report
48
opening of the rail market—amendments to the railway law have not been adopted, as noted in
the 2010 Progress Report.60
78. There are a number of lacunae with regard to implementation of EU rail acquis: In respect
of the separation of accounts as per Article 6.1 of Directive 2001/12/EC, only one balance sheet is
published annually for both infrastructure and transport. Internal balance sheets are available for
internal purposes only and are not public, nor are they audited; separation of accounts as per the
EU rail acquis has therefore not occurred yet. Serbian Railways receives an annual budget from
the state that is not earmarked—it is therefore not possible to clearly separate subsidies for
infrastructure and rail transport services. Cross subsidization from freight to passenger transport
services occurs, as Serbian Railways lacks a method for calculating internal costs. Management
independence of rail undertakings as per Article 5 of Directive 91/440/EEC is not guaranteed,
because Serbian Railways has limited scope to make managerial decisions without the approval
of the Ministry of Infrastructure according to the railway law and the decree establishing Serbian
Railways. Likewise, the independent function of the infrastructure manager is not guaranteed in
the decree establishing Serbian Railways, because Article 15 makes all important decisions
subject to the approval of the Serbian government. Access rights for licensed rail undertakings are
currently not allowed in the Serbian network, nor are foreign licenses recognized.
79. Concerning infrastructure, additional by-laws are necessary to allow the infrastructure
manager to publish the network statement (Article 3 of Directive 2001/14/EC). In March 2010,
Serbian Railways completed a first draft of the network statement. At present, the railway law has
no provision for the introduction of an infrastructure access charging regime—a first step in this
direction is the adoption of a methodology for infrastructure charging in line with Chapter II of
Directive 2001/14/EC. The Serbian government adopted a decree on infrastructure charging in
March 2010—based on the methodology proposed by Booz Allen Hamilton—which was
financed by the Public-Private Infrastructure Advisory Facility (PPIAF).61
At present, the
infrastructure capacity allocation process is planned on the basis of internal criteria—a non-
discriminatory allocation process is not provided, since the railway law does not require that
Serbian Railways coordinate international paths with FTE and RailNetEurope.
80. According to the railway law, the regulatory body is established in the Railway Directorate.
The Railway Directorate combines the functions of regulatory and safety body, with the majority
of the work related to safety. The Railway Directorate is a separate legal entity and is
independent from rail operators and the infrastructure manager, with its budget directly financed
by the state—its own revenues account for less than 6 percent. The director of the Railway
Directorate is appointed by the Prime Minister and is situated in the same building as Serbian
Railways. In its role as a regulatory body, the Railway Directorate has limited competencies. It
cannot deal with complaints about access charges, and although it can mediate in disputes
60
European Commission (2009), Serbia 2009 Progress Report, accompanying the Communication from
the Commission to the European Parliament and the Council. Commission Staff Working Document,
SEC(2009) 1339, Brussels, October 14, 2009 and European Commission (2010), Serbia 2010 Progress
Report, accompanying the Communication from the Commission to the European Parliament and the
Council. Commission Staff Working Document, SEC(2010) 1330, Brussels, November 9, 2010. 61
Decree on Methodology of Evaluation of Elements for Setting the Amount of Compensation for the Use
of Railway Infrastructure, Organization, and Regulation of Railway Transportation. Official Gazette of the
Republic of Serbia No. 14/2010.

Railway Reform in South East Europe and Turkey: On the Right Track? Main Report
49
between the infrastructure manager and rail undertaking, the current rail law does not envisage
the application of penalties. Likewise, the rail law does not determine a procedure for judicial
arbitration through the Railway Directorate—this must be made through the Ministry of
Infrastructure. This brief overview suggests the need for significant changes to the Railway
Directorate—particularly in its role as regulatory body—in order for it to be in compliance with
the EU rail acquis.
81. Serbia has not yet implemented the rail safety directive (Directive 2004/49/EC) as this
requires an amendment to the railway law, although the directive is largely applied in practice.
The national safety authority function is ensured by the Railway Directorate and it is not yet clear
whether the National Safety Authority will be created because there is no defined strategy on the
creation of separate bodies as envisaged by EU rail directives. At present, the Railway Directorate
does not have the competence to investigate accidents. The railway law does not include a
requirement to have a safety management system, although this is required under Railway Safety
Directive 2004/49/EC. The Railway Directorate is also responsible for issuing licenses and safety
licenses certificates, with the former being a precondition for the latter. Foreign licenses are not
issued—as of 2008 two licenses had been issued. In order to be compliant with EU law: (i) the
issuing of licenses and safety certificates should be separate and independent activities; (ii) an
investigation body with the aim of investigating accidents has to be functionally independent; and
(iii) as the regulatory body and safety body are combined, the former cannot act as an appeal
body for decisions concerning the latter.
82. At present there is no public service obligation (PSO) contract between the state and
Serbian Railways to compensate for rail passenger services according to EU rules. There has been
some recent progress on this issue, with the adoption of a decree on the PSO methodology on
September 10, 2009, specifying the model for calculating the full recovery cost of transport
services, stipulating cost calculations for the various types of transportation.62
The methodology
for calculation of costs was based on information provided by Serbian Railways. In addition, two
rulebooks on the content of the PSO contract and the conditions and procedures for performing
the PSO were passed in August 2010.63
Article 5 of the by-law on subsidy eligibility for
performing the PSO specifies that carriers will sign a contract with the central or local
government, regulating mutual rights and obligations in performing the PSO. Compliance with
the EU rail acquis would require separate accounting for infrastructure and passenger and freight
transport to be in place, as well as an inventory of assets. Serbia is exploring options for technical
assistance in order to create model PSO contracts—a key step for operationalizing recent reforms.
83. An important reform that is currently under discussion is the new act on the organizational
structure of Serbian Railways. This is expected to lead to a change from the current vertically
integrated structure to a holding company with limited liability—with separate subsidiaries for
passenger services, freight services, and infrastructure. To this end, in 2009 the Ministry of
Infrastructure formed a working group with a mandate to assess what is required to restructure the
62
Decree on Justified Full Transportation Cost Determination Methodology, Official Gazette of the
Republic of Serbia, No.76/2009. 63
Rulebook on Contract Content Regulating Public Service Obligation in Rail Traffic, Official Gazette of
the Republic of Serbia No. 56, 2010, August 18, 2010 and Rulebook on Subsidy Eligibility Criteria and
Procedure for Performing the Defined Public Service Obligation in Rail Traffic, Official Gazette of the
Republic of Serbia, No. 58/2010, August 28, 2010.

Railway Reform in South East Europe and Turkey: On the Right Track? Main Report
50
entire rail sector, including a new founding act for Serbian Railways.64
The financial
consolidation of historic debts owed by Serbian Railways is also included in the agenda of the
working group.65
To assist the government‘s efforts in reforming both the rail sector and Serbian
Railways, a strategic advisor was appointed in 2010, financed from an EBRD loan. The
consultant‘s tasks include providing advice and guidance on: (i) strategic rail documents for the
future functioning of the rail sector; (ii) the organization of the future holding structure of Serbian
Railways, including the model of the holding company, separation of assets and debts, contractual
relationships between the companies within the holding, contracts between the state and
companies within the holding, implementation of the PSO methodology, including the
implementation of PSO contracts; and (iii) the implementation of the track access charge
methodology recently adopted. As noted in Serbian Railways‘ 2010 business plan, an
indispensable precondition for a change in its organizational structure is the implementation of a
financial consolidation program to deal with accumulated historic debts.
84. Serbia will not meet the initial deadlines for the implementation of the Addendum of the
MoU on the Development of the Core Regional Transport Network of SEETO. In December
2008 Serbia committed to the target date of 2010 when policies in five areas were to be made
operational: (i) separation, management independence, and market orientation (Addendum Item
2.2); (ii) fair infrastructure access, safety, and interoperability (Addendum Item 2.3); (iii)
financial stability; (iv) border-crossing (Addendum Item 2.5); and (v) social dimension and social
dialogue (Addendum item 2.6). There have been positive developments in terms of border-
crossing agreements, most notably the one between Bulgaria and Serbia at the Dimitrovgrad
border-crossing point, which complies with EU law, and more recently the one between Serbia
and Montenegro. However, there is no PSO contract—passenger compensation is paid through a
lump-sum calculated based on the financial needs of Serbian Railways—no infrastructure access
contracts, no mechanism to reduce historic debts, and separation of accounts between the
Infrastructure Directorate and Transport Directorate is not ensured.
85. After a hiatus in 2006, the rail reform agenda regained some momentum in Serbia starting
in 2009. A number of working groups have been set up in order to make progress in changing the
legal framework to make it compliant with the EU rail acquis. Summarizing some of the key
outstanding areas for further reform: (i) separation of accounts between infrastructure manager
and transport operations; (ii) introduction of PSO contracts at the central and local level; (iii)
introduction and setting up of track access charging regime; (iv) setting up the regulatory body as
required by Directives 2001/12/EC and 2001/14/EC; (v) setting up the national safety authority
and the investigation body; (vi) non-discriminatory access and opening the market; and (vii)
transposition and implementation of measures for rail interoperability included in the second
railway package.
64
Decision No.119-01-77/2009-11 of June 29, 2009. The working group includes representatives from the
Ministry of Infrastructure, the Railways Directorate, Ministry of Finance, and Serbian Railways. 65
According to the European Commission report on Serbia the existing level of outstanding Serbian
Railways debt ―must be reduced to an economically viable level‖.

Railway Reform in South East Europe and Turkey: On the Right Track? Main Report
51
THE NEED FOR CONTINUED INSTITUTIONAL REFORM
86. Both Bulgaria and Romania have transposed the First Railway Package, and this has led to
a transformation of the rail sector. In particular, one of the most significant changes has been the
emergence of new participants in the rail freight market, which has threatened the position of the
previously dominant incumbent rail undertakings. While increasing competition between rail
undertakings is a key objective of the EU rail reforms, this has placed considerable strain on the
state-owned freight companies in both countries: BDZ EAD in Bulgaria and CFR Marfa in
Romania. These companies have not implemented market-driven business strategies that would
have allowed them to compete successfully with the new entrants. Large financial losses in both
companies—in part due to the impact of the financial crisis on demand since the last quarter of
2008—have led to the need to develop restructuring plans. Passenger services remain restricted
to the state incumbents, BDZ EAD in Bulgaria and CFR Calatori in Romania, which despite PSO
contracts, remain loss-making companies. The infrastructure managers, NRIC in Bulgaria and
CFR in Romania, also continue to make losses. The continued poor financial performance of
these state-owned companies reflects an inability to respond to changing market conditions. It
also demonstrates that the introduction of track access charges and public service contracts are
not a panacea. These instruments have not been developed as a substitute for efficient operational
and financial management of rail companies, and they will not suffice in the absence of concrete
measures to contain costs and improve performance. Both countries‘ experience—namely, the
introduction of rail reforms in line with the EU rail acquis, combined with poor management of
state-owned rail companies—holds important lessons for the South East Europe countries as they
continue in the process of implementing reforms.
87. Implementation of rail reforms to bring national legislation in line with the EU rail acquis
has been for the most part disappointing in the SEETO countries and Turkey. The timetable
associated with the Addendum to the MoU will not be met. Taking the separation of accounts
between infrastructure managers and transport services as foreseen in Directive 91/440/EEC as a
starting point, Albania, Bosnia and Herzegovina, Serbia, and Turkey continue to have vertically
integrated rail incumbents which do not guarantee the separation of accounts (Table 3). For these
four countries, there have been no changes in the rail legal framework since 2005 that would
allow an unbundling of services. In 2008, Kosovo adopted a rail law, while in 2010, it adopted a
legal act separating infrastructure and transport services. This act aimed at separating Kosovo
Railways into two joint stock companies. However, this change has yet to be implemented.
Croatia, FYR Macedonia, and Montenegro have created separate joint stock rail companies for
infrastructure and transport services. Montenegro is an outlier, in that it decided to spin-off the
freight rail company, Montecargo, and then decided to privatize it, although the privatization was
eventually cancelled over failure to reach agreement with the winning bidder. There are no new
entrants to the rail market in the SEETO countries or Turkey—domestic markets remain closed,
even on a reciprocal basis.
88. Regarding financing arrangements for the rail sector, there has been limited progress to
date. Among the key financing arrangements foreseen with the First Rail Package are the
following: (i) the development of multi-annual contracts between the state and infrastructure
manager; (ii) the introduction of track access charges; (iii) the development of public service
contracts; and (iv) mechanisms to reduce indebtedness of rail incumbents. Only Croatia and FYR
Macedonia are largely on track with regard to these issues, even if TAC and PSC are not fully
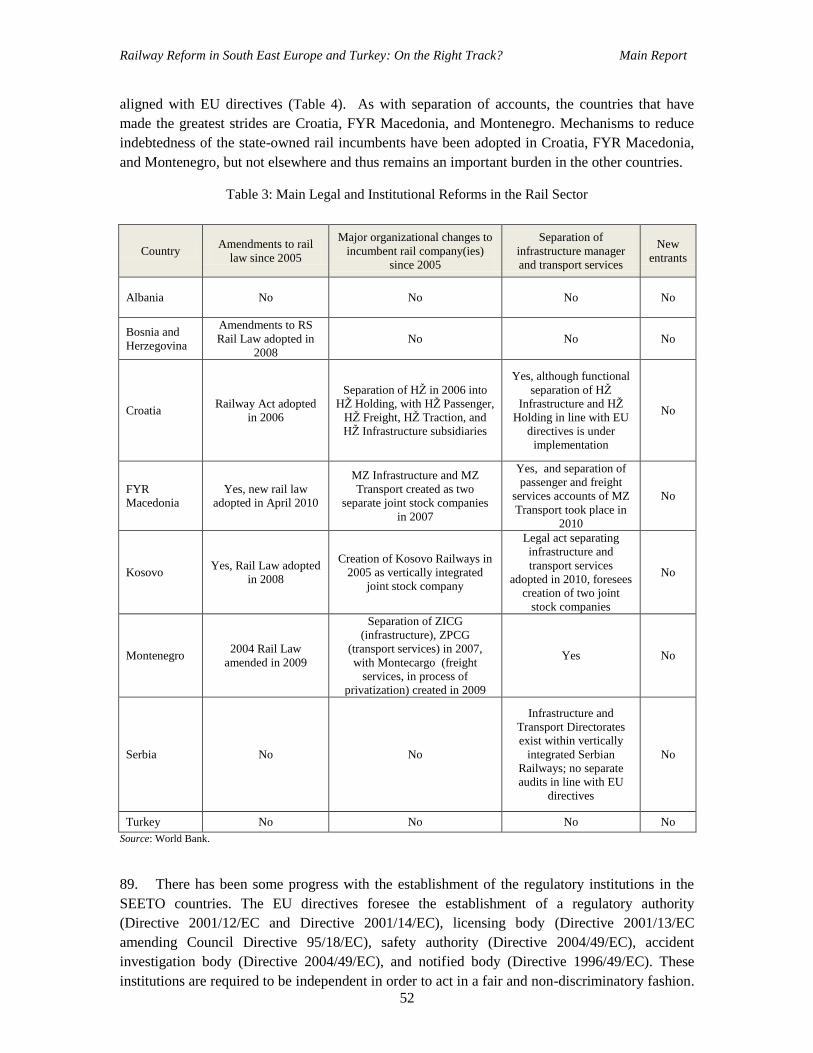
Railway Reform in South East Europe and Turkey: On the Right Track? Main Report
52
aligned with EU directives (Table 4). As with separation of accounts, the countries that have
made the greatest strides are Croatia, FYR Macedonia, and Montenegro. Mechanisms to reduce
indebtedness of the state-owned rail incumbents have been adopted in Croatia, FYR Macedonia,
and Montenegro, but not elsewhere and thus remains an important burden in the other countries.
Table 3: Main Legal and Institutional Reforms in the Rail Sector
Country Amendments to rail
law since 2005
Major organizational changes to
incumbent rail company(ies)
since 2005
Separation of
infrastructure manager
and transport services
New
entrants
Albania No No No No
Bosnia and
Herzegovina
Amendments to RS
Rail Law adopted in
2008
No No No
Croatia Railway Act adopted
in 2006
Separation of HŢ in 2006 into
HŢ Holding, with HŢ Passenger,
HŢ Freight, HŢ Traction, and
HŢ Infrastructure subsidiaries
Yes, although functional
separation of HŢ
Infrastructure and HŢ
Holding in line with EU
directives is under
implementation
No
FYR
Macedonia
Yes, new rail law
adopted in April 2010
MZ Infrastructure and MZ
Transport created as two
separate joint stock companies
in 2007
Yes, and separation of
passenger and freight
services accounts of MZ
Transport took place in
2010
No
Kosovo Yes, Rail Law adopted
in 2008
Creation of Kosovo Railways in
2005 as vertically integrated
joint stock company
Legal act separating
infrastructure and
transport services
adopted in 2010, foresees
creation of two joint
stock companies
No
Montenegro 2004 Rail Law
amended in 2009
Separation of ZICG
(infrastructure), ZPCG
(transport services) in 2007,
with Montecargo (freight
services, in process of
privatization) created in 2009
Yes No
Serbia No No
Infrastructure and
Transport Directorates
exist within vertically
integrated Serbian
Railways; no separate
audits in line with EU
directives
No
Turkey No No No No
Source: World Bank.
89. There has been some progress with the establishment of the regulatory institutions in the
SEETO countries. The EU directives foresee the establishment of a regulatory authority
(Directive 2001/12/EC and Directive 2001/14/EC), licensing body (Directive 2001/13/EC
amending Council Directive 95/18/EC), safety authority (Directive 2004/49/EC), accident
investigation body (Directive 2004/49/EC), and notified body (Directive 1996/49/EC). These
institutions are required to be independent in order to act in a fair and non-discriminatory fashion.

Railway Reform in South East Europe and Turkey: On the Right Track? Main Report
53
Independence is understood in terms of financing and organizational independence from transport
ministries—with board of directors and managers hired through an open process and not
appointed by the transport ministry or government, and with decision-making independent from
transport ministries. At present, the regulatory authorities in Croatia and FYR Macedonia comply
with EU directives and have recently been established, while in Bosnia and Herzegovina,
Montenegro and Serbia such regulatory authorities exist but do not satisfy the criteria of the EU
rail directives and they have limited regulatory powers. In the case of Albania there is no
regulatory authority, while Kosovo established a regulatory authority in 2009 but is not yet fully
operational.
Table 4: Key Financing Arrangements Included in EU Rail Acquis
Country
Multi-annual contract
between state and
infrastructure
manager
Track access
charging
Public service contracts
for passenger services
Mechanisms to
reduce indebtedness
of rail incumbents
Albania No No No No
Bosnia and
Herzegovina No
Partly
implemented
Implemented in RS, but
not fully aligned with
EU directives
No
Croatia Yes since 2008
Yes, but not
aligned with EU
directives
Yes, but not aligned
with EU directives
Debt accumulated
as of January 1,
2006 taken over by
state
FYR Macedonia Yes
Yes, new method
adopted in 2010,
but TAC
considered very
high by EC
Yes, but level and
structure of PSO is
being revised
Yes, following
government
decision in 2009
Kosovo No
Implemented as a
lump sum and not
in line with EU
directives
Yes, but not aligned
with EU provisions No
Montenegro No Not for PSO
passenger services No
Yes, government
assumed
accumulated debts
as of December 31,
2008
Serbia No No No No
Turkey No No No No
Source: World Bank.
90. Those regulatory bodies that have been established often lack sufficient staff in terms of
number and competence, and are for the most part not independent—either in terms of decision-
making capacity or in terms of budget. Thus, they have limited authority. One of the key
functions of the regulator is to monitor competition in the rail service market and to hear appeals
regarding possible discrimination by the infrastructure manager and complaints about path
allocation, and level and structure of track access charges. Having fully operational regulatory
institutions will become critical in the future, particularly when SEETO countries and Turkey

Railway Reform in South East Europe and Turkey: On the Right Track? Main Report
54
open their markets. In countries such as Albania, Bosnia and Herzegovina, Kosovo, and Serbia,
where the incumbent rail companies remain vertically integrated, the need may appear less
pressing at present. For smaller rail sectors, appropriate solutions need to be developed in order to
reduce the financial cost of establishing and running all the rail regulatory institutions foreseen in
the EU rail directives.
91. Regarding implementation of TAC for use of infrastructure, all SEETO countries have
completed TAC studies and have decided on a methodology. With the exception of Bosnia and
Herzegovina, all contracts have opted for the marginal cost plus pricing method. FYR Macedonia,
Montenegro, and Serbia have adopted decisions on the new TAC methodology—although in
Serbia it is not yet implemented. There are contracts between the state and infrastructure manager
in Bosnia and Herzegovina, Croatia, and FYR Macedonia, with contracts between the
infrastructure manager and rail undertaking in Croatia, FYR Macedonia, and Montenegro. While
these are positive developments, they are recent, and it remains to be seen whether the
methodologies adopted for TAC are in line with EU rail directives—the case of Bulgaria is a
reminder that even within the EU, there remain a number of countries with TAC methodologies
that are not fully aligned with EU requirements.
92. In general terms, with the exception of Turkey, candidate countries are closer to complete
implementation of the EU rail acquis than pre-accession countries. For the remaining countries,
attempts have been made to align rail laws, but implementation is lagging because EU
membership is a more remote reality—and this despite the commitments made following the
signature of the SEETO Addendum to the MoU. It is also true that for a number of South East
Europe countries, the focus in recent years has been on the road sector, with the rail sector a
second policy priority. A stumbling block, particularly for the establishment of the regulatory
institutions, is the number of institutions, staff, and resources required, for what are, for a number
of countries, small rail sectors. Perhaps a further reason for the slow progress of the railway
reform process in the Western Balkans and Turkey is that the EU legal and regulatory framework
is meant to improve the competitiveness of rail as a transport mode, and not to maintain
incumbent rail companies. Unleashing competition by opening the market requires radical change
in the way incumbents operate if they are to avoid dramatic and rapid losses of market share.
93. In moving the rail reform agenda forward, it is important for the Western Balkan countries
to coordinate to ensure a harmonized approach is adopted—or else, harmonization as a second
step, once key rail reforms have been passed. SEETO has been playing a leading role in
advocating this harmonized approach, recognizing that harmonization of EU directive
implementation is important for the establishment of an open rail market. Opening the rail market
in a non-discriminatory manner is at risk without harmonization of track access charges and
network statements at a regional level. Recent technical assistance has focused on infrastructure
access and pricing regime, network statement and rail border-crossings.66
The most important
results are: (i) a draft regulatory manual for a harmonized infrastructure charging regime; (ii) a
draft harmonized network statement; (iii) action plans for the completion of the regulatory
66 Support for Implementing Measures for South East Europe Core Regional Transport Network Multi
Annual Plan (MAP) 2008-2012" EuropeAid/125783/C/SER/MULTI. The contract for the project was
signed in June 2008 by a Consortium led by White Young Green Consulting (UK) which also includes
TRADEMCO (Greece), Vienna Consult (Austria) and TRL (UK). The project ran until November 2009.
Railway Reform in South East Europe and Turkey: On the Right Track? Main Report
55
manual and endorsement of network statements; (iv) a draft regional plan to improve regional
railway operations, including, passenger border controls on moving trains, and introduction of
Electronic Data Interchange (EDI) for freight operations; and (v) an action plan for greater
integration of railway border-crossing policies.
94. Looking ahead, the Western Balkan Transport Community Treaty is a potentially important
mechanism for moving the rail reform agenda forward. In March 5, 2008, the EU launched
negotiations on a Western Balkan Transport Community Treaty to accelerate EU pre-accession
preparations with Western Balkan countries. The proposed Transport Treaty aims to work
towards an integrated market for road, rail, inland waterways, and maritime transport in the
Western Balkans region and to align the relevant legislation in the Western Balkans with EU
legislation. The Transport Community Treaty is expected to be signed in 2011, and will become
legally binding for the SEE region, requiring each contracting party to fully transpose the
European directives in the national legislation. It aims to integrate candidate and potential
candidate countries into EC structures and align legislation with the acquis communautaire at an
early stage of the accession process. While this may provide a much needed impetus to drive
railway reforms, the treaty excludes Turkey, which is one of the countries which has to date
posted very limited progress in reforming its rail sector, despite being a candidate country.
CONCLUSIONS - CONTINUING NECESSARY INSTITUTIONAL AND REGULATORY REFORM
95. Institutional reforms are required, not only to comply with the EU rail acquis, but also to
ensure that there is an enhanced institutional and regulatory framework governing the rail sector,
which will positively impact on the operational and financial performance of rail companies. The
recommendations are listed below.
96. Refocus rail network development plans. Governments should prepare rail network
development plans, considering traffic density as a key variable when making investment
decisions. It is recommended to develop with higher priority the strategy for the modernization of
the core network operating most of the traffic, for the achievement of inter-operability with
European railways, and for increasing rail safety and labor productivity. Plans should be prudent
in defining the development of rail lines without high traffic intensity.
97. Provide equitable support to road and rail transportation. Government transport
policy should place rail and road transportation on an equal footing; the legal provisions and the
level of financial contribution of the state for railway and road infrastructure should be equivalent
(Box 6). This will allow users to make the socially optimal choice between the two modes for
each trip. As long as the financial support of the state is reflected in an unbiased manner in the
transportation tariffs for competing modes of transport, the market will generate enough resources
to cover the infrastructure operation needs.
98. Ensure that freight infrastructure access charges do not cross-subsidize passenger
services. Transport ministries should elaborate a methodology for the calculation of access
charges in accordance with the European regulations and set up fair tariffs for freight and
passenger trains, in line with their usage of rail infrastructure. The level of freight TACs needs to
be reviewed in line with that of other countries, to ensure that it does not distort international
traffic across rail corridors, or create a negative externality.
Railway Reform in South East Europe and Turkey: On the Right Track? Main Report
56
99. Review passenger fare regulations. In many cases, the existing fare regulations limit the
ability of the railways to implement commercial pricing systems. The use of yield-management
techniques to try to maximize sale of unused seats needs to be permitted within the pricing
framework, in order to improve revenues per railcar-km. Where subsidies are paid in block or
when a PSC pays the difference between revenue and cost, there are limited incentives to collect
fares and reduce fare evasion. Fare discounts and regulatory policy should focus on providing
options for poorer travels, but should not otherwise determine pricing.
100. Improve corporate governance in state rail companies. A number of countries have
changed the legal status of their rail undertakings to that of joint-stock companies, which is a
corporate structure selected to ensure managerial independence and commercially-orientated
behavior. However, in practice this has often led to the creation of joint-stock companies in paper,
with significant interference from transport ministries in day-to-day decision making, which
prevents the kinds of decision-making that can be expected from operating in a more
commercially-oriented environment. To take one example, Romania‘s infrastructure manager,
CFR, appointed by the transport ministry, has had six changes of general managers over 2003-
2009. The lack of a clear separation of responsibilities between governmental structures and rail
companies, in the framework of a commercial approach to rail transport activities, generated
political interference in the daily management of activity, lack of accountability of manners, and
poor performance.
101. In a market environment characterized by increased competition from private freight
operators, the failure of Bulgaria and Romania to slow the erosion of market share is in part the
reflection of the corporate cultures of their companies, which are not sufficiently attuned to
market demands. Nor has there been sufficient autonomy to make difficult decisions, regarding
staffing levels for example, until the crisis starting in 2009 has forced radical solutions to deal
with unsustainable financial losses. Changes in the corporate culture would require reviewing the
qualifications of board members, as well as the manner in which the government manages public
shareholding and the membership of shareholder assemblies, to ensure that companies are
allowed to behave commercially.
102. Require financial accounts to be prepared according to IFRS—and require that they
be published and audited. In order to assess the financial performance of rail companies,
systematic and comprehensive financial accounts need to be prepared according to International
Financial Reporting Standards (IFRS) and audited by independent audit companies on a line-of-
business basis.67
EU laws require the publishing of accounts by activity for each rail company,
including the production of balance sheets and income statements—although they do not provide
detailed guidance on the presentation of accounts, nor do they set accounting standards. Without
explicit guidelines, there are significant variations in the way accounts are presented, and in the
way governments report state contributions to the sector. This makes it difficult to make direct
comparisons between rail companies.
67
See van Greuning, Hennie, Scott, Darrel, and Terblanche, Simone (2011), International Financial
Reporting Standards: A Practical Guide. World Bank Training Series. World Bank: Washington DC.

Railway Reform in South East Europe and Turkey: On the Right Track? Main Report
57
103. Strengthen licensing bodies as foreseen in EU rail directives. Licensing bodies should
award licenses to railway undertakings that satisfy EU requirements—these licenses should be
published. Governments should set minimum coverage requirements relative to accidents.
104. Put an end to self-regulated rail monopolies. Place critical access conditions under the
control of a safety authority and regulatory body, as envisaged under EU rail directives. These
authorities should control the conditions for awarding train driver licenses, as well as access to
training facilities.
105. Establish pro-active and strong regulators. Guaranteeing fair competitive conditions will
encourage market-entry of new operators. Rail regulators should cooperate across borders, along
rail corridors, and at a regional and EU level.
106. Require authorization of rolling stock by a safety authority. On the basis of cross-
acceptance rules, tests passed in other countries should be accepted across national borders—this
eliminates the need for time-consuming retesting. The safety authority should establish and
publish a complete collection of national safety rules, and abandon any such rules that are
incompatible or redundant with EU rules.
107. Ensure that prices for rail-related services are transparent. Rail-related services, such
as terminals in inland or sea ports, passenger stations, fueling, towing, and supply of traction
current, are essential for market access. Consequently, prices and access conditions should be
transparent and based on conditions controlled by the regulatory body.
Railway Reform in South East Europe and Turkey: On the Right Track? Main Report
58
A COMPARATIVE ASSESSMENT OF OPERATING AND FINANCIAL
PERFORMANCE
INTRODUCTION
108. This chapter reviews the operational and financial performance of state rail companies in
South East Europe and Turkey from a comparative perspective. Ten countries are included in this
report and in six of these there is more than one state rail company operating—in the case of
Bulgaria, Croatia, Romania, FYR Macedonia and Montenegro due to reforms separating transport
services from infrastructure provision, and in the case of Bosnia and Herzegovina, due to an
integrated rail company operating in each entity. The rail companies included for the purpose of
this analysis are Albanian Railways, Bosnia and Herzegovina‘s ŢFBH and ŢRS, BDZ and NRIC
of Bulgaria, Croatian Railways, Kosovo Railways, Macedonia Railways Transport (MŢ-T),
Macedonia Railways Infrastructure (MŢ-I), Montenegro‘s Montecargo, Railway Infrastructure of
Montenegro (ŢICG), Railway Transport of Montenegro (ŢTCG), Romania‘s CFR Calatori, CFR
Marfa, and CFR, Serbian Railways, and Turkish Railways (TCDD).68
109. The chapter begins by reviewing traffic trends and characteristics, focusing on general
traffic patterns for the region as a whole over the last decade, before assessing operating
performance. Operating performance indicators include traffic density, freight traffic density,
labor productivity, freight wagon productivity, passenger coach productivity, and locomotive
productivity. With the exception of Kosovo, the data for all the operational indicators is from
Union des Chemins de Fer (UIC).69
In order to assess traffic trends over 2005-2009 and to assess
operational performance in 2009, the EU is used as the benchmark—understood as the average
for the EU-27—with the EU value normalized to 100. This allows an assessment of how close
each country in the report is converging to the EU average, an important objective for all
countries—two countries are EU members (Bulgaria and Romania) and the remaining countries
all aspire to join the EU. The three comparator countries are: (i) Germany—a high performer by
EU standards; (ii) Slovenia—a former republic of Yugoslavia and an example of a relatively
strong performer in the region; and (iii) Poland (see Box 3 provided later).70
110. Financial performance indicators are used to gauge the relative performance of the state rail
undertakings of the ten report countries. In the absence of systematic and comprehensive financial
accounts prepared according to International Financial Reporting Standards (IFRS) for all the
68
For country level operational performance level data in Bulgaria and Romania, data on traffic from non-
incumbents is used. For Romania this includes freight operators GFR, Servtrans, TFG, Unifertrans and for
Bulgaria BRC and Bulmarket. 69
Union des Chemins de Fer (UIC), or International Union of Railways in English, is an international rail
transport body. The data are available at www.uic.org/spip.php?rubrique1410. Annual data was not
available for 2010, which explains why the analysis ends in 2009. 70
The data for EU are based on the rail operators included in UIC data. For Germany this is Deutsche
Bahn (DB), for Poland Polskie Koleje Panstwowe (PKP) and Polskie Linie Kolejowe (PLK), and for
Slovenia Slovenske Železnice (SZ).
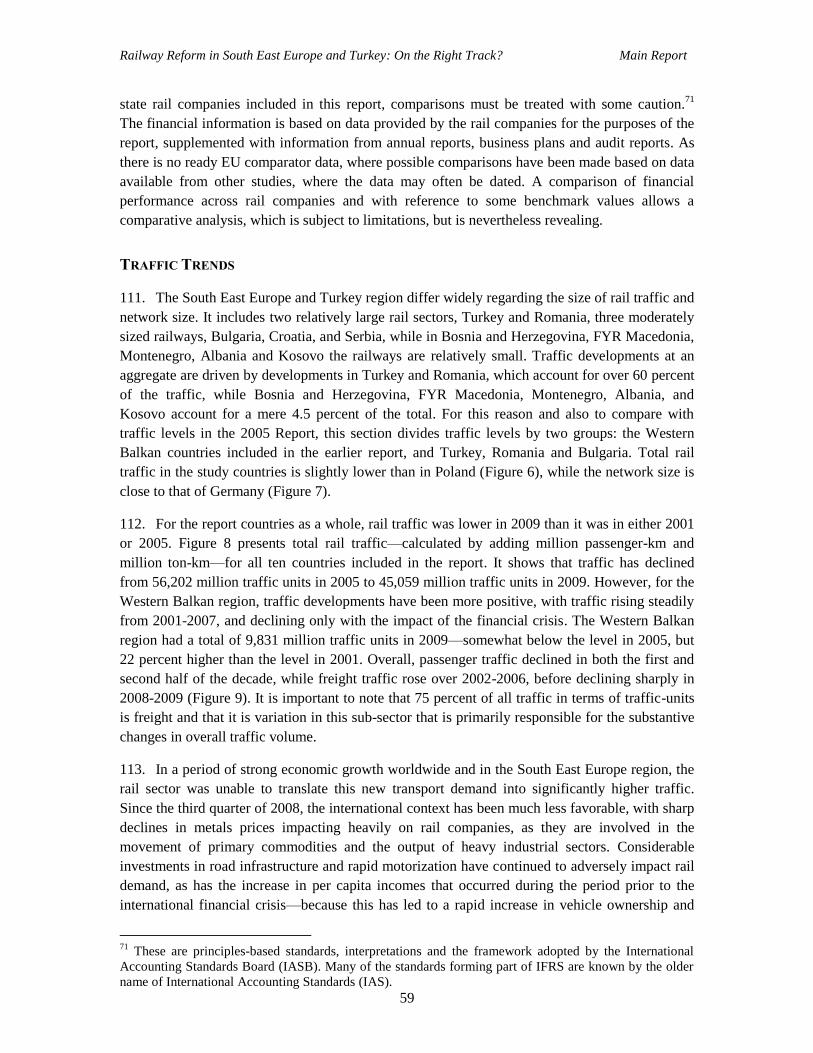
Railway Reform in South East Europe and Turkey: On the Right Track? Main Report
59
state rail companies included in this report, comparisons must be treated with some caution.71
The financial information is based on data provided by the rail companies for the purposes of the
report, supplemented with information from annual reports, business plans and audit reports. As
there is no ready EU comparator data, where possible comparisons have been made based on data
available from other studies, where the data may often be dated. A comparison of financial
performance across rail companies and with reference to some benchmark values allows a
comparative analysis, which is subject to limitations, but is nevertheless revealing.
TRAFFIC TRENDS
111. The South East Europe and Turkey region differ widely regarding the size of rail traffic and
network size. It includes two relatively large rail sectors, Turkey and Romania, three moderately
sized railways, Bulgaria, Croatia, and Serbia, while in Bosnia and Herzegovina, FYR Macedonia,
Montenegro, Albania and Kosovo the railways are relatively small. Traffic developments at an
aggregate are driven by developments in Turkey and Romania, which account for over 60 percent
of the traffic, while Bosnia and Herzegovina, FYR Macedonia, Montenegro, Albania, and
Kosovo account for a mere 4.5 percent of the total. For this reason and also to compare with
traffic levels in the 2005 Report, this section divides traffic levels by two groups: the Western
Balkan countries included in the earlier report, and Turkey, Romania and Bulgaria. Total rail
traffic in the study countries is slightly lower than in Poland (Figure 6), while the network size is
close to that of Germany (Figure 7).
112. For the report countries as a whole, rail traffic was lower in 2009 than it was in either 2001
or 2005. Figure 8 presents total rail traffic—calculated by adding million passenger-km and
million ton-km—for all ten countries included in the report. It shows that traffic has declined
from 56,202 million traffic units in 2005 to 45,059 million traffic units in 2009. However, for the
Western Balkan region, traffic developments have been more positive, with traffic rising steadily
from 2001-2007, and declining only with the impact of the financial crisis. The Western Balkan
region had a total of 9,831 million traffic units in 2009—somewhat below the level in 2005, but
22 percent higher than the level in 2001. Overall, passenger traffic declined in both the first and
second half of the decade, while freight traffic rose over 2002-2006, before declining sharply in
2008-2009 (Figure 9). It is important to note that 75 percent of all traffic in terms of traffic-units
is freight and that it is variation in this sub-sector that is primarily responsible for the substantive
changes in overall traffic volume.
113. In a period of strong economic growth worldwide and in the South East Europe region, the
rail sector was unable to translate this new transport demand into significantly higher traffic.
Since the third quarter of 2008, the international context has been much less favorable, with sharp
declines in metals prices impacting heavily on rail companies, as they are involved in the
movement of primary commodities and the output of heavy industrial sectors. Considerable
investments in road infrastructure and rapid motorization have continued to adversely impact rail
demand, as has the increase in per capita incomes that occurred during the period prior to the
international financial crisis—because this has led to a rapid increase in vehicle ownership and
71
These are principles-based standards, interpretations and the framework adopted by the International
Accounting Standards Board (IASB). Many of the standards forming part of IFRS are known by the older
name of International Accounting Standards (IAS).
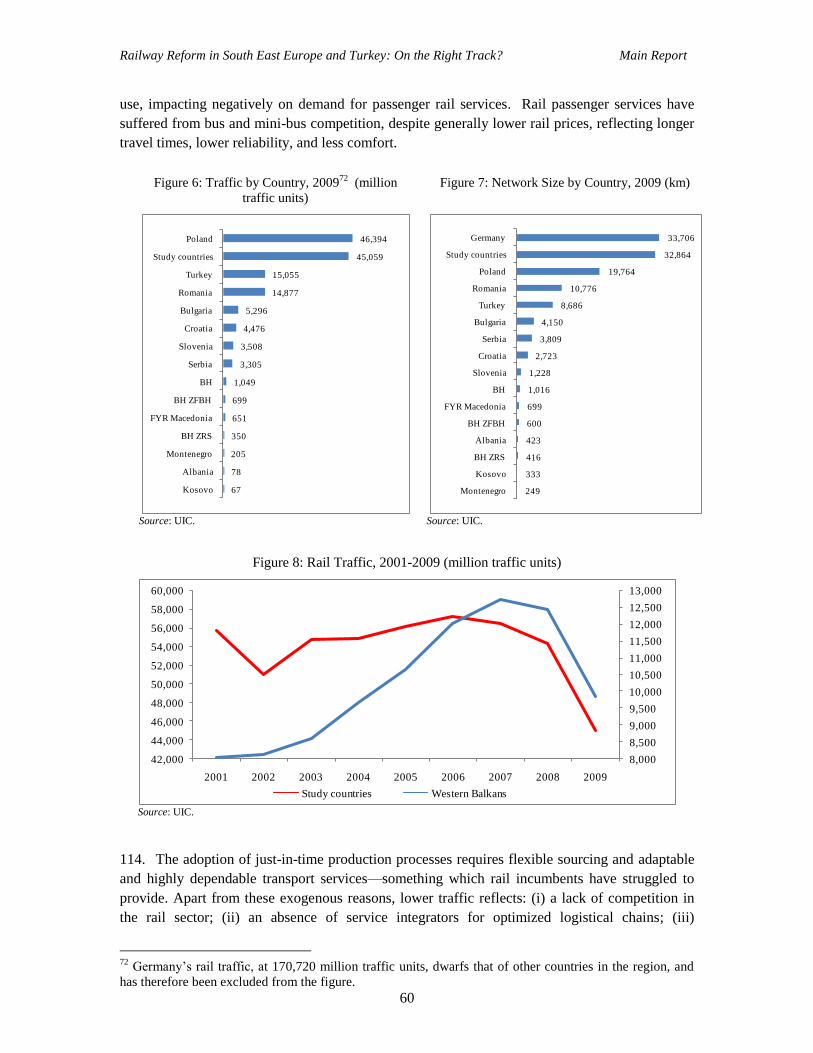
Railway Reform in South East Europe and Turkey: On the Right Track? Main Report
60
use, impacting negatively on demand for passenger rail services. Rail passenger services have
suffered from bus and mini-bus competition, despite generally lower rail prices, reflecting longer
travel times, lower reliability, and less comfort.
Figure 6: Traffic by Country, 200972
(million
traffic units)
Figure 7: Network Size by Country, 2009 (km)
Source: UIC. Source: UIC.
Figure 8: Rail Traffic, 2001-2009 (million traffic units)
Source: UIC.
114. The adoption of just-in-time production processes requires flexible sourcing and adaptable
and highly dependable transport services—something which rail incumbents have struggled to
provide. Apart from these exogenous reasons, lower traffic reflects: (i) a lack of competition in
the rail sector; (ii) an absence of service integrators for optimized logistical chains; (iii)
72
Germany‘s rail traffic, at 170,720 million traffic units, dwarfs that of other countries in the region, and
has therefore been excluded from the figure.
67
78
205
350
651
699
1,049
3,305
3,508
4,476
5,296
14,877
15,055
45,059
46,394
Kosovo
Albania
Montenegro
BH ZRS
FYR Macedonia
BH ZFBH
BH
Serbia
Slovenia
Croatia
Bulgaria
Romania
Turkey
Study countries
Poland
249
333
416
423
600
699
1,016
1,228
2,723
3,809
4,150
8,686
10,776
19,764
32,864
33,706
Montenegro
Kosovo
BH ZRS
Albania
BH ZFBH
FYR Macedonia
BH
Slovenia
Croatia
Serbia
Bulgaria
Turkey
Romania
Poland
Study countries
Germany
8,000
8,500
9,000
9,500
10,000
10,500
11,000
11,500
12,000
12,500
13,000
42,000
44,000
46,000
48,000
50,000
52,000
54,000
56,000
58,000
60,000
2001 2002 2003 2004 2005 2006 2007 2008 2009
Study countries Western Balkans

Railway Reform in South East Europe and Turkey: On the Right Track? Main Report
61
fragmented cross-border services with delays at frontiers; (iv) limited attention to customer care;
(v) weak reliability and punctuality; (vi) lack of a one-stop-shop in path allocation, cargo tracing,
and handling; and (vii) a non-transparent cost structure on international corridors.73
This has led
the rail sector to focus on traditional transportation of bulky products, with limited intermodal
transport developing in order to capture other niches—the high value-added services are thus
passing by most state rail incumbents.
Figure 9: Passenger versus Freight Traffic, 2001-2009 (in units indicated)
Source: UIC.
115. Total rail traffic has declined much more sharply in the ten study countries than in the EU
over 2005-2009. Setting traffic in 2005 to 100 reveals that EU traffic grew modestly over the
following three years and declined to 93 in 2009, representing a 7 percent decline. For the report
countries, traffic declined by 20 percent over the same five-year period (Figure 10). However, if
the traffic of the Western Balkan countries is separated from that of Romania, Bulgaria and
Turkey, the trend is much more positive, with traffic rising strongly in 2006 and 2007, before
declining the next two years (Figure 11). As a whole, traffic declined by 8 percent, comparable to
the decline in the EU. While Turkey‘s traffic rose by 8 percent, Romania‘s rail traffic fell by 38
percent, and Bulgaria‘s declined by 30 percent.
116. The EU experienced positive passenger traffic growth over 2005-2009, but this was not the
case for the report countries. Over this five-year period, EU passenger traffic grew by 9 percent,
while it declined by 9 percent for South East Europe (Figure 12); the Western Balkans saw a 12
percent rise in passenger traffic, while traffic for Romania, Bulgaria and Turkey declined by 12
percent (Figure 13). For the Western Balkan countries, this reverses declining passenger traffic in
the first half of the decade, and is driven mainly by Croatia. For most railways, with the
exception of Croatia, Bosnia and Herzegovina‘s ŢFBH, FYR Macedonia, and Turkey, passenger
traffic declined over 2005-2009. In the case of Albania, which has no international passenger
services, traffic plummeted by 128 percent over 2005-2009, albeit from a low base.
73
These factors were identified for explaining the decline in rail traffic in the EU between 1995-2001, but
are also applicable to the South East Europe rail sector. See Loris Di Pietrantonio and Jacques Pelkmans
(2004), The Economics of EU Railway Reform. Bruges European Economic Policy Briefings N° 8, Bruges
September 2004.
15,000
16,000
17,000
18,000
19,000
20,000
21,000
22,000
23,000
20,000
22,000
24,000
26,000
28,000
30,000
32,000
34,000
36,000
38,000
40,000
2001 2002 2003 2004 2005 2006 2007 2008 2009
Passen
ger traffic (million p
ass-km)
Fre
igh
t tr
affi
c (m
illi
on
to
n-k
m)
Freight Passenger

Railway Reform in South East Europe and Turkey: On the Right Track? Main Report
62
Figure 10: EU and Report Countries – Total Traffic
(2005=100)
Figure 11: Western Balkans and Romania,
Bulgaria, Turkey – Total Traffic ( 2005=100)
Source: UIC. Source: UIC.
Figure 12: EU and Report Countries – Passenger
Traffic (2005=100)
Figure 13: Western Balkans and Romania,
Bulgaria, Turkey – Passenger Traffic (2005=100)
Source: UIC. Source: UIC.
Figure 14: EU and Report Countries – Freight
Traffic (2005=100)
Figure 15: Western Balkans and Romania, Bulgaria
Turkey – Freight Traffic (2005=100)
Source: UIC. Source: UIC.
70
80
90
100
110
120
2005 2006 2007 2008 2009
EU-27 Study countries
70
80
90
100
110
120
130
2005 2006 2007 2008 2009
Western Balkans Romania, Bulgaria, Turkey
90
95
100
105
110
115
2005 2006 2007 2008 2009
EU-27 Study countries
80
85
90
95
100
105
110
115
120
2005 2006 2007 2008 2009
Western Balkans Romania, Bulgaria, Turkey
60
65
70
75
80
85
90
95
100
105
110
2005 2006 2007 2008 2009
EU-27 Study countries
60
70
80
90
100
110
120
130
2005 2006 2007 2008 2009
Western Balkans Romania, Bulgaria, Turkey

Railway Reform in South East Europe and Turkey: On the Right Track? Main Report
63
Figure 16: Change in Passenger Traffic, 2000-
200474
(percentages)
Figure 17: Change in Passenger Traffic, 2005-2009
(percentages)
Source: UIC. Source: UIC.
Figure 18: Passengers per Train, 2008 Figure 19: Average Trip Length, 2009 (km)
Source: State rail operators. Source: UIC.
74
For Kosovo and Montenegro, the date is for 2001-2004.
-47
-44
-29
-29
-26
-24
-16
-11
-10
0
13
111
FYR Macedonia
Montenegro
Serbia
Albania
Romania
Bulgaria
Kosovo
BH ZRS
Turkey
Croatia
BH
BH ZFBH
-128
-46
-33
-27
-21
-19
-11
6
6
31
32
39
Albania
Serbia
Romania
BH ZRS
Montenegro
Kosovo
Bulgaria
BH
Turkey
Croatia
BH ZFBH
FYR Macedonia
30
38
42
50
91
94
96
97
104
113
215
BH ZFBH
BH ZRS
Serbia
Kosovo
Albania
Croatia
FYR Macedonia
Bulgaria
Romania
Montenegro
Turkey
25
40
43
50
51
61
67
67
68
70
74
78
91
96
101
Croatia
Germany
Kosovo
Albania
Slovenia
ZRS
Turkey
BH
Bulgaria
Serbia
ZFBH
Poland
Romania
Montenegro
FYR Macedonia
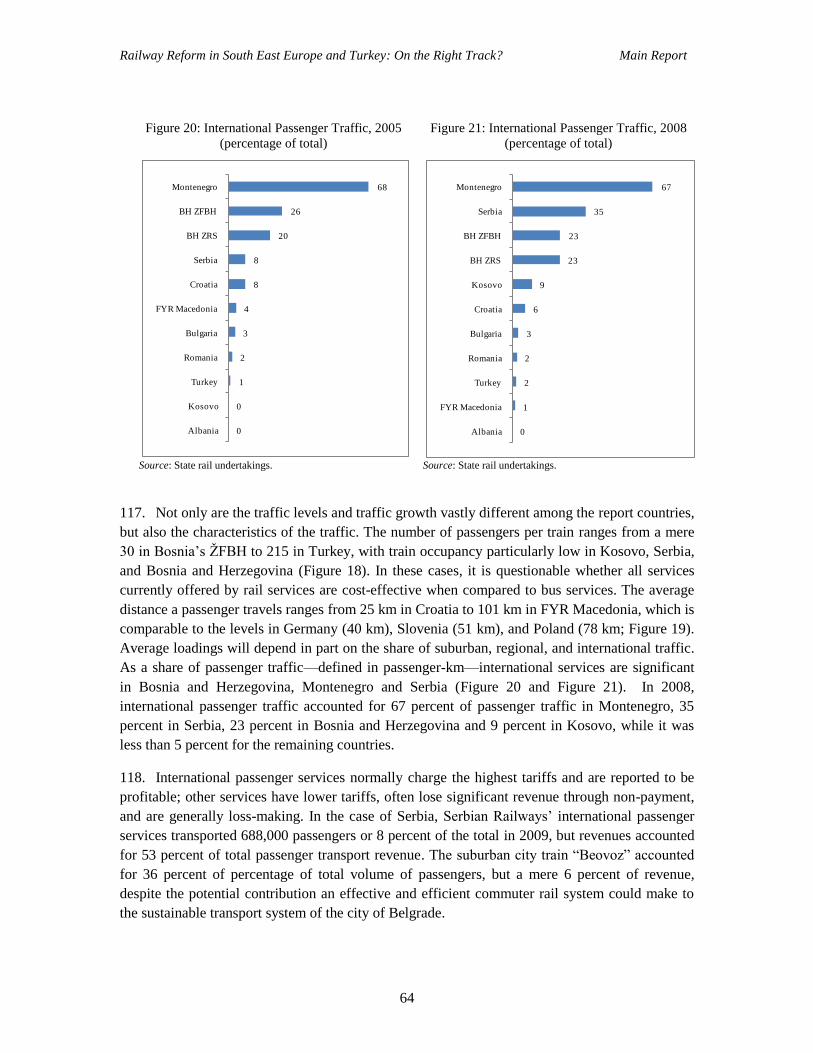
Railway Reform in South East Europe and Turkey: On the Right Track? Main Report
64
Figure 20: International Passenger Traffic, 2005
(percentage of total)
Figure 21: International Passenger Traffic, 2008
(percentage of total)
Source: State rail undertakings. Source: State rail undertakings.
117. Not only are the traffic levels and traffic growth vastly different among the report countries,
but also the characteristics of the traffic. The number of passengers per train ranges from a mere
30 in Bosnia‘s ŢFBH to 215 in Turkey, with train occupancy particularly low in Kosovo, Serbia,
and Bosnia and Herzegovina (Figure 18). In these cases, it is questionable whether all services
currently offered by rail services are cost-effective when compared to bus services. The average
distance a passenger travels ranges from 25 km in Croatia to 101 km in FYR Macedonia, which is
comparable to the levels in Germany (40 km), Slovenia (51 km), and Poland (78 km; Figure 19).
Average loadings will depend in part on the share of suburban, regional, and international traffic.
As a share of passenger traffic—defined in passenger-km—international services are significant
in Bosnia and Herzegovina, Montenegro and Serbia (Figure 20 and Figure 21). In 2008,
international passenger traffic accounted for 67 percent of passenger traffic in Montenegro, 35
percent in Serbia, 23 percent in Bosnia and Herzegovina and 9 percent in Kosovo, while it was
less than 5 percent for the remaining countries.
118. International passenger services normally charge the highest tariffs and are reported to be
profitable; other services have lower tariffs, often lose significant revenue through non-payment,
and are generally loss-making. In the case of Serbia, Serbian Railways‘ international passenger
services transported 688,000 passengers or 8 percent of the total in 2009, but revenues accounted
for 53 percent of total passenger transport revenue. The suburban city train ―Beovoz‖ accounted
for 36 percent of percentage of total volume of passengers, but a mere 6 percent of revenue,
despite the potential contribution an effective and efficient commuter rail system could make to
the sustainable transport system of the city of Belgrade.
0
0
1
2
3
4
8
8
20
26
68
Albania
Kosovo
Turkey
Romania
Bulgaria
FYR Macedonia
Croatia
Serbia
BH ZRS
BH ZFBH
Montenegro
0
1
2
2
3
6
9
23
23
35
67
Albania
FYR Macedonia
Turkey
Romania
Bulgaria
Croatia
Kosovo
BH ZRS
BH ZFBH
Serbia
Montenegro

Railway Reform in South East Europe and Turkey: On the Right Track? Main Report
65
Figure 22: Change in Freight Traffic, 2000-200475
(percentages)
Figure 23: Change in Freight Traffic, 2005-2009
(percentages)
Source: UIC. Source: UIC.
119. Freight traffic declined slightly more in the report countries than in the EU over 2005-2009.
Over this five-year period freight traffic fell by 23 percent in the EU, while it declined by a
quarter in South East Europe and Turkey (Figure 14). For the Western Balkan countries, freight
traffic in 2007 was 22 percent higher than in 2005, while in the EU traffic had declined to the
same level as in 2005. Traffic in Romania, Bulgaria, and Turkey declined rapidly throughout
2005-2009, reflecting developments in the first two of these countries (Figure 15). While the first
half of the decade saw positive freight traffic volume growth in all countries with the exception of
Romania and Bulgaria (Figure 22), in the second half of the decade traffic growth was positive
only for Turkey, Albania, and Kosovo (Figure 23). There is considerable dispersion in declines
in freight traffic, varying from 6 percent for FYR Macedonia to a massive 44 percent in Romania.
For the smaller railways, the closing of a major industrial facility—such as a mine or steel
works—can have a substantial effect on a railway‘s total traffic. However, even for Bulgaria‘s
BDZ, the crisis in the metallurgical company Kremikovtzi had a large impact on overall traffic
volumes in 2009.76
120. Freight traffic varies considerably among the ten countries, not only in terms of levels but
also the average haul and composition. Table 5 provides a summary of freight volumes, haul
length and composition of traffic. Although the Western Balkan railways suffer from
fragmentation due to the relatively small size of the rail networks, the average haul in both
Bulgaria and Romania are actually below those of Croatia and Serbia—despite the former having
vastly more extensive rail networks. This can be explained in part by the importance of
75
For Kosovo the data are for 2001-2004. 76
The decision to declare Bulgaria‘s largest steelmaker Kremikovtzi bankrupt was reached on May 31,
2010, following the numerous unsuccessful attempts of the mill's creditors and the government to reach an
agreement on a plan to save the mill,
-3
0
4
15
19
36
48
72
166
287
321
448
Romania
Bulgaria
Macedonia
Turkey
Albania
Kosovo
Croatia
Montenegro
Serbia
BH ZFBH
BH
BH ZRS
-44
-39
-22
-21
-21
-16
-13
-7
-6
8
77
183
Romania
Bulgaria
Serbia
BH ZRS
Montenegro
BH
BH ZFBH
Croatia
FYR Macedonia
Turkey
Albania
Kosovo
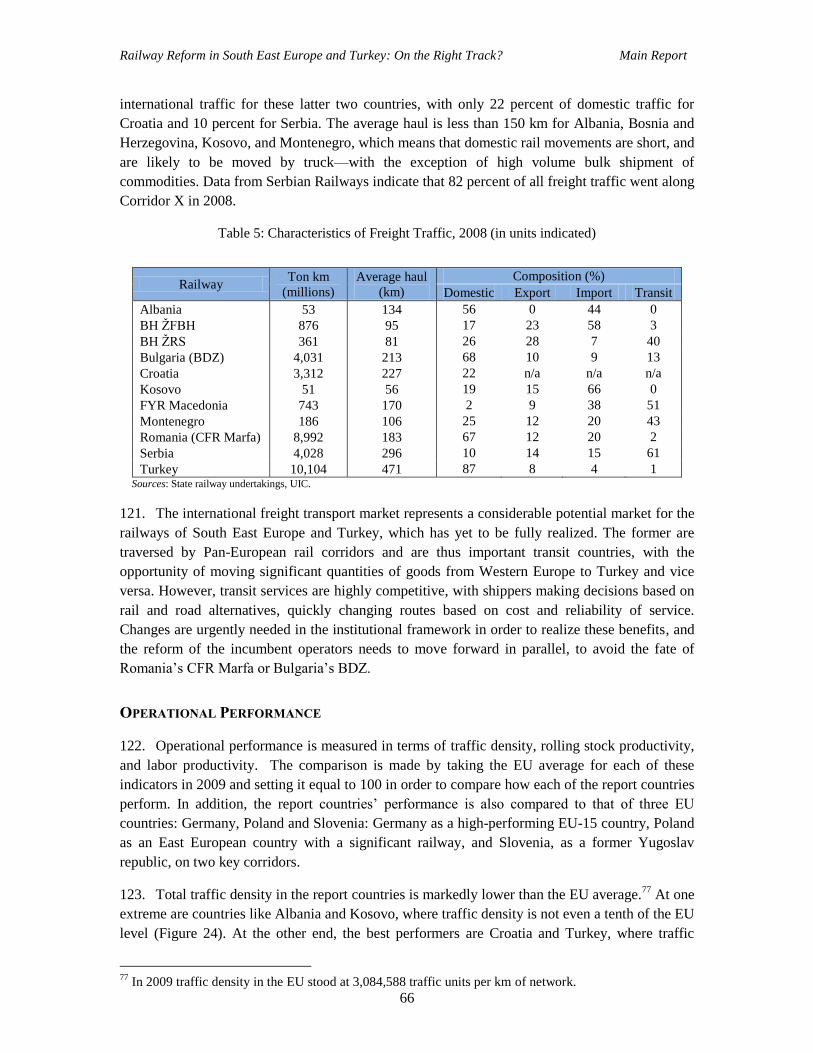
Railway Reform in South East Europe and Turkey: On the Right Track? Main Report
66
international traffic for these latter two countries, with only 22 percent of domestic traffic for
Croatia and 10 percent for Serbia. The average haul is less than 150 km for Albania, Bosnia and
Herzegovina, Kosovo, and Montenegro, which means that domestic rail movements are short, and
are likely to be moved by truck—with the exception of high volume bulk shipment of
commodities. Data from Serbian Railways indicate that 82 percent of all freight traffic went along
Corridor X in 2008.
Table 5: Characteristics of Freight Traffic, 2008 (in units indicated)
Railway Ton km
(millions)
Average haul
(km)
Composition (%)
Domestic Export Import Transit
Albania 53 134 56 0 44 0
BH ŢFBH 876 95 17 23 58 3
BH ŢRS 361 81 26 28 7 40
Bulgaria (BDZ) 4,031 213 68 10 9 13
Croatia 3,312 227 22 n/a n/a n/a
Kosovo 51 56 19 15 66 0
FYR Macedonia 743 170 2 9 38 51
Montenegro 186 106 25 12 20 43
Romania (CFR Marfa) 8,992 183 67 12 20 2
Serbia 4,028 296 10 14 15 61
Turkey 10,104 471 87 8 4 1 Sources: State railway undertakings, UIC.
121. The international freight transport market represents a considerable potential market for the
railways of South East Europe and Turkey, which has yet to be fully realized. The former are
traversed by Pan-European rail corridors and are thus important transit countries, with the
opportunity of moving significant quantities of goods from Western Europe to Turkey and vice
versa. However, transit services are highly competitive, with shippers making decisions based on
rail and road alternatives, quickly changing routes based on cost and reliability of service.
Changes are urgently needed in the institutional framework in order to realize these benefits, and
the reform of the incumbent operators needs to move forward in parallel, to avoid the fate of
Romania‘s CFR Marfa or Bulgaria‘s BDZ.
OPERATIONAL PERFORMANCE
122. Operational performance is measured in terms of traffic density, rolling stock productivity,
and labor productivity. The comparison is made by taking the EU average for each of these
indicators in 2009 and setting it equal to 100 in order to compare how each of the report countries
perform. In addition, the report countries‘ performance is also compared to that of three EU
countries: Germany, Poland and Slovenia: Germany as a high-performing EU-15 country, Poland
as an East European country with a significant railway, and Slovenia, as a former Yugoslav
republic, on two key corridors.
123. Total traffic density in the report countries is markedly lower than the EU average.77
At one
extreme are countries like Albania and Kosovo, where traffic density is not even a tenth of the EU
level (Figure 24). At the other end, the best performers are Croatia and Turkey, where traffic
77
In 2009 traffic density in the EU stood at 3,084,588 traffic units per km of network.

Railway Reform in South East Europe and Turkey: On the Right Track? Main Report
67
density is slightly above 50 percent of the EU average. By contrast, Slovenia has traffic density
equal to 93 percent of the EU average, which suggests that with the right set of reforms and
commercial focus it is possible for countries with a small rail network to have much higher levels
of traffic density (Box 4). Rail services are subject to economies of density, offering declining
average capital costs per unit of service and declining unit operating costs per route-kilometer
(maintenance of infrastructure and of rolling stock, fuel and crew) as turnover increases.78
Low
traffic density saddles the incumbent rail companies and infrastructure managers with high costs,
making it much more difficult to achieve good financial results.
Figure 24: Total Traffic Density, 2009 (EU=100) Figure 25: Share of Freight in Total Traffic, 2009
(percentages)
Source: UIC. Source: UIC.
124. Passenger traffic density is particularly low in the region. The structure of traffic in the
report countries differ from that of the EU, in that freight represents a much higher share of total
traffic. Figure 25 presents the share of freight in total traffic—for all countries included in the
report the share of freight traffic is higher than the EU average. In general, freight traffic density
is much higher than passenger traffic density among the report countries: Bosnia and
Herzegovina, Croatia, and Turkey have freight traffic densities that are equal to three quarters of
the EU average (Figure 26), while passenger traffic density in these countries is very low (Figure
27). Passenger traffic density is under 50 percent of the EU average for all report countries, and
under 25 percent for six of the report countries (Montenegro, FYR Macedonia, Serbia, Albania,
Bosnia and Herzegovina, and Kosovo). Countries like Slovenia—with high total traffic density
and a high share of freight services—compensate low passenger traffic density with freight traffic
density which exceeds EU levels.
78
Loris Di Pietrantonio and Jacques Pelkmans (2004), The Economics of EU Railway Reform. Bruges
European Economic Policy Briefings N° 8, September 2004.
6
7
27
27
28
30
33
38
41
45
53
56
76
93
100
164
Albania
Kosovo
Montenegro
BH ZRS
Serbia
FYROM
BH
BH ZFBH
Bulgaria
Romania
Croatia
Turkey
Poland
Slovenia
EU
Germany
42
47
51
51
55
59
59
64
65
76
76
76
82
92
94
95
EU
Romania
Montenegro
Bulgaria
Germany
Albania
Croatia
Turkey
Poland
Slovenia
Kosovo
FYROM
Serbia
BH ZRS
BH
BH ZFBH

Railway Reform in South East Europe and Turkey: On the Right Track? Main Report
68
125. A rail network which is dedicated to freight has lower safety requirements than a passenger
network, and markedly less again than a higher speed passenger network, and is therefore far less
costly than a double service network. All countries in the report have double service networks,
unlike the USA, considerably raising infrastructure costs. In a country like Bosnia and
Herzegovina, where freight services account for 94 percent of traffic, simply maintaining the
double service network imposes a high cost on infrastructure for very low passenger traffic—
passenger traffic density is only 3 percent of the EU average. This raises serious questions about
the financial viability of network wide rail passenger services, particularly those requiring higher
speeds.
126. With the exception of Turkey and Croatia, labor productivity in the report countries is less
than 50 percent of the EU average. Labor productivity, measured as the number of traffic units
per employee, was less than a third of the EU average in Bosnia and Herzegovina, Serbia,
Kosovo, Bulgaria, Montenegro, and Albania in 2009 (Figure 28). Labor productivity levels were
low even before the financial crisis, and reflect a failure of the state incumbents to adjust
employment levels to the traffic levels of the decade. Where there have been labor reductions,
this has not significantly increased labor productivity due to declining traffic. Labor productivity
vis-à-vis the EU average was higher in 2009 than in 2005 for Croatia, FYR Macedonia,
Montenegro, Turkey, and Kosovo—but despite this with the exception of Turkey, overall labor
productivity remains low, and thus a considerable financial burden for the rail incumbents.
Figure 26: Freight Traffic Density, 2009
(EU=100)
Figure 27: Passenger Traffic Density, 2009
(EU=100)
Source: UIC. Source: UIC.
127. New technologies and new forms of work organization in rail companies have tended to
result in job reductions worldwide, with the biggest cuts among track maintenance staff. While
the precise number of staff required needs to be determined on a case by case basis, it is clear that
for most countries in South East Europe, staffing levels have not adjusted enough to match
permanently lower traffic volumes than in the 1990s. There is therefore a need to formulate labor
adjustment programs based on cooperation with trade unions, focusing to the extent possible on
8
12
32
39
42
55
56
60
75
76
86
87
100
118
169
216
Albania
Kosovo
Montenegro
Romania (CFR Marfa)
Bulgaria (BDZ)
FYROM
Serbia
BH ZRS
Croatia
BH
BH ZFBH
Turkey
EU
Poland
Slovenia
Germany
3
3
3
4
4
9
12
23
29
31
34
38
38
46
100
127
Kosovo
BH ZFBH
BH
BH ZRS
Albania
Serbia
FYROM
Montenegro
Bulgaria (BDZ)
Romania (CFR Calatori)
Turkey
Croatia
Slovenia
Poland
EU
Germany

Railway Reform in South East Europe and Turkey: On the Right Track? Main Report
69
voluntary separations based on incentive schemes and redeployment, combined with
retrenchment. One result of low labor productivity is the high ratio of the wage bill to operating
revenues for the state rail incumbents. One recent example of a major cut in staffing levels is in
Romania, where the government decided in 2010 to cut 10,300 positions in the state rail
incumbents in order to reduce costs and cope with declining freight and passenger volumes—with
6,700 job cuts for CFR Marfa, the freight incumbent. In August 2010, Romania‘s transport
ministry announced an additional 12,800 job cuts in the rail sector—an indication of the gravity
of the financial position of the rail incumbents.
128. With the exception of Turkey, which benefits from longer haul lengths, rolling stock
productivity for all report countries is significantly below the EU average. On average, freight
wagon productivity was only 56 percent of the EU level in 2009, although there is considerable
diversity (Figure 29). Turkey‘s passenger coach productivity is comparable to that of the EU and
much higher than Poland and Slovenia, while Bosnia and Herzegovina‘s is less than 10 percent of
the EU average (Figure 30). Meanwhile, Turkey‘s locomotive productivity is 9 percent higher
than the EU average, while in the case of Albania it is a mere 5 percent of the EU average (Figure
31). In general, rolling stock productivity is adversely affected by low fleet availability, reflecting
the age and the reliability of the existing fleet. The operational fleet is generally a fraction of the
total fleet. To illustrate this point, in 2008, only 54 percent of Serbian Railways‘ freight wagons
and 28 percent of passenger coaches were operational—and the older stock is more expensive to
maintain and frequently unreliable. For a number of state rail incumbents, there is a strong case
for scrapping life-expired rolling stock and replacing it, when justified, with more reliable stock
in a phased program of replacement.
Table 6: Summary of Operational Performance (EU 27=100), 2009
Country Traffic
Density
Productivity
Average Coach Wagon Locomotive Labor
Turkey 56 100 89 109 84 88
Croatia 53 85 64 68 58 66
FYR Macedonia 30 34 61 47 38 42
Romania 45 48 31 29 40 39
Bulgaria 41 41 30 34 28 35
Serbia 28 18 49 38 29 32
Kosovo 7 51 36 28 28 30
Montenegro 27 36 24 24 20 26
BH 33 8 35 24 23 25
Albania 6 9 14 5 7 8 Sources: UIC, Kosovo Railways; World Bank calculations.
129. Table 6 presents a summary of operational performance, ranking the countries on five
productivity measures. Turkey scores the best, and on many productivity measures is close to the
EU average—and it also experienced positive traffic growth over 2005-2009. Croatia comes in a
clear second, with productivity indicators that in all cases are above 50 percent of the EU average.
In some areas, such as passenger coach productivity, Croatia exceeds the performance of Poland

Railway Reform in South East Europe and Turkey: On the Right Track? Main Report
70
and Slovenia, while having seen positive traffic growth in the last five years. Conversely,
Albania, Bosnia and Herzegovina, and Montenegro score poorly on the majority of these
indicators, with the rest of the countries somewhere in between. The EU countries—Romania and
Bulgaria—do not perform better than the Western Balkan countries, and they do considerably
worse than Croatia and Turkey on all productivity measures.
Box 3: Introduction of Private Competition in Poland’s Freight Railway Sector
PKP Group is a Polish conglomerate founded in 2001 from the former single national rail operator,
Polskie Koleje Państwowe (PKP; Polish State Railways). Each company is largely autonomous as a legal
entity with its own statement of accounts. Among them, PKP Cargo is the operator for freight transport
services. Since 2003, rail liberalization has brought the transport market private sector share to 32.5
percent of the total volume of freight measured in ton-km and 54.9 percent of the total volume of tons
transported in Poland. In 2008, PKP Cargo transported more tons than the private operators.
Railway Freight Market Share in Poland (transported tons)
This is one of the largest private sector participations in the European rail transport market and it has had
a positive role in putting pressure on the state-owned railway operator to improve its performance. At the
same time, the successful presence of private railway operators in the market is a serious reason for the
government to question maintaining state-owned railway operators in the market.
The 2005-2008 data show strong pressure on PKP Cargo‘s financial viability. During 2005-2007,
profitability was in the range of 0.05-0.17 euro cents per net-ton-km transported; and in 2008, the
average unit cost was higher than the unit revenue by 0.19 euro cents. The average unit cost/unit revenue
ratio demonstrates that PKP Cargo‘s market position is fragile and actions are needed to target higher
revenue/cost ratios and to increase its efficiency to be able to renew its obsolete assets and to remain
competitive in Polish and European transport markets.
The transport market decreased from 144.7 million tons in 2005 to 134.4 million tons in 2008; as a
consequence, the locomotive and wagon fleet was reduced accordingly, the staff number was reduced by
more than 4,000 persons, and the number of operated trains was also reduced (lower charge paid for
utilization of infrastructure). The ratio of staff cost in total costs is below the 2008 European average at
31 percent of total cost, compared with 28 percent in 2005. The working ratio is less than during the
whole period, illustrating that the costs were adjusting to market functions; it has gone from 90 percent in
2005 to 99 percent in 2008. Finally, PKP Cargo registered losses of Euro 148.2 million in 2007 and Euro
132.8 million in 2008. PKP Cargo should make efforts to reduce costs to be able to recapture the lost
volumes of traffic. Furthermore, PKP Group should look carefully at the negative trend of its general
performance in 2008.
Source: World Bank (2011), Poland Transport Policy Note-Toward a Sustainable Land Transport Sector, Sustainable
Development Department, Europe and Central Asia Region, Report No. 59715-PL. Washington DC: World Bank.
66.25%
58.24%54.40% 53.09% 51.58% 51.16%
45.08%
33.75%
41.76%45.60% 46.91% 48.42% 48.84%
54.92%
20%
30%
40%
50%
60%
70%
2003 2004 2005 2006 2007 2008 2009
Tons PKP Cargo Tons Private Operators

Railway Reform in South East Europe and Turkey: On the Right Track? Main Report
71
Figure 28: Labor Productivity, 2009 (EU=100) Figure 29: Freight Wagon Productivity, 2009
(EU=100)
Source: UIC. Source: UIC.
Figure 30: Passenger Coach Productivity, 2009
(EU=100)
Figure 31: Locomotive Productivity, 2009
(EU=100)
Source: UIC. Source: UIC.
7
17
20
23
28
28
29
29
38
40
58
69
74
84
100
119
Albania
BH ZRS
Montenegro
BH
Bulgaria
Kosovo
Serbia
BH ZFBH
FYROM
Romania
Croatia
Poland
Slovenia
Turkey
EU
Germany
14
21
24
30
31
35
36
49
52
61
64
67
89
100
111
134
Albania
BH ZRS
Montenegro
Bulgaria
Romania
BH
Kosovo
Serbia
BH ZBH
FYROM
Croatia
Poland
Turkey
EU
Slovenia
Germany
5
8
9
18
18
28
34
36
41
48
57
58
85
100
100
100
BH ZRS
BH
Albania
BH ZBH
Serbia
Kosovo
FYROM
Montenegro
Bulgaria
Romania
Slovenia
Poland
Croatia
Turkey
EU
Germany
5
19
24
24
28
28
29
34
38
47
50
68
84
100
109
128
Albania
BH ZRS
Montenegro
BH
BH ZBH
Kosovo
Romania
Bulgaria
Serbia
FYROM
Poland
Croatia
Slovenia
EU
Turkey
Germany
Railway Reform in South East Europe and Turkey: On the Right Track? Main Report
72
Box 4: Slovenian Railways
Slovenian Railways is a wholly state-owned holding company created in 1991 with six subsidiaries owned
completely or in majority by Slovenian Railways (Traffic Management, Infrastructure Maintenance, Freight
Transport, Passenger Transport, Traction and Technical Vehicle Management). It is the only passenger and
freight operator in the country and an essential link in the transport chain at the junction of Pan-European
Corridors V and X.
The country‘s privileged location allows Slovenian Railways to connect freight currents from North Western
and Central Europe to South East Europe and Turkey, by using logistical centers situated in Ljubljana, Celje,
Maribor and Koper. More than 90 percent of freight traffic (ton-km) can be classified as international, and
rail transport is dominated by freight. To help Slovenian Railways expand its sales network in key markets
and promote the internationalization of business, two new representative offices have been opened in 2010
in the Czech Republic and Bulgaria.
In terms of financial results, the net profit of the company in 2008 was over Euro 1 million. However, the
net loss for both passenger and freight transport was around Euro 14 million, and the net benefit of
Infrastructure was Euro 7 million. These figures include the revenues from public services and state support,
which represent about 50 percent of passenger revenues and about 90 percent of infrastructure ones.
Productivity indicators place Slovenia ahead of South East Europe countries and not far from the EU
average.
Freight Transport provides not only a comprehensive logistical service in terms of conventional transport
(wagons, fuel tanks, dangerous goods), but also in combined transport, for instance, containers, swap bodies
and trucks. Monitoring services, transport planning and safety advices for the loading and conveying of the
goods are also included within the freight group activities.
More specifically, and through an innovative internet service called ―e-freight transport‖, Slovenian
Railways also offers the possibility to directly access the information system by means of two services. The
first service is related to the procurement of wagons for loading of cargo on freight stations of Slovenian
Railways. Thus, the wagons can be ordered, and the order can be checked or canceled at any time. It is also
possible to check the status by stations. The second service allows the client to monitor the consignments or
wagons while they are in Slovenia or in Austria, Italy, France, Germany, the Netherlands, Hungary and
Slovakia. Apart from the information contained in the bill of freight, other information is available, such as
the location and status of consignments. Data are accessible in real time as each event is immediately
recorded in the information system.
Concerning combined transport, Slovenian Railways offers comprehensive logistical services. In the
accompanied combined transport the driver of the road vehicle travels along with the vehicle in a
comfortable passenger wagon and the trucks are loaded and unloaded by a special portable loading platform
at the head of the train. The unaccompanied combined transport conveys the units by rail, inland waterway
or by sea between terminals and the distribution to and from the container terminals is done by road. The
container terminal in Ljubljana and the other transfer stations in Celje and Maribor organize the combined
transports inland and internationally and take care of the intermodal transport units by, for example,
consolidating the goods, preparing transit declarations and inspecting and repairing the units. All activities
are connected to the Intercontainer branch office.
Finally, in the context of an intermodal strategy, Slovenian Railways has developed a door-to-door delivery
service called SŢ-Express. It has been designed for the distribution of small consignments in Slovenia using
road transportation, and ensures that any package brought before 7pm one day will be delivered anywhere in
Slovenia the day after by midday. The program also offers personal logistic services for customers, such as
warehousing and packaging of goods, transport of original goods to collection centers and monitoring of
warehoused stocks.
Sources: World Bank, Slovenian Railways.
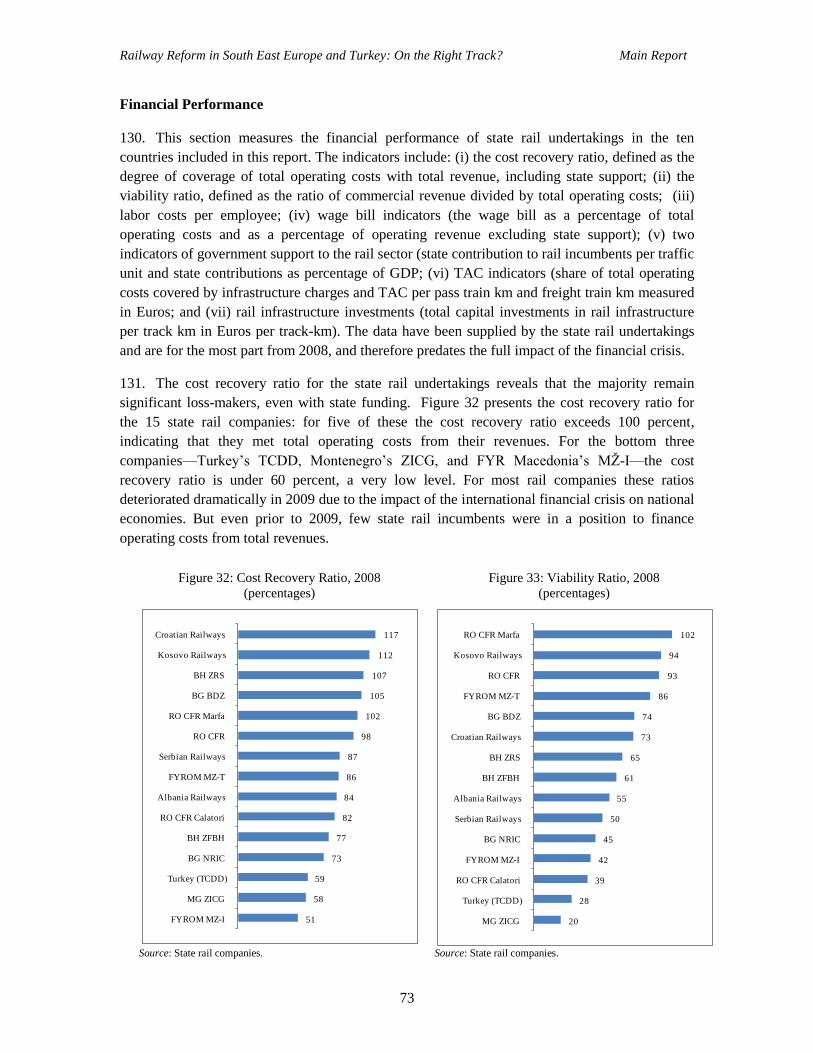
Railway Reform in South East Europe and Turkey: On the Right Track? Main Report
73
Financial Performance
130. This section measures the financial performance of state rail undertakings in the ten
countries included in this report. The indicators include: (i) the cost recovery ratio, defined as the
degree of coverage of total operating costs with total revenue, including state support; (ii) the
viability ratio, defined as the ratio of commercial revenue divided by total operating costs; (iii)
labor costs per employee; (iv) wage bill indicators (the wage bill as a percentage of total
operating costs and as a percentage of operating revenue excluding state support); (v) two
indicators of government support to the rail sector (state contribution to rail incumbents per traffic
unit and state contributions as percentage of GDP; (vi) TAC indicators (share of total operating
costs covered by infrastructure charges and TAC per pass train km and freight train km measured
in Euros; and (vii) rail infrastructure investments (total capital investments in rail infrastructure
per track km in Euros per track-km). The data have been supplied by the state rail undertakings
and are for the most part from 2008, and therefore predates the full impact of the financial crisis.
131. The cost recovery ratio for the state rail undertakings reveals that the majority remain
significant loss-makers, even with state funding. Figure 32 presents the cost recovery ratio for
the 15 state rail companies: for five of these the cost recovery ratio exceeds 100 percent,
indicating that they met total operating costs from their revenues. For the bottom three
companies—Turkey‘s TCDD, Montenegro‘s ZICG, and FYR Macedonia‘s MŢ-I—the cost
recovery ratio is under 60 percent, a very low level. For most rail companies these ratios
deteriorated dramatically in 2009 due to the impact of the international financial crisis on national
economies. But even prior to 2009, few state rail incumbents were in a position to finance
operating costs from total revenues.
Figure 32: Cost Recovery Ratio, 2008
(percentages)
Figure 33: Viability Ratio, 2008
(percentages)
Source: State rail companies. Source: State rail companies.
51
58
59
73
77
82
84
86
87
98
102
105
107
112
117
FYROM MZ-I
MG ZICG
Turkey (TCDD)
BG NRIC
BH ZFBH
RO CFR Calatori
Albania Railways
FYROM MZ-T
Serbian Railways
RO CFR
RO CFR Marfa
BG BDZ
BH ZRS
Kosovo Railways
Croatian Railways
20
28
39
42
45
50
55
61
65
73
74
86
93
94
102
MG ZICG
Turkey (TCDD)
RO CFR Calatori
FYROM MZ-I
BG NRIC
Serbian Railways
Albania Railways
BH ZFBH
BH ZRS
Croatian Railways
BG BDZ
FYROM MZ-T
RO CFR
Kosovo Railways
RO CFR Marfa

Railway Reform in South East Europe and Turkey: On the Right Track? Main Report
74
132. With one exception, state rail companies included in the report were not able to meet
operating costs from commercial revenues. Apart from Romania‘s CFR Marfa, all other state
railways‘ operating costs exceeded commercial revenues (Figure 33), with significant variation.79
To take one example, Turkey scored highly in terms of operational performance indicators, but
TCDD is unable to translate this into positive financial results, with commercial revenues equal to
only 28 percent of operating costs. In part this reflects the challenge of operating a low density
rail network, which is only 56 percent of the EU average. Profit and loss by line of business
indicate that the losses are greatest with freight services, with a cost recovery ratio of 30 percent.
Normally, freight services should be profitable, suggesting that freight tariffs and the business
model more broadly, need careful review. However, it is not just TCDD, as there are six state rail
companies for which commercial revenues account for 50 percent or less of operating costs.
Figure 34: Wage Bill as a Percentage of Operating
Costs, 2008
Figure 35: Wage Bill as a Percentage of Operating
Revenue, 2008
Source: State rail companies. Sources: State rail companies, IMF, World Bank estimates.
133. The wage bill is high for a number of the rail companies, acting as a significant financial
burden. Figure 34 presents the wage bill as a percentage of total operating cost, with three rail
companies having wage bill costs exceeding 50 percent of operating costs: Montenegro‘s ŢICG,
Bosnia and Herzegovina‘s ŢRS, and Croatian Railways. There are five rail companies for which
the wage bill is equal to or less than 30 percent, which is a reasonable benchmark figure for the
share of the wage bill in total operating costs. The remaining rail companies are in between these
two extremes, saddled with high wage costs. As a share of operating revenue, excluding state
contributions, the wage bill reached 224 percent in the case of Montenegro‘s ŢICG and 110
percent for TCDD. FYR Macedonia‘s MŢ-T and Kosovo Railways have wage bills under 30
percent of operating costs and operating revenues, and are thus good performers in relation to this
indicator. Labor costs per employee range from Euro 2,305 in Albanian Railways to Euro 18,208
79
The financial situation of CFR Marfa declined dramatically in 2009, when it posted large financial losses.
18
22
25
25
30
33
36
38
41
41
42
44
44
55
57
65
FYROM MZ-T
MG ZPCG
RO CFR Calatori
Kosovo Railways
FYROM MZ-I
BG BDZ
Albanian Railways
RO CFR
RO CFR Marfa
BG NRIC
Serbian Railways
BH ZFBH
Turkey (TCDD)
Croatian Railways
BH ZRS
MG ZICG
21
27
36
44
45
63
65
70
72
73
75
83
91
93
110
224
FYROM MZ-T
Kosovo Railways
MG ZPCG
RO CFR Marfa
BG BDZ
RO CFR Calatori
Albanian Railways
FYROM MZ-I
BH ZFBH
RO CFR
Croatian Railways
Serbian Railways
BG NRIC
BH ZRS
Turkey (TCDD)
MG ZICG

Railway Reform in South East Europe and Turkey: On the Right Track? Main Report
75
for Croatian Railways (Figure 36). For some rail companies, such as Croatian Railways and
TCDD, the high wage bill is in part the reflection of high labor costs, and not only a question of
staffing levels.
Figure 36: Labor Costs Per Employee, 2009 (Euros)
Source: State rail companies.
134. State contributions to the rail sector take a variety forms. In addition to block subsidies, as
is the case in Serbia and Albania, the state provides financing for capital investments of both
rolling stock and rail infrastructure, funds for infrastructure maintenance and repairs, payment for
the passenger service obligation (PSO), and rail company debt repayments. Excluding loan
repayment data—which is only available for Croatia, Turkey, and Romania—Figure 37 presents
state contributions in Euros per traffic unit (million pass-km plus million ton-km), ranging from
Euro 9.4/traffic unit for Turkey to a low of Euro 0.7/traffic unit for FYR Macedonia. As a
percentage of GDP, state support to the rail companies ranges from 0.05 percent of GDP in
Albania to 0.74 percent of GDP in Croatia (Figure 38). Once loan repayments are added, the total
for Croatia rises to 0.88 percent of GDP, which is the highest figure for the report countries—
although it has been declining over the last five years, down from 1.36 percent of GDP in 2005.
Although Turkey receives the highest state support to the rail sector on a traffic unit basis, TCDD
remains systematically loss-making. State contributions to the rail sector for the non-EU member
state countries included in this report depart significantly from what is allowed under EU state aid
rules (Box 5).
135. Rail infrastructure is characterized by the high ratio of fixed to marginal costs. This means
that significant volumes are required to cover costs efficiently, and infrastructure access charges
normally do not cover the full cost of infrastructure provision. The share of rail infrastructure
operating costs covered by TAC varies considerably among the report countries. If TAC is mostly
financing rail infrastructure, then it might translate into too high TAC per train-km, which could
cause traffic to shift to other modes, particularly road transport.
2,305
4,834
5,172
5,560
6,205
7,020
7,404
7,539
7,630
8,216
9,407
10,317
10,369
12,921
14,537
18,208
Albania Railways (2008)
Kosovo Railways (2008)
BG NRIC
BG BDZ
FYROM MZ-I
BH ZRS (2008)
MG ZICG
FYROM MZ-T (2008)
Serbian Railways
RO CFR
RO CFR Marfa
BH ZFBH
MG ZPCG (2008)
RO CFR Calatori
Turkey (TCDD)
Croatian Railways

Railway Reform in South East Europe and Turkey: On the Right Track? Main Report
76
s
136. Meanwhile, the structure of track access charges should avoid cross-subsidies between
freight and passenger transport. In many countries, passenger trains use over 50 percent of
existing rail transport capacity, use almost all rail lines, and need higher speeds, while conversely,
freight transport usually uses a reduced length of rail network and do not require high speeds.
International experience demonstrates that over the long-term, cross-subsidization may create a
vicious circle, with the freight market rail share decreasing due to noncompetitive infrastructure
costs, with the infrastructure manager losing money, and unable to finance repair and
maintenance of infrastructure, resulting in deteriorated rail operations and a non-competitive
railway industry with a declining market share. This suggests that it is not only the level of TAC,
but its structure which are critical factors. Six of the report countries have introduced TAC, while
Albania, Kosovo, Serbia, and Turkey have yet to do so.
Box 5: EU State Aid Rules for Rescuing and Restructuring Firms
The EU has strictly defined guidelines concerning state aid for rescuing and restructuring firms in
difficulties. The primary legal basis for state aid is Article 107 of the Treaty on the Functioning of the
European Union, which lays down the definition of ―incompatible‖ state aid, provides for cases of de
iure derogations to the incompatibility, and provides for cases of discretionary derogation to the
incompatibility. On October 10, 2004, new guidelines approved by the European Commission (EC)
entered into force replacing earlier current. The common provisions of the new rules are as follows:
A firm is regarded as newly created, and thus ineligible for rescue or restructuring aid, during
three years from the start of operation;
Exclusion of all kinds of repeated interventions in favor of one firm; and
Exclusion of a new rescue or restructuring for firms that do not reimburse aid previously
declared as being illegal.
Concerning rescue aid, the new guidelines allow execution of urgent restructuring measures, even in the
rescue period, which is now limited to six months. At the end of this period, the aid needs to be
reimbursed. Rescue aid can still only be granted in the form of reimbursable loans—irreversible capital
injections by public authorities remain prohibited.
Compensatory measures associated with restructuring aid can take the form of divestiture of assets, a
reduction in capacity or market presence or a reduction of entry barriers. The new guidelines clarify that
the beneficiary should make a real contribution towards the cost of its restructuring. For small and
medium enterprises the contribution should amount to at least 25 percent of the restructuring cost, for
medium-sized enterprises 40 percent, and for large undertakings the percentage is established on a case-
by-case basis, but should in most cases be at least 50 percent.
A recent example of state aid to the rail sector, is the decision of the EC to authorize state financing of
about Euro 128 million for the Bulgarian state-owned railway operator, BDZ EAD. This is in line with
EU rules on rescue aid because it is limited in both time and scope. The EC approved the measure
temporarily, until it can take a position on the restructuring plan to be submitted by the Bulgarian
authorities within a maximum of six months. The rescue aid aims to tackle liquidity problems and
enable BDZ EAD to pay credits and properly maintain its rolling stock pending the implementation of a
restructuring plan.
Sources: European Commission (2010), State Aid: Commission Temporarily Authorizes BGN 249 Million Rescue Aid for
Bulgarian Railway Company, Press Release IP/10/1733, Brussels, December 16, 2010 and European Commission (2004),
Commission Adopts New Rules Governing Aid to Firms in Difficulty, Memo/04/172, Brussels, July 7, 2004.

Railway Reform in South East Europe and Turkey: On the Right Track? Main Report
77
Figure 37: State Contributions to the Rail Sector
(Euros/traffic unit), 2009
Figure 38: State Contributions as Percentage of
GDP, 2009
Source: State rail companies. Source: State rail companies.
137. In order to compare across countries, charges paid by passenger and freight operators to
infrastructure managers are divided by traffic in train-km. This is a simplification, as TAC will
vary according to type of service—for example local and suburban trains versus intercity
passenger trains, 900 gross ton freight trains versus 2000 gross ton freight trains—as detailed in a
recent OECD report assessing charges for the use of rail infrastructure in 2008.80
This report
makes the point that while each infrastructure manager has unique characteristics which may
require distinct access charge regimes, in the case of highly competitive freight services, the
decision by one infrastructure manager to generate a high contribution from rail freight TAC will
not only shift freight traffic from rail to truck in that country‘s domestic market, but also in every
other country that interchanges rail freight traffic with that country—a negative externality across
national borders. The concomitant implication is that simple TAC regimes should be
implemented for freight transport along major EU freight wide corridors (TEN-T) —and an
extension of that would be to the Pan-European Corridors—in order to make international rail
freight flows easier to manage and plan. One of the findings of the report was that Eastern Europe
railways tend to allocate more of the infrastructure costs to freight transport than passenger
services, shifting a public burden to commercial users.
80
OECD/ITF (2008), Charges for the Use of Rail Infrastructure 2008, Paris: OECD.
1.3
1.4
3.9
4.0
4.5
4.7
4.9
5.8
7.5
9.4
FYR Macedonia
BH ZFBH
Bulgaria
Serbia
Romania (2008)
Albania
BH ZRS
Kosovo
Croatia
Turkey
0.05
0.08
0.11
0.14
0.17
0.22
0.32
0.43
0.48
0.52
0.74
Albania
BH ZFBH
Kosovo
BH ZRS
FYR Macedonia
BH
Turkey
Serbia
Bulgaria
Romania (2008)
Croatia

Railway Reform in South East Europe and Turkey: On the Right Track? Main Report
78
Figure 39: Passenger TAC, 2008 (Euro/train-km) Figure 40: Freight TAC, 2008 (Euro/train-km)
Source: State rail companies. Source: State rail companies.
138. Track access charges vary significantly between countries, and there appears to be cross-
subsidization from freight to passenger services.81
There is a broad range of access charges paid
by passenger rail transport in the report countries that charge for infrastructure access. Figure 39
presents average TAC per passenger train-km which varies from zero in Bosnia‘s ŢFBH, which
only charges freight trains, to Euro 2.79/train-km in Republika Srpska. The average charge in
Croatia is nearly ten times less than what ŢRS charges. By contrast, the average TAC is
considerably higher for freight transport, often several times higher on a train-km basis than for
passenger services. In the case of FYR Macedonia, the average freight TAC, at Euro 7.29 per
train-km, is more than 10 times higher than for average passenger TAC (Figure 40). Although
freight transport represented 46.2 percent of rail traffic in FYR Macedonia, measured in train-km,
it accounted for 92.1 percent of revenue generated from TAC.82
Only with ŢRS is the traffic mix
and contribution to TAC between passenger and freight evenly distributed—passenger services
account for 61 percent of traffic and 58 percent of revenues. Compared to EU-15 countries,
average freight TAC is generally high in the report countries, with the exception of Croatia
(Figure 41).
81
TAC methodologies have changed in several countries in 2009, so this may not reflect the current
situation. 82
In the case of Bosnia‘s ZFBH, passenger traffic represents 45.1 percent of traffic in 2008, but no
payment is made for infrastructure usage. Similarly, in Croatia passenger services account for 70.3 percent
of total traffic measured in train-km, but only 49.9 percent of infrastructure access revenue.
0.00
0.29
0.58
0.98
1.46
2.44
2.79
BH ZFBH
Croatian Railways
FYROM MZ-I
BG NRIC
MG ZICG
RO CFR
BH ZRS
0.68
2.74
3.15
3.35
5.17
7.29
Croatian Railways
BH ZFBH
BH ZRS
BG NRIC
RO CFR
FYROM MZ-I

Railway Reform in South East Europe and Turkey: On the Right Track? Main Report
79
Figure 41: Track Access Charge for a Typical 2000 Gross Tons Freight Train, 2006 (Euro/train-km)
Source: OECD/ITF (2008).
139. Investments in rail infrastructure are insufficient to prevent the increasing deterioration of
rail assets. Figure 42 presents average investments in rail infrastructure over 2005-08 for the
report countries, as well as for Germany, Poland, and Slovenia over 2004-07. Four countries are
spending less than Euro 5,000 per track-km annually: Kosovo, Serbia, Albania, and FYR
Macedonia; this is nearly 30 times less than Germany.83
In Turkey, annual investments in rail
infrastructure have risen sharply due to investments in high speed lines—from Euro 38,855 per
track-km in 2008 to Euro 50, 810 per track-km in 2009 and to Euro 111,737 per track-km in
2010. In Austria, on average Euro 248,602 per track-km was spent on rail investments over 2004-
07, albeit through terrain that is not very hospitable for rail transport. Where heavy renewals are
needed, one would expect the necessary investment levels to be much higher. Low level of
investments in rail infrastructure raises the issue of whether countries in South East Europe and
Turkey can afford to maintain current networks. Given the concentration of traffic on a sub-
section of lines and limited resources, this adds urgency to the argument that resources be
concentrated on lines where traffic is highest. For eight of the 10 report countries for which data
are available, less than 10 percent of the network was rehabilitated in the last 10 years, suggesting
the existence of a growing track renewal backlog (Table 7).
140. Implementation of EU rail reforms do not in and of themselves guarantee improved
performance of state rail undertakings. The state-owned railways of the EU member states
Bulgaria and Romania are not top performers when it comes to operational or financial
performance. Romania‘s freight operator, CFR Marfa, is up for privatization after a dramatic drop
in market share in 2009. Bulgaria‘s BDZ is facing a liquidity crisis and is in need of a large cash
injection to allow it to overcome its cash flow problems in 2011. The rail incumbents in Bulgaria
and Romania were both faced with the full impact of the opening of the freight market to private
operators, and have not been successful in facing the impact of operating in contestable,
competitive markets with an inherited burden of aged assets, excess staff, and a management
culture not focused on profitability.
83
In the case of countries like Germany or France, which have extensive high speed networks, the high
level of expenditure may reflect investments in expensive high speed developments, and thus are not
directly comparable to the countries covered in this report.

Railway Reform in South East Europe and Turkey: On the Right Track? Main Report
80
Figure 42: Average Annual Investments in Rail Infrastructure, 2005-08 (‗000 Euro per track-km)
Note: The figures for Germany, Poland and Slovenia represent the average over 2004-07.
Source: State rail companies, OECD/ITF.
Table 7: Track Renewal as Percentage of Network Length, 2009
<10 years 11-20
years
21-30
years
31-40
years >40 years
Albania 28.5 43.5 28.0 0.0 0.0
BH ŢFBH 4.6 12.2 28.0 10.3 44.9
BH ŢRS 6.8 0.0 41.7 27.3 24.2
Bulgaria 4.7 31.2 64.1 0.0 0.0
Croatia 25.5 10.5 36.5 18.4 9.0
FYR
Macedonia 8.2 13.1 9.8 38.6 30.3
Serbia 7.8 19.3 14.7 22.5 35.7
Turkey 21.4 23.2 30.8 10.3 14.3
Kosovo 5.7 0.0 37.1 57.3 0.0 Source: State rail companies.
141. Among the motivations for the EU rail reforms is the need to reverse the loss of market
share of the rail sector, the need for greater competitiveness of rail vis-à-vis roads, and the need to
reduce large state support to rail companies. However, the case of both Romania and Bulgaria
highlight the urgency of improving the operational and financial performance of state
incumbents, so that they can compete effectively in a non-monopolistic, open, and liberalized
environment. With eight of the countries in the report aspiring to join the EU in the medium to
long-term, this lends urgency to not only implementing the institutional reforms to ensure
compliance with the EU rail acquis, but to focusing on improving financial results in parallel, and
prevent the kinds of problems experienced by Bulgaria and Romania.
CONCLUSIONS - IMPROVING OPERATING AND FINANCIAL PERFORMANCE
142. Government transport policy should place rail and road transportation on an equal footing:
the legal provisions and the level of financial contribution of the state for railway and road
infrastructure should be equivalent (Box 6). This will allow users to make the socially optimal
choice between the two modes for each trip. As long as the financial support of the state is
3,004
3,272
3,668
4,257
5,473
17,190
18,692
23,501
31,733
32,727
42,769
48,092
148,790
FYR Macedonia
Albania
Serbia
Kosovo
Slovenia
BH ZRS
Poland
Romania
Turkey
Bulgaria
Croatia
BH ZFBH
Germany

Railway Reform in South East Europe and Turkey: On the Right Track? Main Report
81
reflected in an unbiased manner in the transportation tariffs for competing modes of transport, the
market will generate enough resources to cover infrastructure operation needs.
143. In order to raise the operational efficiency of rail incumbents—with the long-term objective
of approaching EU levels of productivity—a number of common recommendations can be made
for the report countries, as detailed below. These echo the recommendations made in the 2005
Report—which in itself testifies to the modest progress in implementing rail reform over the past
five years—and also reflect policy work conducted in Bulgaria, Poland and Romania by the
World Bank over the period of 2009-2010.
Box 6: State Support to the Rail Sector
State support to the rail sector needs to be seen within a broader framework of state support to the
transport sector. A recent study by the European Environment Agency examined state support to the
transport sector in the EU-15. Transport subsidies in the EU-15 are defined as funds paid directly from
public budgets or through lower tax returns when there is no service in return, and include: (i) provision
of infrastructure; (ii) other direct transfers such as support to operators, reduction of debts, pension
contributions; and (iii) differences in fuel taxation by mode which constitutes a subsidy for the least
taxed mode. This excludes transfers made to public transport operators in remote regions or lower fares
for special groups, because a service is provided in return. Under this definition, government payments
to public service obligations (PSO) are not regarded as subsidies.
The study found that the total value of subsidies in the EU-15 in 2005 was Euro 229 billion annually, in
the form of infrastructure subsidies and other budget transfers, while fuel tax and VAT exemptions
amounted to Euro 40 to 65 billion. Roads receive about Euro 125 billion annually in subsidies, with the
vast bulk being infrastructure subsidies. An implicit assumption is that taxes paid by motorists are not
interpreted as user charges for road infrastructure, as most revenues from fuel and vehicle taxes are not
earmarked for financing transport infrastructure. Air transport receives subsidies in the form of
exemptions and rebates from fuel taxes as well as VAT on international flights, while for the rail
infrastructure, subsidies total Euro 73 billion of which infrastructure subsidies take the largest share
(Euro 37 billion).
One can debate whether the public service obligation (PSO) should be excluded or not from such
calculations, and whether fuel and vehicle taxes should be regarded as a charge for funding
infrastructure, even if not hypothecated, or whether they should be seen as fiscal contributions to
general budgets. But the more important point is that all transport sectors receive state support, either in
the form of direct budget contributions or through the taxation system. Thus, discussions of state
support to the rail sector should keep in mind this fact, which would suggest that zero state support
would not be a balanced approach vis-à-vis other modes, as other transport modes do not pay full costs,
including externalities, such as environmental impacts.
A 2008 study by NEA, financed by the European Commission, aimed to assess state aid to rail
undertakings and to clarify how state aid rules can be applied. This report argues that the European rail
system is heavily dependent on subsidies provided by the state and their withdrawal would lead to a
shift away from rail, with negative consequences on accessibility, environment, traffic safety, and
congestion. Details concerning the modalities of state aid for EU members are detailed in Directive EU
91/440/EEC, amended by Directive 2001/12/EC. Aid to train operating companies requires approval
from the European Commission‘s competition authorities, and has been approved on the basis of once
only payments to support restructuring in the transition to a competitive market environment.
Sources: European Environment Agency (2007), Size, Structure and Distribution of Transport Subsidies in Europe, EEA
Technical Report No.3/2007; NEA (2008), Impact Assessment of Guidelines on State Aid to Railway Undertakings. Study
financed by the European Commission.

Railway Reform in South East Europe and Turkey: On the Right Track? Main Report
82
Box 7: SNCF Intermodal Strategy
The Société Nationale des Chemins de Fer Français (SNCF - French national railway company) is one
of France's largest public companies, and is specialized in rail transport. The group employs 160,000
people, and the turnover in 2009 was Euro 24.9 billion. It is organized along five main divisions: SNCF
Infra manages, operates, maintains and designs railway infrastructures; SNCF Proximités is in charge of
local urban, commuter and regional passenger transport; SNCF Voyages focuses on long distance and
high-speed passenger rail transport; SNCF Geodis is the freight transport and logistics division; and
Gares & Connexions manages and develops the train stations.
SNCF Proximités operates trains, tramways, cars, buses and undergrounds in nine European countries,
as well as in Algeria, Canada, Australia and the United States. It has become the leading division of the
SNCF group, with estimated revenue of more than Euro 10 billion in 2010. To offer passengers the
widest choice of transport modes, SNCF Proximités is developing its know-how throughout the
transport chain, notably by combining various modes to make door-to-door travel as efficient and
smooth as possible. As an example, to move freely from one mode of transport to another, SNCF has
signed ―guaranteed connections‖ charters with bus and coach operators in Ile-de-France, a French
administrative region composed mostly of the Paris metropolitan area. The last five charters signed in
2009 on RER (Paris metropolitan train system) line D bring the number of Ile-de-France stations where
the last bus waits for the train, even if it is late, to a total of 31.
The group Kelois, integrated in the SNCF Proximités structure, has a presence in all areas of the
mobility chain: bus, underground, regional trains, bikes, car parks, maritime shuttles, car sharing,
computerized ticketing, and multi-modal information. SNCF holds 56.7 percent of Keolis and reports
financial results on a consolidated basis. Keolis has a fleet of 18,000 buses and coaches which are used
for various purposes: city buses as part of a network serving a town and its outskirts, regional bus
services and intercity coach services. The group is also involved in projects that demonstrate how train
and bus services can be complementary and benefit collectivities. For instance, with the objective of
making the Lille-Béthune rail line more attractive, SNCF and the Nord-Pas-de-Calais region decided to
reduce the number of served stations. However, in order to provide a transport alternative for the
affected municipalities, a substitution bus service was awarded to Keolis through a tender process. A
regular line ensures six daily connections on weekdays linking the concerned towns and the rail served
stations.
The French Court of Audit (Cour des Comptes), a body of the French government charged with
conducting financial and legislative audits of public institutions, published recently a report on
alternatives to regional rail transport, with a strong accent on multimodal transport. Three alternatives
are described to encourage the regions to have increased responsibility for the future of low traffic rail
lines:
(i) Elaboration of audits to measure the financial and ecological opportunity of rural rail lines
having traffic below an established threshold and study the implementation of a substitution
service using buses, minibuses or even taxis to develop a high quality road alternative;
(ii) Offer regions the possibility of having these rail lines transferred so that they can delegate the
operation and maintenance of the lines to other operators (excluding SNCF);
(iii) Have regions assume the Track Access Charge created in November 2008 with an integral
compensation through the DGD (general allocation for decentralization). The regions would
keep the savings that they would potentially be able to make by closing or managing more
efficiently the rail lines.
Sources: World Bank, SNCF.
Railway Reform in South East Europe and Turkey: On the Right Track? Main Report
83
144. Introduction of cost-effective bus services on low density branch routes. The financial
costs of keeping trains running on poorly utilized branch-lines is usually so high that a good
quality bus service is able to operate a faster, more frequent service for a lower cost. This has
been an approach taken by France‘s SNCF which provides bus services on unprofitable low
demand branch lines (Box 7). Another option is the introduction of a PSC for social transport
services on a number of branch-lines, and contract by competitive tender to qualified private bus
service operators. Such an approach could be taken on a pilot basis on a number of low-density
branch lines. This could be complemented with the tendering of low traffic lines, where there is
market interest (Box 8).
145. Divest or scrap non-economic assets. Rail undertakings are often burdened with non-
economic assets made redundant by changed rail transport demand. For a number of report
countries, operational rolling stock assets are only a fraction of the total assets, which places a
considerable burden on productivity levels.
146. Identify factors affecting low productivity. State rail incumbents should evaluate the
reasons for low productivity and the impact of each of the reasons identified. This should include
an analysis of the structure of the fleet in comparison with market demands, and should define the
number of cars necessary for present traffic levels. A decision should be made regarding the
potential surplus fleet affecting operating costs in a negative manner. The remaining fleet needs
to implement new methods of allocation based on the needs of the market, in order to increase the
efficiency of utilization. Such a reevaluation of rail processes should include the following
activities and define the appropriate measures:
Scheduling of allocation of locomotives in order to increase the efficiency of their
utilization (concrete targets for reducing the number of locomotives for specific
activities: traction of trains, shunting);
Scheduling of the locomotive crews in order to optimize the utilization of staff;
Concrete annual targets for reducing the time between two consecutive loadings of
freight wagons;
Definition and implementation of a new job classification based on multiple
responsibilities at each working place (the narrow specialization of functions at
railways increases the number of staff and reduces productivity; incentives should
be created for multiple responsibilities); and
The possibility for concentration of activities in a reduced number of units should
be addressed: optimum number of depots based on a minimal volume of activity,
optimum number of basic units (shops, railway stations, etc.) based on the traffic
needs, consolidation of commercial activities for freight transport in a reduced
number of units.
147. Reduce staff levels. A clear policy of annual staff reductions over the next three to five
years should be defined with a precise target and time frame for achieving average EU staff
productivity levels. This policy needs to be based on a prudent traffic forecast that will need
regular updating. A clear separation of the accounts for freight, passenger, and infrastructure will
allow operators to calculate staff productivity based on specific formulas for each line of
business. This will provide more accurate information for the evaluation of performance for each
business segment.

Railway Reform in South East Europe and Turkey: On the Right Track? Main Report
84
148. Utilize multi-annual contracts for rail infrastructure development. The state
contribution for the development of railway infrastructure and for partial coverage of
maintenance costs must be allocated in a transparent way. It must be based on a multi-annual
contract signed between transport ministries and the infrastructure manager/holding company.
There should be specific provisions regarding: (i) the public money allocated; (ii) the destination
of the allocated funds—clearly distinguishing network development from network maintenance;
(iii) the responsibilities of the infrastructure company regarding the availability of infrastructure;
and (iv) the quality of services (punctuality, technical speed, capacity offered for operation). Care
must be taken to ensure that under-spending on the part of the state is not compensated for by
excessively high TACs, which undermine the viability and competitiveness of rail freight vis-à-
vis other transport modes. State contributions must not be set at a level that forces high TACs to
the detriment of policy objectives aimed at increasing the modal share of rail.
Box 8: Romania Private Operation of Low Traffic Lines
Romania‘s railway infrastructure is categorized in two groups, according to the Law No.128/2004
approved by the Romanian Parliament:
Interoperable railway infrastructure, which is the part of the state railway infrastructure corresponding
to national and international traffic. It represents 75 percent of the network length (8,500 km), 98
percent of freight traffic and 92 percent of passenger traffic; and
Non-interoperable railway infrastructure, which is the part of the state railway infrastructure
associated with local traffic and connected or not to the interoperable railway infrastructure. It is
administrated and developed according to specific internal regulations and represents 25 percent of the
network length (2,800 km), 2 percent of freight traffic and 8 percent of passenger traffic.
The law also stipulates that the national company that manages the railway infrastructure may lease
parts of public non-interoperable railway infrastructure to other legal persons to organize public
transport of goods and transport. This leasing is subject to public auction and revenue obtained from
leasing is collected by the infrastructure manager and used exclusively to carry out capital repairs on
the non-interoperable infrastructure. The specific conditions for managing the non-interoperable
railway infrastructure, as well as the conditions for leasing parts, shall be approved by Government
decision.
The Government decision that stipulates the possibility of renting out the lines was adopted in 2007
and is done through the Romanian Stock Exchange Market. As a result, 2,800 km were offered for
private operation and three bidding procedures were organized. In 2009, on all sections tendered by
CFR, nine private operators were acting, mainly on the passenger segment and covering a length of
846 km, which is about 31 percent of the total non-interoperable track length. The contracts are usually
signed for a period of 5 to 10 years for the private agent to recover the investment. 450 km of network
were closed and the lines which will not be leased will be proposed to be abandoned.
According to a UK Trade & Investment Sector Report from May 2010, there are more than 30
companies licensed but several private operators have given up since it was difficult to avoid losses,
particularly if operating old rolling stock and high power locomotives rented from the state company.
The longest route in operation is 150km long. While the state company is registering losses, nine
private operators are registering profit by employing just the number of people they need and not
operating lines that do not attract customers.
Source: Further information can be found in the Romanian Official Journal (Part I No. 371 of April 28, 2004) and in the UK
Trade & Investment Sector Report Railways – Romania, May 2010.

Railway Reform in South East Europe and Turkey: On the Right Track? Main Report
85
149. Utilize multi-annual public service contracts (PSCs) for passenger services with
performance indicators. State compensation for the public service obligation defining the
passenger transportation services must be allocated based on a multi-annual contract. This
contract must be signed between transport ministries with the passenger company/holding
company defining the type of services to be offered, the volume (number of trains, composition
of trains), and selected quality indicators. The PSC should specify the train-km purchased on all
routes. In addition to output targets, it should contain input performance targets in order to create
incentives to seek efficiency improvements. Profitable passenger and freight services should not
benefit from state finance.
150. Organize around customer service centers instead of territorial structures. Many
European railways have successfully implemented a business model based on profit centers that
manage each major type of commodity and passenger service. It is highly recommended that
freight services be structured around customer service centers for each of these types of products,
and that passenger rail undertakings be structured around specific passenger services.
Infrastructure managers can organize activities around traffic management, power, and
telecommunication, in order to attract more clients.
151. Reassess the logic of maintaining traction companies. Efficiency gains depend on being
in touch with market demands. Monopolistic traction companies in Bulgaria and Croatia lack
direct contact with the market—tariffs are not established through interaction with clients, which
prevents successful implementation of market-based railway activities. There is a need to
elaborate a methodology for the calculation of unit tariffs for services offered by traction
companies, with annual contracts signed between the traction company and its clients based on
established tariffs, in order to ensure that traction is made available to all companies on a non-
discriminatory basis.
152. Ensure that process of state funding for acquisition of rolling stock is transparent. The
state contribution for the acquisition of rolling stock must be done in a transparent way and in line
with the EU provisions of a state aid legal framework. The acquisition of passenger rolling stock
may be part of the PSCs, but the acquisition of freight wagons must be financed by the rail
companies themselves.
153. Utilize performance indicators by lines of business. Progress must be measured based on
specific indicators for each of the lines of business: infrastructure, passengers, cargo—and in the
case of Bulgaria and Croatia, traction. The annual budget of state incumbents must be approved
for each line of business containing specific targets. In the case of holding companies, the
daughter companies should sign performance contracts with the management of the holding
company, and should be held directly accountable for operational and financial results.
154. In order to improve the quality of rail infrastructure and the performance of infrastructure
managers, the following recommendations are made:
155. Refocus rail network development plans. Governments should prepare rail network
development plans with investment decisions based on cost-benefit analysis, rather than focusing
excessively on past traffic density; a distinction must be made between upgrading, rehabilitation,
and light maintenance of rail infrastructure in these plans. Governments are strongly advised to
develop a strategy for the modernization of the core network that carries the bulk of the traffic,

Railway Reform in South East Europe and Turkey: On the Right Track? Main Report
86
for the achievement of inter-operability with the European railways, and for increasing rail safety
and labor productivity.
156. Consider the need for network rationalization and focus maintenance on high-density
lines. A network rationalization program needs to be defined and implemented in a manner that
reduces excess railway track and concentrates on the network where rail performs the most useful
transport role. This rationalization or definition of a ‗core network‘ will help bring rail traffic
density closer to the EU average. More importantly, it will improve the financial sustainability of
the rail sector through the reduction of infrastructure costs. Shifting to high-density corridors, and
focusing maintenance on these lines while closing low density routes is probably the only way to
improve the performance of the rail sector from a cost perspective. This could be complemented
with the tendering of low traffic lines, where there is market interest, or their replacement with
more cost-effective bus services.
157. Utilize multi-annual contracts for rail infrastructure development. The state
contribution for the development of rail infrastructure and for partial coverage of maintenance
costs must be allocated in a transparent way. It must be based on a multi-annual contract signed
between transport ministries and the infrastructure manager/holding company. There should be
specific provisions regarding: (i) the public money allocated; (ii) the destination of the allocated
funds—clearly distinguishing network development from network maintenance; (iii) the
responsibilities of the infrastructure company regarding the availability of infrastructure; and (iv)
the quality of services (punctuality, technical speed, capacity offered for operation).
158. Set infrastructure charges at a level that is non-excessive. Care must be taken to ensure
that under-spending on the part of the state is not compensated for by excessively high TACs,
which undermine the viability and competitiveness of rail freight vis-à-vis other transport modes.
Such charges should not be fixed in multi-annual contracts and cannot compensate for under-
financing without a negative impact on traffic volumes.
159. Establish a system for measuring and charging traction current. This system should be
set up to measure and charge traction current according to consumption—and it should be inter-
operable with other infrastructure managers. This may reduce consumption and costs of
operation.
160. Encourage infrastructure managers to publish network statements via
RailNetEurope. The latter is an association that was set up by a majority of European Rail
infrastructure managers and allocation bodies to enable fast and easy access to European rail.
Infrastructure managers should use the umbrella of RailNetEurope to publish their network
statements and access conditions, and to coordinate the construction of international train paths.

Railway Reform in South East Europe and Turkey: On the Right Track? Main Report
87
THE STATE OF INTERNATIONAL INTEGRATION
INTRODUCTION
161. Despite recent transport demand trends towards increasing individuality and flexibility—
which have tended to shift both passenger and freight traffic on to roads—there exists a large and
growing market segment for rail transport, particularly along international freight corridors. The
case for long distance rail is underpinned by economies of scale and density of traffic, and with
sufficient volume, a very attractive potential market for rail operators as well as for rail
infrastructure managers. The expansion of the EU rail networks into the new member states has
created important opportunities in the long-run for rail freight, given the extra capacity on East-
West axes and high growth rates of trade between EU-15 and EU-12 countries, as well as with
candidate and potential candidate countries. However, this potential for a significant modal shift,
particularly for freight, using international rail corridors connecting EU-15 and EU-12 countries
and beyond, has not been realized in recent years.
162. The reasons for this are numerous, and include strong competition from other modes, not
only roads, but also short-sea shipping and inland waterway navigation. This would include Pan-
European Corridor VII through the Danube, multimodal corridors with RoRo ships between
North Adriatic ports and Turkish Ports, and multi-modal corridors with short-sea shipping
between North Sea ports and Turkish ports. At the same time, with the accession of Romania to
the EU in 2007, the port of Constanta has become the gateway to the Black Sea, with new
container train products being transported from central Europe to Constanta, which before would
have been transported by rail via Bulgaria and from there to Turkey. There are already examples
of road transport logistics providers using road, inland waterways, maritime, and road supply
chains in South East Europe and Turkey, with prices that are about 15 to 30 percent lower than
rail rates and significantly lower transit times.
163. One of the reasons for the higher rail transit times are processing times at rail border-
crossing points (BCPs) in South East Europe.84
Creating incentives for the private sector to
participate in developing intermodal (logistic) terminals to establish conditions for shifting more
traffic from road to rail—by creating block trains for longer distances, for example—would
require significantly higher commercial speeds along rail corridors and substantial reductions in
border stopping times. In turn, this does not require large infrastructure investments, but
improvements in border-crossing agreements (BCA) and the functioning of BCPs, through
information data exchange, trust, and cooperation between neighboring rail undertakings and
infrastructure managers.
84
Uhl, Klaus-Juergen (2010), Review of practices at border-crossing points in selected rail corridors and
assessment to improve performance. Consultant Report prepared for the World Bank, July 2010.

Railway Reform in South East Europe and Turkey: On the Right Track? Main Report
88
164. Rail networks in the Western Balkans are fragmented—and despite the existence of
numerous border-crossings, for historic reasons, international and transit traffic remain important
in the region. Freight transit was equal to 61 percent of Serbia‘s total traffic, 51 percent in FYR
Macedonia, and 43 percent in Montenegro. Domestic traffic constitutes 87 percent of Turkey‘s
freight traffic, 67 percent for Romania‘s state incumbent, and 68 percent for Bulgaria—the
figures are much lower for Yugoslavia‘s successor states. This puts a significant onus on
developing regional solutions in order to encourage regional traffic development—a task
supported by the South East Europe Transport Observatory (SEETO)—and more broadly, to
foster traffic along the Pan-European rail corridors. While Bulgaria, Romania, and Turkey have
not experienced the reconfiguration of the political landscape in the way the Western Balkans
have since transition, corridor performance along the Trans-European Transport Network (TEN-
T) European corridors is not significantly better, as revealed in this chapter.
165. This chapter explores international rail corridor performance in South East Europe and
Turkey. It begins by describing the various international rail corridors that cross the report
countries, and then focuses on sections of two TEN-T corridors, Corridor IV and Corridor X from
Budapest in Hungary to Svilengrad in the Bulgaria-Turkey border. Corridor IV passes through
Hungary, Romania, and then to Sofia in Belgrade, and from then on to Dimitrovgrad via Corridor
X—the second route is Corridor X traversing Hungary, Serbia, and Bulgaria, to reach the border
with Turkey. Both of these sections represent two alternative international rail corridors from
central Europe to Turkey. The section on Corridor IV and Corridor X focuses on (i) corridor level
performance; (ii) main problems and challenges at the BCPs, and (iii) recommendations for
improving corridor performance. The key to improving rail corridor performance is expediting
border processing practices, and the main problems and recommendations made are likely to
apply to other international rail corridors and BCPs within South East Europe and Turkey.
INTERNATIONAL RAIL CORRIDORS IN SOUTH EAST EUROPE
166. South East Europe is traversed by TEN-T and Pan-European rail corridors. Where these
corridors pass through EU member states they are part of the TEN-T rail network, and beyond the
EU they are known as Pan-European corridors (Figure 43). At the beginning of the 1990s, and
following the opening of Eastern Europe, a series of Pan-European Transportation Conferences
were held with the purpose of identifying the transportation infrastructure development needs of
this region. The objective was also to create a strategy that would integrate all transportation
networks within greater Europe. The main conclusion of the First Pan-European Transportation
Conference (Prague, October 1991) was that the accent must be placed on a corridor-based
approach. The Second Pan-European Transportation Conference (Crete, March 1994) defined
nine transportation corridors—the so-called Pan-European Corridors. They were recognized as
the major transportation arteries of Eastern Europe, and it was understood that transportation
infrastructure investments should be prioritized along these corridors. A tenth corridor was added
to the network at the Third Pan-European Transportation Conference (Helsinki, June 1997),
bringing additional connectivity into the Balkan region.

Railway Reform in South East Europe and Turkey: On the Right Track? Main Report
89
Figure 43: TEN-T and Pan-European Rail Corridors Figure 44: SEETO Core Rail Network
Source: World Bank. Source: World Bank.
167. The South East Europe Transport Observatory (SEETO) core rail network overlaps with
the Pan-European corridors—except that they are limited to SEETO member states. The Core
Rail Network includes 4,615 km of railway lines and consists of 3 corridors (or 7 corridor-
branches) and 6 routes. The total length of corridors is 3,083 km and 1,532 km of routes, even if
on Corridor VIII. Not all sections of the rail corridors have been completed—for example, 210
km are physically missing between Albania and the FYR Macedonia. The results of analysis done
by SEETO reveal that, in 2008, only 12.8 percent of the Core Rail Network was in good
condition, with 70.8 percent in medium condition.85
The three main corridors—which coincide
with the Pan-European corridors in the region—are Corridor Vb, Corridor VIII, and Corridor X
(Figure 44).
168. RailNetEurope (RNE) is an association set up by a majority of European Rail infrastructure
managers and allocation bodies to enable fast and easy access to European rail, as well as to
increase the quality and efficiency of international rail traffic.86
RNE has defined eleven rail
corridors, which differ from the TEN-T and Pan-European Rail corridors, because the RNE
corridors were defined to meet market demand with the explicit aim to improve corridor
performance. Each corridor has a steering group, whose members are the participating
infrastructure managers and allocation bodies, and is led by an RNE Corridor Manager, who is an
infrastructure manager or allocation body nominated by corridor members and works closely with
85
South East Europe Core Regional Network (2009), South-East Europe Core Regional Transport
Development Plan, Five Year Multi Annual Plan 2010 to 2014, Common Problems-Sharing Solutions.
Vol.1, December 2009. SEETO: Belgrade, Serbia. 86
RNE had 16 founding members as of January 2004. Meanwhile, 22 new rail infrastructure managers and
allocation bodies have also joined the association, being either full or associates members or candidates.
Among the countries included in this report, the following rail companies have joined RNE: ŢFBH (Bosnia
and Herzegovina), NRIC (Bulgaria), HŢ Infrastructure (Croatia), Macedonian Railways (FYR Macedonia),
Serbian Railways (Serbia), and CFR (Romania).

Railway Reform in South East Europe and Turkey: On the Right Track? Main Report
90
RNE. The steering group develops an Action Plan for each corridor and detects the weak points
along the corridor. Of most interest for the purposes of the report are the following corridors:
(i) Corridor 9 (C09), from Wien—Budapest—Constanta / Varna / Burgas /
Svilengrad (BG) / Kulata, going through Romania and Bulgaria; and
(ii) Corridor 11 (C11), from Munich—Salzburg—Ljubljana—Zagreb—
Belgrade—Sofia—Istanbul, passing through Croatia, Serbia, Bulgaria and
Turkey.
Box 9: Pan-European and TEN-T Rail Corridors
The purpose of the ten Pan-European/Trans-European Transport Network (TEN-T) Corridors is to
provide a connection between Western and Eastern Europe, and within the Eastern Europe itself. The
corridors are road or rail corridors—with the exception of Corridor VII, which is an inland waterway
through the Danube—and have an overall length of about 48,000 km, 25,000 km of which belong to the
rail network and 23,000 km of which are part of the road network. Out of the ten main corridors, six go
through the countries included in the report, and the branches coincide with those belonging to the
SEETO Corridors:
Corridor IV, from Dresden/Nuremberg—Prague—Bratislava—Budapest—Arad—Constanta/Istanbul/
Thessaloniki;
Corridor V, from Venice/Rijeka/Ploce—Budapest—Uzgorod—Bratislava/Lviv;
Corridor VII, the Danube;
Corridor VIII, from Durres—Skopje—Sofia—Varna/Burgas;
Corridor IX, from Helsinki/Klajpeda/Kaliningrad—Kiev—Odessa/Alexandroupoli; and
Corridor X, from Salzburg/Graz/Budapest—Belgrade—Sofia/Thesaaloniki/Igoumenitsa.
For most of the corridors and regions, a Memorandum of Understanding (MoU) was signed by the
transport ministers of the participating countries and the European Commission. Although it is only a
voluntary commitment on the part of the participants and has no legal character, it demonstrates the
intention of the partners to engage in joint efforts to develop the Pan-European Transport Network.
MoUs recommend, among other things, the setting-up of Steering Committees to promote the necessary
activities and monitor their progress.
Many projects and initiatives along the Pan-European Corridors have been undertaken in order to
maintain and improve the quality and capacity of the transport infrastructure. In addition, the EU
experienced the largest extension ever in 2004; in this context, the role of the respective corridors as
important transit and trade routes for freight and passenger traffic has grown significantly and the routes
belonging to the new EU countries are now part of the Trans-European Transport Network (TEN-T).
The TEN-T program was adopted by the European Parliament in July 1996, and has the objective of
establishing a single, multimodal transport network through the EU covering traditional ground-based
structures and equipment to enable safe and efficient traffic.
The revised EC guidelines for the development of the TEN-T were adopted in April 2004 (Decision No
884/2004/EC). These were aimed at giving a new boost to TEN-T projects, detailing a list of 30 priority
axes. Priority Axis 22, with branches starting from Nurënberg and Dresden and then branching out to
Bulgaria and Romania, connects western to Eastern Europe, and is the only axis which traverses any of
the study countries.
Sources: World Bank. UNECE.
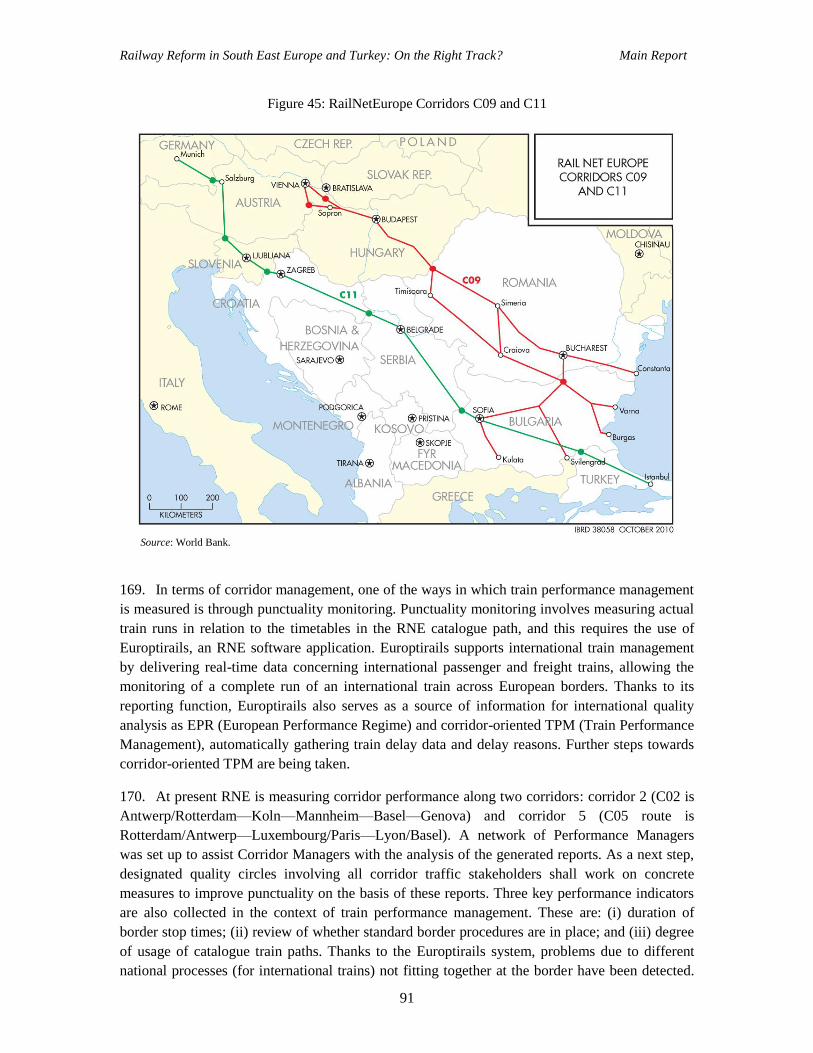
Railway Reform in South East Europe and Turkey: On the Right Track? Main Report
91
Figure 45: RailNetEurope Corridors C09 and C11
Source: World Bank.
169. In terms of corridor management, one of the ways in which train performance management
is measured is through punctuality monitoring. Punctuality monitoring involves measuring actual
train runs in relation to the timetables in the RNE catalogue path, and this requires the use of
Europtirails, an RNE software application. Europtirails supports international train management
by delivering real-time data concerning international passenger and freight trains, allowing the
monitoring of a complete run of an international train across European borders. Thanks to its
reporting function, Europtirails also serves as a source of information for international quality
analysis as EPR (European Performance Regime) and corridor-oriented TPM (Train Performance
Management), automatically gathering train delay data and delay reasons. Further steps towards
corridor-oriented TPM are being taken.
170. At present RNE is measuring corridor performance along two corridors: corridor 2 (C02 is
Antwerp/Rotterdam—Koln—Mannheim—Basel—Genova) and corridor 5 (C05 route is
Rotterdam/Antwerp—Luxembourg/Paris—Lyon/Basel). A network of Performance Managers
was set up to assist Corridor Managers with the analysis of the generated reports. As a next step,
designated quality circles involving all corridor traffic stakeholders shall work on concrete
measures to improve punctuality on the basis of these reports. Three key performance indicators
are also collected in the context of train performance management. These are: (i) duration of
border stop times; (ii) review of whether standard border procedures are in place; and (iii) degree
of usage of catalogue train paths. Thanks to the Europtirails system, problems due to different
national processes (for international trains) not fitting together at the border have been detected.
Railway Reform in South East Europe and Turkey: On the Right Track? Main Report
92
Future pilots include C09 and C11, but at present there is no corridor performance data for the
two corridors of interest in this report.
OVERVIEW OF RECENT INITIATIVES TO IMPROVE RAIL CORRIDOR PERFORMANCE87
171. A number of initiatives have been undertaken in recent years to assess rail corridor and
border-crossing performance in South East Europe and Turkey. This section does not mean to be
exhaustive, but summarizes some of these initiatives as an introduction before presenting the
findings of a small study commissioned by the World Bank in 2010 to assess rail corridor
performance along TEN-T/Pan-European Corridors IV and X.
172. Over 2000-2005, a project was carried out with the aim of reducing stopping times at rail
border-crossings in South-East Europe. It was financed by Deutsche Gesellschaft für Technische
Zusammenarbeit (GTZ), the German international development organization. The project focused
on reducing passenger and freight train journey times along TEN-T/Pan-European Corridors IV
and X. The work consisted of: (i) weak points analysis; (ii) introduction of a monitoring system at
border-crossing points (BCPs); (iii) drafting of new border agreements and their negotiation; (iv)
supporting the Serbian infrastructure ministry in drafting the new railway act; (v) supporting the
Bulgarian railway directorate in drafting its first network statement; and (vi) developing a joint
network statement for border-crossing. The main outcome of the project was the development of
new border-crossing agreements, based on the draft agreements. These included: (i) Dragoman-
Dimitrovgrad (Bulgaria-Serbia) in force since 2005; (ii) Ruse, a joint border station for Romania
and Bulgaria in force since 2007 in Romania and since April 2010 in Bulgaria; (iii) Svilengrad-
Kapikule (Bulgaria-Turkey) in force in Turkey since 2008 and since May 2010 in Bulgaria; and
(iv) Curtici (Romania-Hungary).
173. Over 2008-2009, SEETO oversaw a project aimed at reducing border delays for passenger
and freight rail traffic in the region.88
Site visits were organized to state authorities, border
authorities, rail undertakings and BCPs, with the aim of making recommendations for improving
performance. A draft regional plan to improve regional rail operations at border-crossings
included: (i) passenger border controls on moving trains; (ii) proposals to introduce electronic
data interchange (EDI) for freight operations; and (iii) an action plan for greater integration of rail
border-crossing policies. A Framework Border-Crossing Agreement (BCA) was developed and
then presented during the 9th Railway Working Group of SEETO in May 2009, under the
chairmanship of DG Move. This Framework BCA formed the basis for the new BCA between the
FYR Macedonia and Kosovo—and the Framework BCA and Border Police Agreement are under
consideration by Hungary in relation to its ongoing negotiations with Serbia, for the Subotica
BCP.
174. A recent rail corridor level initiative at the rail operator level was the test run of a train on
Pan-European Corridor X. On March 16-17 2009, a consortium of central European rail and
container operators, under the leadership of AdriaKombi of Slovenia and Kombiverkehr of
87
This section of the chapter is based on a consultancy commissioned for this report. See Uhl, Klaus-
Juergen (2010). 88
This was part of the EuropeAid 2008-2009 project ―Support for Implementing Soft Measures of the
South East Europe Core Regional Transport Network Multi-Annual Plan 2008-2012 (railways and road
safety auditing), Task 2A.

Railway Reform in South East Europe and Turkey: On the Right Track? Main Report
93
Germany, carried out a test run for a container train from Ljubljana/Moste to Istanbul/Halkali
(Figure 46). The route length is 1,577 km, of which 260 km is non-electrified lines, crossing five
countries—Slovenia, Croatia, Serbia, Bulgaria, and Turkey—with eight changes of locomotives
and different power supply systems. The starting point for the project is the modest modal share
of rail in freight transport from Central Europe to Turkey, which is estimated at about 1-2 percent,
with 80 percent travelling by sea, 18 percent by road, and about 4 percent by rail on the route
from Turkey to Central Europe. The low rail freight modal share reflects transit times of the
different transport modes: 57-64 hours for rail, 72 hours for road, and 48-57 hours for sea. The
objective was to prove that a rail transit time of 35 hours was feasible.
Figure 46: Bosphorus Europe Express on Pan-European Corridor X
Source: Uhl (2010).
175. The objective of the test run of the Bosphorus Europe Express was to reduce transit time
between Ljubljana and Istandbul to 35 hours by creating a new and faster rail product that would
be more attractive to potential clients. According to the timetable prior to the test run, a train from
Ljubljana to Kapikule took 60 hours and 43 minutes, with long delays in Dimitrovgrad (over
three hours) and Kapikule (over four hours). As indicated, the test run was successful; stoppage
time was reduced from 19 hours to 6 hours, which brought the total travel time down to the
targeted 35 hours. The testers decided to amend the timetable to 45 hours of travel time, because
they recognized that the exceptional conditions of the test run could not be matched in practice.
The testers had been given six months of preparation with a remit to work exclusively on making
the test run train a reality. The test train set benchmarks, but this did not mean that those
benchmarks could be easily obtained in the normal day-to-day business.
Svilengrad/Kapikule
Istanbul/Halkali
Serbia
Turkey
Bulgaria
Slovenia
Croatia
Bosnia-
Herzegovina
Ljubljana
Zagreb
Belgrade
Sofia
Tovarnik/Sid
Dobova/Savski Maraf
Nis
Dimitrovgrad /Dragoman
MihailovaMontenegro
3 kV DC
25 kV/50 Hz
diesel
Bosphorus Europe Express on Pan-european Corridor X
*BAC – Business Advisory Council South-East Eurpoe
total length : 1577 km (out of it 260 km of non-electrified railway
lines, 200 km of single tracks, on some sections gradients up to
29%o
crossing 5 countries
4 (x 2) border-crossings, EU and non-EU borders
different power supply systems
8 times changing the locomotives
different max train length (520 – 570 m) and weight (1200-1800
tonnes)
Description of the route

Railway Reform in South East Europe and Turkey: On the Right Track? Main Report
94
Box 10: Improving Performance along Corridor Vc
The World Bank‘s Trade and Transport Integration Project, which was launched in 2006, aims to develop
trade along Corridor Vc by improving the capacity, efficiency and quality of services on the southern end of
Corridor Vc—with a particular focus on the port of Ploče and on coordination aspects among all corridor
participants. The project seeks to achieve this objective through: (i) increased throughput capacity of the port
and railway infrastructure (ii) efficient operation of the corridor, including the Port of Ploče; (iii) high quality
of services; (iv) competitive alternative to other corridors; and (v) increased private sector involvement to
address these priorities, reduce commercial risks and secure financing for port cargo handling equipment.
The project recognizes that improvements in port infrastructure require concomitant improvements in land
transport infrastructure and facilitation of border procedures, in order to improve performance along an
international multi-modal transport corridor. While the World Bank loan finances only upgrades in port
capacity, the project was also designed to support strengthened corridor dialogue between Bosnia and
Herzegovina and Croatia. This is supported by a semi-annual newsletter sent to all corridor participants
informing them about progress in corridor development. Railway is a particular area of focus given that it
carries most of the bulk cargo to and from the port of Ploče, and is therefore crucial for overall performance of
the port.
The southern part of the Pan-European Transport Corridor Vc connects heavy industrial centers in Bosnia and
Herzegovina to the Adriatic coast through the port of Ploče, which is the second largest international port in
Croatia. While the corridor operated relatively well at low traffic volumes, weaknesses in operations,
infrastructure and related equipment became increasingly visible as the traffic increased. Weaknesses included
a rail infrastructure maintenance backlog resulting in low train speed and administrative barriers, such as
border and clearances procedures, resulting in overall low effective corridor capacity. Corridor Vc is
characterized by three custom controls in only 22 km, the distance between the port and border of Bosnia and
Herezgovina, the use of up to three railway operators for each rail transport, and resulting need to change
locomotives when switching from one operator to another.
Under the project, analysis was undertaken of the port-to-door transport time, to evaluate bottlenecks and
potential for time savings. In addition, Croatian Railways and Bosnia and Herzegovina‘s rail companies—
Public Railway Corporation of Bosnia and Herzegovina (BHŢJK), ZFBH and ZRS—signed a Memorandum of
Understanding in 2006, with the objective of improving the capacities and transport services along the southern
end of railway Corridor Vc. The parties also agreed on a joint action plan, including rehabilitation of rail tracks
and improvement of mobile capacities, as well as upgrades of IT systems, implementation of organizational
and technical measures to reduce travel times, and cooperation with other state authorities.
The implementation of this action plan is ongoing, and includes interactions with customs aimed at facilitating
border procedures. Monitoring of these activities is entrusted to a bilateral working group that meets semi-
annually. The World Bank supported project also includes establishment of an electronic port community
system that will integrate all members of the port community (shipping lines, shipping agent, stevedoring
companies, banks, rail, road transport, border agencies) into a seamless information system enabling accurate
and timely exchange of information and automated processing. While new procedures were introduced for
customs processing of trains on January 1, 2009, the railways have not yet met the requirements from customs
to apply these procedures.
Further concerted actions are also required to improve overall corridor efficiency and require a more active
dialogue with all parties involved in Croatia and Bosnia and Herzegovina. In the meantime, there is a contract
for the rehabilitation of 90 km of railway tracks on Corridor Vc between Konjic and Capljina in November
2009, financed by EBRD and EIB, that will improve tracks, signaling and train station facilities along the
Bosnian part of the corridor. The expected completion time for this contract is 2 years. With the Croatian
portion of Corridor Vc already rehabilitated, this would bring a major section of the corridor to a proper
operational level prior to the opening of the new bulk cargo terminal in port of Ploče.
Source: World Bank.

Railway Reform in South East Europe and Turkey: On the Right Track? Main Report
95
Table 8: Stoppage Time from Ljubljana to Istanbul/Kapikule (hours:minutes)
Source: Uhl (2010).
176. The success of the test run was due to a number of factors including: (i) project focus and
strong cooperation between infrastructure managers, rail operators, and the state border-crossing
authorities who participated in the project—resulting in a special treatment accorded to the test
run train; (ii) train priority along the entire route; (iii) multi-system and diesel locos provided by
Mitsui Dispolok, a private locomotive pool used throughout—with the exception of Croatia; (iv)
customs and commercial inspections carried out at the departure station Ljubljana Moste; and (v)
AdriaKombi sent in advance to the responsible contact persons along the entire route the required
information and documentation, because electronic data exchange is not possible in the absence
of an electronic data interchange system.89
89
Further details concerning the manner in which the train was operated and the responsibilities of various
BCPs is as follows: (a) Dobova (Slovenia): commercial and technical handover of the train SŢ – HŢ,
technical inspection and brake test by HŢ, HŢ locomotive coupling; (b) marshalling yard in Zagreb: import
customs clearance; (c) Tovarnik (Croatia): export customs clearance; (d) Šid (Serbia): HŢ loco uncoupling,
commercial and technical handover of the train HŢ – ŢS, technical inspection and brake test, import
customs clearance; (e) Niš (Serbia): change of locomotives; (f) Dimitrovgrad (Serbia-Bulgaria BCP):
export/import clearance, change of locomotives (multi-system in front line), technical inspection and brake
test, commercial and technical handover of the train between ŢS – BDŢ; (g) Plovdiv (Bulgaria): change of
locomotive; (h) Svilengrad (Bulgaria): export customs clearance, commercial and technical handover of the
train; (i) Kapikule (Turkey): import customs clearance, technical inspection and brake test; and (j) Istanbul
Halkali: handover of commercial documents to TCDD. A Dispolok multivoltage locomotive was on the
electrified network, with the exception of Croatia, as the license had expired. Under these ideal test
conditions, the change of locomotive took 10-15 minutes, while three German locomotive drivers from Dispolok; drove the traction engines on the whole route, but on each border came also the pilot (local
language and German or English).
Departure once a
week (Sunday)
Stoppage
timeDeparture
Stoppage
time
Departure twice a
week
(Monday/Thursday)
Stoppage
time
Ljubljana Moste (Slovenia) 5:50 8:30 12:39
Dobova (Slovenia) 5:37 0:35 0:47
Zagreb MY (Croatia) 0:30
Tovarnik (Croatia) 1:07 0:30 0:30
Šid (Serbia) 2:02 1:00 1:02
Dimitrovgrad (Serbia) 3:14 2:00 1:56
Dragoman (Bulgaria) 0:31 0:10 0:12
Svilengrad (Bulgaria) 2:56 0:30 1:05
Kapikule (Turkey) 4:15 0:42 4:17
Total stoppage time 19:42 6:00 9:49
Total travel time 60:43 35:00 45:25
Test run March 16-17
2009Timetable 2009/2010
Station/
Border Crossing Point
Timetable 2008/2009

Railway Reform in South East Europe and Turkey: On the Right Track? Main Report
96
Box 11: Recent Joint Rail Initiatives in the Western Balkans
On March 30-31 2010, a conference was held in Portoroţ (Slovenia) to discuss a joint marketing approach
for rail products. Participants included Croatian Railways Cargo, Slovenian Railways, ŢRS and ŢFBH of
Bosnia and Herzegovina and Serbian Railways. One of the conclusions of the conference was the need to
approach the transport market together, with proper sales coordination. A working group, consisting of
sales directors from the participating rail companies, was established to develop a draft agreement on short-
term and long-term goals with regard to a common sales policy. The draft agreement developed guidelines
with regard to target market, types of goods, and sales instruments. The working group aims to carry out
market analysis and work on the development of new products. The purpose of the joint approach is to
improve competitiveness, increase the volume of freight transport, and improved customer satisfaction. A
cooperation agreement was signed in April 2010, in order to harmonize sales policies and improve the
quality of freight rail services offered.
In Belgrade, on July 30, 2010, representatives of the transport ministries of Serbia, Slovenia and Croatia
signed a Declaration on forming a joint railway company, Cargo 10, which will enable faster transport of
goods on Pan-European Corridor X and simplification of border procedures. It aims in the long-term to cut
the time needed to get from Ljubljana in Slovenia to Istanbul in Turkey, from 57 hours at present, to 35-40
hours, in part thanks to simplified border procedures. The agreement will simplify and speed up customs
procedures at border-crossings, as well as phytosanitary and veterinary controls.
The company Cargo 10, which will be headquartered in Slovenia, has not yet been registered, but this could
happen soon. A number of other countries have expressed interest in joining in the future, including FYR
Macedonia and Bosnia and Herezegovina. For the first few years, the rail companies in each country will
not be providing trains to run through Corridor X between Slovenia, Croatia, and Serbia. Instead, in the
first phase—envisaged to last a minimum of two years—there will be a one-stop-shop, with a focus on
harmonized pricing and allowing joint negotiation with one contract, one sales point, and one payment for a
given freight client. The one-stop-shop will prevent the need of having to negotiate three separate contracts
with each rail operator in three countries, and paying each one separately. In addition, increased
coordination of trains should lead to reduced transit times. Each of the three rail incumbents will invest a
third of Euro 100,000 as capital for Cargo 10, with profits and losses shared equally. Cargo 10 will start
with a team of 2 to 3 employees, focusing primarily on sales issues.
The legal framework to allow trains to run from Slovenia through to Serbia does not exist at present, and
this is envisaged in a later second phase. Even in this second phase, running a freight train without a change
of locomotives, wagons or driver is not envisaged. Instead, the focus will be on avoiding a change of
locomotives and wagons at border stations. Serbian Railways will purchase multi-system locomotives
through an EBRD loan for this purpose. For political/social reasons, having one driver operate a train from
Slovenia to Serbia does not appear feasible, even over the medium-term, according to Serbian Railways.
Cargo 10 Association will also be created in parallel, as a separate legal entity, and also based in Slovenia.
Its aim is to include as many members as possible—Trenitalia and DB Schenker have already expressed
interest in participating, as have the rail companies of Bosnia and Herzegovina. Cargo 10 Association
should help assist coordination and will be a fora to discuss issues regarding Corridor X and how to
improve corridor performance, and is not restricted to Cargo 10 participants.
A number of working groups have been established, including ones for: (i) border-crossing logistics; (ii)
sales; (iii) exchange of IT data; (iv) usage of wagons; and (v) transport quality. An important focus of the
border-crossing working group is simplifying transit control at borders—one example of change currently
under exploration is doing away with the need for phytosanitary and veterinary samples for transit
containers. It is these border-crossing procedures that lead to long transit times, and not the change of
locomotives or drivers.
Source: World Bank.

Railway Reform in South East Europe and Turkey: On the Right Track? Main Report
97
177. Perhaps the main lesson from the commercial test run was the importance of developing a
project-based operation with the explicit objective of developing a new rail product along an
entire rail corridor. The demonstration effect of showing what the actual travel time could be in
ideal conditions provides an impetus to focus attention on measurable improvements along the
entire route of the new rail product. While test run benchmark results cannot be easily replicated
in day-to-day train operations, a concrete illustration of improved performance, which was not
merely driven by the relevant state authorities but rail companies with a commercial interest in
improving transit times, can help to focus minds on the identified bottlenecks and the gaps
between timetable travel times and test run travel times. This corridor level approach to reducing
travel times is similar to the efforts and approach developed by RNE for other European rail
corridors. The main difference is that in the case of the RNE, a permanent working group is
established to monitor corridor level performance and introduce policies aimed at cutting transit
times, whereas in the Bosphorus Europe Express the team was developed for a one-off test run
along a section of Corridor X. Based on this experience a joint-rail company was established in
2010, with the aim of cutting transit times along Corridor X (Box 11).
CORRIDOR PERFORMANCE ALONG TEN-T/PAN-EUROPEAN CORRIDORS IV AND X90
Introduction
178. Delays in rail transport caused by border-crossing transit times are one of the main factors
affecting the competitiveness of rail transport vis-à-vis other transport modes—increasing
logistical costs and creating a negative perception of rail, in terms of reliability, predictability,
and punctuality. This is not a problem unique to South East Europe and Turkey—evidence from
the Austrian Court of Auditors indicates that in the case of Austria, 55 percent of delays in rail
freight are caused by delays in train handover at national borders.91
Nevertheless, the problem is
more acute in South East Europe and Turkey, and suggests that tackling rail infrastructure
investment needs, in and of itself will be insufficient to allow a rapid increase in the modal share
of international rail freight, in the absence of measures aimed at addressing delays at border
points.
179. In order to assess rail corridor performance along two TEN-T/Pan-European Corridors,
Corridors IV and X, a study was carried out with the aim of reviewing and assessing practices at
select border-crossing points (BCPs), with the aim of providing recommendations for improving
corridor performance. The two rail corridors include Corridor IV from Budapest-Curtici-Ruse-
Svilengrad and Corridor Xb from Budapest-Subotica-Nis-Dimitrovgrad-Sofia, joining up to
Corridor IV from Sofia to Ruse and Svilengrad. These corridors represent two ways of
connecting Germany and Austria to Turkey, and thus represent potentially high rail freight traffic
volumes. In addition, the corridors selected include routing through Romania and Bulgaria, two
EU member states which have liberalized rail freight transport versus routing through Serbia,
where Serbian Railways is the only authorized rail operator.
90
See Uhl, Klaus-Juergen (2010). 91
Rechnungshof 2010, ÖBB: Langsamfahrstellen, Bund 2010/5, p.119-120.
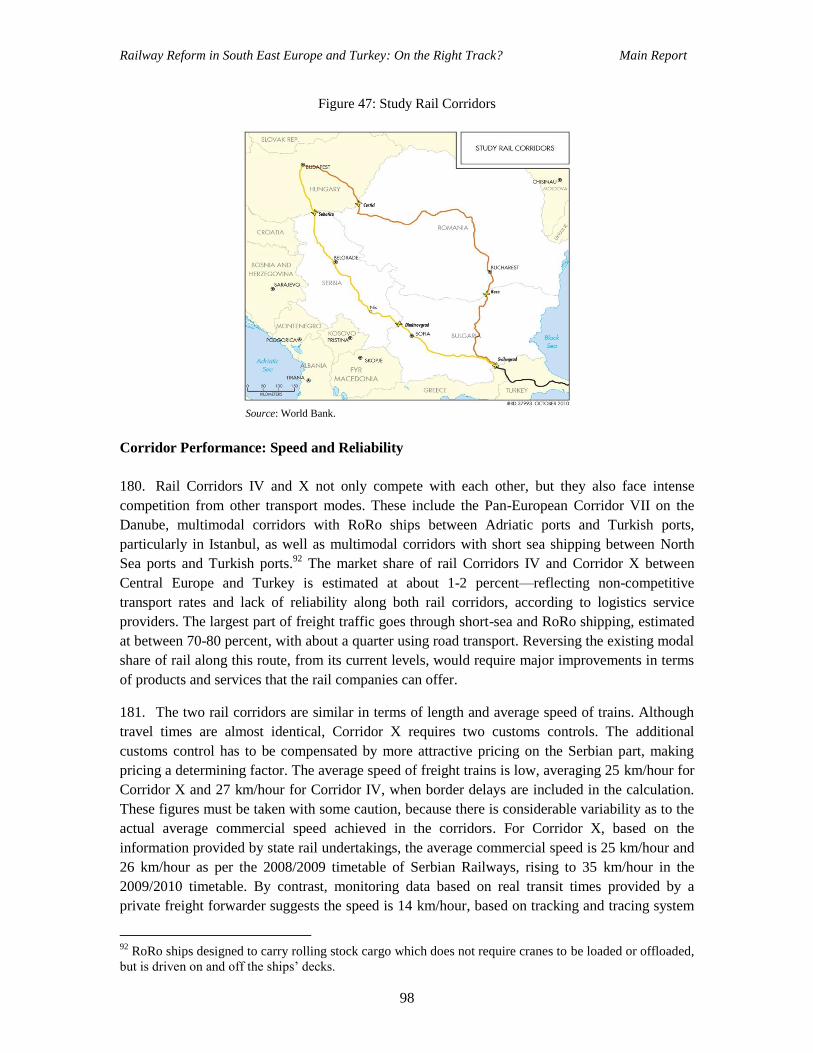
Railway Reform in South East Europe and Turkey: On the Right Track? Main Report
98
Figure 47: Study Rail Corridors
Source: World Bank.
Corridor Performance: Speed and Reliability
180. Rail Corridors IV and X not only compete with each other, but they also face intense
competition from other transport modes. These include the Pan-European Corridor VII on the
Danube, multimodal corridors with RoRo ships between Adriatic ports and Turkish ports,
particularly in Istanbul, as well as multimodal corridors with short sea shipping between North
Sea ports and Turkish ports.92
The market share of rail Corridors IV and Corridor X between
Central Europe and Turkey is estimated at about 1-2 percent—reflecting non-competitive
transport rates and lack of reliability along both rail corridors, according to logistics service
providers. The largest part of freight traffic goes through short-sea and RoRo shipping, estimated
at between 70-80 percent, with about a quarter using road transport. Reversing the existing modal
share of rail along this route, from its current levels, would require major improvements in terms
of products and services that the rail companies can offer.
181. The two rail corridors are similar in terms of length and average speed of trains. Although
travel times are almost identical, Corridor X requires two customs controls. The additional
customs control has to be compensated by more attractive pricing on the Serbian part, making
pricing a determining factor. The average speed of freight trains is low, averaging 25 km/hour for
Corridor X and 27 km/hour for Corridor IV, when border delays are included in the calculation.
These figures must be taken with some caution, because there is considerable variability as to the
actual average commercial speed achieved in the corridors. For Corridor X, based on the
information provided by state rail undertakings, the average commercial speed is 25 km/hour and
26 km/hour as per the 2008/2009 timetable of Serbian Railways, rising to 35 km/hour in the
2009/2010 timetable. By contrast, monitoring data based on real transit times provided by a
private freight forwarder suggests the speed is 14 km/hour, based on tracking and tracing system
92
RoRo ships designed to carry rolling stock cargo which does not require cranes to be loaded or offloaded,
but is driven on and off the ships‘ decks.
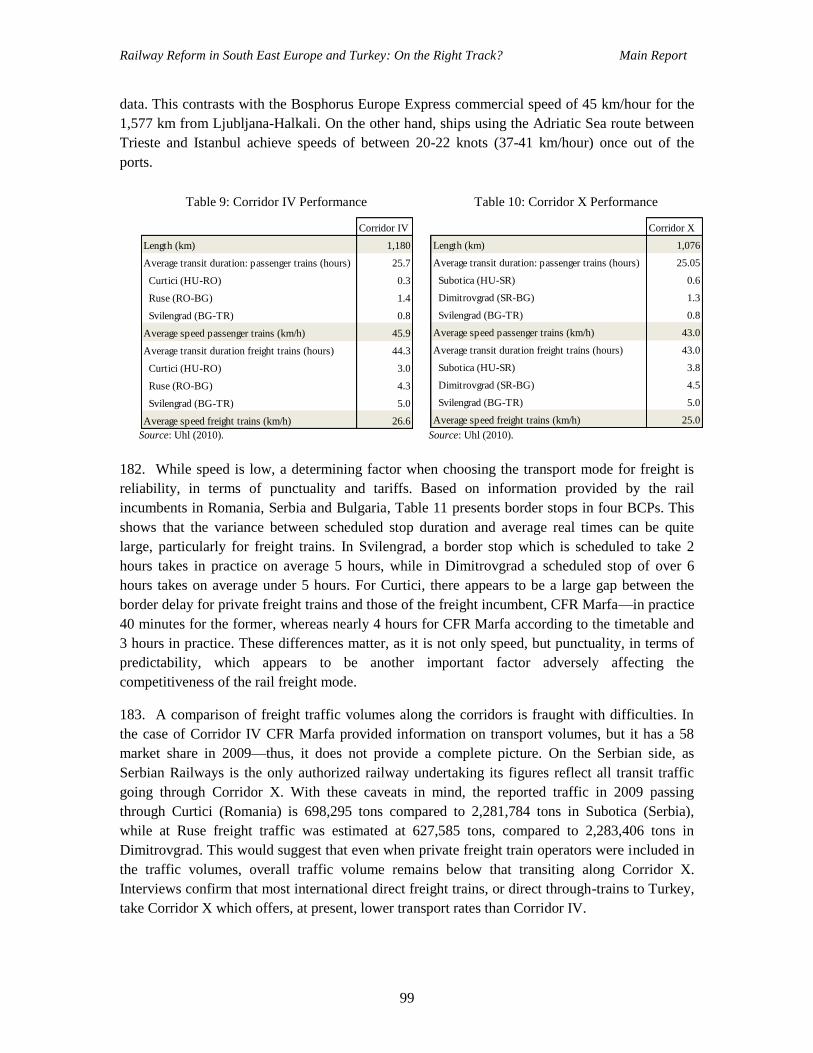
Railway Reform in South East Europe and Turkey: On the Right Track? Main Report
99
data. This contrasts with the Bosphorus Europe Express commercial speed of 45 km/hour for the
1,577 km from Ljubljana-Halkali. On the other hand, ships using the Adriatic Sea route between
Trieste and Istanbul achieve speeds of between 20-22 knots (37-41 km/hour) once out of the
ports.
Table 9: Corridor IV Performance Table 10: Corridor X Performance
Source: Uhl (2010). Source: Uhl (2010).
182. While speed is low, a determining factor when choosing the transport mode for freight is
reliability, in terms of punctuality and tariffs. Based on information provided by the rail
incumbents in Romania, Serbia and Bulgaria, Table 11 presents border stops in four BCPs. This
shows that the variance between scheduled stop duration and average real times can be quite
large, particularly for freight trains. In Svilengrad, a border stop which is scheduled to take 2
hours takes in practice on average 5 hours, while in Dimitrovgrad a scheduled stop of over 6
hours takes on average under 5 hours. For Curtici, there appears to be a large gap between the
border delay for private freight trains and those of the freight incumbent, CFR Marfa—in practice
40 minutes for the former, whereas nearly 4 hours for CFR Marfa according to the timetable and
3 hours in practice. These differences matter, as it is not only speed, but punctuality, in terms of
predictability, which appears to be another important factor adversely affecting the
competitiveness of the rail freight mode.
183. A comparison of freight traffic volumes along the corridors is fraught with difficulties. In
the case of Corridor IV CFR Marfa provided information on transport volumes, but it has a 58
market share in 2009—thus, it does not provide a complete picture. On the Serbian side, as
Serbian Railways is the only authorized railway undertaking its figures reflect all transit traffic
going through Corridor X. With these caveats in mind, the reported traffic in 2009 passing
through Curtici (Romania) is 698,295 tons compared to 2,281,784 tons in Subotica (Serbia),
while at Ruse freight traffic was estimated at 627,585 tons, compared to 2,283,406 tons in
Dimitrovgrad. This would suggest that even when private freight train operators were included in
the traffic volumes, overall traffic volume remains below that transiting along Corridor X.
Interviews confirm that most international direct freight trains, or direct through-trains to Turkey,
take Corridor X which offers, at present, lower transport rates than Corridor IV.
Corridor IV
Length (km) 1,180
Average transit duration: passenger trains (hours) 25.7
Curtici (HU-RO) 0.3
Ruse (RO-BG) 1.4
Svilengrad (BG-TR) 0.8
Average speed passenger trains (km/h) 45.9
Average transit duration freight trains (hours) 44.3
Curtici (HU-RO) 3.0
Ruse (RO-BG) 4.3
Svilengrad (BG-TR) 5.0
Average speed freight trains (km/h) 26.6
Corridor X
Length (km) 1,076
Average transit duration: passenger trains (hours) 25.05
Subotica (HU-SR) 0.6
Dimitrovgrad (SR-BG) 1.3
Svilengrad (BG-TR) 0.8
Average speed passenger trains (km/h) 43.0
Average transit duration freight trains (hours) 43.0
Subotica (HU-SR) 3.8
Dimitrovgrad (SR-BG) 4.5
Svilengrad (BG-TR) 5.0
Average speed freight trains (km/h) 25.0

Railway Reform in South East Europe and Turkey: On the Right Track? Main Report
100
Table 11: Border-crossing Point Stops (minutes)
BCP Stop (minutes)
Timetable Average real time
Subotica
Freight 180 225
Passenger 32.5 32.5
Curtici CFR Marfa 235 180
Private freight trains 40 40
Passenger 15 19
Svilengrad
Freight 120 300
Passenger 35 45
Dimitrovgrad
Freight 400 269
Passenger 60 75 Source: Uhl (2010).
184. One of the factors working against traffic diverting to the rail corridors, even if commercial
speeds were higher, is the absence of full interoperability in the rail sector. This is an issue within
Europe and not only South East Europe and Turkey, because large tracts of infrastructure are
incompatible, as are rolling stock and procedures to approve rolling stock across networks.
Different track gauge widths, electrification standards and safety and signaling systems make it
more difficult and costly. In the case of the EU, this is being tackled through a memorandum of
understanding in 2005 to allow for the deployment of the European Rail Traffic Management
System (ERTMS). For the two corridors in question, interoperability could reduce transit times
by: (i) not requiring changes of traction at BCPs; and (ii) no change of locomotive drivers at
BCPs. Assuming technical harmonization occurred, the task would remain of ensuring that
regulatory authorities enforce agreed standards. This can be particularly delicate when it comes to
the issue of locomotive personnel—for locomotive drivers, in addition to an international license,
this would require obtaining a certificate from the infrastructure manager to run on specific
sections of the network and undergo certain examinations according to national rules. This would
require the transposition, adoption and application of Directive 2007/59/EC, on the certification
of train drivers operating locomotives and trains on the rail system in the EU.
Review of Existing Border-crossing Arrangements
185. An assessment of border-crossing arrangements (BCAs) must start with an evaluation of
their legal basis. The legal basis underpins and regulates border-crossing practices and any future
potential investment measures would run the risk of being ineffective, unless legal requirements
force rail and border actors to act more efficiently. In order to assess existing BCAs along the two
rail corridors, the following methodology was applied: the Framework BCA developed in the
SEETO project, which is in full compliance with the EU rail legislation, was taken as a
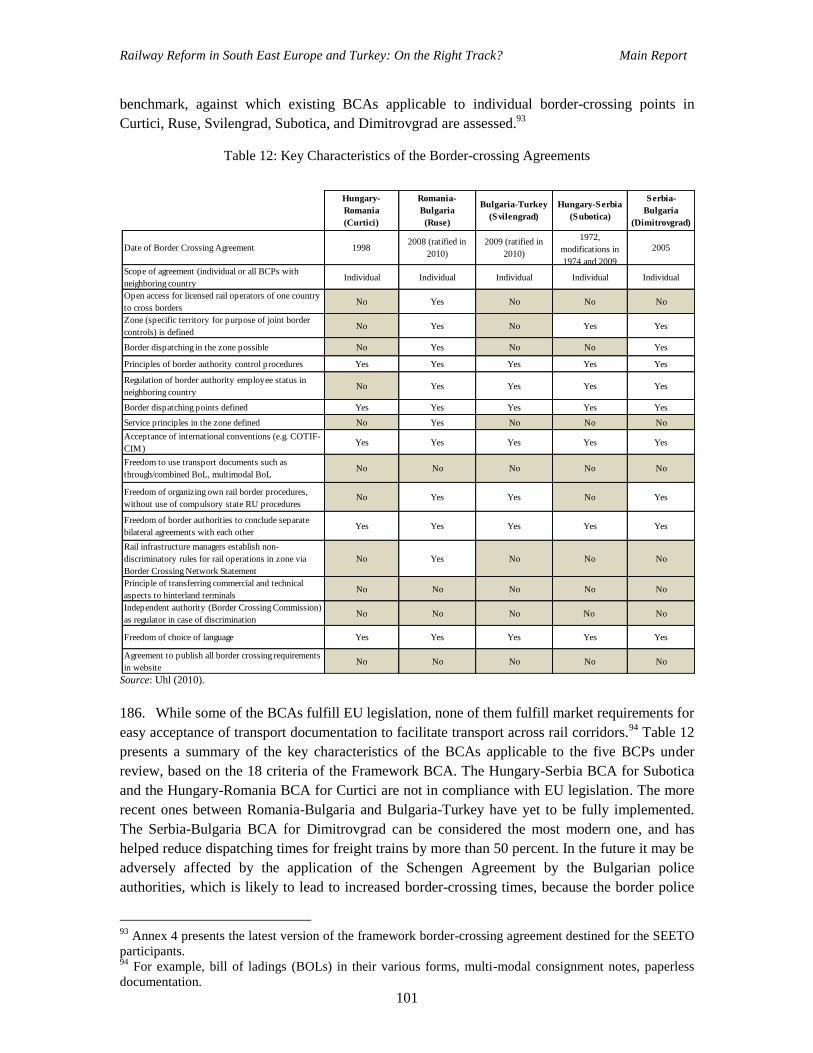
Railway Reform in South East Europe and Turkey: On the Right Track? Main Report
101
benchmark, against which existing BCAs applicable to individual border-crossing points in
Curtici, Ruse, Svilengrad, Subotica, and Dimitrovgrad are assessed.93
Table 12: Key Characteristics of the Border-crossing Agreements
Source: Uhl (2010).
186. While some of the BCAs fulfill EU legislation, none of them fulfill market requirements for
easy acceptance of transport documentation to facilitate transport across rail corridors.94
Table 12
presents a summary of the key characteristics of the BCAs applicable to the five BCPs under
review, based on the 18 criteria of the Framework BCA. The Hungary-Serbia BCA for Subotica
and the Hungary-Romania BCA for Curtici are not in compliance with EU legislation. The more
recent ones between Romania-Bulgaria and Bulgaria-Turkey have yet to be fully implemented.
The Serbia-Bulgaria BCA for Dimitrovgrad can be considered the most modern one, and has
helped reduce dispatching times for freight trains by more than 50 percent. In the future it may be
adversely affected by the application of the Schengen Agreement by the Bulgarian police
authorities, which is likely to lead to increased border-crossing times, because the border police
93
Annex 4 presents the latest version of the framework border-crossing agreement destined for the SEETO
participants. 94
For example, bill of ladings (BOLs) in their various forms, multi-modal consignment notes, paperless
documentation.
Hungary-
Romania
(Curtici)
Romania-
Bulgaria
(Ruse)
Bulgaria-Turkey
(Svilengrad)
Hungary-Serbia
(Subotica)
Serbia-
Bulgaria
(Dimitrovgrad)
Date of Border Crossing Agreement 19982008 (ratified in
2010)
2009 (ratified in
2010)
1972,
modifications in
1974 and 2009
2005
Scope of agreement (individual or all BCPs with
neighboring countryIndividual Individual Individual Individual Individual
Open access for licensed rail operators of one country
to cross bordersNo Yes No No No
Zone (specific territory for purpose of joint border
controls) is definedNo Yes No Yes Yes
Border dispatching in the zone possible No Yes No No Yes
Principles of border authority control procedures Yes Yes Yes Yes Yes
Regulation of border authority employee status in
neighboring countryNo Yes Yes Yes Yes
Border dispatching points defined Yes Yes Yes Yes Yes
Service principles in the zone defined No Yes No No No
Acceptance of international conventions (e.g. COTIF-
CIM)Yes Yes Yes Yes Yes
Freedom to use transport documents such as
through/combined BoL, multimodal BoLNo No No No No
Freedom of organizing own rail border procedures,
without use of compulsory state RU proceduresNo Yes Yes No Yes
Freedom of border authorities to conclude separate
bilateral agreements with each otherYes Yes Yes Yes Yes
Rail infrastructure managers establish non-
discriminatory rules for rail operations in zone via
Border Crossing Network Statement
No Yes No No No
Principle of transferring commercial and technical
aspects to hinterland terminalsNo No No No No
Independent authority (Border Crossing Commission)
as regulator in case of discriminationNo No No No No
Freedom of choice of language Yes Yes Yes Yes Yes
Agreement to publish all border crossing requirements
in websiteNo No No No No

Railway Reform in South East Europe and Turkey: On the Right Track? Main Report
102
of Schengen states are not allowed to carry out passport controls on non-Schengen territory. At
the other end, the Bulgaria-Turkey old BCA is still in force, leading to considerable delays due to
the lack of joint border dispatching and joint border controls.
Dispatching Procedures
187. Findings from earlier studies concerning dispatching procedures at Subotica and
Dimitrovgrad shed light on the main reasons leading to delays at the BCPs along both corridors.95
The main causes of delays were identified as: (i) inefficient organization of state rail undertakings
due to lack of efficient communication; (ii) non-availability of locomotives; (iii) incorrectly
assembled trains; and (iv) border police and customs controls. Interviews undertaken in 2010
confirmed a similar set of issues for the other three BCPs reviewed.
188. Where the rail sector has been liberalized, processing times differ between state and non-
state rail undertakings. For example, in the case of the Romania-Bulgaria BCA for Ruse, even
without the new BCA being implemented, private rail undertakings are dispatching trains
between the two countries, and doing so considerably faster than state-run rail undertakings.
Whereas state rail undertakings interpret conducting ―joint‖ activities as those done in the same
border station, in practice one state rail undertaking does the checking first and the second does
the same afterwards. With private rail undertakings, joint activities are undertaken simultaneously
in order to speed up the process. Thus, one of the major factors contributing to reducing
dispatching times for freight trains to 30 minutes or less, largely comes from a different approach
or attitude, leading to a radical simplification even in the absence of an Electronic Data
Interchange (EDI) or new investments.
189. The border dispatching procedures of private operators differ in a number ways from those
of the state rail undertakings. First, private rail undertakings do not have lengthy procedural
descriptions laid down in memoranda or bilateral agreements between rail undertakings. Second,
private rail undertakings do not have extensive written internal procedures, but instead
concentrate on the application of the Standard Contract for the Use of Wagons (CUU).96
The
underlying principle of CUU is mutual confidence and simplified procedures in case of damaged
wagons. Third, agreements between private rail undertakings are based on rapid dispatching,
which is to say that procedures are based on customer requirements and assume a high degree of
mutual acceptance rather than lack of trust. Fourth, commercial dispatching and technical
inspections are carried out jointly and not separately by each rail undertaking—as is the case with
the state incumbents. Wagons are inspected jointly and based on CUU/AVV, which is not the
case for state rail undertakings.97
Last, the private rail undertakings are working under
95
A review of these two BCPs was carried out both in the GTZ and SEETO projects mentioned earlier. 96
The CUU is a framework contract designed to replace provisions currently governing exchanges of
wagons between railway freight operators The aim of CUU is to simplify the regime governing wagon
exchanges in international traffic to freight sector liberalization and competition between railway operators.
The aim is to make cross-border operation of freight trains more efficient and to avoid the need to conclude
separate contracts for each wagon movement in international traffic. For further information see
www.uic.org/compresse.php/cp216_en.pdf 97
The CUU Agreement is valid for the technical transfer inspections of freight wagons which are
exchanged between rail undertakings, whenever the rail undertaking that formed the train hands over the
train to the receiving rail undertaking and the receiving rail undertaking accepts the train without carrying
the technical transfer inspection at the point of exchange.
Railway Reform in South East Europe and Turkey: On the Right Track? Main Report
103
considerable time pressure to not only fulfill customer requirements and meet reliability
expectations, but also to avoid unnecessary delay of traction due to cumbersome technical
procedures. This suggests that the main impediment to faster and more efficient border
procedures is lack of communication and mutual confidence between state rail undertakings and
infrastructure managers.
190. The non-availability of locomotives is an important factor leading to delays, but this
appears to reflect fleet management rather than a lack of locomotives per se. Since locomotive
turnaround times are timetabled on the basis of international and national freight timetables,
locomotives will automatically be sent to other destinations when the train is too late, usually
after about 30 to 40 minutes. In this case, the international freight train has to wait either for
reserve locomotives or for another locomotive that is available in the depot. It is understandable
that the number of locomotives cannot be determined in relation to potential delays. Although the
lack of locomotives in terms of fleet size is often mentioned in reports—and this was confirmed
during site visits and in conversations at rail headquarters—it is far from certain that the non-
availability of locomotives is due to an actual lack of locomotives. Instead, they are simply not
available when needed and are used somewhere else. Despite a sharp decline of freight volumes
over the last quarter of 2008 and first quarter of 2009, accumulated delays due to non-availability
of locomotives did not decrease, suggesting that it is the delays along the various steps of a
corridor which prevent trains from meeting timetables, which then leads to non-availability of
locomotives.
Box 12: Joint Locomotive Pool
A 2005 ECORYS study advised investigating the option of setting up a joint locomotive pool for the
Balkan countries. The locomotives would provide traction for all international trains or, at least, for long
distance international trains along Corridors IV and X. While the problem does not exist for passenger
trains, freight operations would benefit from a start up consisting of a limited number of locomotives
leased on monthly basis and allocated to a limited number of trains. The rolling stock pool proposal seeks
not only to improve the access to rolling stock, but also to create a competitive situation of rail versus
road. It would be a cross-regional and accessible rolling stock pool for all market participants with the
contribution of three main actors.
However, the idea of a joint locomotive pool for the study countries is not in compliance with current
European competition policy. As laid out in Articles 101 (concerted practices) and 102 (dominant
position) of the Treaty of Lisbon, such a pool could—depending on ownership and practice—result in a
monopoly run by incumbent state railways. By contrast, the pool of manufacturers and financing
institutions in the private pools such as Mitsui Dispolok and Angel Trains are in full compliance with EU
and national competition policy. They guarantee open access to all users of traction since they are
available to all rail undertakings in the EU and in non-EU countries. No regional or other restrictions, or
state intervention, limit their use and the study countries can use them.
The Community of European Railway and Infrastructure Companies (CER) has advocated that new
financing instruments should be explored for rolling stock compliant with EU state aid limitations.
Options to be considered may include public-private partnerships that combine EU grants with private
financing, as well as the development of new rolling stock ownership structures, such as rolling stock
pools and/or leasing.
Source: Uhl (2010).

Railway Reform in South East Europe and Turkey: On the Right Track? Main Report
104
191. The absence of communication between border authorities and rail companies using
electronic technology contributes to delays. Current practice in the region is to manually copy
documents, filling in forms, stamping, and signing. This appears to be mostly the result of a
traditional mindset that is not willing to innovate, apply modern technology and streamline
paperwork. Inaccurate documents are also responsible for delays, as they are often lost during
border dispatching when a train must cross several border points. With the introduction of an EDI
system, a shipper or train operator could send complete documentation by electronic means to the
BCPs and would help solve this problem.
IMPROVING THE INSTITUTIONAL AND REGULATORY ENVIRONMENT98
192. The border-crossing audit indicated the need for a number of institutional and regulatory
improvements, based on the harmonized framework border-crossing agreement (BCA) that has
been developed for SEETO countries. This framework BCA is based on European cross-border
agreements, in particular those between Switzerland and Germany, Germany and Austria, and
Austria and Hungary.99
The BCAs for Dimitrovgrad, Ruse, and Svilengrad are based on this
harmonized framework, which has five key principles: (i) compliance with open access standards
that are required by EU directives in force; (ii) introduction of the concept of a Joint Border Zone;
(iii) cooperation between border authorities—in particular, the possibility for the border authority
of one country to be active in a neighboring country; (iv) police and customs control over moving
trains; and (v) establishment of Border-crossing Commissions (BCCs) for open access border-
crossings. The BCA is the key framework document underpinning the various other agreements
in BCPs, as shown in Figure 48.
Figure 48: Hierarchy of Agreements at BCPs
Border-crossing Agreement (BCA) between Governments
Subsequent agreements between border police, customs, sanitary, phytosanitary, etc.
Subsequent agreements between the authorities and the infrastructure managers and rail
undertakings
Bilateral/multilateral agreements/contracts
among rail undertakings
Bilateral/multilateral agreement/contracts
among infrastructure managers
Source: Uhl (2010).
193. One of the key elements of the framework BCA is that of the Joint Border Zone.100
In a
Joint Border Zone rail infrastructure is managed by the two national infrastructure managers. In
such a Zone any rail undertaking with licenses granted by one country can use the part of the zone
in the neighboring state if it fulfills the requirements of the infrastructure managers of the
98 This section of the chapter is based on a consultancy commissioned for this report. See Uhl, Klaus-
Juergen (2010), Review of Practices at Border-crossing Points in Selected Rail Corridors and Assessment
to Improve Performance. Consultant Report prepared for the World Bank, July 2010. 99
The framework agreement can be found in Annex 4. 100
As specified in the proposed framework BCA, in particular Article 1.18 (Definition), Article 3 (The
Railway Zone), and Article 4 (Border dispatching for rail transport in the railway zone).

Railway Reform in South East Europe and Turkey: On the Right Track? Main Report
105
neighboring state and pays the infrastructure charge to be levied. In a Joint Border Zone the rail
undertaking can carry out the necessary technical and commercial dispatching, change
locomotives and rail personnel and carry out the actions required by the respective border
authorities—border police, customs, phytosanitary, sanitary, veterinary health authorities, among
others—according to the rules and regulations established by the two infrastructure managers and
the respective national border authorities. A rail undertaking can only leave the Joint Border Zone
if it has fulfilled the requirements of the border authorities. The following service principles are
valid in the Zone:101
Single window principle for freight customs. All customs services should be carried out
by the customs authorities of both countries at one location in the Joint Border Zone.
One Stop Shop for the use of rail infrastructure in the Joint Border Zone. A One Stop
Shop in this context means a body that designs an international train path. The applicant
receives all information, including the timetable, fees and technical parameters that
enable one to use the path. Any licensed rail undertaking can purchase rail infrastructure
border services—such as path, shunting, and communication—from one of the two
infrastructure managers. The rules and regulations of the One Stop Shop are specified in
a joint network statement, which can be an annex to the network statement demanded by
Directive 2001/14/EC.
Passenger control on moving trains. Border police and customs of both states carry out
controls while the train is moving. The zone in which such a control is carried out might
be different from the zone in which the commercial and technical dispatching is done by
the rail undertakings and infrastructure managers.
194. At present, every BCP on Corridor IV and X has a BCC that meets regularly, and is
responsible for arbitration between rail undertakings using rail border facilities, improvements of
border services, any other differences between the contracting parties resulting from the BCA.
However, the basic difference of the working objectives of the existing and proposed BCC are the
following: (i) non-discriminatory access for all rail undertakings in the Joint Border Zone; (ii) an
environment fostering fair competition; (iii) arbitration between infrastructure managers and rail
undertakings concerning the border-crossing network statement; and (iv) representatives of the
rail regulators of both states as permanent members of the BCC.
195. A second key element to expedite border-crossings is the Agreement on Infrastructure
Interconnection (AII), which is signed between infrastructure managers. A good example is the
agreement proposed by SEETO to be found in Annex 5, which was approved by the SEETO
Commission representing the transport ministries of the Western Balkan countries. Its application
is at present under discussion between Kosovo and FYR Macedonia and Croatia and Serbia. The
101
In a Joint Border Zone, the laws and regulations of the other state are valid. Persons and goods are
treated with the same procedures and with the same legal consequences as if they were in the territory of
their own state. The state to which the territory belongs carries out the procedures before the authorities of
the other state carry out their procedures. It also includes actions such a police intervention and the putting
into custody of persons with the exceptions that have to be agreed in the agreement or in a separate
agreement between the customs and police authorities of the two countries.

Railway Reform in South East Europe and Turkey: On the Right Track? Main Report
106
agreement is a subsequent bilateral agreement resulting from the framework border-crossing
agreement on border dispatching for rail transport. Hence, it refers for its definitions and
procedures to the Framework BCA. Its objective is to improve international rail transport between
the rail networks of two neighboring states and is based on European Directives 91/440/EEC,
2001/14/EC and 2001/16/EC. The agreement contains the framework conditions for the
interconnection of rail infrastructure between the two neighboring infrastructure managers for
their border-crossings. Whenever specific rules and regulations are required in order to regulate
particular local and operational matters, the parties to the agreement conclude specific
agreements.102
Potential Investments in Border-crossing Rail Infrastructure
196. A potential investment measure could be the transfer of certain border-crossing activities to
major inland terminals. From this perspective, international trains should only be
inspected/shunted/split at a limited number of inland terminals in order to: (i) reduce border-
crossing times; (ii) achieve higher commercial speed for trains; and (iii) streamline border
procedures. However, this notion is based on conventional single wagonload or wagon groups
which are typical of the incumbent state-owned railways. With the entry of non-state private
undertakings, the rail concept changes to one with block train systems: (i) from sidings to sidings
in conventional block trains; (ii) from sidings to terminals or vice versa in conventional block
trains; (iii) from terminal to terminal in conventional block trains—as is the case with the
Schenker-Proodos trains, Express-Interfracht trains, and terminal to terminal traffic in combined
transport as is done by Intercontainer, AdriaKombi on the two corridors. The inland terminals
should be a customs zone for import/export traffic as far as the transit through Serbia is
concerned. There is the case for a new inland terminal in Belgrade, given the nature of transit
traffic, but this could be built using a public-private partnership (PPP), as has been done in
Hungary and Romania.103
197. The introduction of EDI transmission between select border stations appears to be an
investment that could yield significant reductions in border delays. At present, communication
102
A more detailed agreement, which already includes the specific rules for local matters in its four
Annexes, is the agreement between the Hungarian and Romanian infrastructure manager for Curtici
(Romania) and Lököshaza (Hungary), concluded in May 2007. This was necessary as Hungarian private
operators wished to enter Romania via Curtici. Since the Hungarian and the Romanian governments have
so far not succeeded in concluding a new BCA which is in full compliance with EU legislation, the two
infrastructure managers were forced to make such an agreement to avoid any intervention by their
respective national regulatory bodies. The agreement still relies on the complex procedures of state-run
infrastructure managers but has opened Curtici in its Chapter I.7. Its basic task is to regulate: (i) the
exchange of information between the two neighboring infrastructure managers and between the
infrastructure managers and the rail undertakings; (ii) the procedure to secure path allocation between the
Hungarian and Romanian networks with respective applications for path allocation; (iii) signaling and
communication procedures between the two IMs; (iv) procedures concerning electrical installations, in
particular maintenance since the BCPs are electrified; and (v) joint activities at the BCP Curtici (Romania). 103
Serbian officials have stated their desire to go ahead with the construction of an intermodal
transportation terminal in Belgrade. According to press reports, the construction of the terminal and access
roads is expected to cost Euro 20 million. In December 2010 Serbia set up an intermodal transportation
development center to coordinate intermodal transportation through linking the private and public sectors,
ministries, customs, railway, and freight forwarders. This is part of a wider project being implemented by
the Ministry of Infrastructure, the Belgrade Chamber of Commerce, and the Dutch government.

Railway Reform in South East Europe and Turkey: On the Right Track? Main Report
107
across BCPs is limited to telephones, faxes, and e-mails, as well as manual copying of
documentation, as noted above. The main potential of EDI is in the reduction of dispatching
times. This would require IT equipment to be installed: (i) within the border stations and EDI
between the border stations in the Joint Border Zone; (ii) between rail undertakings and
infrastructure managers; (iii) between neighboring infrastructure managers, and (iv) between
shippers/forwarders and rail undertakings. This would allow pre-approval messages in an
electronic format to be generated automatically when a train is on route. It would apply to
requests for locomotives and handover trains, and electronic transmission of all necessary
commercial and train documents. This would minimize the paperwork that would need to be
physically carried and whose losses often lead to delays. According to a study in the SEETO
project, this could reduce handling times by 70 percent for state-run rail undertakings.
198. The development of a harmonized or corridor level EDI network should begin with simple
train recognition systems, thus solving the problem of unreliable arrival times of trains at the
BCPs. The following steps of implementation are recommended: (i) install minimum IT and EDI
equipment at the BCP; (ii) establish automatic train recognition using ATRS-RFID; (iii)
interconnect EDI systems of two separate BCPs; (iv) interconnect EDI of BCPs and hinterland
offices; (v) establish automatic train check systems at specific locations; and (vi) connect
operational dispatch level (ODL) and commercial dispatch level (CDL) vertically. The
introduction of such a system could be implemented on a pilot basis, with at least three countries
involved from a given rail corridor, to appraise procedures, test equipment, test data
communication, convince personnel about the benefits of the EDI, and training. Such a pilot
could be unrolled in a phased approach.
199. Such a pilot EDI could be installed in a phased approach, with a minimum testing phase of
12 months to carry out tasks and gather information about functionality and usability.104
The pilot
could take place at Svilengrad (Bulgaria)/Kapikule (Turkey) or Dimitrovgrad (Serbia). These
BCPs are subject to new BCAs that are in compliance with EU legislation. Svilengrad/Kapikule
has the most frequent delays and the longest dispatching time, while Dimitrovgrad already has a
Joint Border Zone for joint railway dispatching where all actors with the exception of border
police are involved. The case would need to be made to Turkey and Serbia‘s rail, border, and
state authorities.
200. In order to improve the performance of both corridors, a recommended low-cost action plan
would concentrate on two main activities destined to be accomplished by 2011-2012, which could
be carried out simultaneously. These are: (i) ensuring legal compliance of the BCAs on both
corridors with EU legislation, including subsequent agreements; and (ii) introducing a pilot
project EDI, possibly in Dimitrovgrad or Svilengrad/Kapikule where delays are particularly
acute. Since both actions imply activities of state authorities on both corridors, they would not
create any competitive distortion—and they would be in compliance with the respective chapters
on competition of the Treaty of Lisbon. Meanwhile, transferring border-crossing activities to
104
This could be done in four phases: (i) preplanning—planning of equipment and locations to be used for
carrying out the pilot, evaluation of costs, and definition of milestones; (ii) implementation—installation of
equipment and development of applications and training of relevant personnel who will be using EDI; (iii)
piloting—minimum 12 month to carry our tasks and gather knowledge about technologies and usability;
and (iv) evaluation.

Railway Reform in South East Europe and Turkey: On the Right Track? Main Report
108
inland terminals needs closer scrutiny so as to avoid possible competitive distortions, and to
ascertain whether there is a genuine need to move border-crossing activities to inland terminals—
this could be financed by private investment.
Table 13: Institutions Responsible for Proposed Recommendations
Source: Uhl (2010).
201. The recommendations proposed are in the areas of legal reform, technological change,
information flows, and physical investments. Table 13 presents a summary of reform proposals,
indicating the responsible institution for each of them. The package of proposed
recommendations foresees the ministries in charge of railways, the infrastructure managers, and
the rail undertakings taking the lead, highlighting that the proposed recommendations require
action on the part of state actors as well as the rail undertakings themselves. With regard to
improving the ―technology‖ to reduce border-crossing times, the onus is largely on the state rail
undertakings to ensure locomotive availability, mutual acceptance of wagon equipment,
introduction of simplified break control, and enhanced information flows. While the legal basis
needs to be put in place to expedite border-crossing times, the real test is the introduction of
changes in dispatching approach and information flow, to ensure that there are genuine gains in
terms of reduced border delays. Based on the analysis undertaken, the priorities in terms of
reform differ by BCP. Table 14 presents the four key areas: (i) border-crossing agreements; (ii)
interconnection agreements; (iii) corridor related electronic transmission; and (iv) coordination
between state rail undertakings. Developing new border-crossing agreements is a priority for
Curtici and Subotica. The priority for Ruse and Svilengrad is improved coordination between
state-run rail undertakings. For Dimitrovgrad, corridor-level data transmission would be the most
useful for reducing border delays.
Responsible Participants
Legal basis
Border crossing agreementGovernments of two states, initiative of
ministries in charge of railways
Joint Operation ZoneGovernments of two states, initiative of
ministries in charge of railways
Border police, customs, phytosanitary, snaitary
and other border authorities
Non-discriminatory Border Crossing CommissionGovernments of two states, initiative of
ministries in charge of railwaysMarket regulation agency
Agreement of infrastructure interconnection Infrastructure managers
Path management through One Stop Shop Infrastructure managers
Single window for freight customs For BCP with non EU member states
Technology
Locomotive availability State owned rail undertaking
Cooperation between incumbent state rail undertakings State owned rail undertaking
Mutual acceptance of wagon equipment State owned rail undertaking
Mutual acceptance of traction equipment State owned rail undertaking
Introduction of simplified break control State owned rail undertaking
Full technical interoperability and harmonization Ministries in charge of railwaysInfrastructure managers, rail undertakings, rail
industry
Information flows
Information on train formation All rail undertakings Infrastructure managers
Electronic data interchange All rail undertakings Infrastructure managers
Investment measures
Transferral of BCP to inland terminals All rail undertakingsIf infrastructure investments are necessary, the
respective infrastructure manager in the terminal

Railway Reform in South East Europe and Turkey: On the Right Track? Main Report
109
Table 14: Priority Areas of Reform by Border-crossing Point
Curtici
(Hungary-
Romania)
Ruse
(Romania-
Bulgaria)
Svilengrad
(Bulgaria-
Turkey)
Subotica
(Hungary-
Serbia)
Dimitrovgrad
(Serbia-
Bulgaria)
Border-crossing agreement conforming
to EU standard 1 N/A N/A 1 N/A
Interconnection agreement conforming to
EU standard 4 2 2 2 3
Corridor related electronic data
transmission 3 3 3 3 1
Improved coordination between state run
rail undertakings and acceptance of EU
internal market rules
2 1 1 4 2
Source: Uhl (2010).
A EUROPEAN PERSPECTIVE ON INTERNATIONAL FREIGHT CORRIDORS
202. Even within the EU, rail transport is currently the least integrated transport mode. This
leads to delays, extra costs, and insufficient use of potential rail freight, especially for time-
sensitive cargo. Rail freight, for which international activity represents 50 percent of total
activities, will not be able to develop fully if rail infrastructure does not deliver a better serviced
for freight operators, especially for long-distances that cross borders. With this in mind, the
European Commission proposed a regulation on a European rail network for competitive
freight—to be based on a number of rail freight corridors at the end of 2008.105
203. This new EU regulation giving a boost to rail freight entered into force on November 9,
2010. Regulation No 913/2010 makes it mandatory to create a European rail network for
competitive freight based on international freight corridors, recognizing that the need to
strengthen the competitiveness of rail freight requires a corridor approach, involving corridors
that cross national borders.106
The regulation aims to develop high-quality rail infrastructure on
nine rail freight corridors linking the main industrial regions in Europe, although additional
corridors could be added at a later date. Among the freight corridors that must be established by
November 10, 2013 is the Bucarest-Constanta, Prague-Vienna/Bratislava-Budapest, Vidin-Sofia-
Thessaloniki-Athens corridor, which passes through both Bulgaria and Romania. The regulation
aims to improve operations on international freight corridors through improved cooperation of
rail infrastructure managers on operational issues—such as coordination of investments and
works, capacity allocation, and traffic management—with guarantees in terms of performance,
reinforced cooperation with terminals, centralized publication of conditions of access, and
enhanced power for regulatory bodies to monitor non-discriminatory access.
204. Freight traffic along each corridor would be managed by a board made up of the
infrastructure managers of that corridor, an approach that is similar to that of RNE corridors.
Article 13 of Regulation No 913/2010 states that such a management body shall establish a joint
105
See the European Parliament press release of May 4, 2010, ―Rail Freight: MEPs want flexibility and
optimum efficiency for international rail corridors‖, available at:
http://www.europarl.europa.eu/en/pressroom/content/20100503IPR74019/ 106
See http://eur-lex.europa.eu/LexUriServ/LexUriServ.do?uri=OJ:L:2010:276:0022:0032:EN:PDF.

Railway Reform in South East Europe and Turkey: On the Right Track? Main Report
110
body for applicants to request and to receive answers—in a single place and in a single
operation—regarding infrastructure capacity for freight trains crossing at least one border along
the border. In other words, a One-Stop-Shop is introduced for application of infrastructure
capacity, as a key coordinating tool. As per Article 14, infrastructure managers of a given freight
corridor shall jointly define and organize international pre-arranged train paths for freight trains,
with pre-arranged train paths to be allocated first to freight trains that cross at least one border.
Train path allocation along corridors will attempt to meet the needs of rail freight, which should
make it easier to offer a service of quality in terms of punctuality, reliability and journey time,
which is critical to attract clients who demand reliability. This will be a major departure from the
present, where passenger traffic is systematically given priority.
205. The management board of each freight corridor will regularly publish all the information
contained in the network statement for national networks regarding freight corridors, the list and
characteristics of terminals, and details concerning the management of the freight corridor
(Article 18). Investments across a freight corridor shall be coordinated—by the corridor
management board, through the development of an investment plan (Article 11). This investment
plan would include details of indicative and medium and long-term investment for infrastructure
in the freight corridor. It would include: (i) a list of projects foreseen for the extension and
renewal of rail infrastructure, including financial costs and sources of financing; (ii) a deployment
plan concerning interoperable systems that satisfy the essential requirements for interoperability;
and (iii) a plan for the management capacity of freight trains, including removal of identified
obstacles. The latter aims to improve speed along corridors and increase loading gauge and
loading haul or axle load authorized for trains. In order to assess the impact of these measures,
Article 22 obliges corridor managing bodies to assess the results of the implementation plans,
which is to be detailed every two years in a report to be presented to the European Commission.
CONCLUSIONS – IMPROVING INTEGRATION
206. Rail corridor performance in South East Europe and Turkey is generally poor in terms of
commercial speeds achieved and modal share, reflecting a potential largely unfulfilled to date. As
the test run along Corridor X revealed, commercial speeds can rise dramatically if border-
crossing delays are reduced—even without major improvements of rail infrastructure. The
general drive by a number of countries to upgrade key rail infrastructure to 160 km/hour at great
expense is not necessarily as cost-effective as substantial reductions in border-crossing delays,
which come at limited expense and require no or very limited infrastructure expenditure. The
Corridor X test run thus serves as an important lesson to governments and rail companies in the
region on what can be done along a specific rail corridor if a regional approach, focusing on
harmonization, synchronization, and cooperation, is adopted. In the South East Europe region,
SEETO has a key role to play in promoting regional cooperation.
207. The EU‘s adoption in 2010 of a corridor approach focusing on international rail freight has
important lessons for the study countries. Romania and Bulgaria will need to implement the
regulation in due course. For the remaining eight countries, it is crucial to approach rail freight
investments and performance from a corridor perspective with enhanced cross-border
coordination, in order to improve rail freight performance and increase its attractiveness to
potential freight customers. The idea of a one-stop shop is similar to the recommendations made

Railway Reform in South East Europe and Turkey: On the Right Track? Main Report
111
earlier and is essential for reducing border-crossing times. This chapter has argued for a number
of key recommendations to reduce border-crossing times, which are detailed below.
208. Improve border-crossing arrangements. The border-crossing audit indicated the need for
a number of institutional and regulatory improvements, based on the harmonized framework
border-crossing agreement (BCA) that has been developed for SEETO countries. The BCA has
five key principles: (i) compliance with open access standards that are required by EU directives
in force; (ii) introduction of the concept of a Joint Border Zone; (iii) cooperation between border
authorities—in particular, the possibility for the border authority of one country to be active in a
neighboring country; (iv) police and customs control over moving trains; and (v) establishment of
Border-crossing Commissions (BCCs) for open access border-crossings. Within the Joint Border
Zone, the following should be introduced:
Single window principle for freight customs. All customs services should be
carried out by the customs authorities of both countries at one location in the Joint
Border Zone;
One Stop Shop for the use of rail infrastructure in the Joint Border Zone. A One
Stop Shop in this context means a body that designs an international train path. The
applicant receives all information, including the timetable, fees and technical
parameters that enable one to use the path. Any licensed rail undertaking can
purchase rail infrastructure border services—such as path, shunting, and
communication—from one of the two infrastructure managers. The rules and
regulations of the One Stop Shop are specified in a joint network statement, which
can be an annex to the network statement demanded by Directive 2001/14/EC; and
Passenger control on moving trains. Border police and customs of both states
carry out controls while the train is moving. The zone in which such a control is
carried out might be different from the zone in which the commercial and technical
dispatching is done by the rail undertakings and infrastructure managers.
209. Utilize Agreements on Infrastructure Interconnection (AIIs) in order to expedite
border-crossings. These are agreements that are signed between infrastructure managers. A good
example is the agreement proposed by SEETO to be found in Annex 5, which was approved by
the SEETO Commission representing the transport ministries of the Western Balkan countries.
210. If necessary, utilize selective investments in order to establish joint border stations or
move clearance to defined inland terminals. A potential investment measure could be the
transfer of certain border-crossing activities to major inland terminals. From this perspective,
international trains should only be inspected/shunted/split at a limited number of inland terminals
in order to: (i) reduce border-crossing times; (ii) achieve higher commercial speed for trains; and
(iii) streamline border procedures. However, this notion is based on conventional single
wagonload or wagon groups which are typical of the incumbent state-owned railways. With the
entry of non-state private undertakings, the rail concept changes to one with block train systems:
(i) from sidings to sidings in conventional block trains; (ii) from sidings to terminals or vice versa
in conventional block trains; and (iii) from terminal to terminal in conventional block trains—as

Railway Reform in South East Europe and Turkey: On the Right Track? Main Report
112
is the case with the Schenker-Proodos trains, Express-Interfracht trains, and terminal to terminal
traffic in combined transport as is done by Intercontainer, AdriaKombi on the two corridors.
211. Coordinate marketing of services across rail corridors. The fragmentation of the rail
market in South East Europe continues to be a reality. The current market structure is largely
characterized by incumbent rail undertakings operating national networks, while trade flows have
increasingly become cross-border in nature. This is a particular stumbling block for the Western
Balkan rail undertakings, given the small size of the national networks and the number of border-
crossings involved in transferring goods out of the region. A number of initiatives announced in
2010 suggest that there is momentum for change, and a belated recognition of the need to
increase regional cooperation and coordination (Box 11). Coordination of rail operators along
corridors should be established to improve and develop services, while ensuring the independence
of the partners as regards pricing of the service and avoiding foreclosure.
212. Ensure coordination of TACs across freight corridors within the region. Excessively
high freight TACs across one segment of a corridor can shift freight rail traffic onto trucks. This
not only affects the given domestic market, but also has knock-on effects throughout the corridor.
This suggests the need to develop coordinated TAC regimes across major European freight
corridors, in order to make international rail freight flows easier to manage and to ensure that the
high TACs of one country do not pose negative externalities for other countries along the
corridor.
213. Introduction a pilot scheme to test EDI transmission between select border stations.
At present, communication across BCPs is limited to telephones, faxes, and e-mails, as well as
manual copying of documentation, as noted above. The main potential of EDI is in the reduction
of dispatching times. This would require IT equipment to be installed: (i) within the border
stations and EDI between the border stations in the Joint Border Zone; (ii) between rail
undertakings and infrastructure managers; (iii) between neighboring infrastructure managers, and
(iv) between shippers/forwarders and rail undertakings. This would allow pre-approval messages
in an electronic format to be generated automatically when a train is on route. It would apply to
requests for locomotives and handover trains, and electronic transmission of all necessary
commercial and train documents.

Railway Reform in South East Europe and Turkey: On the Right Track? Main Report
113
CONCLUSIONS AND RECOMMENDATIONS
Introduction
214. The railways of South East Europe and Turkey experienced significant declines in traffic
volumes in 2009.107
This reflected the impact of the international financial crisis unleashed in the
last quarter of 2008 and its contractionary impact on the economies of the region and elsewhere.
Lower traffic volumes translated in most cases into a serious deterioration of the financial
performance of the state-owned railways. This brought home the costs of failing to implement
essential reforms to improve the operational and financial performance of the sector when the
economy was strong. In Romania in 2010, large-scale layoffs were announced at short notice for
the state rail companies. The situation is similar for the Bulgarian state rail incumbents—they
face an acute liquidity crisis, and will require additional state aid merely to keep running. The
lesson of these events is clear: it is unwise to delay implementing state railway sector reforms
during good economic times—because the consequences can be severe if a financial downturn
occurs before those reforms have been taken and properly implemented.
215. The three main reasons why the countries covered in this report should prioritize the reform
of the rail sector are:
To ensure compliance with the requirements of relevant European Union (EU) directives
for the railway sector contained within the acquis communautaire (hereafter the EU rail
acquis).
To reap the envisaged benefits of adopting this institutional framework.
To ensure that when competition is introduced, state rail incumbents are able to compete
with new entrants, and do not require increased levels of support from the state.
216. With the exception of Bulgaria and Romania, which are already EU member states, all of
the countries covered in this report aspire to join the EU: they are either candidate countries or
potential candidate countries. This means that one of their fundamental goals is compliance with
the relevant EU directives for the railway sector contained within the EU rail acquis—unless
specific derogations have been agreed upon. Transposition of EU rail directives is a complex and
time-consuming process. It requires not only the adoption of primary and secondary legislation,
but also the establishment of specific institutional and organizational arrangements in line with
the requirements of the directives. For those countries that are candidate countries, there is
particular urgency in progressing with the EU rail acquis. For potential candidate countries there
is more time. However, precisely because those countries are further behind, there is a compelling
need to start now in accelerating the reform process.
107
For the purposes of this report the countries in the South East Europe region include Albania, Bosnia
and Herzegovina, Bulgaria, Croatia, Kosovo, Montenegro, Former Yugoslav Republic of Macedonia,
Romania, and Serbia.

Railway Reform in South East Europe and Turkey: On the Right Track? Main Report
114
217. In addition to improving their chances of being accepted into the EU, there are many
intrinsic economic benefits for these countries to gain by adopting this institutional framework.
The main objectives behind the rail reforms introduced in Europe in the 1990s were: (i) to
improve competition; (ii) to create more and better integrated international freight rail services;
(iii) to improve the efficient use of infrastructure capacity; (iv) to facilitate the creation of a single
European rail space; and (v) to reduce the declining modal share of railways. These objectives are
as relevant, if not more so, to the countries covered in this report as they are to the EU member
states themselves.
218. The third reason to prioritize reform is to ensure that when competition is introduced, state
rail incumbents are able to compete with new entrants, and do not require increased levels of
support from the state. Failure to engage in significant reforms—including corporate governance
reforms—prior to opening up the market, would expose the state rail incumbents to the risk of
rapidly declining market shares, and more significantly, to the risk of a significant worsening of
financial results. From a public policy perspective, a gradual set of reforms aimed at turning
round the financial results of the state rail incumbents is less costly socially and politically, than
dramatic layoffs at a time of acute crisis. In addition to implementing the required legislation,
state rail companies need to change their cultures in order to become more business-oriented.
They need to focus on meeting customer needs, and providing efficient, cost-effective services.
This cultural change is unlikely to take place as long as rail companies are protected by the state
and there is no intra-modal competition. Monopolies are not particularly nimble at responding to
market-oriented demand, especially if they are protected from facing the pressures of the market.
219. The ultimate aim of the reforms is to improve railway transport services in the study
countries. The greater the efficiency of the rail sector, the larger the range of markets in which the
rail companies can successfully compete. Rail freight services are critical to the production, trade,
and distribution of bulk and other semi-bulk materials including coal, iron ores and minerals, oil
products, grains, chemicals, iron and steel, cement, timber, sand, and gravel. Over sufficiently
long distances, railways can provide efficient transport solutions for general freight and for high
volume movements from ports. With regard to passenger services, railways can perform valuable
economic and social roles in dense inter-city corridors—for suburban transport in major cities and
sufficiently populated rural areas. In many cases, these roles can only be transferred to road
transport at a high cost in terms of pollution and greenhouse gas emissions from vehicles, traffic
congestion, and traffic accidents.
220. The main objective of this report is to serve as a wakeup call to the relevant authorities—
which include transport and finance ministries as well as rail companies—of the urgent need for
stepping up the reform process. Those countries that aspire to be members of the EU need to
understand that moving quickly on these reforms will greatly increase their chances of receiving a
positive opinion from the EU regarding rail transport regulations. And, bearing in mind the
sizeable subsidies and other forms of public monies the rail sector receives, there is too much to
be lost fiscally in failing to act. Scarce public resources should be used efficiently and effectively
to finance necessary upgrades to rail infrastructure and socially necessary passenger rail services.
They should not be used to prop up inefficient state railways weighed down by excessive
employee numbers and outdated management practices.

Railway Reform in South East Europe and Turkey: On the Right Track? Main Report
115
221. The current report revisits the railways of the region five years later to assess the degree of
progress made by the state rail incumbents in: (i) institutional reform; (ii) operating and financial
performance; and (iii) integration. During the course of these five years, there was initially a
period of economic plenty, which was followed by a period of severe economic crisis. The
current report delineates the extent of any progress with integration, both within the region, and
within the broader the railway market of the EU. It also aspires to provide a new benchmark for
the prospective Western Balkan Transport Community Treaty. This treaty aims to help to
accelerate the integration of transport systems and to harmonize rules on safety, environmental
protection and services. The set of 10 countries in the new report includes those in the 2005
Report, together with Bulgaria, Romania, and Turkey. Bulgaria and Romania joined the EU on
January 1, 2007 and have made considerable progress in regard to railway reform. Their inclusion
provides interesting, and in some cases salutary, lessons for the other countries in the region.
Turkey is not only an EU candidate country and therefore moving towards compliance with the
EU rail acquis, but an increasingly important economic origin and destination for the region
itself, and for the broader markets of the EU.
Progress in Institutional Reform
222. The substantive implementation of the necessary institutional reforms to bring national
legislation in line with the requirements of the EU rail acquis has been disappointing in the
Western Balkan countries and Turkey. Where there has been legislative progress, operational
establishment lags considerably behind. The best reformers—Bulgaria and Romania—have
implemented the EU rail acquis, but even they have only partially implemented the reform of
state-owned operators and infrastructure managers. They missed the window of opportunity that
existed prior to the economic crisis, and they have been required to make painful cuts at short
notice as performance has deteriorated in 2009-2010.
223. The separation of accounts between infrastructure managers and transport services as
foreseen in Directive 91/440/EEC is one of the key rail directives, because it entails ending the
status of a railway as a state-owned monopoly. In Albania, Bosnia and Herzegovina, Serbia, and
Turkey, there have been no changes in the rail legal framework since 2005 to facilitate an
unbundling of services. All of these countries continue to have vertically integrated rail
incumbents. In 2008, Kosovo adopted a rail law. In 2010, it adopted a legal act separating
infrastructure and transport services. This act was aimed at separating Kosovo Railways into two
joint stock companies. However, this change has yet to be implemented. Croatia, FYR
Macedonia, and Montenegro have created separate joint stock rail companies for infrastructure
and transport services. But apart from Bulgaria and Romania, no other country in the report has
opened its domestic market, even on a reciprocal basis. Thus, the state incumbents continue to
retain their monopoly power. Montenegro is in the process of privatizing its freight operator—this
would represent the first private rail undertaking in the Western Balkans.
224. There has been some progress with the establishment of the regulatory institutions in the
South East Europe Transport Observatory (SEETO) countries. These institutions are required to
be independent in order to act in a fair and non-discriminatory fashion. Unfortunately, those
regulatory bodies that have been established often lack sufficient staff in terms of number and

Railway Reform in South East Europe and Turkey: On the Right Track? Main Report
116
competence, and for the most part are not independent—either in terms of decision-making
capacity or in terms of budget. Thus, they have limited authority. One of the key functions of the
regulator is to monitor competition in the rail service market and to hear appeals regarding
possible discrimination by the infrastructure manager and complaints about path allocation, level
and structure of track access charges. Having fully operational regulatory institutions will become
critical in the future, particularly when SEETO countries and Turkey open their markets. In
countries such as Albania, Bosnia and Herzegovina, Kosovo, and Serbia, where the incumbent
rail companies remain vertically integrated, the need may appear less pressing at present. For
smaller rail sectors, appropriate solutions need to be developed in order to reduce the financial
cost of establishing and running all the rail regulatory institutions foreseen in the EU rail
directives.
225. The Western Balkan members of SEETO are signatories to an Addendum to a
Memorandum of Understanding aimed at enhancing the South East European Railway Transport
Area. On December 4, 2008, the SEETO countries adopted a timetable for the implementation of
legislative and structural changes to the rail sector. The timetable accounted for the need to go
beyond the adoption of primary laws in accord with the EU rail acquis. Successful reform also
required the adoption of secondary legislation, the establishment of required institutional,
organizational, and financial arrangements, the issuance of operational decisions, and the staffing
of new institutions. The deadline for implementation varied by country. For the region as a whole,
it was 2010—in most cases that deadline has been missed.
226. By contrast, progress in Bulgaria and Romania has been substantial. Both countries have
transposed the First Railway Package. By 2007, rail liberalization was considered in some
respects more advanced in Bulgaria and Romania than in a number of the EU-15 countries, such
as France, Greece, Ireland, and Luxembourg. One of the key impacts of the reforms has been in
terms of opening up actual access to the rail market. In fact, one of the most significant changes
has been the emergence of new participants in the rail freight market. These new participants
have taken a sizeable market share. In Romania, that share exceeded 40 percent by the end of
2009.
227. On the other hand, the incumbents—BDZ EAD in Bulgaria and CFR Marfa in Romania—
delayed implementing the sort of market-driven business strategies recommended in the 2005
Report. As a consequence, they are struggling to compete in the freight market with the new
entrants. Large financial losses in both companies—made more pronounced by the impact of the
financial crisis since the last quarter of 2008—have forced them to make painful cuts. What has
now become clear is that successful implementation of the EU rail acquis will create a level
playing field by opening up the market to challengers. However, it will not in and of itself lead to
improvements in the financial results of state rail companies—those improvements will only
come with sound strategies and smart managerial decision-making.
228. Passenger services in Bulgaria and Romania remain restricted to the state incumbents.
Despite public service obligation (PSO) contracts, these remain loss-making enterprises—as is
the case for the infrastructure managers. The continued poor financial performance of these state-
owned companies reflects an inability to respond to changing market conditions. In addition, the
introduction of necessary reforms—such as public service contracts and track access charges—
without a corresponding implementation of concrete measures to contain costs and improve

Railway Reform in South East Europe and Turkey: On the Right Track? Main Report
117
performance, has exacerbated poor financial and operating performance. The experiences of both
of these countries hold important lessons for the Western Balkan countries and Turkey as they
proceed with the reform process. In particular, it is important to bear in mind that improving the
performance of state rail companies and implementing the EU rail aquis are two separate
objectives, which should be pursued in parallel.
Progress in Operating and Financial Performance
229. For the report countries as a whole, rail traffic was lower in 2009 than it was in either 2001
or 2005: it declined from 56,202 million traffic units in 2005 to 45,059 million traffic units in
2009. Rail traffic in the Western Balkan countries—driven primarily by freight traffic—was
9,831 million traffic units in 2009, which was 22 percent higher than the comparable level in
2001, although somewhat below the level in 2005. Overall, passenger traffic has declined in both
the first and second half of the decade, while freight traffic rose over 2002-2006, before declining
sharply in 2008-2009 (
230. Figure 49). It is important to note that 75 percent of all traffic in terms of traffic-units is
freight, and it is variation in this sub-sector that is primarily responsible for the significant
changes in overall traffic volume. However, for the Western Balkan region, traffic developments
have been more positive—there were improving indices of operating performance reflecting
rising traffic over 2001-2007, declining only with the impact of the financial crisis. One
unfortunate concomitant to this welcome development is that it may have allowed the substantive
and necessary reforms to be postponed.
231. In addition, while operating performance improved compared to the 2005 Report, the state
rail companies in South East Europe and Turkey over 2005-2009 made limited progress in
converging towards EU-27 levels. Table 15 presents a summary of operational performance,
ranking the countries on five productivity measures. Turkey scores the best, and on many
productivity measures is close to the EU average—and it also experienced positive traffic growth
over 2005-2009. Croatia comes in a clear second, with productivity indicators that in all cases are
above 50 percent of the EU average. In some areas, such as passenger coach productivity, Croatia
exceeds the performance of Poland and Slovenia, while having seen positive traffic growth in the
last five years. Conversely, Albania, Bosnia and Herzegovina, and Montenegro score poorly on
the majority of these indicators, with the rest of the countries somewhere in between. The EU
countries—Romania and Bulgaria—do not perform better than the Western Balkan countries, and
they do considerably worse than Croatia and Turkey on all productivity measures.
232. The cost recovery ratio for the state rail undertakings reveals that the majority remain
significant loss-makers, even with state funding—even if the extent of support has fallen in terms
of the share of GDP from the levels reported in 2005.108
Figure 50 presents the cost recovery
ratio for the 15 state rail companies: for five of these, the cost recovery ratio exceeded 100
percent, indicating that they met total operating costs from their revenues. For the bottom three
companies—Turkey‘s TCDD, Montenegro‘s ZICG, and FYR Macedonia‘s MŢ-I—the cost
108
The cost recovery ratio is defined as the degree of coverage of total operating costs with total revenue,
including state support. The viability ratio is defined as the ratio of commercial revenue divided by total
operating costs.

Railway Reform in South East Europe and Turkey: On the Right Track? Main Report
118
recovery ratio was under 60 percent, a very low level. For most rail companies, these ratios
deteriorated dramatically in 2009 due to the impact of the international financial crisis on
demand. But even prior to 2009, few state rail incumbents were in a position to finance operating
costs from total revenues. With one exception—Romania‘s CFR Marfa—all of the state rail
companies included in the report were unable to meet operating costs from commercial
revenues—that is to say a viability ratio of less than 100 (Figure 51).
Figure 49: Rail Traffic, 2001-2009 (million traffic units)
Source: UIC.
Table 15: Summary of Operational Performance (EU 27=100), 2009
Country Traffic
Density
Productivity
Average Coach Wagon Locomotive Labor
Turkey 56 100 89 109 84 88
Croatia 53 85 64 68 58 66
FYR Macedonia 30 34 61 47 38 42
Romania 45 48 31 29 40 39
Bulgaria 41 41 30 34 28 35
Serbia 28 18 49 38 29 32
Kosovo 7 51 36 28 28 30
Montenegro 27 36 24 24 20 26
BH 33 8 35 24 23 25
Albania 6 9 14 5 7 8 Sources: UIC, Kosovo Railways; World Bank calculations.
8,000
8,500
9,000
9,500
10,000
10,500
11,000
11,500
12,000
12,500
13,000
42,000
44,000
46,000
48,000
50,000
52,000
54,000
56,000
58,000
60,000
2001 2002 2003 2004 2005 2006 2007 2008 2009
Study countries Western Balkans

Railway Reform in South East Europe and Turkey: On the Right Track? Main Report
119
Figure 50: Cost Recovery Ratio, 2008
(percentages)
Figure 51:Viability Ratio, 2008
(percentages)
Source: State rail companies. Source: State rail companies.
Progress in Integration
233. Progress in integration has also been rather limited, despite the significant and growing
market segment for international rail freight transport, particularly along the main international
corridors. The expansion of the EU rail networks to the new member, candidate, and accession
countries has created a significant opportunity for rail freight. This is illustrated by the 1-2
percent share of the total freight market between Turkey and the EU currently carried by the
railways. However, this potential remains unrealized in the study countries, due in part to strong
competition from other modes, but also due to a number of other more attainable factors,
particularly at the border-crossings, many of which could be addressed at little expense.
234. The current report commissioned an audit of a number of key border-crossing points
(BCPs). The audit compared current practice in study country BCPs with European harmonized
framework border-crossing agreements (BCAs), such as those between Switzerland and
Germany, Germany and Austria, and Austria and Hungary. The findings show that the critical
element in reducing border-crossing times is effective cooperation among incumbent rail
undertakings and rail infrastructure managers—particularly across national boundaries. The
Bosphorus Europe Express test run along rail Corridor X revealed that commercial speeds and
reliability can rise dramatically when border-crossing delays are reduced, without major and
expensive improvements to the rail infrastructure.
235. The EU‘s adoption in 2010 of a regulation concerning a corridor approach focusing on
international rail freight has important lessons for the study countries. Romania and Bulgaria will
need to implement the regulation in due course. For the remaining eight countries, it is crucial to
51
58
59
73
77
82
84
86
87
98
102
105
107
112
117
FYROM MZ-I
MG ZICG
Turkey (TCDD)
BG NRIC
BH ZFBH
RO CFR Calatori
Albania Railways
FYROM MZ-T
Serbian Railways
RO CFR
RO CFR Marfa
BG BDZ
BH ZRS
Kosovo Railways
Croatian Railways
20
28
39
42
45
50
55
61
65
73
74
86
93
94
102
MG ZICG
Turkey (TCDD)
RO CFR Calatori
FYROM MZ-I
BG NRIC
Serbian Railways
Albania Railways
BH ZFBH
BH ZRS
Croatian Railways
BG BDZ
FYROM MZ-T
RO CFR
Kosovo Railways
RO CFR Marfa

Railway Reform in South East Europe and Turkey: On the Right Track? Main Report
120
approach rail freight investments and performance from a corridor perspective with enhanced
cross-border coordination, in order to improve rail freight performance and increase its
attractiveness to potential freight customers. The idea of a one-stop shop was recommended in the
2005 Report, and remains an essential element in significantly reducing border-crossing times.
The Conclusions of the Report
236. There are a number of reasons for the limited progress in rail reform in South East Europe
and Turkey. Most of the state railways are heavily overstaffed: reform would require layoffs,
which can be politically sensitive with the powerful trade unions. The financial crisis at the end of
2008 had a major impact on rail traffic and financial performance in Bulgaria and Romania: it led
to major layoffs and restructuring plans for the state railway companies. Protectionism has acted
as a powerful factor in slowing down the pace of change, because rail reforms lead to competition
from foreign participants and domestic private operators, requiring the state incumbent companies
to quickly adapt or else lose market share.
237. However, there are powerful levers for ensuring progress on the rail reform agenda going
forward. The first is EU accession—because candidate countries must adopt the EU transport
acquis before they can become member states. This lever is most powerful with the candidate
countries closest to accession, particularly Croatia, but also FYR Macedonia and Montenegro. A
second lever is potential fiscal pressures on state budgets stemming from loss-making state rail
companies. This includes the threat of bankruptcy, which the Romanian state company CFR
Marfa faced in 2010. The Bulgarian state company BDZ EAD is currently facing a similar
situation—BDZ EAD has required state aid to stave off imminent liquidity problems. The
pressures are lower for countries that are years away from joining the EU, are less effected by the
international financial crisis, and whose state railways are not facing the threat of bankruptcy.
However, this does not mean that there is no urgency to speed up the institutional reform process
and strengthen the operational and financial performance of state rail incumbents. On the
contrary, reforms take time to fully implement, and thus, the need to step up efforts must start
now. The EU, SEETO, and international financial institutions have key roles to play in catalyzing
reforms in the region.
238. Government transport policy should place rail and road transportation on an equal footing:
the legal provisions and the level of financial contribution of the state for railway and road
infrastructure should be equivalent. This will allow users to make the socially optimal choice
between the two modes for each trip. As long as the financial support of the state is reflected in an
unbiased manner in the transportation tariffs for competing modes of transport, the market will
generate enough resources to cover infrastructure operation needs.
The current report concludes with a set of recommendations, which to a significant extent echo
the recommendations made in the 2005 Report. This in itself testifies to the modest progress
made in implementing substantive rail reform over the past five years. While rail reform has been
largely moving on the right track, there is an urgent need to accelerate the pace of reforms.

Railway Reform in South East Europe and Turkey: On the Right Track? Main Report
121
Continuing Necessary Institutional Reform
Ensure managerial independence of the infrastructure manager. Governments need
to unbundle the infrastructure management from any rail operator. Ownership rights
should be exerted by different, independent authorities or ministries.
Where unbundling has occurred, ensure that relations between the infrastructure
manager and operator(s) are placed on a contractual basis. These contracts should be
based on transparent and equal access conditions to the infrastructure, and should be
published in regularly updated network statements. Framework agreements providing
certainty of capacity available on a horizon of several years would be a positive
development.
Set a charging framework based on the direct costs of operating a service. Within
this framework, the infrastructure manager can then set the track access charge (TAC) in
accordance with European rules. The level of charges for freight trains needs to be kept in
line with what they can bear in order to make them competitive vis-à-vis other freight
transport modes. Any such charges need to be coordinated with charges levied in other
countries to ensure that they do not distort international traffic across rail corridors or
create a negative externality. Freight trains should not have to cross-subsidize passenger
trains by way of different infrastructure charges, when the former are not able to bear
such high charges relative to competition.
Review passenger fare regulations. In many cases, the existing fare regulations limit
the ability of the railways to implement commercial pricing systems. The use of yield-
management techniques to try to maximize the sale of unused seats needs to be permitted
within the pricing framework, in order to improve revenues per railcar-km. Where
subsidies are paid in block or when a PSC pays the difference between revenue and cost,
there are limited incentives to collect fares and reduce fare evasion.
Permit passenger operators to set ticket prices for services not under public service
obligation. Fare discounts and regulatory policy should focus on providing options for
poorer travels, but should not otherwise determine pricing. The State should compensate
operators for loss of revenues that may result from fare discounts or price restrictions.
Encourage passenger operators to provide web-based timetable information and
ticket sale applications. Railways should also seek to offer trip chains integrated with
coach operators. Ticket and fare integration with urban and airport access services may
attract new passengers for railways in the major agglomerations.
Improve corporate governance in state rail companies. A number of countries have
changed the legal status of their rail undertakings to that of joint-stock companies, which
is a corporate structure selected to ensure managerial independence and commercially-
oriented behavior. However, in practice this has often led to the creation of joint-stock
companies on paper, with significant interference from transport ministries in day-to-day
decision making, which prevents the kinds of decision-making that can be expected from
operating in a market environment.

Railway Reform in South East Europe and Turkey: On the Right Track? Main Report
122
Require financial accounts to be prepared and audited according to IFRS—and
require that they be published. In order to assess the financial performance of rail
companies, systematic and comprehensive financial accounts need to be prepared
according to International Financial Reporting Standards (IFRS) and audited by
independent audit companies on a line-of-business basis. EU laws require the publishing
of accounts by activity for each rail company, including the production of balance sheets
and income statements—although they do not provide detailed guidance on the
presentation of accounts, nor do they set accounting standards. Without explicit
guidelines, there are significant variations in the way accounts are presented, and in the
way governments report state contributions to the sector. This makes it difficult to make
direct comparisons between rail companies.
Strengthening Regulation of the Rail Sector
Strengthen licensing bodies as foreseen in EU rail directives. Licensing bodies should
award licenses to railway undertakings that satisfy EU requirements—these licenses
should be published. Governments should set minimum coverage requirements relative to
accidents.
Put an end to self-regulated rail monopolies. Place critical access conditions under the
control of a safety authority and regulatory body, as envisaged under EU rail directives.
These authorities should control the conditions for awarding train driver licenses, as well
as access to training facilities.
Establish pro-active and strong regulators. Guaranteeing fair competitive conditions
will encourage market-entry of new operators. Rail regulators should cooperate across
borders, along rail corridors, and at a regional and EU level.
Require authorization of rolling stock by a safety authority. On the basis of cross-
acceptance rules, tests passed in other countries should be accepted across national
borders—this eliminates the need for time-consuming retesting. The safety authority
should establish and publish a complete collection of national safety rules, and abandon
any such rules that are incompatible or redundant with EU rules.
Ensure that prices for rail-related services are transparent. Rail-related services,
such as terminals in inland or sea ports, passenger stations, fueling, towing, and supply of
traction current, are essential for market access. Consequently, prices and access
conditions should be transparent and based on conditions controlled by the regulatory
body.
Improving the Quality of Rail Infrastructure and the Performance of Infrastructure Managers
Refocus rail network development plans. Governments should prepare rail network
development plans with investment decisions based on cost-benefit analysis, rather than
focusing excessively on past traffic density; a distinction must be made between
upgrading, rehabilitation, and light maintenance of rail infrastructure in these plans.
Governments are strongly advised to develop a strategy for the modernization of the core

Railway Reform in South East Europe and Turkey: On the Right Track? Main Report
123
network that carries the bulk of the traffic, for the achievement of inter-operability with
the European railways, and for increasing rail safety and labor productivity.
Consider the need for network rationalization and focus maintenance on high-
density lines. A network rationalization program needs to be defined and implemented in
a manner that reduces excess railway track and concentrates on the network where rail
performs the most useful transport role. This rationalization, or definition of a ‗core
network‘, will help bring rail traffic density closer to the EU average. More importantly,
it will improve the financial sustainability of the rail sector through the reduction of
infrastructure costs. Shifting to high-density corridors, and focusing maintenance on these
lines while closing low-density routes is probably the only way to improve the
performance of the rail sector from a cost perspective. This could be complemented with
the tendering of low traffic lines, where there is market interest, or their replacement with
more cost-effective bus services.
Utilize multi-annual contracts for rail infrastructure development. The state
contribution for the development of rail infrastructure and for partial coverage of
maintenance costs must be allocated in a transparent way. It must be based on a multi-
annual contract signed between transport ministries and the infrastructure
manager/holding company. There should be specific provisions regarding: (i) the public
money allocated; (ii) the destination of the allocated funds—clearly distinguishing
network development from network maintenance: (iii) the responsibilities of the
infrastructure company regarding the availability of infrastructure; and (iv) the quality of
services (punctuality, technical speed, capacity offered for operation).
Set infrastructure charges at a level that is non-excessive. Care must be taken to
ensure that under-spending on the part of the state is not compensated for by excessively
high TACs, which undermine the viability and competitiveness of rail freight vis-à-vis
other transport modes. Such charges should not be fixed in multi-annual contracts and
cannot compensate for under-financing without a negative impact on traffic volumes.
Establish a system for measuring and charging traction current. This system should
be set up to measure and charge traction current according to consumption—and it should
be inter-operable with other infrastructure managers. This may reduce consumption and
costs of operation.
Encourage infrastructure managers to publish of network statements via
RailNetEurope. The latter is an association that was set up by a majority of European
Rail infrastructure managers and allocation bodies to enable fast and easy access to
European rail. Infrastructure managers should use the umbrella of RailNetEurope to
publish their network statements and access conditions, and to coordinate the
construction of international train paths.
Improving Operating and Financial Performance of Incumbent Operators

Railway Reform in South East Europe and Turkey: On the Right Track? Main Report
124
Divest or scrap non-economic assets. Rail undertakings are often burdened with non-
economic assets made redundant by changed rail transport demand. For a number of
report countries, operational rolling stock assets are only a fraction of the total assets,
which places a considerable burden on productivity levels.
Identify factors affecting low productivity. State rail incumbents should evaluate the
reasons for low productivity and the impact of each of the reasons identified. This should
include an analysis of the structure of the fleet in comparison with market demands, and
should define the number of cars necessary for present traffic levels. A decision should
be made regarding the potential surplus fleet affecting operating costs in a negative
manner. The remaining fleet needs to implement new methods of allocation based on the
needs of the market, in order to increase the efficiency of utilization.
Reduce staff levels. A clear policy of annual staff reductions over the next three to five
years should be defined with a precise target and time frame for achieving average EU
staff productivity levels. This policy needs to be based on a prudent traffic forecast that
will need regular updating. A clear separation of the accounts for freight, passenger, and
infrastructure will allow operators to calculate staff productivity based on specific
formulas for each line of business. This will provide more accurate information for the
evaluation of performance for each business segment.
Utilize multi-annual public service contracts (PSCs) for passenger services with
performance indicators. State compensation for the public service obligation defining
the passenger transportation services must be allocated based on a multi-annual contract.
This contract must be signed between transport ministries with the passenger
company/holding company defining the type of services to be offered, the volume
(number of trains, composition of trains), and selected quality indicators. The PSC
should specify the train-km purchased on all routes. In addition to output targets, it
should contain input performance targets in order to create incentives to seek efficiency
improvements. The PSC should avoid over-compensation and should be awarded by
competitive tendering. Profitable passenger and freight services should not benefit from
state finance.
Utilize performance indicators by lines of business. Progress must be measured based
on specific indicators for each of the lines of business: infrastructure, passengers, cargo—
and in the case of Bulgaria and Croatia, traction. The annual budget of state incumbents
must be approved for each line of business containing specific targets. In the case of
holding companies, the daughter companies should sign performance contracts with the
management of the holding company, and should be held directly accountable for
operational and financial results.
Organize around customer service centers instead of territorial structures. Many
European railways have successfully implemented a business model based on profit
centers that manage each major type of commodity and passenger service. It is highly
recommended that freight services be structured around customer service centers for each
of these types of products, and that passenger rail undertakings be structured around

Railway Reform in South East Europe and Turkey: On the Right Track? Main Report
125
specific passenger services. Infrastructure managers can organize activities around traffic
management, power, and telecommunication, in order to attract more clients.
Reassess the logic of maintaining traction companies. Efficiency gains depend on
being in touch with market demands. Monopolistic traction companies in Bulgaria and
Croatia lack direct contact with the market—tariffs are not established through
interaction with clients, which prevents successful implementation of market-based
railway activities. There is a need to elaborate a methodology for the calculation of unit
tariffs for services offered by traction companies, with annual contracts signed between
the traction company and its clients based on established tariffs, in order to ensure that
traction is made available to all companies on a non-discriminary basis.
Improving Integration in Service and Network Provision
Improve border-crossing arrangements. The border-crossing audit indicated the need
for a number of institutional and regulatory improvements, based on the harmonized
framework border-crossing agreement (BCA) that has been developed for SEETO
countries. The BCA has five key principles: (i) compliance with open access standards
that are required by EU directives in force; (ii) introduction of the concept of a Joint
Border Zone; (iii) cooperation between border authorities—in particular, the possibility
for the border authority of one country to be active in a neighboring country; (iv) police
and customs control over moving trains; and (v) establishment of Border-crossing
Commissions (BCCs) for open access border-crossings. Within the Joint Border Zone,
the following should be introduced:
(iv) Single window principle for freight customs. All customs services should be
carried out by the customs authorities of both countries at one location in the
Joint Border Zone.
(v) One Stop Shop for the use of rail infrastructure in the Joint Border Zone. A
One Stop Shop in this context means a body that designs an international
train path. The applicant receives all information, including the timetable,
fees and technical parameters that enable one to use the path. Any licensed
rail undertaking can purchase rail infrastructure border services—such as
path, shunting, and communication—from one of the two infrastructure
managers. The rules and regulations of the One Stop Shop are specified in a
joint network statement, which can be an annex to the network statement
demanded by Directive 2001/14/EC.
(vi) Passenger control on moving trains. Border police and customs of both
states carry out controls while the train is moving. The zone in which such a
control is carried out might be different from the zone in which the
commercial and technical dispatching is done by the rail undertakings and
infrastructure managers.
Utilize Agreements of Infrastructure Interconnection (AAIs) in order to expedite
border-crossings. These are agreements that are signed between infrastructure managers.

Railway Reform in South East Europe and Turkey: On the Right Track? Main Report
126
A good example is the agreement proposed by SEETO to be found in Annex 5, which
was approved by the SEETO Commission representing the transport ministries of the
Western Balkan countries.
If necessary, utilize selective investments in order to establish joint border stations
or move clearance to defined inland terminals. A potential investment measure could
be the transfer of certain border-crossing activities to major inland terminals. From this
perspective, international trains should only be inspected/shunted/split at a limited
number of inland terminals in order to: (i) reduce border-crossing times; (ii) achieve
higher commercial speed for trains; and (iii) streamline border procedures. However, this
notion is based on conventional single wagonload or wagon groups which are typical of
the incumbent state-owned railways. With the entry of non-state private undertakings, the
rail concept changes to one with block train systems: (i) from sidings to sidings in
conventional block trains; (ii) from sidings to terminals or vice versa in conventional
block trains; and (iii) from terminal to terminal in conventional block trains—as is the
case with the Schenker-Proodos trains, Express-Interfracht trains, and terminal to
terminal traffic in combined transport as is done by Intercontainer, AdriaKombi on the
two corridors.
Coordinate marketing of services across rail corridors. The fragmentation of the rail
market in South East Europe continues to be a reality. The current market structure is
largely characterized by incumbent rail undertakings operating national networks, while
trade flows have increasingly become cross-border in nature. This is a particular
stumbling block for the Western Balkan rail undertakings, given the small size of the
national networks and the number of border-crossings involved in transferring goods out
of the region. A number of initiatives announced in 2010 suggest that there is momentum
for change, and a belated recognition of the need to increase regional cooperation and
coordination. Coordination of rail operators along corridors should be established to
improve and develop services, while ensuring the independence of the partners as regards
pricing of service and avoiding foreclosure.
Ensure coordination of TACs across freight corridors within the region. Excessively
high freight TACs across one segment of a corridor can shift freight rail traffic onto
trucks. This not only affects the given domestic market, but also has knock-on effects
throughout the corridor. This suggests the need to develop coordinated TAC regimes
across major European freight corridors, in order to make international rail freight flows
easier to manage and to ensure that the high TACs of one country do not pose negative
externalities for other countries along the corridor.
Introduce a pilot scheme to test EDI transmission between select border stations. At
present, communication across BCPs is limited to telephones, faxes, and e-mails, as well
as manual copying of documentation, as noted above. The main potential of EDI is in the
reduction of dispatching times. This would require IT equipment to be installed: (i)
within the border stations and EDI between the border stations in the Joint Border Zone;
(ii) between rail undertakings and infrastructure managers; (iii) between neighboring
infrastructure managers, and (iv) between shippers/forwarders and rail undertakings. This

Railway Reform in South East Europe and Turkey: On the Right Track? Main Report
127
would allow pre-approval messages in an electronic format to be generated automatically
when a train is on route. It would apply to requests for locomotives and handover trains,
and electronic transmission of all necessary commercial and train documents.

Railway Reform in South East Europe and Turkey: On the Right Track? Annexes
128
ANNEX 1: THE INCUMBENT RAILWAY COMPANIES
ALBANIAN RAILWAYS
239. Albanian Railways (HSH) is the monopoly state-owned rail company and a stock holding
company since 2000, with the Ministry of Economy as its owner. The rail network is small, with
444 km of single track non-electrified rail with standard gauge, of which 424 km is operated
(Figure 52). It consists of 4 main lines: (i) Durres to Tirana; (ii) Durres to Vlore through
Rrogozhine; (iii) Rrogozhine to Pogrodec; and (iv) Vore to Hani i Hotit. In addition, there are two
branch lines, one of which is not operational and two industrial connections—Budull to Fushe
Kruje for cement and Elbasan to the Kurum steel facility. The ‗core network‘ consists of 197 km
from Durres to Tirana (37km), Vore to Shkoder (85 km), and Skhozet to Elbasan (75km).
Although the railway was constructed to serve the freight market, passenger services operate
throughout the network, with the exception being between Shkoder and Hani i Hotit.
Operational Performance109
240. Rail transport has been declining throughout the decade. With 19 million ton-km of
traffic in 2001, freight traffic doubled by 2008, to reach 53 million ton-km, before declining by
15 percent in 2009 as a result of the impact of the crisis. To put the traffic in perspective, freight
traffic volume in 2009 was still lower than in 1995, revealing no real take-off of the freight sector
over the last 14 years. In turn, this reflects significant under-investment in rolling stock and
infrastructure, as well as the destruction of rail assets during unrest in both 1991 and 1997, which
translates into low operational speed, poor reliability, and expensive services. Exports transported
by rail include steel slabs, cement and clinker, while imports via Montenegro include cereals, fuel
and metals, as well as food and animal products. There were 54 international freight trains from
Montenegro in 2007, with Tirana, Sukth, Bajze and Fier as destinations—with an average haul
distance of about 135 to 180 km.
241. Passenger traffic has declined from 125 million passenger km in 2000 to 32 million in
2009. The low level of traffic reflects few passenger trains per day, with distances of between 17
km to 50 km. The underlying reasons for declining passenger numbers include long-travel times,
unreliability of services, and uncomfortable coaches. Between Durres and Tirana—a 37 km
section—track was modernized in 1997, and the speed limit is 60 km/hour. However, due to
extensive trespassing on the lines, drivers often drive slowly to avoid accidents, suggesting that
improved infrastructure will not lead to faster operational speeds if the issue of trespassing and
safety more broadly—linked to the absence of a signaling system on much of the network—is not
addressed. There are currently no international passenger services. The decline in passenger
109
This section is based in part on a technical assistance report prepared in the context of the Infrastructure
Projects Facility in the Western Balkans. See European Union‘s CARDS Programme for the Western
Balkans (2009), Albanian Railways Network: Infrastructure and Signaling Improvement Project, TA-ALB-
06, Infrastructure Projects Facility in the Western Balkans. Draft Final Report, Vol 1 – Main Report,
November 2009.

Railway Reform in South East Europe and Turkey: On the Right Track? Annexes
129
traffic is largely responsible for the fall in traffic intensity from 221,447 traffic units per km in
2005 to 184,397 traffic units per km in 2009 (Figure 54). This is equal to only 6 percent of the EU
average.
Figure 52: Rail Network of Albania
Source: World Bank.

Railway Reform in South East Europe and Turkey: On the Right Track? Annexes
130
Figure 53: Railway Traffic in Albania, 2000-2009
Source: UIC.
Figure 54: Albanian Railways - Traffic Intensity Figure 55: Albanian Railways - Traffic Units per
Staff and Staff Levels
Source: UIC. Source: UIC.
242. The number of Albanian Railways employees is high for such a small network and
staff productivity very low. In contrast to Kosovo Railways which employs 400 staff for a 333
km network, Albanian Railways employs 1,882 for 424 km of network (Figure 55). This
represents less than 7 percent of the EU average and has fallen from the levels seen in 2006-2007.
These indicators suggest that despite staffing declining by 12 percent over 2005-2008,
overstaffing at current traffic levels remains an important issue, with high wage costs.
243. Due to a long period of under-investment, maintenance works have been limited to
essential work, with the result that track is in workable, but poor condition. The signaling
system was destroyed following unrest in 1997, and there is still no train control by signaling on
the majority of the network. The maximum speed is generally 42 km/hour—37 km/hour including
stops—with a few sections at only 20 km/hour. This reflects poor track condition and the absence
of a signaling system, as well as the existence of many illegally constructed level crossings that
pose safety risks and further reduce speeds. In the last ten years, only 35.6 km of track has been
renewed, while a further 54.2 km of track was renewed between 11 and 20 years ago. According
0
20
40
60
80
100
120
140
160
2000 2001 2002 2003 2004 2005 2006 2007 2008 2009
Passenger (million pass-km) Freight (million ton-km)
5%
6%
7%
8%
9%
10%
100,000
120,000
140,000
160,000
180,000
200,000
220,000
240,000
260,000
280,000
300,000
2005 2006 2007 2008 2009
Albania % of EU average
1,700
1,750
1,800
1,850
1,900
1,950
2,000
2,050
2,100
2,150
2,200
2,250
0
10,000
20,000
30,000
40,000
50,000
60,000
2005 2006 2007 2008 2009
Traffic units/staff Staff

Railway Reform in South East Europe and Turkey: On the Right Track? Annexes
131
to Albanian Railways, an estimated 80 percent of the operational network has temporary speed
restrictions—up from 60 percent in 2005.
244. The rolling stock is characterized by its age, and its poor overall condition, reflecting
inadequate investment over the last decade. Investments in rolling stock totaled a mere Euro
1.4 million over 2005-2008. Of its 55 locomotives, 25 percent are under 20 years of age, with the
bulk of the locomotives acquired over 30 years ago. Generally locomotives have low power
capability, with a hauling capacity of about 1,000 tons in trains of 10 or 15 wagons at most.
Passenger trains tend be locomotive hauled with 2/3 coaches. The operational fleet of freight
wagons is 241 and of passenger coaches is 52—but as with the locomotives, these are generally
old. The performance of trains could be improved by increasing their length and thus reducing
the number of trains—which would require improved locomotives—or else improving signaling
via the introduction of radio signaling, or the number and length of double track sections.
Figure 56: Albanian Railways – Age Structure of Rolling Stock
Source: Albanian Railways.
Table 16: Albanian Railways – Rolling Stock Productivity
Year Freight Wagon Productivity Coach Productivity Locomotive Productivity
Albania EU average = 100 Albania EU average = 100 Albania EU average = 100
2009 85,661 14 363,636 9 1,418,182 5
2008 74,648 10 579,545 15 1,824,561 7
2007 74,225 9 576,136 13 1,814,035 6
2006 43,689 5 930,233 21 2,000,000 7
2005 31,553 4 848,837 22 1,706,897 6 Source: UIC.
245. Rolling stock productivity is less than 15 percent of the EU average and except for
freight wagon productivity, has deteriorated over 2005-2009. Freight wagon productivity
increased by 171 percent over 2005-2009—rising from 4 to 14 percent of the EU average, a
significant improvement—but overall freight wagon productivity is among the lowest in the
region. Locomotive productive rose over 2005-2008 before declining in 2009 to 1,418,182 traffic
units per locomotive, equivalent to a mere 5 percent of the EU average. Coach productivity has
performed poorly throughout 2005-2009, reflecting continuing declines in passenger traffic—by
2009 coach productivity stood at a mere 9 percent of the EU average. Low utilization levels of
rolling stock reflect in part low availability of fleet due to the operational fleet being a fraction of
25 9
13
7
46
40
17
26
83
15
Locomotives
Passenger coaches
Freight wagons< 10 years
11-20 years
21-25 years
26-30 years
31-40 years
> 40 years

Railway Reform in South East Europe and Turkey: On the Right Track? Annexes
132
the total. Given the low and continuously declining passenger volumes, a downsizing of the coach
fleet appears sensible. The combination of these factors generates high freight and passenger
operating costs for Albanian Railways, making them less competitive vis-à-vis trucks and buses.
Financial Performance and Investment Plans of Albanian Railways
246. Albanian Railways is loss-making, with a negative net income of Euro 2.1 million in
2008 and losses throughout 2005-2009. Excluding state contributions, the working ratio is
considerably above 1, at 1.46 in 2008, reflecting the fact that Albanian Railways is unable to
recover operating costs (Table 17). Including state contributions, the working ratio was 0.97 in
2008, but above 1 in 2005 and 2007, indicating that even with state funding, the company has
serious financial difficulties in breaking even. In 2005-2008, state operating subsidies were higher
than combined revenues from freight and passenger services. As already mentioned, the wage
bill is particularly high, again exceeding the revenues from freight and passenger services,
reflecting high staffing levels, given the size of the network and the limited amount of traffic. The
financial situation in the first half of 2009 has worsened, with the working ratio, excluding state
contributions, rising to over 2. Without a significant restructuring, including downsizing of staff,
combined with minimum investments to improve operational performance, it appears unlikely
that Albanian Railways financial performance is likely to improve over the medium-term.
247. Average revenue per traffic unit is considerably lower than average costs per traffic
unit. Figure 57 shows that while average revenue per traffic unit rose considerably over 2005-
2008, it still represents only 62 percent of average operating costs in 2008, even with state
contributions. Average revenue per traffic unit for freight has declined from 5.9 euro cents in
2005 to 4.8 euro cents in 2008, but remains considerably above average revenue per traffic unit
for passenger services (Figure 58). Excluding subsidies, passenger revenue per traffic unit rose
from 4.7 euro cents in 2005 to 8.4 euro cents in 2008, in a context of declining traffic—with
traffic in passenger-km declining by 28.1 percent in the four year period. In contrast, average
freight revenue per traffic unit has declined over 2005-2008, from 5.9 euro cents in 2005 to 4.8
euro cents in 2008, while freight traffic doubled over the period—a worrying trend. Compared to
other countries in the region, average freight revenue per traffic unit is not low, but Albanian
Railways suffers from low freight traffic density, adversely affecting costs.
248. Albanian Railways’ wage bill is relatively high. Figure 59 presents the wage bill as a
percentage of operating costs and operating revenues, including and excluding state support to
Albanian Railways. As percentage of operating revenue excluding state support, the wage bill
declined from 120 percent in 2005 to 65 percent in 2008, before rising sharply in the first two
quarters of 2009, when traffic declined sharply. Including contributions from the budget, the
wage bill represented 43 percent of total revenue in 2008, down from 61 percent in 2005, but
again, by the second half of 2009 the progress achieved in the intervening years was wiped out
due to the impact of falling traffic on passenger and freight revenue.
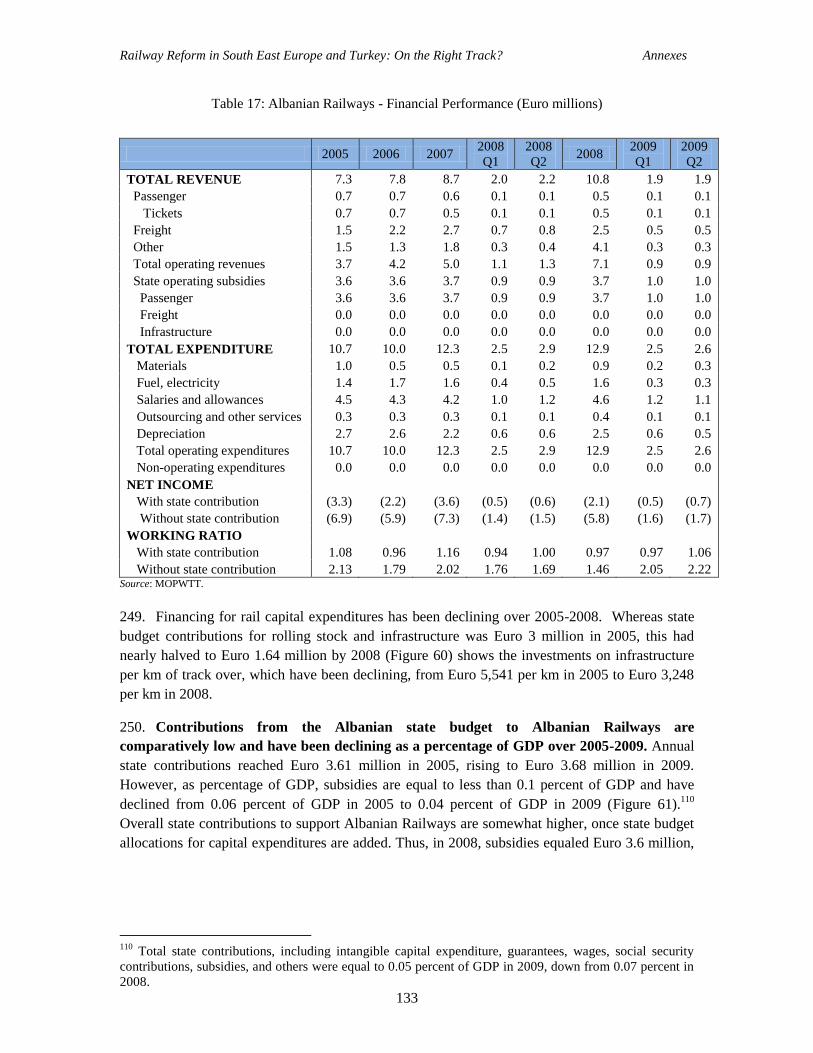
Railway Reform in South East Europe and Turkey: On the Right Track? Annexes
133
Table 17: Albanian Railways - Financial Performance (Euro millions)
2005 2006 2007 2008
Q1
2008
Q2 2008
2009
Q1
2009
Q2
TOTAL REVENUE 7.3 7.8 8.7 2.0 2.2 10.8 1.9 1.9
Passenger 0.7 0.7 0.6 0.1 0.1 0.5 0.1 0.1
Tickets 0.7 0.7 0.5 0.1 0.1 0.5 0.1 0.1
Freight 1.5 2.2 2.7 0.7 0.8 2.5 0.5 0.5
Other 1.5 1.3 1.8 0.3 0.4 4.1 0.3 0.3
Total operating revenues 3.7 4.2 5.0 1.1 1.3 7.1 0.9 0.9
State operating subsidies 3.6 3.6 3.7 0.9 0.9 3.7 1.0 1.0
Passenger 3.6 3.6 3.7 0.9 0.9 3.7 1.0 1.0
Freight 0.0 0.0 0.0 0.0 0.0 0.0 0.0 0.0
Infrastructure 0.0 0.0 0.0 0.0 0.0 0.0 0.0 0.0
TOTAL EXPENDITURE 10.7 10.0 12.3 2.5 2.9 12.9 2.5 2.6
Materials 1.0 0.5 0.5 0.1 0.2 0.9 0.2 0.3
Fuel, electricity 1.4 1.7 1.6 0.4 0.5 1.6 0.3 0.3
Salaries and allowances 4.5 4.3 4.2 1.0 1.2 4.6 1.2 1.1
Outsourcing and other services 0.3 0.3 0.3 0.1 0.1 0.4 0.1 0.1
Depreciation 2.7 2.6 2.2 0.6 0.6 2.5 0.6 0.5
Total operating expenditures 10.7 10.0 12.3 2.5 2.9 12.9 2.5 2.6
Non-operating expenditures 0.0 0.0 0.0 0.0 0.0 0.0 0.0 0.0
NET INCOME
With state contribution (3.3) (2.2) (3.6) (0.5) (0.6) (2.1) (0.5) (0.7)
Without state contribution (6.9) (5.9) (7.3) (1.4) (1.5) (5.8) (1.6) (1.7)
WORKING RATIO
With state contribution 1.08 0.96 1.16 0.94 1.00 0.97 0.97 1.06
Without state contribution 2.13 1.79 2.02 1.76 1.69 1.46 2.05 2.22 Source: MOPWTT.
249. Financing for rail capital expenditures has been declining over 2005-2008. Whereas state
budget contributions for rolling stock and infrastructure was Euro 3 million in 2005, this had
nearly halved to Euro 1.64 million by 2008 (Figure 60) shows the investments on infrastructure
per km of track over, which have been declining, from Euro 5,541 per km in 2005 to Euro 3,248
per km in 2008.
250. Contributions from the Albanian state budget to Albanian Railways are
comparatively low and have been declining as a percentage of GDP over 2005-2009. Annual
state contributions reached Euro 3.61 million in 2005, rising to Euro 3.68 million in 2009.
However, as percentage of GDP, subsidies are equal to less than 0.1 percent of GDP and have
declined from 0.06 percent of GDP in 2005 to 0.04 percent of GDP in 2009 (Figure 61).110
Overall state contributions to support Albanian Railways are somewhat higher, once state budget
allocations for capital expenditures are added. Thus, in 2008, subsidies equaled Euro 3.6 million,
110
Total state contributions, including intangible capital expenditure, guarantees, wages, social security
contributions, subsidies, and others were equal to 0.05 percent of GDP in 2009, down from 0.07 percent in
2008.

Railway Reform in South East Europe and Turkey: On the Right Track? Annexes
134
but total contributions equaled Euro 5.8 million. Total budget support to the rail sector fell
sharply in 2009, to Euro 4.1 million—a 25 percent decline in relation to 2008.111
Figure 57: Albanian Railways Transport: Average
Revenue and Cost per Traffic Unit (Euro cents)
Figure 58: Albanian Railways - Average Revenue
per Traffic Unit (Euro cents)
Source: UIC. Source: UIC.
Figure 59: Albanian Railways – Wage Bill Indicators (Euro cents)
Source: UIC.
251. A feasibility study prepared in 2009 has estimates of the costs required to upgrade
infrastructure in the core rail network.112
Three scenarios were developed: (i) a low scenario to
increase maintenance to achieve 60 km/hour running speed; (ii) improvement works to achieve
100 km/hour and 22.5 ton axle-loads; and (iii) option 1 plus enhanced rail safety performance.
The low scenario focuses on a minimum track maintenance program, allowing only minor
improvements in passenger and freights services. For options 1 and 2 total costs are estimates at
111
In local currency, subsidies declined by 25.2 percent in 2009, while in euros subsidies declined by 29.9,
reflecting the depreciation of the Albanian lek.
112 European Union‘s CARDS Programme for the Western Balkans (2009), Albanian Railways Network:
Infrastructure and Signaling Improvement Project, TA-ALB-06, Infrastructure Projects Facility in the
Western Balkans. Draft Final Report, Vol 1 – Main Report, November 2009.
4.7
8.3
10.4
12.713.4
10.7
14.615.2
0.0
2.0
4.0
6.0
8.0
10.0
12.0
14.0
16.0
2005 2006 2007 2008
Unit total revenue Unit operating cost
0.9 0.9 1.1 1.0
5.9 6.0
5.14.8
2005 2006 2007 2008
Unit passenger revenue Unit freight revenue
42 4334 36
47 44
120
104
84
65
128 124
6155
4843
60 59
0
20
40
60
80
100
120
140
2005 2006 2007 2008 2009 Q1 2009 Q2
% of operating costs % of operating revenue (excl state contribution) % of total revenue
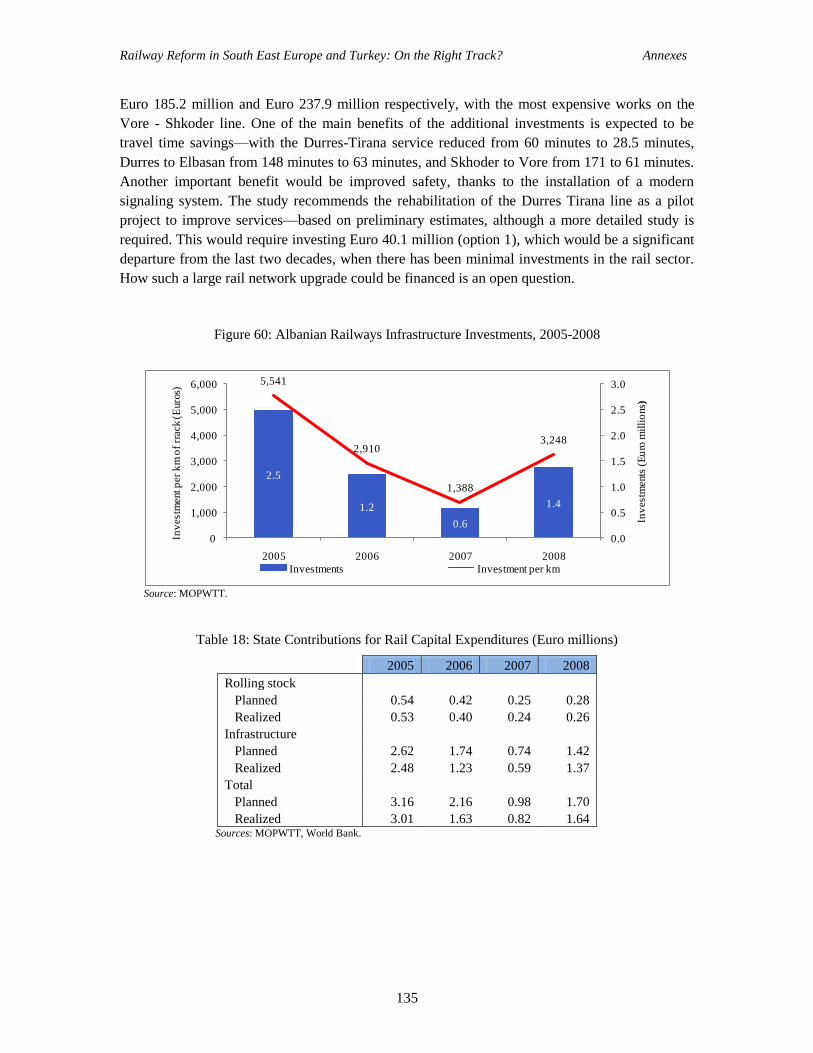
Railway Reform in South East Europe and Turkey: On the Right Track? Annexes
135
Euro 185.2 million and Euro 237.9 million respectively, with the most expensive works on the
Vore - Shkoder line. One of the main benefits of the additional investments is expected to be
travel time savings—with the Durres-Tirana service reduced from 60 minutes to 28.5 minutes,
Durres to Elbasan from 148 minutes to 63 minutes, and Skhoder to Vore from 171 to 61 minutes.
Another important benefit would be improved safety, thanks to the installation of a modern
signaling system. The study recommends the rehabilitation of the Durres Tirana line as a pilot
project to improve services—based on preliminary estimates, although a more detailed study is
required. This would require investing Euro 40.1 million (option 1), which would be a significant
departure from the last two decades, when there has been minimal investments in the rail sector.
How such a large rail network upgrade could be financed is an open question.
Figure 60: Albanian Railways Infrastructure Investments, 2005-2008
Source: MOPWTT.
Table 18: State Contributions for Rail Capital Expenditures (Euro millions)
2005 2006 2007 2008
Rolling stock
Planned 0.54 0.42 0.25 0.28
Realized 0.53 0.40 0.24 0.26
Infrastructure
Planned 2.62 1.74 0.74 1.42
Realized 2.48 1.23 0.59 1.37
Total
Planned 3.16 2.16 0.98 1.70
Realized 3.01 1.63 0.82 1.64 Sources: MOPWTT, World Bank.
2.5
1.2
0.6
1.4
5,541
2,910
1,388
3,248
0.0
0.5
1.0
1.5
2.0
2.5
3.0
0
1,000
2,000
3,000
4,000
5,000
6,000
2005 2006 2007 2008
Inv
estm
ents
(E
uro
mil
lio
ns)
Inv
estm
ent p
er k
m o
f rr
ack (
Euro
s)
Investments Investment per km

Railway Reform in South East Europe and Turkey: On the Right Track? Annexes
136
Figure 61: Albanian Railways – State Support to Rail Sector, 2005-2009
Sources: MOPTT, IMF, World Bank.
Table 19: Albanian Railways - Investment Cost Estimates (Euro millions)
Durres
Tirana
(37 km)
Durres
Rrogozhine
(35 km)
Rrogozhine
Elbasan
(40 km)
Vore
Shkoder
(85 km)
Total
Option 1 40.1 34.9 38.7 71.6 185.2
Track and civil engineering 14.4 17.5 19.3 38.4 89.6
Signaling 13.3 8.2 9.0 17.5 48.1
Stations 7.4 4.9 5.0 6.8 24.0
Option 2 49.5 45.1 47.1 96.2 237.9
Track and civil engineering 20.6 25.6 25.7 56.7 128.7
Signaling 14.3 8.2 9.0 17.5 49.1
Stations 9.2 5.6 5.7 9.4 29.9 Note: The total breakdown excludes structures, environmental impact assessments, design and management. Source: European Union‘s CARDS Programme for the Western Balkans (2009).
0.060.05
0.05
0.04 0.04
0.02
0.03
0.04
0.05
0.06
0.07
0.08
3.50
3.55
3.60
3.65
3.70
3.75
2005 2006 2007 2008 2009
State contribution (Euro millions) % of GDP

Railway Reform in South East Europe and Turkey: On the Right Track? Annexes
137
THE RAILWAYS OF BOSNIA AND HERZEGOVINA113
252. The railways in Bosnia and Herzegovina have a complex and costly structure,
reflecting their difficult recent history. Prior to 1991, the railways in Bosnia and Herzegovina
were a fully integrated part of the former Yugoslavian railways. When Bosnia and Herzegovina
become independent in 1991, a new state railway company was formed. Following the Dayton
Peace Accords of 1995, the state railway company was divided into three regional state owned
companies reflecting the ethnic divisions of the country. In 2001, the FBH adopted a new railway
law that merged the railway companies in the Croat and Bosnian parts of the country to create
Željeznice Federacije Bosne i Herzegovine (ŢFBH). However, the railway in the RS, Željeznice
Republike Srpske (ŢRS), remained separate. The sector now includes two vertically integrated
railway companies, and a state level coordinating body, Bosanskohercegovačka Željeznička
Javna Korporacija (BHŢJK).
253. The railway network in Bosnia and Herzegovina extends for some 1,017 km. It is based
on a standard gauge (1,435 mm) and the majority is single track (92 percent). After extensive
rehabilitation, more than 85 percent of the network is now classified as D4 in terms of UIC load
categories, allowing maximum loads of 22.5 tons per axle, or 8.0 tons per linear meter. Around
76 percent of the network is electrified with a mono-phase 25kV, 50HŢ AC system. The only
non-electrified part of the railway network is located in the north-eastern part of the country,
around Tuzla, but it is important in traffic terms. All lines are single-track, except one section of
87 kilometers of Corridor Vc between Zenica and Doboj.
254. The railway network comprises two main strategic lines, which are also the main
railway lines for cargo. The two include: (i) The North-South Bos.Samac-Doboj-Zenica-
Sarajevo-Mostar-Capljina line located on Corridor Vc (which connects Budapest in Hungary to
Ploce in Croatia); and (ii) the West-East Dobrjlin–Bos.Novi-Banja Luka-Doboj-Tuzla-Zvornik
line which is the railway line parallel to Corridor X. The rehabilitation of the core railway
network, in particular Pan-European Corridor Vc and the east-west line parallel to Corridor X are
deemed to be critical first steps. In 2005, the EBRD approved euro 70 million (US$102 million)
for a program of track renewal on key sections of both corridors, together with rehabilitation of
the station signaling system and purchase of track machinery.
Operational Performance
255. In Bosnia and Herzegovina passenger traffic is dwarfed by freight traffic, with the
latter accounting for 94.2 percent of total traffic in 2009.114
Passenger traffic has risen by 30
percent over the decade, from a very low base—47 million passenger-km in 2000 to 61 million
113
This section is based in part on Annex 3 of the World Bank‘s Bosnia and Herzegovina: The Road to
Europe, Transport Sector Review, Transport Unit, Sustainable Development Department, Europe and
Central Asia Region, Report No. 54406-BH, May 2010. 114
Reliable figures on the traffic volumes carried by Bosnia‘s railways are difficult to obtain. The numbers
for both freight and passenger traffic have to be treated with a degree of caution, as a simple addition of
traffic data from the two entity railway companies overestimates actual traffic. Both ZFBH and ZRS count
traffic with an origin in one of the entities and a destination in the other in their respective figures. Traffic
with an origin and destination in one of entities, where it crosses the other, is counted by the latter as transit
traffic. This requires careful consideration in the appraisal of prospective investments.

Railway Reform in South East Europe and Turkey: On the Right Track? Annexes
138
passenger-km in 2009. Its share in the total traffic has declined from 18 percent in 2000 to 4.6
percent in 2005 and to 5.8 percent by 2009. Figure 64 presents a break-down of passenger traffic
between the two entity-level railway undertakings, and reveals that there has been a large rise,
albeit from a very modest base, for passenger transport carried by ŢFBH, but not for ŢRS. In fact,
over 2000-2009, passenger transport rose by 277.8 percent for ŢFBH, while for ŢRS it declined
by 28.9 percent. In 2009, passenger transport was a mere 34 million passenger-km for ŢFBH and
27 million passenger-km for ŢRS—these are the lowest passenger traffic figures for the 10
countries included in this report, with the exception of Albania and Kosovo. In 2009, the average
number of passengers in a ŢFBH train was a mere 35, down from 37 in 2008, in a train consisting
on average of 2.11 coaches for a distance of 73 km.
Figure 62: Bosnia and Herzegovina – Rail Traffic, 2000-2009
Source: UIC.
256. Rail traffic is dominated by developments in freight transport. Freight traffic has more
than tripled, increasing from 214 million ton-km in 2000 to 988 million ton-km in 2009.115
The
reopening of some of the heavy and extractive industries in Bosnia and Herzegovina since 2004,
particularly in the FBH, has led to an increase in both tons and ton-km. Figure 65 shows that the
gap in traffic between ŢFBH and ŢRS has increased over the decade, although both railway
undertakings experienced rapid growth: traffic grew by 375 percent for ŢFBH and by 336 percent
for ŢRS. However, ŢFBH traffic stood at 665 million ton-km, double the 332 million ton-km of
ŢRS.
115
The commodity structure of freight traffic is dominated by bulk cargo. The main commodities include
iron ore and bauxite, lignite, aluminum and hydrated alumina, coking coal and coke, and scrap. Major
clients include (i) Elektroprivreda with coal transported from the coal mines to coal-fired power stations,
mainly in Tuzla and Kakanj; (ii) Mittal Prijedor export of iron ores; (iii) GIKIL Lukavac with imports of
coking coal and export of coke; (iv) Birac Zvornik and hydrated alumina; (v) Mittal Zenica with scrap and
metallurgical products; and Aluminj Mostar. The traffic volume of these clients represented over 80 percent
of total railway traffic in ZFBH, which represents a relatively strong concentration on a few rail clients and
a few commodities.
0
200
400
600
800
1,000
1,200
1,400
2000 2001 2002 2003 2004 2005 2006 2007 2008 2009
Passenger (million pass-km) Freight (million ton-km)

Railway Reform in South East Europe and Turkey: On the Right Track? Annexes
139
Figure 63: Rail Network of Bosnia and Herzegovina
Source:World Bank.
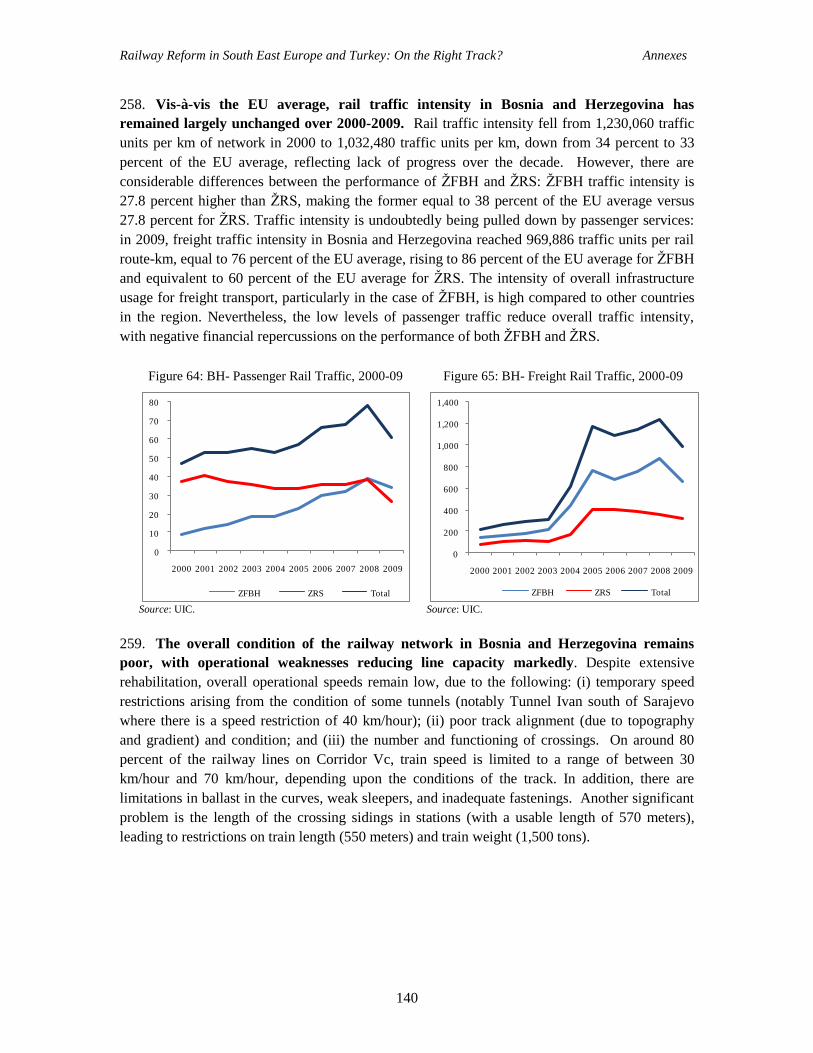
Railway Reform in South East Europe and Turkey: On the Right Track? Annexes
140
258. Vis-à-vis the EU average, rail traffic intensity in Bosnia and Herzegovina has
remained largely unchanged over 2000-2009. Rail traffic intensity fell from 1,230,060 traffic
units per km of network in 2000 to 1,032,480 traffic units per km, down from 34 percent to 33
percent of the EU average, reflecting lack of progress over the decade. However, there are
considerable differences between the performance of ŢFBH and ŢRS: ŢFBH traffic intensity is
27.8 percent higher than ŢRS, making the former equal to 38 percent of the EU average versus
27.8 percent for ŢRS. Traffic intensity is undoubtedly being pulled down by passenger services:
in 2009, freight traffic intensity in Bosnia and Herzegovina reached 969,886 traffic units per rail
route-km, equal to 76 percent of the EU average, rising to 86 percent of the EU average for ŢFBH
and equivalent to 60 percent of the EU average for ŢRS. The intensity of overall infrastructure
usage for freight transport, particularly in the case of ŢFBH, is high compared to other countries
in the region. Nevertheless, the low levels of passenger traffic reduce overall traffic intensity,
with negative financial repercussions on the performance of both ŢFBH and ŢRS.
Figure 64: BH- Passenger Rail Traffic, 2000-09 Figure 65: BH- Freight Rail Traffic, 2000-09
Source: UIC. Source: UIC.
259. The overall condition of the railway network in Bosnia and Herzegovina remains
poor, with operational weaknesses reducing line capacity markedly. Despite extensive
rehabilitation, overall operational speeds remain low, due to the following: (i) temporary speed
restrictions arising from the condition of some tunnels (notably Tunnel Ivan south of Sarajevo
where there is a speed restriction of 40 km/hour); (ii) poor track alignment (due to topography
and gradient) and condition; and (iii) the number and functioning of crossings. On around 80
percent of the railway lines on Corridor Vc, train speed is limited to a range of between 30
km/hour and 70 km/hour, depending upon the conditions of the track. In addition, there are
limitations in ballast in the curves, weak sleepers, and inadequate fastenings. Another significant
problem is the length of the crossing sidings in stations (with a usable length of 570 meters),
leading to restrictions on train length (550 meters) and train weight (1,500 tons).
0
10
20
30
40
50
60
70
80
2000 2001 2002 2003 2004 2005 2006 2007 2008 2009
ZFBH ZRS Total
0
200
400
600
800
1,000
1,200
1,400
2000 2001 2002 2003 2004 2005 2006 2007 2008 2009
ZFBH ZRS Total

Railway Reform in South East Europe and Turkey: On the Right Track? Annexes
141
Figure 66: BH- Traffic Intensity, 2005-09 Figure 67: BH- Labor Productivity, 2005-09
Source: UIC. Source: UIC.
260. Labor productivity, as measured by the number of traffic units per employee, has not
improved over 2005-2009, and is less than a third of EU levels. In the case of ŢFBH, labor
productivity rose in 2006-2008, before declining to 172,380 traffic units per employee in 2009—
equal to 29 percent of the EU average (Figure 67)—while staff levels rose by 8 percent to
4,055.116
ŢRS has very low labor productivity, and it has declined annually during the last five
years, to 101,952 traffic units per staff in 2009. This is only 59 percent of the ŢFBH level in
2009, and a mere 17 percent of EU levels—the lowest in ten countries covered in this study after
Albania. ŢRS employees rose by 4 percent in 2005-2009, to 3,433. Given such low labor
productivity levels, particularly for ŢRS, the question needs to be asked as to why additional
employees are being recruited, given the impact this will have on the cost structure. According to
the RS Government Strategy for the rails sector, number of employees and current expenditure on
the work force are not in line with business results, and need to be reduced to sustainable
levels.117
With 2,082 staff working in the infrastructure department of ŢRS, this represents 5 staff
per km of track—which is extremely high and indicative of overstaffing.118
For ŢFBH, there are
2,084 staff working in infrastructure, equivalent to 3.5 staff per km of track—which although
lower than for ŢRS, is on the high side.119
261. The age structure of key rail infrastructure is generally old, in both ŽFBH and ŽRS.
The age structure of the: (i) telecommunications installations; (ii) catenary system; (iii) relay
interlocking system, and (iv) signaling system are presented in Figure 68 for ŢFBH and Figure 69
The relay system in ŢFBH was installed over the last 10 years—but over 50 percent of the three
other types of infrastructure was installed over 40 years ago and is in need of upgrading. Over 60
116
ZFBH calculates its labor productivity at 211,462 net ton-km per employee in 2009 using the number of
workers based on the number of working hours, instead of the total number of staff. According to agreed
criteria of an EBRD credit, productivity, measured in this way, should not be less than 200,000 traffic units
per employee. See Railways of Federation Bosnia and Herzegovina Ltd (2010a), Report on Operations
Railway Federation of B&H For 2009 ,Sarajevo, February 2009. 117
Government of Republika Srpska (2009), Development Strategy for Railways of Republika Srpska 2009-
2015, Banja Luka, August 2009. 118
ZRS (2009), Business Plan Railways of the Republika Srpska, JSC Doboj, 2009-2011. Doboj, January
2009. 119 Railways of Federation Railways of Federation Bosnia and Herzegovina Ltd (2010), Report on
Operations Railway of Federation B&H For Year 2009, Sarajevo, February 2010.
20%
25%
30%
35%
40%
45%
700,000
800,000
900,000
1,000,000
1,100,000
1,200,000
1,300,000
1,400,000
1,500,000
1,600,000
2005 2006 2007 2008 2009
ZFBH ZRS% of EU average (ZFBH) % of EU average (ZRS)
3,000
3,200
3,400
3,600
3,800
4,000
4,200
90,000
110,000
130,000
150,000
170,000
190,000
210,000
230,000
250,000
2005 2006 2007 2008 2009
ZFBH Traffic units/staff ZRS Traffic units/staff
ZFBH Staff ZRS Staff

Railway Reform in South East Europe and Turkey: On the Right Track? Annexes
142
percent of telecommunications system and 74 percent of the catenary system in ŢRS was installed
between 21 to 30 years ago. In the case of the relay/interlocking system, 69 percent dates from
over 30 years ago. These figures reflect under-investment over a protracted period of time and
raise the question of whether network rationalization may be required to concentrate scarce
resources on the infrastructure that is most heavily used.
Figure 68: ŢFBH – Age Structure of Rail Infrastructure
Source: ŢFBH.
Figure 69: ŢRS – Age Structure of Rail Infrastructure
Source: ŢRS.
262. Slow operational speeds, practices and poor signaling reduce line capacity markedly.
A recent study reported weaknesses in the signaling system, and suggested that it is of only
limited use in actual operations.120
In addition, drivers frequently pass red signals (SPAD - Signal
Passed at Danger), a key safety statistic, requiring each train to be equipped with two drivers to
ensure safety. The failings of the current signaling system, apart from being a major safety
concern, also lead to a marked reduction in line capacity. Another restriction on line capacity is
the current practice of only conducting maintenance operations during daylight hours. This
restriction, even on those lines where there is no nighttime traffic, significantly reduces
operational capacity while the work is going on, but says more about the lack of flexibility of
working practices. In 2009, the average commercial speed for ŢFBH passenger trains was 47.5
km/hour, and for freight trains 32.6 km/hour.
120
DB International, Vienna Consult and viadonau (2008) Provision of Studies for Intermodal Transport in
Bosnia and Herzegovina. A study funded by the European Union.
100
24
5
18
5
9
5
31 60
57
85
Signalling System
Relay/interlocking sytem
Catenary system
Telecommunications installations
< 10 years 11-20 years 21-30 years 31-40 years > 40 years
31
24
74
60
69
26
76
40
Signalling System
Relay/interlocking sytem
Catenary system
Telecommunication installations
< 10 years 11-20 years 21-30 years 31-40 years > 40 years

Railway Reform in South East Europe and Turkey: On the Right Track? Annexes
143
263. The condition of the rolling stock on both railways is generally poor. The locomotives,
wagons, and passenger units of both railways have a high average age, with many awaiting
rehabilitation since the end of the war (Figure 70 and Figure 71). Both companies used
locomotives to haul passenger services, even on some shorter routes, despite the higher costs of
these operations, reflecting a lack of modern Diesel/Electric Multiple Units (DMU/EMU). There
is a need for a coherent plan to replace life expired rolling stock, where justified by the economic
and financial case.
Figure 70: ŢFBH – Age Structure of Rolling Stock
Source: ŢFBH.
Figure 71: ŢRS – Age Structure of Rolling Stock
Source: ŢRS.
264. There are significant differences in rolling stock productivity in ŽFBH and ŽRS vis-à-
vis the EU average. In 2009, ŢFBH freight wagon productivity was 52 percent of the EU
average, while it was only 21 percent of the EU average for ŢRS—in both cases there has been
no improvement over 2005-2009 (Table 20). This reflects in part a large fraction of the fleet not
being operational—in the case of ŢRS this reached 43.5 percent in 2008. Locomotive
productivity is very low, although it has been rising over 2005-2009 in the case of ŢFBH.
Nevertheless, at 19 percent of the EU average for ŢFBH and only 5 percent for ŢRS, it remains
among the lowest in the region. There has been no improvement in coach productivity for ŢFBH
or ŢRS, which remains under a third of the EU level. Given the low levels of passenger traffic
and the old age of coaches, there may be grounds to accelerate the scraping and to increase the
proportion of the operational fleet. Low rolling stock productivity generates high freight and
passenger operating costs for both ŢFBH and ŢRS, making them less competitive vis-à-vis trucks
and buses.
14
15
3
2
15
18 16
65
32
34
33
38
15
Locomotives
Passenger coaches
Freight wagons< 10 years
11-20 years
21-25 years
26-30 years
31-40 years
> 40 years
10
25
17
4
19
60
28
45
27
47
16
Locomotives
Passenger coaches
Freight wagons< 10 years
11-20 years
21-25 years
26-30 years
31-40 years
> 40 years
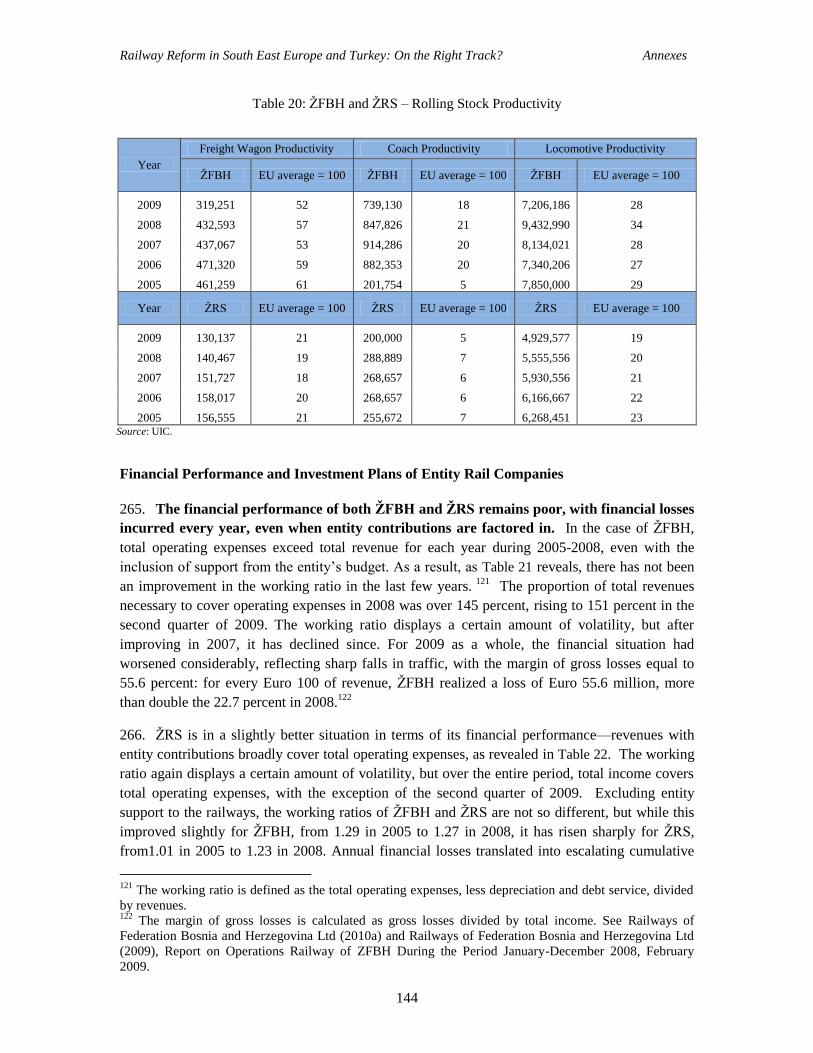
Railway Reform in South East Europe and Turkey: On the Right Track? Annexes
144
Table 20: ŢFBH and ŢRS – Rolling Stock Productivity
Year
Freight Wagon Productivity Coach Productivity Locomotive Productivity
ŢFBH EU average = 100 ŢFBH EU average = 100 ŢFBH EU average = 100
2009 319,251 52 739,130 18 7,206,186 28
2008 432,593 57 847,826 21 9,432,990 34
2007 437,067 53 914,286 20 8,134,021 28
2006 471,320 59 882,353 20 7,340,206 27
2005 461,259 61 201,754 5 7,850,000 29
Year ŢRS EU average = 100 ŢRS EU average = 100 ŢRS EU average = 100
2009 130,137 21 200,000 5 4,929,577 19
2008 140,467 19 288,889 7 5,555,556 20
2007 151,727 18 268,657 6 5,930,556 21
2006 158,017 20 268,657 6 6,166,667 22
2005 156,555 21 255,672 7 6,268,451 23 Source: UIC.
Financial Performance and Investment Plans of Entity Rail Companies
265. The financial performance of both ŽFBH and ŽRS remains poor, with financial losses
incurred every year, even when entity contributions are factored in. In the case of ŢFBH,
total operating expenses exceed total revenue for each year during 2005-2008, even with the
inclusion of support from the entity‘s budget. As a result, as Table 21 reveals, there has not been
an improvement in the working ratio in the last few years. 121
The proportion of total revenues
necessary to cover operating expenses in 2008 was over 145 percent, rising to 151 percent in the
second quarter of 2009. The working ratio displays a certain amount of volatility, but after
improving in 2007, it has declined since. For 2009 as a whole, the financial situation had
worsened considerably, reflecting sharp falls in traffic, with the margin of gross losses equal to
55.6 percent: for every Euro 100 of revenue, ŢFBH realized a loss of Euro 55.6 million, more
than double the 22.7 percent in 2008.122
266. ŢRS is in a slightly better situation in terms of its financial performance—revenues with
entity contributions broadly cover total operating expenses, as revealed in Table 22. The working
ratio again displays a certain amount of volatility, but over the entire period, total income covers
total operating expenses, with the exception of the second quarter of 2009. Excluding entity
support to the railways, the working ratios of ŢFBH and ŢRS are not so different, but while this
improved slightly for ŢFBH, from 1.29 in 2005 to 1.27 in 2008, it has risen sharply for ŢRS,
from1.01 in 2005 to 1.23 in 2008. Annual financial losses translated into escalating cumulative
121
The working ratio is defined as the total operating expenses, less depreciation and debt service, divided
by revenues. 122
The margin of gross losses is calculated as gross losses divided by total income. See Railways of
Federation Bosnia and Herzegovina Ltd (2010a) and Railways of Federation Bosnia and Herzegovina Ltd
(2009), Report on Operations Railway of ZFBH During the Period January-December 2008, February
2009.

Railway Reform in South East Europe and Turkey: On the Right Track? Annexes
145
financial losses over the last 5 years. Financial losses not only affect the operations of ŢFBH and
ŢRS, but also their future development. As there are no retained earnings with which to finance
investments, so investments must be financed by debts, and in the future accession to the EU
brings the prospects of extensive EU accession funds.
Table 21: ŢFBH - Financial Performance (Euro millions)
2005 2006 2007 2008
Q1
2008
Q2 2008
2009
Q1
2009
Q2
TOTAL REVENUE 50.2 50.5 56.6 15.4 17.7 68.7 11.6 14.4
Passenger 2.0 2.3 3.2 0.5 1.0 3.7 0.5 1.2
Tickets 0.9 1.0 1.1 0.2 0.3 1.4 0.3 0.3
Freight 33.3 33.5 36.5 10.7 12.4 46.4 7.6 9.6
Other 5.0 4.9 4.1 0.6 0.6 4.0 0.4 0.7
Total operating revenues 40.4 40.7 43.7 11.8 14.1 54.2 8.6 11.5
Entity operating contribution 9.8 9.8 12.8 3.6 3.6 14.5 3.0 3.0
Passenger 1.5 1.0 1.0 0.3 0.3 1.0 0.3 0.3
Freight 0.0 0.0 0.0 0.1 0.1 0.3 0.1 0.1
Infrastructure 8.3 8.8 11.8 3.3 3.3 13.2 2.7 2.7
TOTAL EXPENDITURE 83.2 89.2 77.3 19.1 21.8 89.0 20.1 21.8
Materials 4.7 7.0 4.5 0.8 1.1 4.1 0.9 1.2
Fuel, electricity 5.4 4.7 4.6 1.6 1.4 6.0 1.5 1.0
Salaries and allowances 27.3 29.4 31.4 8.6 10.1 38.8 9.8 9.5
Outsourcing and other services 14.8 17.8 13.5 2.7 4.3 19.9 3.0 5.3
Depreciation 31.0 30.3 23.3 5.3 5.0 20.1 4.9 4.8
Total operating expenditures 83.2 89.2 77.3 19.1 21.8 89.0 20.1 21.8
Non-operating expenditures 0.0 0.0 0.0 0.0 0.0 0.0 0.0 0.0
NET INCOME
With entity contribution (33.0) (38.7) (20.7) (3.7) (4.1) (20.3) (8.5) (7.3)
Without entity contribution (42.8) (48.5) (33.5) (7.3) (7.8) (34.8) (11.5) (10.3)
WORKING RATIO
With entity contribution 1.04 1.17 0.95 0.89 0.95 1.00 1.31 1.17
Without entity contribution 1.29 1.45 1.24 1.17 1.19 1.27 1.77 1.48 Source: ŢFBH.
267. Labor costs represent a substantial and growing share of the cost structure of ŽFBH
and ŽRS. Salary and allowance expenditures have increased in recent years, rising from 33
percent of operating costs in 2005 to 44 percent in 2008 for ŢFBH (Figure 72); and from 48
percent of operating costs to 61 percent over the same period for ŢRS (Figure 73). This upward
trend of expenditures over salaries continued in the first half of 2009. This reflects declining labor
productivity as well as overall increases in staff over 2005-2009, with the latter putting upward
pressure on the wage bill. Excluding funds from entities, the wage bill stood at 72 percent of
revenues for ŢFBH and a whopping 93 percent of revenues for ŢRS, rising very rapidly over the
last five years in the latter case. These figures suggest that both railways are suffering from
overstaffing, and that the necessary retrenchment is being averted through compensation paid by
the entities and the capacity of both joint stock companies to operate year in and year out with
financial losses, without this leading to a fundamental rethinking of existing business strategies.

Railway Reform in South East Europe and Turkey: On the Right Track? Annexes
146
Table 22: ŢRS - Financial Performance (Euro millions)
2005 2006 2007 2008
Q1
2008
Q2 2008
2009
Q1
2009
Q2
TOTAL REVENUE 37.7 38.3 38.5 10.2 10.8 42.5 8.6 8.1
Passenger 0.9 0.8 1.0 0.3 0.3 1.1 0.3 0.2
Tickets 0.9 0.8 1.0 0.3 0.3 1.1 0.3 0.2
Freight 15.3 16.9 17.6 4.5 5.0 18.9 3.2 2.5
Other 7.0 6.8 5.9 1.4 1.4 5.9 1.0 1.2
Total operating revenues 23.2 24.6 24.4 6.1 6.6 25.9 4.5 3.9
Entity operating subsidies 14.5 13.7 14.1 4.2 4.2 16.6 4.2 4.2
Passenger 0.0 0.0 3.5 0.5 0.5 2.0 0.5 0.5
Freight 0.0 0.0 0.0 0.0 0.0 0.0 0.0 0.0
Infrastructure 14.5 13.7 10.5 3.6 3.6 14.6 3.6 3.6
TOTAL EXPENDITURE 38.5 46.3 45.5 11.3 12.2 49.9 11.5 12.3
Materials 3.0 4.1 3.7 1.1 0.8 4.0 0.6 1.2
Fuel, electricity 3.2 3.0 2.5 0.6 0.8 2.6 0.4 0.4
Salaries and allowances 14.2 16.9 21.0 5.9 6.1 24.1 6.2 6.6
Outsourcing and other services 3.0 7.1 3.0 0.3 0.2 1.2 0.7 0.3
Depreciation 6.6 6.8 6.8 1.7 1.9 7.7 1.9 1.8
Total operating expenditures 29.9 37.8 37.0 9.5 9.9 39.7 9.7 10.3
Non-operating expenditures 8.6 8.4 8.5 1.8 2.4 10.3 1.8 2.1
NET INCOME
With entity contribution (0.9) (8.0) (7.0) (1.0) (1.4) (7.5) (2.9) (4.3)
Without entity contribution (15.3) (21.7) (21.1) (5.2) (5.6) (24.1) (7.0) (8.4)
WORKING RATIO
With entity contribution 0.62 0.81 0.78 0.76 0.74 0.75 0.91 1.04
Without entity contribution 1.01 1.26 1.23 1.27 1.20 1.23 1.75 2.15 Source: ŢRS.
268. ŽFBH and ŽRS unit revenue for passenger services are a small fraction of unit costs.
ŢFBH unit revenue for passenger services has not risen over 2005-2008 and was equal to only 46
percent of passenger unit costs in 2008. Passenger unit revenues, at 12 euro cents in 2008,
include entity level funds—entity operating support has declined from 6.67 euro cents in 2005 to
2.62 euro cents in 2008, as passenger traffic has risen much more rapidly than such support
(Figure 74). If entity funds are excluded, unit passenger revenues reached 3.56 euro cents in
2008—down from 3.73 euro cents in 2005—and are seven times less than unit costs. Including all
sources of revenue, there has been progress as unit passenger transport revenue in 2008 was a
higher share of unit costs than in 2005—from 41 percent in 2005 to 46 percent by 2008. ŢRS
unit revenue for passenger services is much lower than ŢFBH, rising from 2 euro cents in 2005 to
8 euro cents in 2008 (Figure 75). Likewise, the gap between unit revenue and unit costs is much
wider in the case of ŢRS: only 33 percent of unit costs in 2008, up from 14 percent in 2005, but
still very low. The unit operating costs for passenger services are the highest among the 10
countries included in study. An important issue is the extent to which the entity contract creates
adequate incentives for continued operational efficiency.

Railway Reform in South East Europe and Turkey: On the Right Track? Annexes
147
Figure 72: ŢFBH- Wage Bill Indicators, 2005-08 Figure 73: ŢRS – Wage Bill Indicators, 2005-08
Source: ŢFBH. Source: ŢRS.
269. By contrast, ŽFBH and ŽRS unit revenues for freight transport exceed unit costs by a
wide margin. ŢFBH unit revenues from freight transport have risen by 20 percent in the last four
years, from 4.4 euro cents to 5.3 euro cents, while unit costs have increased by only 11 percent
(Figure 76 and Figure 77). Similarly, ŢRS unit revenues from freight transport increased by 40.5
percent, to 5.2 euro cents, while unit costs have increased by 38 percent. ŢFBH unit costs for
freight are 4.1 euro cents, significantly more than the 3.3 euro cents for ŢRS. ŢFBH unit revenues
for freight exceeded unit costs by 129 percent in 2008, up from 119 percent in 2005—while for
ŢRS unit revenues were equal to 158 percent of costs in 2008, up from 154 percent in 2005.
Thus, for both companies, unit net revenues from freight services have been on the rise, and unit
costs are a small fraction of unit costs for passenger services.
270. Charges for usage of infrastructure vary between ŽFBH, and ŽRS and there is a need
for TAC to be unified in Bosnia and Herzegovina. Only freight pays infrastructure charges in
the case of ŢFBH, and the rate is low—this is calculated by dividing charged paid by freight
traffic in ton-km—0.50 euro cents per ton-km in 2008, up from 0.27 euro cents in 2005 (Figure
78). By contrast, ŢRS charges both passenger and freight transport for the use of infrastructure.
This translates into 2.8 euro cents per traffic unit for passenger services and 3.2 euro cents per
traffic unit for freight services (Figure 79). In the case of ŢFBH, charges paid for infrastructure
account for 23 percent of total infrastructure revenue in 2008, down from 38 percent in 2005; for
ŢRS, the share was 25 percent in 2008, compared to 67 percent in 2005.
271. The structure of track access charges should avoid cross subsidies between freight and
passenger transport. The revenue structure for selling transport capacities is broadly in line with
these shares for ŢFBH—in 2008 passenger traffic used 4.3 percent of the sold railway transport
capacity and did not pay track access charges. On the other hand, in 2008 passenger traffic
accounted for 9.8 percent of transport capacity in the ŢRS, but contributed 58.1 percent of
revenue. Passenger trains use most of the RS railway lines and need higher speeds—and freight
trains use a reduced length of railway network (concentrated on main lines and using a limited
number of local railway lines and limited number of railway stations), and do not need as high
speeds. Nevertheless, the current distribution of ŢRS revenues might indicate that clients using
railway infrastructure for passenger transport cross subsidize freight services.
33 33
4144
6872 72 72
5458
55 56
0
10
20
30
40
50
60
70
80
2005 2006 2007 2008
% of operating costs
% of operating revenue (excl state contribution)
% of total revenue
4845
576161
69
86
93
3844
55 57
0
10
20
30
40
50
60
70
80
90
100
2005 2006 2007 2008
% of operating costs% of operating revenue (excl state contribution)% of total revenue

Railway Reform in South East Europe and Turkey: On the Right Track? Annexes
148
Figure 74: ŢFBH – Average Revenue and Cost
per Passenger Unit (Euro cents/pass-km)
Figure 75: ŢRS – Average Revenue and Cost per
Passenger Unit (Euro cents/pass-km)
Source: ŢFBH. Source: ŢRS.
Figure 76: ŢFBH – Average Revenue and Cost
per Freight Unit (Euro cents/ton-km)
Figure 77: ŢRS – Average Revenue and Cost per
Freight Unit (Euro cents/ton-km)
Source: ŢFBH. Source: ŢRS.
Figure 78: ŢFBH – Evolution of TAC per Freight
Traffic Unit (Euro/Train-km)
Figure 79: ŢRS – Evolution of TAC per Traffic
Unit (Euro/Train-km)
Source: ŢFBH. Source: ŢRS.
15
1113 12
37
30
2426
2005 2006 2007 2008
Unit total revenue Unit operating cost
3 2
12
8
22
2526
24
2005 2006 2007 2008
Unit total revenue Unit operating cost
4.4
4.9 4.8
5.3
3.7
4.6
3.6
4.1
2005 2006 2007 2008
Unit total revenue Unit operating cost
3.74.1
4.5
5.2
2.4
2.9 3.03.3
2005 2006 2007 2008
Unit total revenue Unit operating cost
1.47
1.86
2.632.74
2005 2006 2007 2008
2.0 2.0 2.0
2.82.9
3.1 3.03.2
2005 2006 2007 2008
Passenger Freight

Railway Reform in South East Europe and Turkey: On the Right Track? Annexes
149
Figure 80: ŢFBH and ŢRS –TAC as a Share of Total Infrastructure Revenue
Sources: ŢFBH, ŢRS.
Figure 81: ŢFBH – Share of Passenger versus
Freight Train KM and TAC, 2008 (percentages)
Figure 82: ŢRS – Share of Passenger versus Freight
Train KM and TAC, 2008 (percentages)
Source: ŢFBH. Source: ŢRS.
272. There is a clear need to develop a unified system of infrastructure users’ charges,
taking into consideration their impact on the activities and the operator’s needs. The
infrastructure users‘ charges have to cover the marginal costs engendered by their use, as well as
making a contribution to the fixed costs of providing the infrastructure. Their basic quantities
have to be uniform to all the users of the railway infrastructure. For the determination of the size
and the mechanism of levying the infrastructure users‘ charges it is necessary to consider: (i) the
actual railway infrastructure expenditure of maintenance managers; (ii) the principles of levying
railway charges and the exceptions of levying—as defined in the EU Directive 2001/14/EC; (iii)
the possible concessions for the users of the railway infrastructure; and (iv) possible expenditure
related to the compensation for costs not uncovered, such as environmental safety, and costs
related to accidents. A 2007 study provides details of an access charge model, contract models
between the railway owners and infrastructure manager, and a specific access charge proposal for
freight and passenger services, for ŢFBH and ŢRS.123
Once again, little progress has been
forthcoming.
123
KPMG (2007), Final Report (Railways FBH): Assistance with the restructuring of the Railways of the
Federation of Bosnia and Herzegovina and Railways of Republic of Srpska, Sarajevo, December 5, 2007
38 36
2623
6771
3025
2005 2006 2007 2008
ZFBH ZRS
45.1
54.9
100
Train-km TAC
Passenger
Freight
61.058.1
39.041.9
Train-km TAC
Passenger
Freight

Railway Reform in South East Europe and Turkey: On the Right Track? Annexes
150
273. ŽFBH and ŽRS investments in rail infrastructure and rolling stock have tended to
decline over 2005-2009. Infrastructure investments have declined from Euro 36.8 million in 2005
to Euro 4.4 million in 2009—equivalent to a reduction from Euro 60,517/km to Euro 7,380/km
(Figure 83 and Figure 84). Likewise, infrastructure investments have declined from nearly Euro
20 million in 2005 to less than a million in 2008—which translates into a sharp fall of
investments per km of network. ŢFBH rolling stock investments have been more modest, but
have increased in the last three years—in 2008 credits financed the acquisition of Talgo trains and
the procurement of freight wagons, as well as the overhaul of cargo wagons, and major repairs of
electric engines. Between 2005 and 2008, rolling stock investments fluctuated from a low of zero
in 2005 to a maximum of Euro 1.4 million in 2006, declining to Euro 1 million. Planned
investments in infrastructure and rolling stock for both rail companies tend to be significantly
above realized values year after year.
Figure 83: ŢFBH – Rail Infrastructure Investments Figure 84: ŢRS – Rail Infrastructure
Investments
Source: ŢFBH. Source: ŢRS.
274. Contributions from FBH and RS for financing the entity rail companies have been
decreasing over 2005-2009. In the case of ŢFBH, revenues provided via a contract on financing
rail infrastructure maintenance and co-financing of the passenger and combined railway traffic,
rose from Euro 9.8 million in 2005-2006, to Euro 12.8 million in 2007 and Euro 14.5 million in
2008, before declining to Euro 9.9 million in 2009—a year of straightened fiscal circumstances.
As a percentage of Bosnia and Herzegovina‘s GDP, entity budget support has declined from 0.11
in 2005 to 0.08 in 2009. Entity budget support for ŢRS is much higher, at Euro 17 million in
2009, 72 percent higher than in the case of ŢFBH, and up from Euro 14.4 million in 2005—this is
equivalent to 0.14 percent of GDP in 2009, up from 0.11 percent of GDP in 2005. For both ŢFBH
and ŢRS, budget support totaled Euro 26.9 million in 2009 or 0.22 percent of GDP—a decline
compared to 0.28 percent in 2005.
and Final Report (Railways RS): Assistance with the restructuring of the Railways of the Federation of
Bosnia and Herzegovina and Railways of Republic of Srpska, Doboj, December 7, 2007.
3742
18 20
60,517
69,018
30,322
32,513
0
5
10
15
20
25
30
35
40
45
0
10,000
20,000
30,000
40,000
50,000
60,000
70,000
80,000
2005 2006 2007 2008
Inv
estm
ents
(E
uro
mil
lion
s)
Inv
estm
ent
per
km
of
rrac
k (
Eu
ros)
Investments Investments per km
19.9
5.81.3 0.6
50,740
14,014
2,610 1,394
0
5
10
15
20
25
0
10,000
20,000
30,000
40,000
50,000
60,000
2005 2006 2007 2008
Inv
estm
ents
(E
uro
mil
lion
s)
Inv
estm
ent
per
km
of
rrac
k (
Eu
ros)
Investments per km Investments

Railway Reform in South East Europe and Turkey: On the Right Track? Annexes
151
Figure 85: ŢFBH and ŢRS –Entity Budget Support
Sources: ŢFBH, ŢRS, IMF.
Figure 86: ŢFBH – Breakdown of Entity Support
to Railway (percentages)
Figure 87: ŢRS – Breakdown of Entity Support to
Railway (percentages)
Source: ŢFBH. Source: ŢRS.
275. The bulk of entity budget funds earmarked for railways are used for financing rail
infrastructure. Figure 86 for ŢFBH and Figure 87 for ŢRS present a breakdown of entity
support to the rail companies for infrastructure, passenger and freight services. In 2009, 89
percent of FBH entity funds for ŢFBH were directed at rail infrastructure, with 9 percent for
passenger services and 2 percent for freight services. In the case of ŢRS, there is no entity funded
support for freight transport, but in 2007 support for passenger services was introduced, and it
accounts for 12 percent of the total in 2008. Support for passenger transport stood at Euro 9
million in 2009 for ŢFBH and Euro 12 million for ŢRS. This is insufficient to prevent large
losses in passenger services. This suggests the need to rationalize passenger services offered in
both ŢRS and ŢFBH, taking into account reduced traffic over the last decade.
276. Priority should be given to improving the quality of service and increasing capacity,
rather than introducing higher line speeds.124
The proposed investments prioritize projects to
rehabilitate track on the key lines to meet the 22.5 ton axle load, as required by the TER
standards—improving signaling, and upgrading line speeds to 120 km/hour (Table 23). A recent
124
This section is based in part on World Bank (2010), Bosnia and Herzegovina: The Road to Europe,
Transport Sector Review, Transport Unit, Sustainable Development Department, Europe and Central Asia
Region, Report No. 54406-BH. Washington, DC, World Bank.
0.28
0.24 0.240.25
0.22
0.20
0.21
0.22
0.23
0.24
0.25
0.26
0.27
0.28
0.29
0
5
10
15
20
25
30
35
2005 2006 2007 2008 2009
ZRS Entity (Euro millions) ZFBH Entity support (Euro millions) % of GDP
84 90 92 91 89
16 10 8 7 9
0
10
20
30
40
50
60
70
80
90
100
2005 2006 2007 2008 2009
Freight Passenger Rail infrastructure
100 100
7588
2512
0
10
20
30
40
50
60
70
80
90
100
2005 2006 2007 2008
Freight Passenger Rail infrastructure

Railway Reform in South East Europe and Turkey: On the Right Track? Annexes
152
study noted that if this rehabilitation were implemented and current bottlenecks were addressed,
together with other necessary operational improvements (level crossings, signaling, and
operational practices), then the capacity of the railway network would be sufficient to meet
projected demand until 2030.125
It is important to place emphasis on the capacity of the current
network, primarily on the key lines on Corridor Vc, and the quality of service for existing
customers, before ambitious and probably unviable projects to introduce even higher line speeds,
or high speed passenger services. The latter seem difficult to defend given the current traffic mix
on the railways.
Table 23: Bosnia and Herzegovina - Recommended Railway investments 2010-2030
Source: PCI Intl. (2007).
125
DB International, Vienna Consult and via donau (2008), Provision of Studies for Intermodal Transport
in Bosnia and Herzegovina. A study funded by the European Union.
Project Cost (BAM
Mill)
Period Description
Completing rehabilitation of southern section of Corridor Vc between
Sarajevo and Gabela (Croatian border)
Total length covered by the project is 73 km (100 km of the 173 km long line
is covered by the EBRD- EIB loan).
76.2
Short - Medium
term.
The line is completely electrified and connects to the line Metković - Ploče in Croatia. The rehabilitation of the
section Čelebić – Mostar – Čapljina – Croatian border is
part of the EIB-EBRD plan. The section Bradina – Konjic, part of this proposal, has a very complex set of
tunnels and turns over a 25 km distance.
Completing rehabilitation of northern section of Corridor Vc between Samac
and Sarajevo. Total length covered by
the project is 235 km.
245.6
Medium – Long
term.
The medium term requirements to implement the project includes completing the feasibility and technical studies
and determining the further funding needs on the basis of
the available EBRD- EIB loans. The project focuses the sections not covered prior by EBRD-EIB or other
investments.
Completing Rehabilitation of Sections
Novi Grad – Doboj and Doboj – Tuzla (Line parallel to Corridor X). Total
length covered by the project is 190
km: 125 km (section 1) + 65 km (section 2).
198.6 Medium –
Long term.
The medium term requirements to implement the project
includes completing the feasibility and technical studies and determine further funding arrangements on the basis
of the available EBRD-EIB loans. The project focuses
the sections not covered by the EBRD-EIB investment.
Rehabilitation and electrification of the
railway line Brcko – Tuzla. Total length covered by the project is 75 km.
78.4 Long
term.
With the expected growth of river transport via Brcko
port, Improved railway interconnectivity linking the port with the BiH railway network and Corridor Vc will
create opportunities for intermodal transport linking river
and railway.

Railway Reform in South East Europe and Turkey: On the Right Track? Annexes
153
THE RAILWAYS OF BULGARIA
277. Following reforms in 2002, Bulgaria has two state railway undertakings, a rail
transport and an infrastructure manager company. With the entry into force of the Railway
Transport Act as of January 1 2002, the National Company Bulgarski Durzhavni Zheleznitsi
(BDZ) was restructured; rail transport was the responsibility of the Bulgarian Railway Operating
Company (BDZ EAD) and infrastructure management was the responsibility of National Railway
Infrastructure Company (NRIC). The state was the sole shareholder of both companies, through
the Ministry of Transport, Information Technologies and Communications. In 2007, BDZ EAD
was reorganized as a holding structure with three subsidiaries established as legally independent
companies along three separate lines of business: BDZ Passenger Transport, BDZ Cargo, and
BDZ Traction. The reforms have led to the entry of private freight operators, of which the most
important are Bulgaria Railway Company (BRC) and Bulmarket. Additional freight operators that
have obtained licenses include Unitranscom, Gastrade, Rail Cargo Austria AD—and in May
2010, Germany‘s DB Schenker.
278. The rail network of Bulgaria consists of 4,150 km of track, the third most extensive of
the countries included in this study. Of these, 971km are double lines and 2,833 km are
electrified—this represents a high level of electrification, at 68 percent, compared to the EU
average of 52 percent. Network density—defined as the length of the rail network divided by the
surface area of the country—is equal to 83 percent to the EU average, highlighting the relatively
large size of the network. Bulgaria is traversed by four Trans-European Transport Network
(TEN-T) rail corridors: (i) Corridor IV, which connects Bulgaria to Greece and Turkey and
northward to Romania, starting in Dresden and ending in Istanbul; (ii) Corridor IX, which
connects Bulgaria to Romania and Moldova; (iii) Corridor X, which connects Bulgaria to Serbia
and beyond to Hungary and Austria; and (iv) Corridor VIII, which connects the Black Sea
through Bulgaria and FYR Macedonia to Albania and the Adriatic sea—although there remain
missing links to Albania and FYR Macedonia (Figure 91).
Operational Performance
279. Railway traffic has declined markedly over the last decade. Combined rail and freight
traffic declined by 41 percent over 2000-2009, from 9 billion million traffic units in 2000 to 5.2
billion traffic units in 2009 (Figure 88). Compared to 2000, passenger traffic declined by 38
percent, while freight traffic declined by 43 percent. In both cases traffic volume had stagnated
preceding the international global crisis, although freight traffic volumes plunged in 2009, by 33
percent for freight transport, while passenger services fell by 8 percent.126
This reflects in part the
inability of rail transport to counteract the growing importance of road transport. In 2008, rail
represented 4 percent of passenger traffic by inland mode, measured in pass-km, down from 8
percent in 2000 (Figure 89); rail represented 20 percent of freight traffic in 2008, down from 44
percent in 2000 (Figure 90). While the declining share of rail in freight transport has been
126
One of the largest clients of BDZ Cargo, Kremikovski, which represented 20-25 percent of the volume
of goods transported went out of business as a result of the global financial crisis.
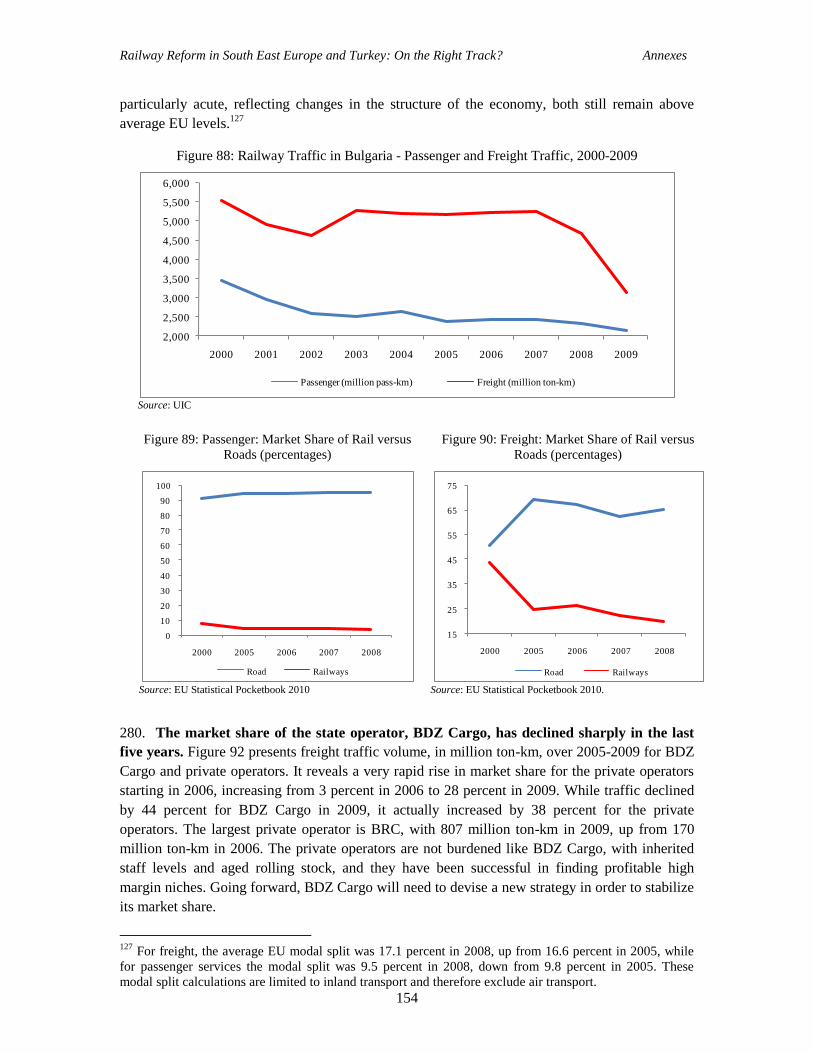
Railway Reform in South East Europe and Turkey: On the Right Track? Annexes
154
particularly acute, reflecting changes in the structure of the economy, both still remain above
average EU levels.127
Figure 88: Railway Traffic in Bulgaria - Passenger and Freight Traffic, 2000-2009
Source: UIC
Figure 89: Passenger: Market Share of Rail versus
Roads (percentages)
Figure 90: Freight: Market Share of Rail versus
Roads (percentages)
Source: EU Statistical Pocketbook 2010 Source: EU Statistical Pocketbook 2010.
280. The market share of the state operator, BDZ Cargo, has declined sharply in the last
five years. Figure 92 presents freight traffic volume, in million ton-km, over 2005-2009 for BDZ
Cargo and private operators. It reveals a very rapid rise in market share for the private operators
starting in 2006, increasing from 3 percent in 2006 to 28 percent in 2009. While traffic declined
by 44 percent for BDZ Cargo in 2009, it actually increased by 38 percent for the private
operators. The largest private operator is BRC, with 807 million ton-km in 2009, up from 170
million ton-km in 2006. The private operators are not burdened like BDZ Cargo, with inherited
staff levels and aged rolling stock, and they have been successful in finding profitable high
margin niches. Going forward, BDZ Cargo will need to devise a new strategy in order to stabilize
its market share.
127
For freight, the average EU modal split was 17.1 percent in 2008, up from 16.6 percent in 2005, while
for passenger services the modal split was 9.5 percent in 2008, down from 9.8 percent in 2005. These
modal split calculations are limited to inland transport and therefore exclude air transport.
2,000
2,500
3,000
3,500
4,000
4,500
5,000
5,500
6,000
2000 2001 2002 2003 2004 2005 2006 2007 2008 2009
Passenger (million pass-km) Freight (million ton-km)
0
10
20
30
40
50
60
70
80
90
100
2000 2005 2006 2007 2008
Road Railways
15
25
35
45
55
65
75
2000 2005 2006 2007 2008
Road Railways

Railway Reform in South East Europe and Turkey: On the Right Track? Annexes
155
Figure 91: The Rail Network of Bulgaria
Source: World Bank
Figure 92: BDZ Cargo Market Traffic and Market Share vis-à-vis Private Operators
(million ton-km and percentages)
Source: UIC.
281. Bulgaria’s rail traffic intensity declined by 30 percent over 2005-2009, reflecting
declining traffic development in the period. Rail traffic density stood at 1,276,113 traffic units
per km of network in 2009, down by 30 percent compared to 2005 (Figure 93). Traffic intensity is
being pulled down by passenger transport—passenger traffic intensity, at 516,704 traffic units per
rail route-km in 2009, was only 90 percent of the level in 2005. Rail traffic intensity was 41
0
10
20
30
40
50
60
70
80
90
100
0
1,000
2,000
3,000
4,000
5,000
6,000
2005 2006 2007 2008 2009
BDZ Private operators BDZ market share (%) Privation operators market share (%)

Railway Reform in South East Europe and Turkey: On the Right Track? Annexes
156
percent of the EU average in 2009, down from 50 percent in 2005. The intensity of overall
infrastructure use was well below EU levels, with negative financial repercussions for NRIC,
given the high fixed costs of rail infrastructure. Despite increased competition from private
freight operators, rail traffic intensity is being pulled down by passenger rail traffic intensity,
which is only 29 percent of the EU average.
282. Labor productivity in the rail sector has not improved in the last five years. Labor
productivity in the state rail companies declined by 24 percent over 2005-2009, to 171,016 traffic
units per staff, while staff levels declined by 8 percent (Figure 94). Labor productivity in BDZ
EAD has declined by 32 percent over 2005-2009, and is equal to 285,648 traffic units per staff
(Figure 95)—productivity of the private freight operator BRC at 297,786 traffic units per staff, is
only slightly higher, and has declined by 35 percent over 2007-2009, reflecting steep declines in
the rail freight transport market. Labor productivity has improved in NRIC, with the number of
staff per km of network declining from 3.77 to 3.74 over 2005-2009 (Figure 96). However, this
compares to 2.49 for Romania‘s CFR and 2.66 for Croatia Railways—not to speak of much
higher productivity levels among some Western European rail operators. Total staff levels in
NRIC, at 15,528, have declined modestly in the last five years.
283. The overall condition of the rail network in Bulgaria does not meet European
standards, and there is a significant track maintenance backlog. Out of 3,718 km of main
lines, 420 km are in need of mid-term repair and 1,843 km in need of an overhaul—60.8 percent
of the total. However, in the last ten years, investments in track renewal were made for only 185
km of the network. The rail network does not comply with EU requirements regarding speed or
axle load, and the situation has worsened due to overdue repair cycles during the last 15 to 20
years. 128
As with the track condition, the average age structure of telecommunication
installations, catenary system and signaling system is old, exceeding 30 years (Figure 99). A large
number of level crossings are secured by means of manually operated barriers and the
introduction of modern crossing is a priority. The state of rail infrastructure adversely impacts on
the technical speed of freight trains, which averaged 39.4 km/hour in 2008, and 47.2 km/hour for
passenger services.
284. The rolling stock owned by BDZ EAD is old, leading to less reliability and requiring
frequent maintenance interventions. Over 80 percent of freight wagons were acquired or
modernized over 20 years ago and there have been no major modernization and reconstruction in
recent years—although a loan signed in November 2007 aims to repair and modernized 1,200
freight wagons. There is a passenger coach fleet of 1,380—of which 47 percent were operational
in 2008. Only 4 percent are less than 10 years old, and over 50 percent are over 50 years old. As
of December 2008, the total freight wagon fleet stood at 11,812, of which only 6,834 were
operational. Over 98 percent of diesel locomotives and 62 percent of electric locomotives are
over 25 years old, of which 68 percent are operational.
128
National Railway Infrastructure Company (2009), Business Plan for 2010, Sofia, December 2009.

Railway Reform in South East Europe and Turkey: On the Right Track? Annexes
157
Figure 93: Bulgaria – Rail Traffic Intensity Figure 94: Bulgarian Rail Sector - Traffic Units
per Staff and Staff Levels
Source: UIC. Source: UIC.
Figure 95: BDZ EAD - Traffic Units per Staff and
Staff Levels
Figure 96: NRIC Staff Per KM of Track
Source: UIC. Source: UIC.
Figure 97: BRC Traffic Units per Staff and Staff
Levels
Figure 98: Bulgarian Rail Sector Compared to EU
Average, 2009 (EU=100)
Source: UIC. Source: UIC.
40%
42%
44%
46%
48%
50%
52%
54%
1,000,000
1,200,000
1,400,000
1,600,000
1,800,000
2,000,000
2005 2006 2007 2008 2009
Bulgaria % of EU average
30,000
31,000
32,000
33,000
34,000
35,000
0
50,000
100,000
150,000
200,000
250,000
2005 2006 2007 2008 2009
Traffic units/staff Staff
14,000
15,000
16,000
17,000
18,000
19,000
250,000
275,000
300,000
325,000
350,000
375,000
400,000
425,000
450,000
2005 2006 2007 2008 2009
Traffic units/staff Staff
15,400
15,600
15,800
16,000
16,200
16,400
16,600
16,800
3.50
3.60
3.70
3.80
3.90
4.00
4.10
4.20
2005 2006 2007 2008 2009
Infrastructure staff per km Staff
100
120
140
160
180
200
220
240
260
280
250,000
300,000
350,000
400,000
450,000
500,000
2007 2008 2009
Traffic units/staff Staff
29
37
30
41
41
83
Staff Productivity
Locomotive productivity
Freight productivity
Coach productivity
Traffic density
Network density

Railway Reform in South East Europe and Turkey: On the Right Track? Annexes
158
Figure 99: NRIC – Age Structure of Rail Infrastructure
Source: NRIC.
Figure 100: BDZ EAD - Age Structure of Rolling Stock
Source: BDZ EAD.
285. Rolling stock productivity of BDZ EAD is less than the EU average, and has failed to
improve over 2005-2009. Freight wagon productivity declined by 56 percent over 2005-2009,
with a particularly sharp fall in 2009 due to plunging freight traffic. However, freight wagon
productivity had been on the decline well before the international financial crisis hit in the last
quarter of 2008. Passenger and coach productivity have likewise declined over the 2005-2009,
with declines setting in before the onset of the crisis. With freight wagon and locomotive
productivity equal to only 30 percent of the EU average and coach productivity equal to 41
percent of the EU average, there is an urgent need to step up productivity.
Table 24: BDZ - Rolling Stock Productivity
Year
Freight Wagon Productivity Coach Productivity Locomotive Productivity
BDZ EU average = 100 BDZ EU average = 100 BDZ EU average = 100
2009 186,133 30 1,700,492 41 7,974,901 30
2008 331,143 44 1,692,029 42 11,347,594 41
2007 386,306 46 1,787,611 39 12,134,354 45
2006 425,750 53 1,811,518 42 13,462,676 49
2005 426,284 57 1,963,024 52 13,022,414 47 Source: BDZ EAD.
9
5
7
9
12
4
22
38
43
42
22
25
20
22
21
Signalling System
Catenary system
Telecommunication installations
< 10 years 11-20 years 21-30 years 31-40 years > 40 years
10
4
5
34
17
10
12
34
17
11
33
59
39
16
Locomotives
Passenger coaches
Freight wagons < 10 years
11-20 years
21-25 years
26-30 years
31-40 years
> 40 years

Railway Reform in South East Europe and Turkey: On the Right Track? Annexes
159
Financial performance of Bulgaria’s State Rail Companies
286. Financial performance remains weak at BDZ EAD, with continued financial losses
over the course of 2005-2009. Net income has been negative over 2005-2008—with the
exception of 2007—and overall financial performance has not improved. This has mirrored
deteriorating operational indicators, such as track intensity, rolling stock productivity, labor
productivity, and decreased traffic over the period. The working ratio, including state funds, has
worsened over 2005-2008, from 1.15 in 2005 to 1.19 in 2008, reaching 1.71 in the first quarter of
2009 (Table 25). The main form of state support for BDZ EAD is through public service
contracts for loss-making passenger services, while freight transport receives no state support.
Despite increased competition from private freight operators, BDZ Cargo was profitable
throughout 2005-2008, while BDZ Passenger is pulling down the financial performance of BDZ
EAD (Table 26), because even with passenger service contracts this subsidiary experiences
losses.
Table 25: BDZ EAD - Consolidated Financial Performance (Euro millions)
2005 2006 2007 2008
Q1 2008
2009
Q1
TOTAL REVENUE 226 243 297 55 291 58
Passenger 35 36 42 7 45 6
Tickets 133 142 139 31 140 22
Freight 152 158 186 33 159 24
Other 19 16 46 2 19 2
Total operating revenues 187 194 228 40 204 30
State operating subsidies 39 49 70 15 86 28
Passenger 39 49 70 15 86 28
Freight 0 0 0 0 0 0
TOTAL EXPENDITURE 248 258 277 63 295 64
Materials 9 11 9 2 11 2
Fuel, electricity 39 40 41 13 47 10
Salaries and allowances 65 64 80 20 91 21
Outsourcing and other services 103 104 97 19 95 19
Depreciation 18 22 26 7 33 10
Total operating expenditures 234 241 252 62 276 61
Non-operating expenditures 14 18 25 1 19 3
NET INCOME
With state contribution (21) (15) 20 (8) (4) (6)
Without state contribution (61) (64) (49) (23) (91) (34)
WORKING RATIO
With state contribution 0.95 0.90 0.76 0.84 0.89
Without state contribution 1.15 1.13 0.99 1.37 1.19 1.71 Source: BDZ EAD.
287. In 2010, BDZ EAD has experienced a liquidity crisis due to rising indebtedness, with
long-term liabilities rising from Euro 77 million in 2006 to Euro 248 million by 2009. The
last three years have been characterized by a steep drop in revenue accompanied by an inadequate
decrease in operating costs and at the same time a rise in investment spending. In 2010, BDZ
EAD and the Ministry of Transport announced a restructuring plan aimed at dealing with the

Railway Reform in South East Europe and Turkey: On the Right Track? Annexes
160
liquidity crisis, because the continuation of the existing structures and inefficiencies in the BDZ
EAD and subsidiaries create a real risk of decapitalization. The restructuring plan recognizes that
the separation of BDZ Traction as an independent company was the ―wrong policy‖, because it
created a new company that does not operate in the market and its tariffs for BDZ Cargo and
BDZ Passenger are not established through interaction with clients.
Table 26: BDZ Passenger Transport and BDZ Cargo - Financial Performance (Euro millions)
2005 2006 2007 2008
Q1 2008
2009
Q1
BDZ Passenger Transport
Total revenue 74 85 111 23 131 34
State contribution (PSC) 39 49 70 15 86 28
Total expenditure 108 117 118 27 140 36
Net income
With state contribution (34) (32) (6) (5) (8) (2)
Without state contribution (73) (81) (76) (20) (95) (29)
Working ratio
With state contribution 1.33 1.23 0.94 1.05 0.93 0.89
Without state contribution 2.82 2.93 2.50 3.32 2.71 4.73
BDZ Cargo
Total revenue 152 158 186 33 159 24
State contribution 0 0 0 0 0 0
Total expenditure 140 142 160 36 155 28
Net income 13 17 26 (3) 4 (5)
Working ratio 0.86 0.83 0.79 0.98 0.88 1.01 Source: BDZ EAD.
288. The 2010 restructuring plan foresees temporary state aid aimed at addressing the
liquidity problems faced by BDZ EAD. This will allow the company to service outstanding
loans with a state guarantee or with letters of support, for repayment of overdue liabilities to
NRIC. On December 15, 2010 the European Commission temporarily authorized state financing
of Euro 128 million for BDZ EAD under EU state aid rules, until it can take a position
concerning the restructuring plan to be submitted by the Bulgarian authorities within six months.
289. NRIC has sustained large financial losses in the last five years, despite a steep rise in
the financial contribution from the state. Annual financial losses have averaged Euro 37
million over 2005-2009, while state funding has increased fourfold from Euro 19.3 million in
2005 to Euro 79.5 million in 2009. Excluding state funding, net income losses reached Euro
105.8 million, nearly double the level in 2005. In 2009, state funds reached Euro 53 million as
current subsidies, which were used mainly for current maintenance and operations, and Euro 47
million as capital transfers. Track access charges have been declining since 2007, which has
coincided with declining traffic and the introduction of new charges as of January 1 2007—which
are considerably lower than previously. These charges are currently insufficient for NRIC to
cover its direct expenses on maintenance and repairs, hence the need for current subsidies from
the state. The cost coverage ratio has risen from 74 percent in 2005 to 84 percent in 2009, but this
has largely been as a result of increased states support. Overall, net income losses and the
working ratio improved in 2009, in a difficult context, thanks to cost controls.
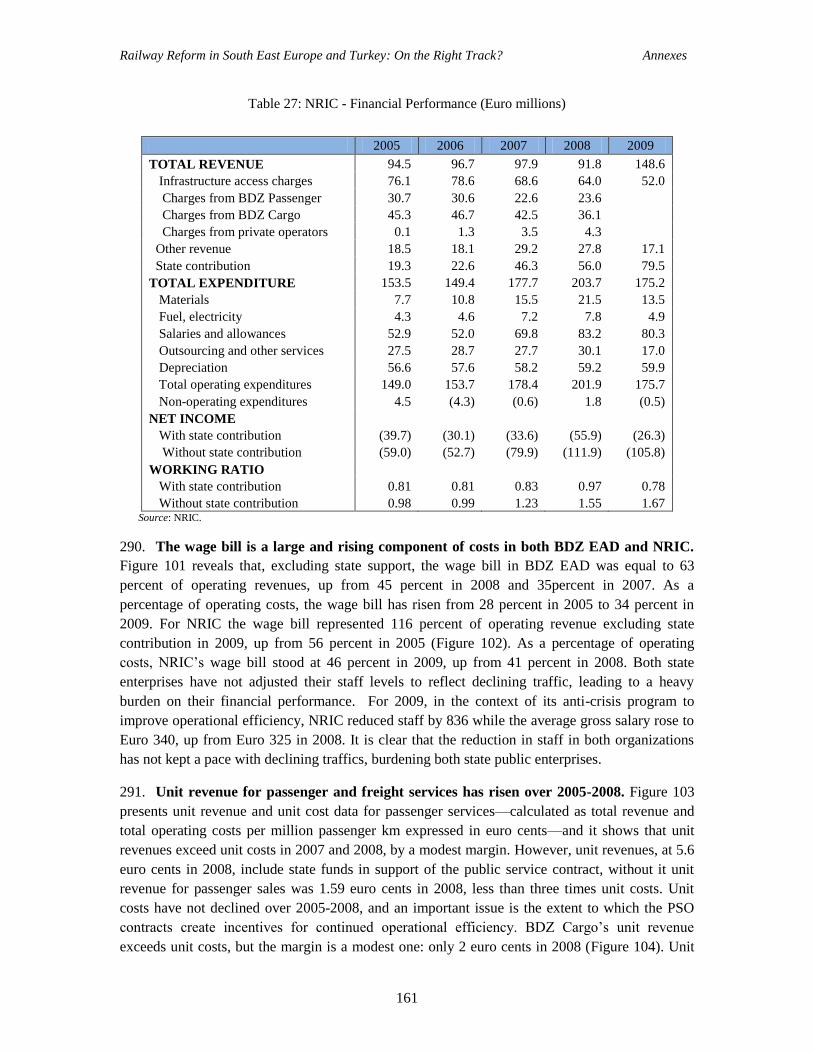
Railway Reform in South East Europe and Turkey: On the Right Track? Annexes
161
Table 27: NRIC - Financial Performance (Euro millions)
2005 2006 2007 2008 2009
TOTAL REVENUE 94.5 96.7 97.9 91.8 148.6
Infrastructure access charges 76.1 78.6 68.6 64.0 52.0
Charges from BDZ Passenger 30.7 30.6 22.6 23.6
Charges from BDZ Cargo 45.3 46.7 42.5 36.1
Charges from private operators 0.1 1.3 3.5 4.3
Other revenue 18.5 18.1 29.2 27.8 17.1
State contribution 19.3 22.6 46.3 56.0 79.5
TOTAL EXPENDITURE 153.5 149.4 177.7 203.7 175.2
Materials 7.7 10.8 15.5 21.5 13.5
Fuel, electricity 4.3 4.6 7.2 7.8 4.9
Salaries and allowances 52.9 52.0 69.8 83.2 80.3
Outsourcing and other services 27.5 28.7 27.7 30.1 17.0
Depreciation 56.6 57.6 58.2 59.2 59.9
Total operating expenditures 149.0 153.7 178.4 201.9 175.7
Non-operating expenditures 4.5 (4.3) (0.6) 1.8 (0.5)
NET INCOME
With state contribution (39.7) (30.1) (33.6) (55.9) (26.3)
Without state contribution (59.0) (52.7) (79.9) (111.9) (105.8)
WORKING RATIO
With state contribution 0.81 0.81 0.83 0.97 0.78
Without state contribution 0.98 0.99 1.23 1.55 1.67 Source: NRIC.
290. The wage bill is a large and rising component of costs in both BDZ EAD and NRIC.
Figure 101 reveals that, excluding state support, the wage bill in BDZ EAD was equal to 63
percent of operating revenues, up from 45 percent in 2008 and 35percent in 2007. As a
percentage of operating costs, the wage bill has risen from 28 percent in 2005 to 34 percent in
2009. For NRIC the wage bill represented 116 percent of operating revenue excluding state
contribution in 2009, up from 56 percent in 2005 (Figure 102). As a percentage of operating
costs, NRIC‘s wage bill stood at 46 percent in 2009, up from 41 percent in 2008. Both state
enterprises have not adjusted their staff levels to reflect declining traffic, leading to a heavy
burden on their financial performance. For 2009, in the context of its anti-crisis program to
improve operational efficiency, NRIC reduced staff by 836 while the average gross salary rose to
Euro 340, up from Euro 325 in 2008. It is clear that the reduction in staff in both organizations
has not kept a pace with declining traffics, burdening both state public enterprises.
291. Unit revenue for passenger and freight services has risen over 2005-2008. Figure 103
presents unit revenue and unit cost data for passenger services—calculated as total revenue and
total operating costs per million passenger km expressed in euro cents—and it shows that unit
revenues exceed unit costs in 2007 and 2008, by a modest margin. However, unit revenues, at 5.6
euro cents in 2008, include state funds in support of the public service contract, without it unit
revenue for passenger sales was 1.59 euro cents in 2008, less than three times unit costs. Unit
costs have not declined over 2005-2008, and an important issue is the extent to which the PSO
contracts create incentives for continued operational efficiency. BDZ Cargo‘s unit revenue
exceeds unit costs, but the margin is a modest one: only 2 euro cents in 2008 (Figure 104). Unit

Railway Reform in South East Europe and Turkey: On the Right Track? Annexes
162
operating costs have been rising, a concomitant to declining traffic volume and insufficient
measures aimed at increasing margins.
Figure 101: BDZ EAD – Wage Bill Indicators
Figure 102: NRIC – Wage Bill Indicators
Source: BDZ EAD. Source: NRIC.
292. Track access charges (TAC) represent 35 percent of NRIC’s total revenues in 2009—
down from 67 percent in 2005. Revenues from TAC have been on the decline since the
introduction of lower changes, and equaled Euro 101 million in 2009. Using 2008 data, Figure
105 presents the share of traffic in train-km between passenger and freight services and the
breakdown of TAC between passenger and freight services of BDZ EAD. Although passenger
traffic accounts for 69 percent of the total, it contributes only 36.9 percent of TAC revenue,
suggesting cross-subsidization is taking place between passenger and freight transport. BDZ EAD
Average TAC per train-km was equal to 0.98 euro cents for passenger transport and 3.35 euro
cents for freight transport, which suggest significant cross-subsidies to passenger transport. Given
that passenger trains use the bulk of Bulgaria‘s rail lines and need higher speeds than freight, this
would suggest that the tariff for passenger services is on the low side.
Figure 103: BDZ Passenger – Average Revenue
and Cost per Passenger Unit (Euro cents/pass-km)
Figure 104: BDZ Cargo – Average Revenue and
Cost per Freight Unit (Euro cents/ton-km)
Source: BDZ EAD. Source: BDZ EAD.
2827
3233 34
3533
35
45
63
2926 27
31
38
25
30
35
40
45
50
55
60
65
2005 2006 2007 2008 2009
% of operating costs
% of operating revenue (excl PSC)
% of total revenue
35 3439 41
46
56 54
71
91
116
46 4448
56 54
0
20
40
60
80
100
120
2005 2006 2007 2008 2009
% of operating costs
% of operating revenue (excl state contribution)
% of total revenue
3.1 3.1
4.6
5.6
4.2 4.3 4.3
5.3
2005 2006 2007 2008
Unit total revenue Unit operating cost
2.9 3.0
3.9 4.0
2.6 2.6
3.1
3.8
2005 2006 2007 2008
Unit total revenue Unit operating cost
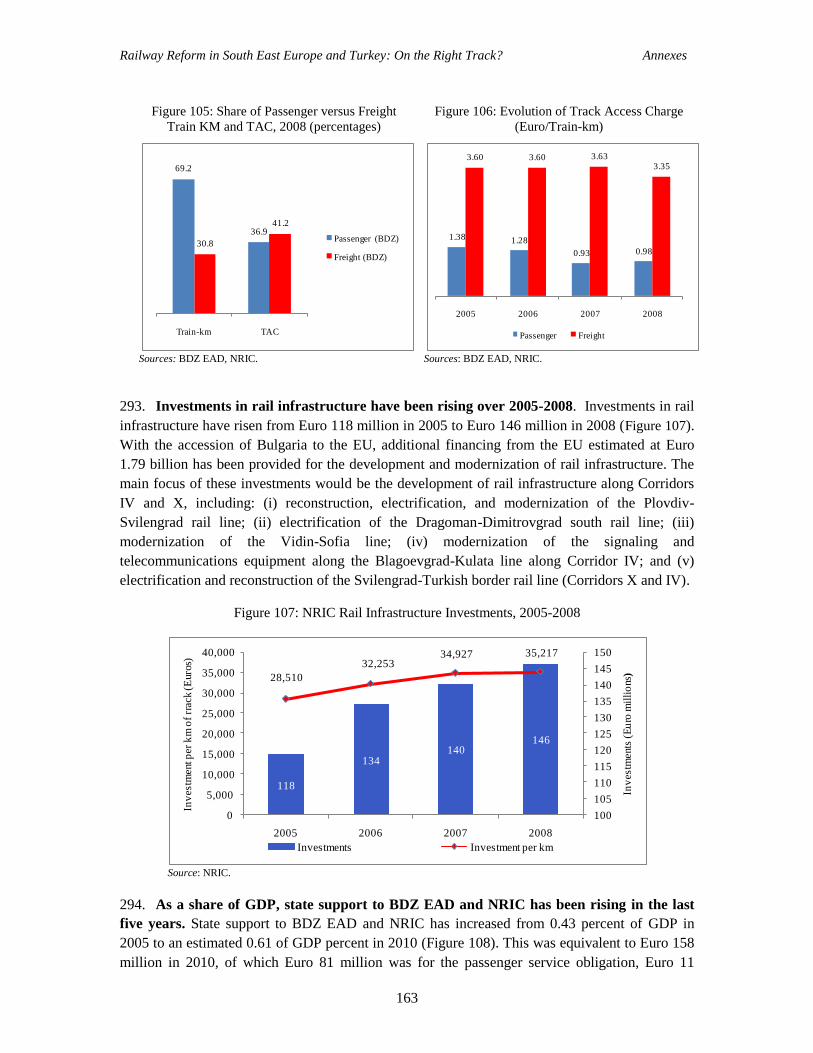
Railway Reform in South East Europe and Turkey: On the Right Track? Annexes
163
Figure 105: Share of Passenger versus Freight
Train KM and TAC, 2008 (percentages)
Figure 106: Evolution of Track Access Charge
(Euro/Train-km)
Sources: BDZ EAD, NRIC. Sources: BDZ EAD, NRIC.
293. Investments in rail infrastructure have been rising over 2005-2008. Investments in rail
infrastructure have risen from Euro 118 million in 2005 to Euro 146 million in 2008 (Figure 107).
With the accession of Bulgaria to the EU, additional financing from the EU estimated at Euro
1.79 billion has been provided for the development and modernization of rail infrastructure. The
main focus of these investments would be the development of rail infrastructure along Corridors
IV and X, including: (i) reconstruction, electrification, and modernization of the Plovdiv-
Svilengrad rail line; (ii) electrification of the Dragoman-Dimitrovgrad south rail line; (iii)
modernization of the Vidin-Sofia line; (iv) modernization of the signaling and
telecommunications equipment along the Blagoevgrad-Kulata line along Corridor IV; and (v)
electrification and reconstruction of the Svilengrad-Turkish border rail line (Corridors X and IV).
Figure 107: NRIC Rail Infrastructure Investments, 2005-2008
Source: NRIC.
294. As a share of GDP, state support to BDZ EAD and NRIC has been rising in the last
five years. State support to BDZ EAD and NRIC has increased from 0.43 percent of GDP in
2005 to an estimated 0.61 of GDP percent in 2010 (Figure 108). This was equivalent to Euro 158
million in 2010, of which Euro 81 million was for the passenger service obligation, Euro 11
69.2
36.9
30.8
41.2
Train-km TAC
Passenger (BDZ)
Freight (BDZ)
1.38 1.28
0.93 0.98
3.60 3.60 3.633.35
2005 2006 2007 2008
Passenger Freight
118
134140
146
28,510
32,25334,927 35,217
100
105
110
115
120
125
130
135
140
145
150
0
5,000
10,000
15,000
20,000
25,000
30,000
35,000
40,000
2005 2006 2007 2008
Inv
estm
ents
(E
uro
mil
lio
ns)
Inv
estm
ent p
er k
m o
f rr
ack (
Euro
s)
Investments Investment per km

Railway Reform in South East Europe and Turkey: On the Right Track? Annexes
164
million for subsidizing passenger tickets, and Euro 10 million for BDZ EAD‘s capital
investments, with the remainder for NRIC—Euro 65 million of operating subsidies and Euro 46
million of capital grants, with funds to NRIC equal to 52 percent of total state support to the rail
sector (Figure 109). The sharp rise in support to the rail sector reflects a doubling of state support
to BDZ EAD over 2005-2010 in a context of declining passenger traffic (Figure 110), and a
modest rise in state support for infrastructure investments (Figure 111). Given the financial
difficulties experienced by BDZ EAD in 2010, state aid to the rail sector is expected to rise in
2011, although it is expected to be short-term in nature, in line with EU rules on state aid.
Figure 108: State Support to BDZ EAD and
NRIC, 2005-2010 (in units indicated)
Figure 109: State Support to BDZ EAD and NRIC
in 2010 (percentages)
Note: 2010 is based on GDP estimates and not actuals. Sources: BDZ EAD, NRIC, IMF, World Bank estimates.
Sources: BDZ EAD, NRIC.
Figure 110: Passenger PSO, 2005-2009 (in units
indicated)
Figure 111: State Support to NRIC 2007-2010 (in
units indicated)
Sources: BDZ EAD, UIC. Sources: NRIC, UIC.
0.430.41
0.50
0.52
0.60 0.61
0.20
0.25
0.30
0.35
0.40
0.45
0.50
0.55
0.60
0.65
0
50
100
150
200
250
2005 2006 2007 2008 2009 2010
State contribution (Euro millions)
% of GDP
Passenger PSO
38%
Subsidized tickets
5%
BDZ EAD
capital
grants
5%
NRIC operating
subsidies
30%
NRIC capital
grants
22%
0.0160.020
0.026
0.033
0.041
0.015
0.020
0.025
0.030
0.035
0.040
0.045
0
10
20
30
40
50
60
70
80
90
100
2005 2006 2007 2008 2009
Passenger PSO (Euro millions)
Per pass km (euro cents)
44
58
4746
0.011
0.014
0.011 0.011
0.010
0.011
0.011
0.012
0.012
0.013
0.013
0.014
0.014
0.015
40
42
44
46
48
50
52
54
56
58
60
2007 2008 2009 2010
Infrastructure grants(Euro millions)
Per track km (euro cents)

Railway Reform in South East Europe and Turkey: On the Right Track? Annexes
165
CROATIAN RAILWAYS
295. Croatian Railways (Hrvatske Željeznice; HŽ) is the national railway company of
Croatia formed in 1991 after the dissolution of Yugoslavia. The company has gone through
several organizational changes, and is divided into five companies: HŢ Holding, HŢ Passenger
Transport, HŢ Cargo, HŢ Infrastructure, and HŢ Traction. Croatian Railways is still in a
transition period—the process of restructuring and privatization of parts remains incomplete, in
the absence of a clear strategy on the railway‘s future. Croatian Railways (HŢ) is one of the larger
carriers in South East Europe, but it remains a small railway by European standards. A number of
European railways based in countries with similar population levels—all the Baltic countries,
Finland, the Slovak Republic—carry much greater volumes of traffic.
296. The Croatian rail network consists of 2,723 km of track, of which 254 km is double
lines, and 985 km is electrified. There are several important railway lines, coming from Slovenia
to Dobova via Zagreb, Slavonski Brod, and to Tovarnik, from Zagreb to Osijek, from Zagreb to
Rjeka, from Zagreb to Split, from Zagreb to Split, as well as other routes to Slovenia, Hungary,
Bosnia and Herzegovina, and Serbia. Many important routes are not electrified, are single track,
and have high grades and meandering sections, which contributes to maintaining low speeds. The
most important line is the Dobova-Tovarnik line, which is part of the Pan-European rail Corridor
X—it is fully electrified and consists for the most part of double lines, and is the busiest line
(Figure 115). The Ogulin-Knin line connects Zagreb to Split and has been upgraded to remove
sharp bends and grades in order to allow tilting trains to travel at nearly full speed. Pan-European
rail corridor Vb enters Croatia in Botovo and runs to Zagreb, while Corridor Vc runs north to
south within Croatia and is being modernized to service the port of Ploče.
Operational Performance129
297. In the last decade, rail traffic in Croatia, measured in million traffic units, rose by
40.7 percent, from 3,180 million traffic units in 2000 to 4,476 traffic units in 2009. Freight
operations was more dynamic, with a much higher growth rate over 2000-2007—before the
impact of the international financial crisis on freight volumes in 2008 and 2009 (Figure 112). In
2009, freight traffic stood at 2,641 million ton-km, a 37 percent decline compared to 2008.
Passenger volumes were largely flat over 2000-2005, before rising in 2006-2008 and then
declining in 2009 to 1,835 million passenger km. Passenger traffic accounts for 41 percent of
total rail traffic in Croatia, but the average distance traveled is very short, depressing operating
efficiency and profitability. The overall level of passenger-kilometers is fairly steady, although
the share of railways in overall passenger transport continued to decline.
129
This section is partly based on an update of the analysis contained in chapter 3 of the World Bank
(2008), Restructuring Public Finance to Sustain Growth and Improve Public Services: A Public Finance
Review. Poverty Reduction and Economic Management Unit, Europe and Central Asia Region. Report No.
37321-HR.

Railway Reform in South East Europe and Turkey: On the Right Track? Annexes
166
Figure 112: Croatian Railways Traffic, 2000-2009
Source: UIC.
298. Rail traffic intensity rose from 41 percent to 53 percent of the EU average over 2005-
2009. In 2009, traffic intensity in Croatia stood at 1,643,775 traffic units per rail route-km—
nearly double the traffic intensity in Serbia. Having peaked at 1,904,849 in 2007, before being
adversely affected by the impact of the international financial crisis from the last quarter of 2008,
rail traffic intensity rose by 26.6 percent over 2005-2007 (Figure 113). Traffic intensity is being
pulled down by passenger services: in 2009, freight traffic intensity, at 969,886 traffic units per
rail route-km, was equal to 75 percent of the EU average, Nevertheless, the intensity of overall
infrastructure usage remains below the EU average, with negative financial repercussions given
the high fixed costs of rail infrastructure.
Figure 113: Croatia – Rail Traffic Intensity, 2005-
2009
Figure 114: Croatia - Traffic Units per Staff and
Staff Levels
Source: UIC. Source: UIC.
1,000
1,500
2,000
2,500
3,000
3,500
4,000
2000 2001 2002 2003 2004 2005 2006 2007 2008 2009
Passenger (million pass-km) Freight (million ton-km)
40%
42%
44%
46%
48%
50%
52%
54%
1,400,000
1,500,000
1,600,000
1,700,000
1,800,000
1,900,000
2,000,000
2005 2006 2007 2008 2009
Croatia % of EU average
12,600
12,800
13,000
13,200
13,400
13,600
13,800
14,000
14,200
14,400
250,000
270,000
290,000
310,000
330,000
350,000
370,000
390,000
410,000
2005 2006 2007 2008 2009
Traffic units/staff Staff

Railway Reform in South East Europe and Turkey: On the Right Track? Annexes
167
Figure 115: The Rail Network of Croatia
Source: World Bank.
299. Despite recent investments, there is a significant maintenance backlog in rail
substructure and superstructure. There have been major infrastructure improvements over the

Railway Reform in South East Europe and Turkey: On the Right Track? Annexes
168
last decade sections where the speed limit has been raised to 120km/hour and 160 km/hour, up
from 80 km/hour, with maximum speeds on the Zagreb-Novska-Vinkovci line. In the last ten
years, 756 km or a quarter of the network has benefited from track renewal, although a roughly
equal amount of track has not been rehabilitated in the last 30 years or earlier. It is estimated that
in 2009 about 80.7 percent of the track suffers from speed restrictions, which is slightly less than
5 years earlier, when the figure was 81.3 percent, indicating that there is a significant backlog of
track maintenance and rehabilitation. Figure 116 reveals that over 40 percent of the
telecommunications installations, the catenary system, and the relay/interlocking system are over
thirty years old, while 40 percent of the signaling system is over 20 years old.
Figure 116: Croatian Railways – Age Structure of Rail Infrastructure
Source: Croatian Railways.
300. As with the rail infrastructure, the rolling stock of Croatian Railways is quite aged. In
2009, Croatian Railways‘ rolling stock and motive power consisted of 253 traction units, 523
passenger coaches, and 6,644 freight wagons. This exceeds the requirements posed by current
traffic levels, and the rolling stock is generally old and not well matched to market needs (Figure
117). In 2004, eight modern tilting trains from the German branch of Bombardier Transportation
were delivered to Croatian Railways, and these have been mainly deployed on the mountainous
route between Zagreb and Split—reducing travel time from 8 hours to 5 1/2 hours. These are the
only new passenger coaches acquired over the last decade.
Figure 117: Croatian Railways - Age Structure of Rolling Stock
Source: Croatian Railways.
301. Rolling stock productivity is less than the EU average, but has improved over 2005-
2009. Freight wagon productivity increased by 28.8 percent over 2005-2008, attaining 66 percent
5
28
5
15
4
5
40
30
19
25
35
50
44
40
5
20
5
25
Signalling System
Relay/interlocking sytem
Catenary system
Telecommunication installations
< 10 years 11-20 years 21-30 years 31-40 years > 40 years
2
12
3
1
7
26
5
32
32
32
38
24
42
20
15
7
Locomotives
Passenger coaches
Freight wagons < 10 years
11-20 years
21-25 years
26-30 years
31-40 years
> 40 years

Railway Reform in South East Europe and Turkey: On the Right Track? Annexes
169
of the EU average, before declining in 2009 due to the 37 percent decline in freight traffic,
measured in ton-km. Likewise, coach productivity rose over 2005-2008 by nearly 38.7 percent,
before declining by 10 percent in 2009. This represents significant progress over the last five
years, as coach productivity was equal to 85 percent of the EU average in 2009, up from 58
percent in 2005. Locomotive productivity has also risen throughout 2005-2009, from 14.8 million
traffic units per locomotive to 17.7 million in 2009—this represents a rise from 54 percent to 68
percent of the EU average. Although higher than many other countries in the Western Balkans,
convergence with the EU is proceeding slowly.
Table 28: Croatian Railways - Rolling Stock Productivity
Year
Freight Wagon Productivity Coach Productivity Locomotive Productivity
Croatia EU average = 100 Croatia EU average = 100 Croatia EU average = 100
2009 397,502 64 3,508,604 85 17,691,700 68
2008 499,397 66 3,181,019 80 20,325,397 73
2007 527,061 63 2,918,478 64 21,250,000 74
2006 485,102 60 2,385,289 55 16,970,909 62
2005 386,767 51 2,186,528 58 14,751,799 54
Source: UIC.
302. Labor productivity, as measured by the number of traffic units per employee of
Croatian Railways rose over 2005-2009, but remains markedly below EU levels. Labor
productivity has risen from 289,782 traffic units per employee, equal to 42.7 percent of the EU
average, to 346,145 traffic units per employee, or 58 percent of the EU average (Table 28).
Labor productivity rose over 2005-2007, reflecting, in part, declining staff levels, which were
reduced from 19,462 in 2000 to14,152 in 2005 and 12,931 in 2009; over 2005-2009 this
represents a 9 percent decline in staffing levels. These figures indicate that in spite of the obtained
improvements, productivity remains below the level necessary to compete successfully in a free
transportation market. There are only two ways to improve the staff productivity, as for every
railway: staff reductions or volume increases. Turning to infrastructure staff productivity,
measured as the total staff divided by the length of the network, this has worsened over 2005-
2008—staff levels have risen from 6,641 from 7,263—from 2.4 to 2.7 staff per km.
303. On October 2007 a Railway Fund was created, which provides legal protection for railway
employees, and new criteria were established to assess the number of staff that can be made
redundant due to new technologies. Croatian Railway employees cannot be declared redundant
unless previously agreed criteria are in place—offering workers from a potential surplus list the
option to take a retirement indemnity or to transfer it to the Railway Fund, which is financed from
the national budget. The director of human resources of Croatian Railways Holding and the
Organization Fund Advisory Board, comprised of union representatives, have the authority to
manage the fund—without the Organization Fund Advisory Board approval, none of the five
railway companies has the right to employ staff. These changes have made retrenchment more
difficult. The strength of Croatian railway unions explains in part the disparity of the wage level
vis-à-vis the education profile of staff, which has been further widened by additional benefits
such as bonuses, high severance payments, long layoff notice periods, working conditions, all of

Railway Reform in South East Europe and Turkey: On the Right Track? Annexes
170
which prevent rejuvenation and upgrading of the staff profile. Bonuses add over 30 percent to the
basic wage bill, while working conditions reduce the productivity of railways.130
Financial Performance and Investment Plans of Croatian Railways
304. Financial performance remains weak at Croatian Railways. Net income has been
positive over 2005-2008, but just barely, with net income of Euro 2 million in 2008. Despite
improvements in a number of key indicators, such as track intensity, rolling stock productivity,
labor productivity, and increased traffic over the period, this has not translated into stronger
financial results—suggesting that incentives to reduce costs and improve financial performance
may be weak, given the large funds provided by the state budget. The working ratio, (including
state funds) has worsened from 0.70 in 2005 to 0.78 in 2008, reaching 0.8 in the first quarter of
2009. Excluding state funds, financial losses reached Euro 194 million in 2008, down from Euro
241 million in 2005. The working ratio, excluding state contributions, remains unsatisfactory, at
1.26 in 2008.
Table 29: Croatian Railways Holding: Financial Performance (Euro millions)
2005 2006 2007 2008
Q1 2008
2009
Q1
TOTAL REVENUE 526 528 516 111 522 107
Passenger 133 120 129 30 137 29
Tickets 42 46 50 12 54 12
PSC 67 57 55 14 55 10
Freight 121 128 149 33 150 33
Other 25 48 48 4 38 4
Total operating revenues 279 296 325 67 326 66
State operating subsidies 248 233 191 44 196 41
Passenger 21 23 3 0 1 1
Freight 19 21 4 0 1 1
Infrastructure 208 189 184 44 195 39
TOTAL EXPENDITURE 520 526 510 112 520 114
Materials 19 20 16 3 25 6
Fuel, electricity 40 44 46 7 52 10
Salaries and allowances 212 211 210 59 245 55
Outsourcing and other services 96 101 97 18 88 16
Depreciation 54 58 35 9 37 16
Total operating expenditures 422 435 404 95 446 102
Non-operating expenditures 98 92 106 16 74 12
NET INCOME
With state contribution 7 2 6 (0) 2 (6)
Without state contribution (241) (230) (185) (45) (194) (48)
WORKING RATIO
With state contribution 0.70 0.71 0.71 0.78 0.78 0.80
Without state contribution 1.32 1.27 1.13 1.29 1.26 1.31 Sources: Croatian Railways, World Bank.
305. Staff retrenchment, which started at the beginning of the decade, is proceeding
slowly—and wage bill indicators have not improved in recent years. Some of the early staff
130
For example, an engine driver that spent four hours driving a train cannot then return it to the point of
origin as that would exceed his working hour limit)

Railway Reform in South East Europe and Turkey: On the Right Track? Annexes
171
retrenchment was achieved through the separation of subsidiaries. However, because subsidiaries
remained the sole suppliers to Croatian Railways, the unit operating costs did not decrease as
much as it could be expected. Staff has declined modestly in the last few years, declining by 441
in 2009, and averaging 761 over 2000-2008. For faster restructuring, retrenchment will need to be
increased significantly. This explains why productivity measures, such as staff per km of track,
have improved only marginally. As Figure 118 illustrates, the wage bill is equal to 55 percent of
operating costs and 75 percent of operating revenues (excluding state contributions) in 2008.
Figure 118: Croatian Railways Holding -Wage Bill Indicators
Source: Croatian Railways.
306. The wage bill is particularly high, even when compared to railway companies in the
region, and these numbers have not improved over 2005-2008. Clearly, the size of the work
force and the overall wage bill are important impediments to improvement in the financial
performance of the five Croatian Railways companies. The average salary (including
supplements) in Croatian Railways has risen significantly over 2005-2009, and in particular in
2008 when the average salary rose by 16 percent—in a year when average annual inflation was
only 6.1 percent—bringing the average salary to Euro 1,151 in 2009. Over 2005-2009, the
average annual salaries rose by 25.7 percent during this period, while inflation during that period
was 15.3 percent—explaining in part the difficulty of reducing the wage bill as a share of
operating costs at a time of falling staff levels.
307. Unit revenue for passenger services has fallen over 2005-2008.131
Figure 119 presents
unit revenue and unit cost data for passenger services, and it shows that unit revenues exceed unit
costs by a wide margin. However, unit revenues, at 10.8 euro cents in 2008, include the passenger
service obligation and state support. State operating support has declined from 1.65 euro cents in
2005 to 0.06 euro cents in 2008, as passenger traffic has risen much more rapidly than state funds.
If state funds are excluded, unit passenger revenues are 3 euro cents in 2008, down from 3.3 euro
cents in 2005, and less than half of unit costs. There has been progress, as unit passenger transport
revenue in 2008 is a higher share of unit costs than in 2005—from 33.8 percent in 2005 to 43.4
percent by 2008. As with other countries which have a PSO, an important issue is the extent to
which the PSO contracts create incentives for continued operational efficiency.
131
This is not an exchange rate effect.
50 4852
55
7671
65
75
40 40 41
47
0
10
20
30
40
50
60
70
80
90
2005 2006 2007 2008
% of operating costs % of operating revenue (excl state contribution) % of total revenue

Railway Reform in South East Europe and Turkey: On the Right Track? Annexes
172
Table 30: Financial Performance of Croatian Railways Passengers, Croatian Railways Cargo, and
Croatian Railways Infrastructure (Euro millions)
2005 2006 2007
2008
Q1 2008
2009
Q1
Passenger
Total revenue 154 143 188 44 196 44
Total operating revenue 66 64 131 31 139 33
State contribution (excl PSC) 21 23 3 0 1 1
Total expenditure 154 148 130 27 138 31
Wages and salaries 42 46 50 12 54 12
Infrastructure cost 0 0 1 0 5 0
Percentage wages in expenditure 27.3 31.0 38.8 43.5 38.9 39.1
Working ratio (with state contribution) 0.90 0.92 0.61 0.54 0.62 0.54
Working ratio (no state contribution) 1.04 1.10 0.62 0.54 0.62 0.55
Cargo
Total revenue 139 148 212 47 210 46
Total operating revenue 120 127 207 47 208 46
State contribution 19 21 4 0 1 1
Total expenditures 159 163 153 31 159 36
Wages and salaries 60 60 59 16 68 15
Infrastructure cost 0 0 8 0 40 0
Percentage wages in expenditure 37.5 37.0 38.6 52.4 42.4 41.9
Working ratio (with state contribution) 1.05 1.01 0.66 0.57 0.69 0.62
Working ratio (no state contribution) 1.22 1.17 0.67 0.57 0.69 0.64
Infrastructure
Total revenue 233 237 231 49 233 43
Total operating revenue 25 48 48 4 38 4
State contribution 208 189 184 44 195 39
Total expenditure 207 215 229 53 233 47
Wages and salaries 105 105 112 31 130 30
Infrastructure cost 0 0 0 0 0 0
Percentage wages in expenditure 50.7 48.6 48.7 58.2 55.7 64.2
Working ratio (with state contribution) 0.77 0.79 0.96 1.08 0.98 1.05
Working ratio (no state contribution) 7.25 3.91 4.65 12.50 5.94 11.82 Source: Croatian Railways.
308. Unit revenue for freight services per net ton km have increased over 2005-2008. Unit
freight rose from 4.9 euro cents per ton-km in 2005 to 6.3 euro cents per ton-km in 2008 (Figure
120). This is twice the figure for unit revenue for passenger services—excluding state funds. Unit
costs had been declining over 2005-2007, before rising in 2008, to 4.3 euro cents. This can be
explained by a decline in freight traffic in 2008, as well as large increases in average salaries,
which constituted 47.5 percent of freight operating costs. In 2008, freight transport revenue
reached Euro 120 million, while total expenses were Euro 159 million. Overall, in 2007 and 2008
the gap between freight unit revenues and unit costs widened, which is a positive trend.

Railway Reform in South East Europe and Turkey: On the Right Track? Annexes
173
Figure 119: Croatian Railways –Average Revenue
and Cost per Passenger Unit (Euro cents/pass-km)
Figure 120:Croatia Railways- Average Revenue
and Cost per Freight Unit (Euro cents/ton-km)
Source: Croatian Railways. Source: Croatian Railways.
309. The separation of Croatian Railways Holding into independent companies creates a
framework for measuring financial performance by line of business. As the rail activities of
each of the four companies—HŢ Passenger, HŢ Cargo, HŢ Infrastructure, and HŢ Traction—are
different, the analysis of the consolidated balance sheet hides important differences. Although
there are differences between the structure of the consolidated income statement of HŢ Holding
and those of each company, Table 30 presents information for HŢ Passenger, HŢ Cargo, and HŢ
Infrastructure. One of the first things that stands out is that share of wages in total expenditures
varies considerably: in 2008 this was equal to 38.9 percent for HŢ Passenger, 42.4 percent for HŢ
Cargo, and 55.7 percent for HŢ Infrastructure. The wage bill has been rising for all three
companies and is particularly high for HŢ Infrastructure, whose average salaries are higher than
for HŢ Passenger and HŢ Cargo. More importantly, excluding state funds, HŢ Infrastructure has
a working ratio of 5.94 in 2008, making it highly dependent on funds from the government. This
is not unusual, but it is important to ensure that conditions are such that there are incentives for
HŢ Infrastructure to reduce costs.
310. Track access charges (TAC) represent a small fraction of HŽ Infrastructure’s
revenues. Introduced in 2007, revenues from passenger TAC reached Euro 5 million and Euro 40
million for freight in 2008, up from Euro 1 million the previous year. This is less than 5 percent
of total revenues, which is the lowest for any of the countries included in this study in which a
TAC regime is in place. Using 2008 data, Figure 121 presents the share of traffic between
passenger and freight services and the share that HŢ Passenger and HŢ Cargo each pays of TAC.
Although passenger traffic accounts for 35.3 percent of the total, it contributes 49.9 percent of
TAC revenue—suggesting that there is a need to review the annual lump-sum access charge paid
by HŢ Passenger.
12.1
10.5
11.710.8
9.89.1
6.9 6.9
2005 2006 2007 2008
Unit total revenue Unit operating cost
4.94.5
5.96.3
4.44.1
3.6
4.3
2005 2006 2007 2008
Unit total revenue Unit operating cost
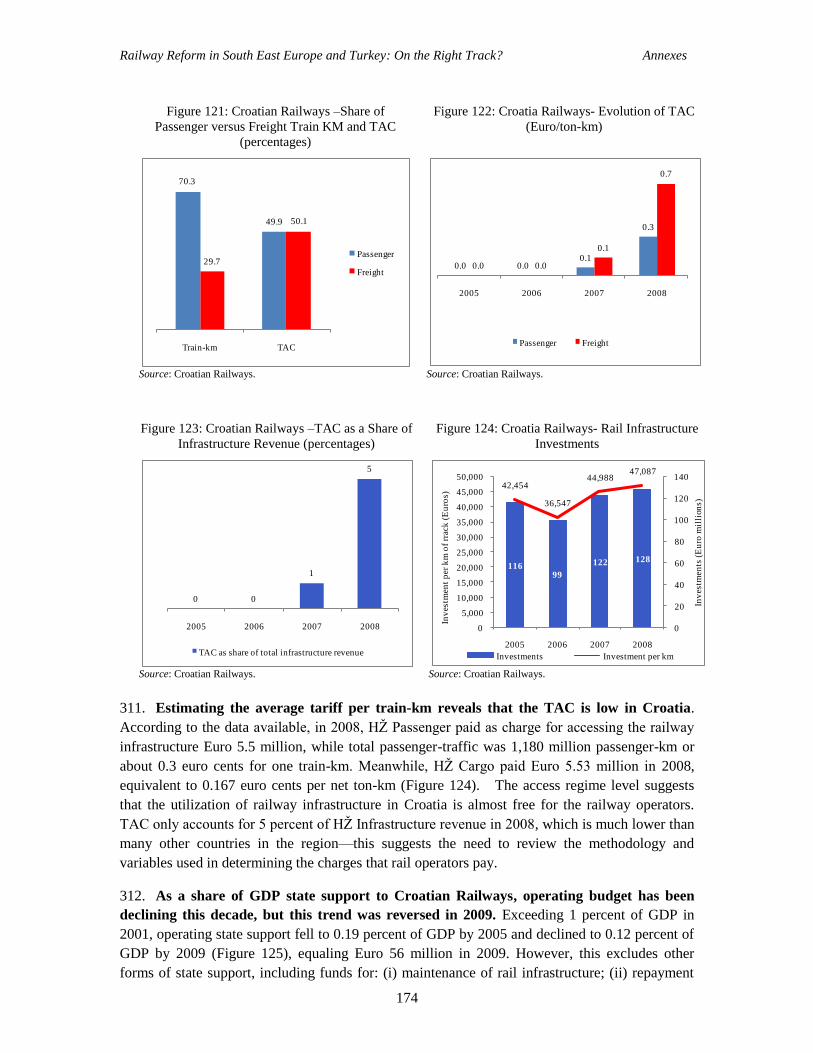
Railway Reform in South East Europe and Turkey: On the Right Track? Annexes
174
Figure 121: Croatian Railways –Share of
Passenger versus Freight Train KM and TAC
(percentages)
Figure 122: Croatia Railways- Evolution of TAC
(Euro/ton-km)
Source: Croatian Railways. Source: Croatian Railways.
Figure 123: Croatian Railways –TAC as a Share of
Infrastructure Revenue (percentages)
Figure 124: Croatia Railways- Rail Infrastructure
Investments
Source: Croatian Railways. Source: Croatian Railways.
311. Estimating the average tariff per train-km reveals that the TAC is low in Croatia.
According to the data available, in 2008, HŢ Passenger paid as charge for accessing the railway
infrastructure Euro 5.5 million, while total passenger-traffic was 1,180 million passenger-km or
about 0.3 euro cents for one train-km. Meanwhile, HŢ Cargo paid Euro 5.53 million in 2008,
equivalent to 0.167 euro cents per net ton-km (Figure 124). The access regime level suggests
that the utilization of railway infrastructure in Croatia is almost free for the railway operators.
TAC only accounts for 5 percent of HŢ Infrastructure revenue in 2008, which is much lower than
many other countries in the region—this suggests the need to review the methodology and
variables used in determining the charges that rail operators pay.
312. As a share of GDP state support to Croatian Railways, operating budget has been
declining this decade, but this trend was reversed in 2009. Exceeding 1 percent of GDP in
2001, operating state support fell to 0.19 percent of GDP by 2005 and declined to 0.12 percent of
GDP by 2009 (Figure 125), equaling Euro 56 million in 2009. However, this excludes other
forms of state support, including funds for: (i) maintenance of rail infrastructure; (ii) repayment
70.3
49.9
29.7
50.1
Train-km TAC
Passenger
Freight 0.0 0.0
0.1
0.3
0.0 0.0
0.1
0.7
2005 2006 2007 2008
Passenger Freight
0 0
1
5
2005 2006 2007 2008
TAC as share of total infrastructure revenue
11699
122 128
42,454
36,547
44,98847,087
0
20
40
60
80
100
120
140
0
5,000
10,000
15,000
20,000
25,000
30,000
35,000
40,000
45,000
50,000
2005 2006 2007 2008
Inv
estm
ents
(E
uro
mil
lion
s)
Inv
estm
ent
per
km
of
rrac
k (
Eu
ros)
Investments Investment per km

Railway Reform in South East Europe and Turkey: On the Right Track? Annexes
175
of short-term and long-term loans; (iii) severance payments; and (iv) budget funds earmarked for
capital investments.132
Including these additional items, total state funds to Croatian Railways
reached Euro 400 million in 2009, as opposed to Euro 56 million for operating support.
Excluding loan repayment, state support to Croatian Railways has fallen from 1.08 percent of
GDP in 2005 to 0.74 percent of GDP in 2009 (Figure 126). Including all forms of state support,
this figure rises to 0.88 percent of GDP in 2009.
Figure 125: Operating State Support to Croatian
Railways
Figure 126: Croatia Railways- Total State Support
to Croatian Railways
Sources: Croatian Railways, IMF. Sources: Croatian Railways, IMF.
313. The legal framework for the allocation of state funds to Croatian Railways takes the
form of two main mechanisms. The first is compensation of the public service obligation (PSO)
requested by the state and operated by the rail company according to provisions of a precise
contract. The second is a contribution for the development, maintenance, and operation of rail
infrastructure, leaving to the rail operators the obligation to pay an access charge calculated as the
marginal costs—plus a mark-up in line with what the market can sustain—for the usage of the
infrastructure generated by their own traffic. In addition, important financing support is offered
by the state for the acquisition of wagons, coaches, and locomotives. As Figure 127 shows, in
2009, 40 percent of state support to Croatian Railways was for rail infrastructure maintenance and
28 percent for capital investments, with 14 percent for operations and a further 2 percent for
severance payments. The main change over 2005-2009 is the increased share of funds allocated
for rail infrastructure, which rose from 33 percent in 2005 to 40 percent in 2009, with a
concomitant decline in loan repayments—a positive development.
132
Details on the breakdown of state support to Croatian Railways can be found in HŢ Holding (2010),
Business Report For Affiliated Companies of HŽ Holding for the period from Jan-Dec 2009, Zagreb,
March 2010.
0.19
0.15
0.13
0.12
0.12
0.10
0.11
0.12
0.13
0.14
0.15
0.16
0.17
0.18
0.19
0.20
50
52
54
56
58
60
62
64
66
68
70
2005 2006 2007 2008 2009
Operating state support (Euro millions) % of GDP
1.36
1.18
1.13
1.06
0.88
0.70
0.80
0.90
1.00
1.10
1.20
1.30
1.40
0
100
200
300
400
500
600
2005 2006 2007 2008 2009
Total state support (Euro millions) % of GDP

Railway Reform in South East Europe and Turkey: On the Right Track? Annexes
176
Figure 127: Croatian Railways – Breakdown of State Support to Croatian Railways
Source: Croatian Railways.
33 31 32 3440
1412 12 11
14
2929
3436
28
34
32 2
21 24 20 16 16
0
10
20
30
40
50
60
70
80
90
100
2005 2006 2007 2008 2009
Loan repayments
Severance payments
Capital investments
State support for operations
Rail infrastructure maintenance
Railway Reform in South East Europe and Turkey: On the Right Track? Annexes
177
THE RAILWAYS OF FYR MACEDONIA
314. In 2007 Macedonian Railways (Makedonski Železnici; MŢ) was reorganized into two
separate joint stock companies—a public enterprise in charge of infrastructure management,
Macedonian Railways Infrastructure (MŢ-I) and a transport company in charge of passenger and
freight operations, Macedonian Railways Transport (MŢ-T). This change was part of a broader
railway reform program aimed at making the FYR Macedonian rail sector comply with EU
directives and the EU rail acquis, and by doing so, increase the commercial orientation of
activities in order to allow the rail system to operate successfully and in competition with other
operators.
315. The rail network of FYR Macedonia is small, with 699km of single track rail—with only
235 km electrified. The main line of Pan-European Corridor X traverses FYR Macedonia from
Tabanovce to the capital Skopje to Gevgelija, as well as the branch Corridor Xd from Veles to
Bitola to Kremenica (146 km). Along Corridor X the line is electrified and has a Siemens safety
control system—the railway sections along this corridor are expected to be linked to a
telecommunications system in the future. The country is also traversed by Pan-European
Corridor VIII. This corridor connects the Black Sea through Bulgaria and FYR Macedonia to
Albania and the Adriatic Sea. It is 313 km long, although only 154 km are constructed—from
Kumanovo-Skopje-Kicevo—with the border of Bulgaria to Kumanovo currently under
construction (Figure 128). International transport accounted for 98 percent of freight transport in
2009, most of which is transported through Corridor X, making the operational and financial
performance of MŢ-T and MŢ-I highly dependent on traffic development along this part of the
network.
Operational performance
316. In the last decade, freight and passenger rail traffic declined in the FYR Macedonia
by 7 percent. Passenger traffic has declined from 176 million passenger-km in 2000 to 154
million passenger km in 2009—equal to only 24 percent of total rail traffic. Even without the
negative impact of the international financial crisis, passenger traffic in 2008 was lower than in
2000. By contrast, freight traffic grew strongly over 2000-2007, rising by 48 percent to 778
million ton-km, before declining sharply, particularly in 2009. As a result, overall freight traffic
declined by 6 percent over 2000-2009, with the decline in 2009 wiping out the gains of the
preceding years (Figure 129). The sharp decline in freight transport starting in the second half of
2008 reflects the impact of the crisis on the metals sector, which accounts for 44.5 percent of
transported goods, measured in tons; some of the large clients of MŢ-T include Mittal Steel,
Fenimak, the nickel mine company, and Makstil, a steel company. Freight transport is dominated
by international transport, with transit and import traffic each equal to 45 percent of total freight
traffic in 2009.

Railway Reform in South East Europe and Turkey: On the Right Track? Annexes
178
Figure 128: The Rail Network in FYR Macedonia
Source: World Bank.
Figure 129: FYR Macedonia - Rail Traffic, 2000-2009
Source: UIC.
317. Rail traffic intensity remains low at 30 percent of the EU average in 2009. In 2009,
traffic intensity in FYR Macedonia stood at 931,330 traffic units per rail route-km, having peaked
at 1,274,678 in 2008, before being adversely affected by the impact of the international financial
crisis—traffic intensity rose by 43 percent over 2005-2008 (Figure 130). Traffic intensity is
being pulled down by the lack of dynamism in passenger services; in 2009, freight traffic
intensity, at 711,016 traffic units per rail route-km, was equal to 55 percent of the EU average—
considerably higher than is the case for overall rail traffic intensity vis-à-vis the EU average.
Nevertheless, the intensity of overall infrastructure usage remains well below the EU average,
0
100
200
300
400
500
600
700
800
2000 2001 2002 2003 2004 2005 2006 2007 2008 2009
Passenger (million pass-km) Freight (million ton-km)

Railway Reform in South East Europe and Turkey: On the Right Track? Annexes
179
with negative financial repercussions given the high fixed costs of rail infrastructure. The key
driver for growth going forward will be developments in international freight transport, as local
freight transport is minimal, and passenger traffic is small vis-à-vis freight traffic.
Figure 130: FYR Macedonia – Traffic Intensity,
2005-09
Figure 131: FYR Macedonia – Traffic Units Per
Staff and Staff Levels, 2005-09
Source: UIC. Source: UIC.
318. Labor productivity rose somewhat over 2005-2009, but remains at only 38 percent of
EU levels. Figure 131 presents labor productivity, calculated as the number of traffic units per
staff, adding the staff of both MŢ-T and MŢ-I for 2008 and 2009 in order to compare with
preceding years. Labor productivity rose by 42 percent over 2005-2008, before declining by 25
percent to 226,199 traffic units per employee in 2009. Staff levels declined over 2005-2009, from
2,921 to 2,878—however staffing levels are high given existing traffic volumes. Turning to
infrastructure staff productivity: measured as the total staff divided by the length of the network,
this stood at 2.19 in 2008 and declined to 2.16 in 2009. In its latest business plan, MŢ-I is
projecting that staff levels will decline from 1,531 in 2009 to 1,468 in 2012, which would reduce
the staff per km of track to 2.1. Staff at MŢ-T has fallen from 1,408 in 2008 to 1,366 in 2009, and
no recruitment is planned for 2010. Overall, labor productivity remains low compared to the EU
average, suggesting that MŢ-T and MŢ-I will need to reduce staff in order to raise labor
productivity over the medium-term.
319. There is a significant backlog of track maintenance, but rail infrastructure equipment
is less aged than track. Out of a network of 699 km, there have been track renewal works for
only 8 percent of the network in the last 10 years, with over 68 percent of the network without
any renewal works since at least 31 years. However, given the concentration of freight traffic
along Corridor X, the current approach of MŢ-I—which is to focus scarce resources on this
corridor—is a sensible one. Addressing the entire track maintenance backlog only makes sense if
the existing and projected traffic makes this a financially viable investment, something that is
most unlikely. The age structure of rail infrastructure equipment is presented in Figure 132, which
reveals considerable investments in the last ten years, particularly for the signaling system, but
also to a lesser extent telecommunications installations and the catenary system.
22%
24%
26%
28%
30%
32%
34%
36%
38%
0
200,000
400,000
600,000
800,000
1,000,000
1,200,000
1,400,000
2005 2006 2007 2008 2009
FYROM % of EU average
2,800
2,820
2,840
2,860
2,880
2,900
2,920
2,940
2,960
150,000
170,000
190,000
210,000
230,000
250,000
270,000
290,000
310,000
330,000
2005 2006 2007 2008 2009
Traffic units/staff Staff
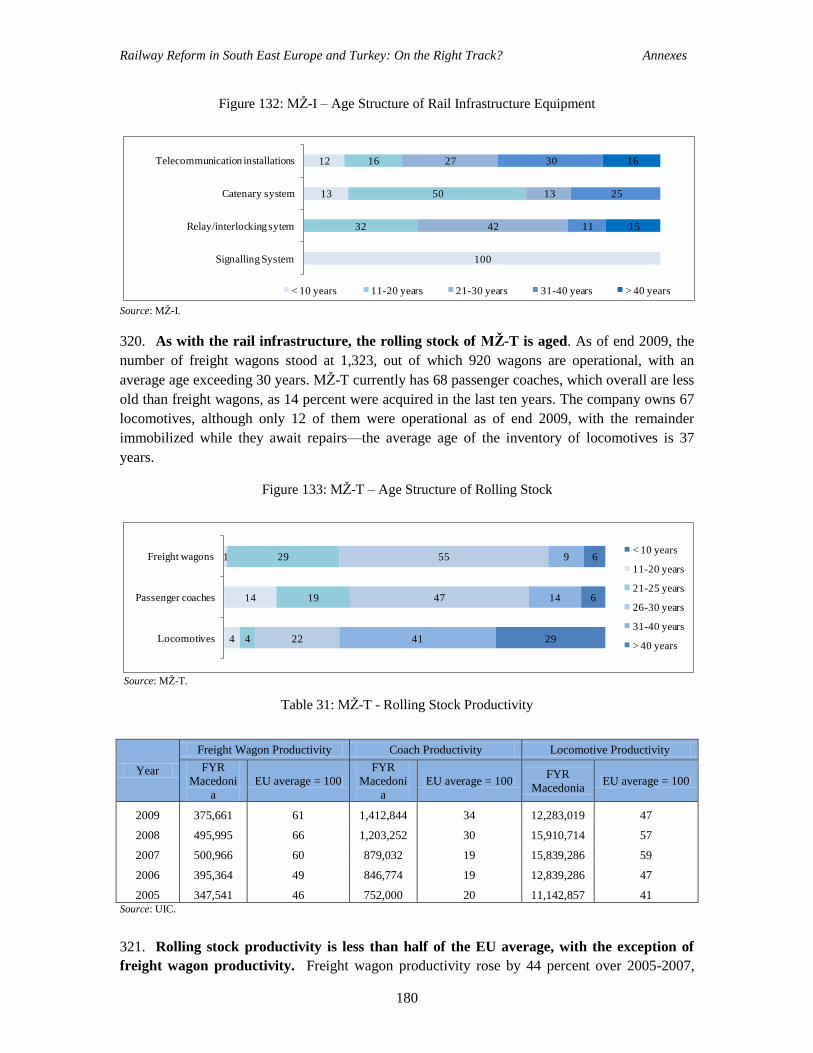
Railway Reform in South East Europe and Turkey: On the Right Track? Annexes
180
Figure 132: MŢ-I – Age Structure of Rail Infrastructure Equipment
Source: MŢ-I.
320. As with the rail infrastructure, the rolling stock of MŽ-T is aged. As of end 2009, the
number of freight wagons stood at 1,323, out of which 920 wagons are operational, with an
average age exceeding 30 years. MŢ-T currently has 68 passenger coaches, which overall are less
old than freight wagons, as 14 percent were acquired in the last ten years. The company owns 67
locomotives, although only 12 of them were operational as of end 2009, with the remainder
immobilized while they await repairs—the average age of the inventory of locomotives is 37
years.
Figure 133: MŢ-T – Age Structure of Rolling Stock
Source: MŢ-T.
Table 31: MŢ-T - Rolling Stock Productivity
Year
Freight Wagon Productivity Coach Productivity Locomotive Productivity
FYR
Macedoni
a
EU average = 100
FYR
Macedoni
a
EU average = 100 FYR
Macedonia EU average = 100
2009 375,661 61 1,412,844 34 12,283,019 47
2008 495,995 66 1,203,252 30 15,910,714 57
2007 500,966 60 879,032 19 15,839,286 59
2006 395,364 49 846,774 19 12,839,286 47
2005 347,541 46 752,000 20 11,142,857 41 Source: UIC.
321. Rolling stock productivity is less than half of the EU average, with the exception of
freight wagon productivity. Freight wagon productivity rose by 44 percent over 2005-2007,
100
13
12
32
50
16
42
13
27
11
25
30
15
16
Signalling System
Relay/interlocking sytem
Catenary system
Telecommunication installations
< 10 years 11-20 years 21-30 years 31-40 years > 40 years
4
14
1
4
19
29
22
47
55
41
14
9
29
6
6
Locomotives
Passenger coaches
Freight wagons< 10 years
11-20 years
21-25 years
26-30 years
31-40 years
> 40 years
Railway Reform in South East Europe and Turkey: On the Right Track? Annexes
181
before declining by 1 percent in 2008 and by 24 percent in 2009, to 375,661 traffic units per
wagon. This is equivalent to 61 percent of the EU average, up from 46 percent in 2005. Passenger
coach productivity rose by 89 percent over 2005-2009—significant progress over the last five
years—but remains at only 34 percent of the EU average. Locomotive productivity rose by 42
percent over 2005-2008, but declined by 22 percent to 12,283,019 traffic units per locomotive,
equal to 47 percent of the EU average. One of the factors pulling down productivity is the fact
that only a fraction of the fleet is operational, due to the need for repairs and modernization given
their old age, as well as unreliable fully depreciated fleet. For locomotives, 58.4 percent were
immobilized in 2009, up from 55.7 percent in 2008.133
Despite improvements compared to five
years earlier, the low utilization level of rolling stock has negative financial repercussions.
Financial Performance and Investment Plans of Railways in FYR Macedonia
322. The financial performance of railways operating in FYR Macedonia has not improved
over 2005-2008, despite freight remaining highly profitable. Table 32 presents information on
passenger and freight transport as well as infrastructure. As Macedonian Railways was divided
into MŢ-T and MŢ-I in 2007, the figures for 2008 are for the two existing companies, and before
that for its predecessor. Freight transport services are the only line of business generating profits,
with a net income of Euro 2.4 million in 2008. By contrast, passenger services generate
substantial and growing losses, with net income of minus Euro 11.4 million in 2008. As a result,
the consolidated financial performance of MŢ-T is negative: in 2009 freight profits reached 10.6
million, with losses of Euro 9.8 million for passenger services, and with a total profit for the
company as a whole of Euro 853,024. Infrastructure services generated losses of Euro 17.1
million in 2008, while receiving Euro 2.9 million in contributions from the state—the working
ratio was equal to 1.09, which is close to breaking even. An important question regarding
infrastructure is whether sufficient maintenance activities are being undertaken or whether sub-
optimal amounts are being undertaken in order to control costs, with negative medium to long-
term effects.
323. The wage bill represents 18 percent of MŽ-T’s operating costs in 2008, but 30 percent
of MŽ-I’s operating costs. Compared to 2005, this represents a significant decline, although as a
percentage of total revenue it has risen slightly. However, there are considerable differences
between the wage bill cost for passenger and freight services: in 2008 it was equal to 27 percent
of total operating costs for the former, but only 14 percent for the latter. The freight wage bill is a
smaller share of total operating costs—despite the fact that there is more staff working in freight
than in passenger services due to the fact that freight transport pays markedly higher track access
charges—thus raising overall total operating costs, and thus lowering the share of the wage bill.
By contrast, the wage bill is equal to 30 percent of MŢ-I‘s costs, 12 percentage points higher than
for MŢ-T, and represent 58 percent of total revenues—more than double the rate for the transport
company. This large gap between the wage bill as a share of total operating costs versus total
revenues points to the general issue of low revenues. There is considerable scope for increasing
staff productivity, which is equal to 2.19 staff per km of track, compared to 0.60 for Kosovo.
133
Macedonian Railways Transport JSC (2010), Report on the Operations of MZ Transport AD Skopje for
the Period 1.01-31-12.2009. Skopje, May 2010.

Railway Reform in South East Europe and Turkey: On the Right Track? Annexes
182
Table 32: FYR Macedonia Rail Companies - Financial Performance (Euro millions)
2005 2006 2007 2008
Q1
2008
Q2 2008
2009
Q1
2009
Q2
MŽ-T Passenger
Total revenue 2.5 2.3 1.9 0.5 0.6 2.5 0.6 1.4
State contribution 0.3 0.0 0.0 0.0 0.0 0.0 0.0 0.8
Total expenditure 7.5 8.5 9.8 2.4 2.6 13.8 3.5 3.4
Net income
With state contribution (4.9) (6.1) (7.9) (1.9) (1.9) (11.4) (2.9) (2.0)
Without state contribution (5.2) (6.1) (7.9) (1.9) (1.9) (11.4) (2.9) (2.8)
Working ratio
With state contribution 2.65 3.27 4.58 4.43 3.51 4.87 5.34 2.07
Without state contribution 3.00 3.27 4.58 4.43 3.51 4.87 5.34 4.86
MŽ-T Cargo
Total revenue 25.6 25.7 36.0 8.7 8.7 33.2 5.3 7.4
State contribution 0.7 0.0 0.0 0.0 0.0 0.0 0.0 1.9
Total expenditure 11.8 14.3 33.1 8.6 7.8 30.8 5.1 5.1
Net income
With state contribution 13.8 11.4 2.9 0.1 0.9 2.4 0.2 2.3
Without state contribution 13.1 11.4 2.9 0.1 0.9 2.4 0.2 0.4
Working ratio
With state contribution 0.45 0.55 0.76 0.88 0.78 0.82 0.81 0.58
Without state contribution 0.46 0.55 0.76 0.88 0.78 0.82 0.81 0.77
MŽ-I Infrastructure
Total revenue 33.5 31.4 32.4 4.2 3.8 16.1 3.4 4.5
State contribution 3.9 2.3 1.9 0.4 0.4 2.9 0.7 2.0
Total expenditure 36.4 40.2 52.1 8.1 7.6 33.1 7.8 8.5
Net income
With state contribution (2.9) (8.8) (19.7) (3.9) (3.8) (17.1) (4.5) (3.9)
Without state contribution (6.8) (11.1) (21.7) (4.3) (4.2) (19.9) (5.2) (5.9)
Working ratio
With state contribution 0.96 1.15 1.04 1.01 1.00 1.09 1.17 1.01
Without state contribution 1.08 1.24 1.11 1.13 1.10 1.32 1.48 1.78 Sources: MŢ-I, MŢ-T.
324. Unit revenue for passenger and freight services has fallen over 2005-2008.134
Figure136
presents unit revenue and unit cost data for passenger services. It shows that unit revenues exceed
unit costs more than three-fold wide margin in 2008, and the gap has widened compared to 2005.
While passenger unit revenue has not risen over 2005-2008, unit costs have risen by 19 percent.
Freight unit revenues have decreased by 6 percent while unit costs have risen by 105 percent.
Although freight unit revenue exceeds unit costs, the margin is narrowing, with negative financial
impact (Figure 137). The data suggests that MŢ-T is struggling to contain costs.
134
This is not an exchange rate effect, as passenger unit revenues declined from MKD 1.64 in 2005 to
MKD 1.45 in 2008, while freight unit revenues declined from MKD 2.96 to MKD 2.73 over the same
period.

Railway Reform in South East Europe and Turkey: On the Right Track? Annexes
183
Figure 134: FYR Macedonia – MŢ-T Wage Bill
Indicators, 2005-08
Figure 135: FYR Macedonia – MŢ-I Wage Bill
Indicators, 2005-09
Source: MŢ-T. Source: MŢ-I.
Figure136: MŢ-T Average Revenue and Cost per
Passenger Unit, (Euro cents/pass-km)
Figure 137: MŢ-T Average Revenue and Cost per
Freight Unit (Euro cents/ton-km)
Source: MŢ-T. Source: MŢ-T.
Figure138: MŢ-I Share of Passenger versus
Freight Traffic (ton-km) and TAC, 2008
(percentages)
Figure 139: MŢ-I TAC per Traffic Unit
(Euros/train-km)
Source: MŢ-I. Source: MŢ-I.
32
29
1718
2022
17
2119
22
17
21
0
5
10
15
20
25
30
35
2005 2006 2007 2008
% of operating costs% of operating revenue (excl state contribution)% of total revenue
4843
28 3033
52 53
44
70
95
4649
41
58
75
0
10
20
30
40
50
60
70
80
90
100
2005 2006 2007 2008 2009
% of operating costs% of operating revenue (excl state contribution)% of total revenue
2.7 2.4
1.7
2.4
7.2 7.4
8.28.6
2005 2006 2007 2008
Unit total revenue Unit operating cost
4.8
4.2
4.64.5
1.9 2.1
3.9 3.9
2005 2006 2007 2008
Unit total revenue Unit operating cost
53.8
7.9
46.2
92.1
Train-km TAC
Passenger
Freight
1.2 1.1 0.9 0.6
21.3 21.4
18.0
7.9
2005 2006 2007 2008
Passenger Freight

Railway Reform in South East Europe and Turkey: On the Right Track? Annexes
184
Figure 140: MŢ-I TAC as Share of Total
Infrastructure Revenue (percentages)
Figure 141: MŢ-I Rail Infrastructure Investments
(in units indicated)
Source: MŢ-I. Source: MŢ-I.
325. Average track access charges are relatively high in FYR Macedonia, and freight pays
a disproportionate share. If one calculates the average TAC by considering the volume of train-
km in 2009 and the total amount of funds transferred to MŢ-I for the utilization of
infrastructure—2.77 million train-km and Euro 9.45 million TAC—it results in Euro 3.4 per
train-km. However, this hides the average TAC per train-km paid for passenger and freight
services, which varies considerably. Figure 137 shows share of traffic, calculated on the basis of
train-km for passenger and freight services, and the share of TAC paid by each, suggesting
considerable cross-subsidization. TAC has been on the decline, reflecting in part changes in the
methodology for its calculation135
TAC represented 70 percent of total infrastructure revenue—
which is high—but declined in 2009 to 53 percent (Figure 140). However, this is partly due to the
fact that budget contributions are limited. Rail infrastructure investments per km of track—at
Euro 7,682—are relatively low compared to other countries in the region, and suggest that there
is insufficient spending in track rehabilitation (Figure 141).
326. Planned infrastructure investments over 2010-2012 focus on the modernization of
track along Corridor X. The objective is to raise the operational speed to 120 km/hour along
Corridor X, and make investments in the telecommunications system, automatic traffic crossings,
radio dispatch communication, and automatic speed regulation. During this time, there will be
rehabilitation of 54 km of track in three sections of Corridor X—Tabanovci-Kumanovo (12km),
Nogaevci-Negotino (30km) and Miravci-Smokvica (12km)—with an estimated cost of Euro 17.6
million, to be financed from an EBRD loan. In addition, during this period preparation of
preliminary designs and a feasibility study for the construction of 55km along Corridor X is
planned, with funding to come from the Instrument for Pre-Accession (IPA).136
The construction
135
The basis on which TAC are calculated have changed over time: (i) from the separation of the railways
into MŢ-T and MŢ-I in 2007 up to January 2009, 40 percent of revenues of MŢ-T were paid to MŢ-I as
TAC; (ii) from February 2009 to January 2010 a TAC based on the level that allows covering the
difference between the state contribution and financial cost was applied—the so called CF method; and (iii)
since January 26, 2010 TAC has been paid based on marginal costs with mark-ups (MC+ method). 136
MŢ-I is also interested in construction of new track along Pan-European Corridor VIII, the 89 km
between Kumanovo and the border with Bulgaria. The total cost of this project, excluding VAT, is
estimated at Euro 395 million, with Euro 6.7 million required for the preparation of technical
documentation.
67
8279
70
53
2005 2006 2007 2008 2009
TAC as share of total infrastructure revenue
1.30.9 0.8
5.4
1,903
1,273 1,159
7,682
0.0
1.0
2.0
3.0
4.0
5.0
6.0
0
1,000
2,000
3,000
4,000
5,000
6,000
7,000
8,000
9,000
2005 2006 2007 2008
Inv
estm
ents
(E
uro
mil
lion
s)
Inv
estm
ent
per
km
of
rrac
k (
Eu
ros)
Investments Investment per km

Railway Reform in South East Europe and Turkey: On the Right Track? Annexes
185
of rail from Kicevo to the border with Albania—a section of Corridor VIII—would cost an
additional Euro 315 million. Figure 142 presents the investments along Corridor X and Corridor
VIII based on the 2010-2012 Business Plan of MŢ-I, with cumulative investments over 2010-
2017 reaching Euro 826 million under this scenario. It will be important to ensure that there is a
real demand in Albania and Bulgaria for Corridor VIII, and that they in turn also undertake
necessary investments along the corridors in their respective countries and improve border-
crossing processing. There are indications that Bulgaria is focusing its resources along Pan-
European Corridors IV and X, and that Corridor VIII is not a top priority.
327. The financing of costly new rail infrastructure remains an issue and creates risks of
underfunding much needed infrastructure maintenance and rehabilitation. Rail
infrastructure investments over 2005-2008 have totaled less than Euro 5 million annually, and
with theMŢ-I making significant losses, financing of new infrastructure would require extensive
support from the state or financing from international financial institutions. At the same time, it is
necessary to support continued rehabilitation of existing track, and to secure funding for this,
before embarking on extensive network expansion. The Transport Strategy acknowledges the
importance of reconstructing rail lines and sections; careful consideration needs to be given as to
how additional infrastructure maintenance will be financed when significant line expansion is
expected to occur concurrently.
Figure 142: MŢ-I – Planned Rail Infrastructure Investments (Euro millions)
Source: MŢ-I, Business Plan PE MZ Infrastructure: 2010-2012. Skopje, May 2010.
328. State funding to the rail sector rose sharply in 2009. Subsidies declined from just under
Euro 5 million in 2005 to Euro 1.9 million in 2007, before rising the next two years, to Euro 11.4
million in 2009, which is equal to 0.17 percent of GDP (Figure 143). Although MŢ-T had not
received state funding in 2006, 2007, or 2008, this was reversed in 2009, when MŢ-T received
state contributions of Euro 7.7 million, of which about half was for freight transport to pay for
infrastructure access charges. Given the low levels of investment in rail infrastructure, and the
fact that most countries support financing in part through the budget, it suggests that state support
may be too low in light of stated investment objectives; state support to freight services suggests
that TAC may be set too high in FYR Macedonia.
0
20
40
60
80
100
120
140
160
180
200
0
100
200
300
400
500
600
700
800
900
2010 2011 2012 2013 2014 2015 2016 2017
An
nu
al in
ves
tments
Cu
mu
lati
ve in
vest
ments
Cumulative investments
Corridor X
Corridor VIII

Railway Reform in South East Europe and Turkey: On the Right Track? Annexes
186
Figure 143: FYR Macedonia - State Contributions to Rail Sector, 2005-2009
Sources: MŢ-T, MŢ-I, IMF.
0.10
0.05
0.030.04
0.17
0.00
0.02
0.04
0.06
0.08
0.10
0.12
0.14
0.16
0.18
0.20
0
2
4
6
8
10
12
2005 2006 2007 2008 2009
Total operating subsidies (Euro millions) % of GDP

Railway Reform in South East Europe and Turkey: On the Right Track? Annexes
187
KOSOVO RAILWAYS
329. Kosovo Railways (Hekurudhat e Kosovës; KR) is a joint stock company created in
December 2005 and previously known as UNMIK Railways. It was originally formed as the
United Nations Interim Administration Mission in Kosovo (UNMIK) Railway from the lines of
the former Yugoslav Railways that lie on Kosovo territory, and is owned by the state. This
transfer was developed within the framework of a restructuring of public companies—Kosovo
Railways is now a commercially-oriented company. It is governed by the Railway Law (Law
03/L-076), which became effective on June 5 2008.137
Kosovo Railways is divided into two
bodies in one legal entity: one responsible for infrastructure and the other for trains operations
and commercial activities.
330. The rail network is small, with 333km of single track non-electrified rail with standard
gauge. Despite limited maintenance, it is mostly in good to fair condition due to low traffic. The
network consists of a main north-south line with two major branches, and a number of smaller
branches. The main line starts in Hani i Elezit on the FYR of Macedonia border running through
to the Serbian border at Leshak—a distance of 148 km, of which 141.3 km is on the SEETO Core
Network Route 10. However, from the declaration of independence of Kosovo in February 2008,
Kosovo Railways trains are restricted to operating on the network south of Mitrovica, and Serbian
Railways operates trains on the northern most section of the line in Kosovo. The North East to
West line is comprised of three branches: (i) the East Line from the border with Serbia to Fushë
Kosovë (42 km); (ii) the West line from Fushë Kosovë to Pejë (81 km); and (iii) the West-South
line from Klinë to Prizren (58 km).
Operational performance
331. Freight and passenger rail traffic have been moving in opposite directions, with
significant growth in freight traffic from 2005, albeit starting from a low base. With only 13
million ton-km of traffic in 2001, freight traffic nearly tripled by 2009, to reach 51 million ton-km
(Figure 145). Over 2008-2009 freight traffic declined by only one percent—despite a difficult
context due to the global international crisis—reflecting in part the 4 percent real GDP growth
rate in Kosovo. To put the traffic volumes in perspective, prior to the conflict in Yugoslavia, the
railway lines in Kosovo carried 2.5 million tons annually, compared to 911,830 tons in 2009.138
137
Before June 2008 there was no Railway Act, apart from Regulation No.2006/56 of December 6, 2006,
which set out the basic legal framework for the operation, maintenance and use of railways in Kosovo. 138 At the time 90 percent of rail freight traffic was imports, primarily oil from FYR Macedonia. European
Commission Liaison Office to Kosovo (2008). Railway Transport in Republic of Kosovo, Draft Report,
Review of the Current Situation. Technical Support to the Ministry of Transport and Communications to
continue the development of a Multi-Modal Transport Strategy and Action Plan, December 2008.

Railway Reform in South East Europe and Turkey: On the Right Track? Annexes
188
Figure 144: The Rail Network of Kosovo
Source: World Bank.

Railway Reform in South East Europe and Turkey: On the Right Track? Annexes
189
Figure 145: Railway Traffic in Kosovo, 2001-2009
Source: Kosovo Railways.
332. Rail freight volumes are dominated by imports. This reflects the lack of competitiveness of
the economy and the small volume of exports—exports are ten times less than the level of
imports. In 2009, imports constituted 65.9 percent of total freight volumes, albeit declining from
80 percent in 2005. Comparing freight traffic volumes of the first two quarters of 2009 with 2008,
there is a decline in import volumes, which are driving the lower freight volumes in the first half
of 2009 compared to the first half of 2008.
333. Passenger volumes have been declining over the decade, from 39.9 million passenger-km
in 2001 to 15.9 million passenger-km in 2009. However, this in part reflects differences in the
way passenger volumes have been measured since Kosovo Railways was established—after it
took over from KFOR, which operated trains between 2000 and 2003. Since April 2004, Kosovo
Railways has registered the number of passengers on the basis of sold tickets and an estimation of
the total number of UNMIK permits, which are issued by municipalities for displaced persons.
Although the number of permits are about 10,000 per month, Kosovo Railways does not know
how many times these are used by passengers, leading to serious underestimation of passenger
volumes, explaining the large drop after 2003 (Figure 145). Consultants have estimated that the
ratio of actual number of passengers, compared with the number of sold tickets and number of
UNMIK permits, is 19.1.139
This would suggest over 500,000 passengers in 2006, as opposed to
the 359,733 passengers recorded by Kosovo Railways. Even factoring in the passengers with
UNMIK permits, this indicates a very significant problem of ticketless passengers and a need to
strengthen inspections and the penalty regime. Focusing on the period since Kosovo Railways
was established, passenger traffic has remained largely stagnant and has declined from 18.9
passenger-km in 2005 to 15.9 passenger-km in 2009.
334. Kosovo Railways operates three types of passenger services. First, there is the Freedom of
Movement Train, with 2 services a day from Fushë Kosovë to Hani i Elezit. This passenger
139
European Commission Liaison Office to Kosovo (2008) Railway Transport in Republic of Kosovo,
Draft Report, Review of the Current Situation. Technical Support to the Ministry of Transport and
Communications to continue the development of a Multi-Modal Transport Strategy and Action Plan,
December 2008 provides details regarding the estimates between passenger numbers as reported by Kosovo
Railways and projected passenger numbers based on actual counting of passengers at all stations.
0
10
20
30
40
50
60
2001 2002 2003 2004 2005 2006 2007 2008 2009
Passenger (million pass-km) Freight (million ton-km)
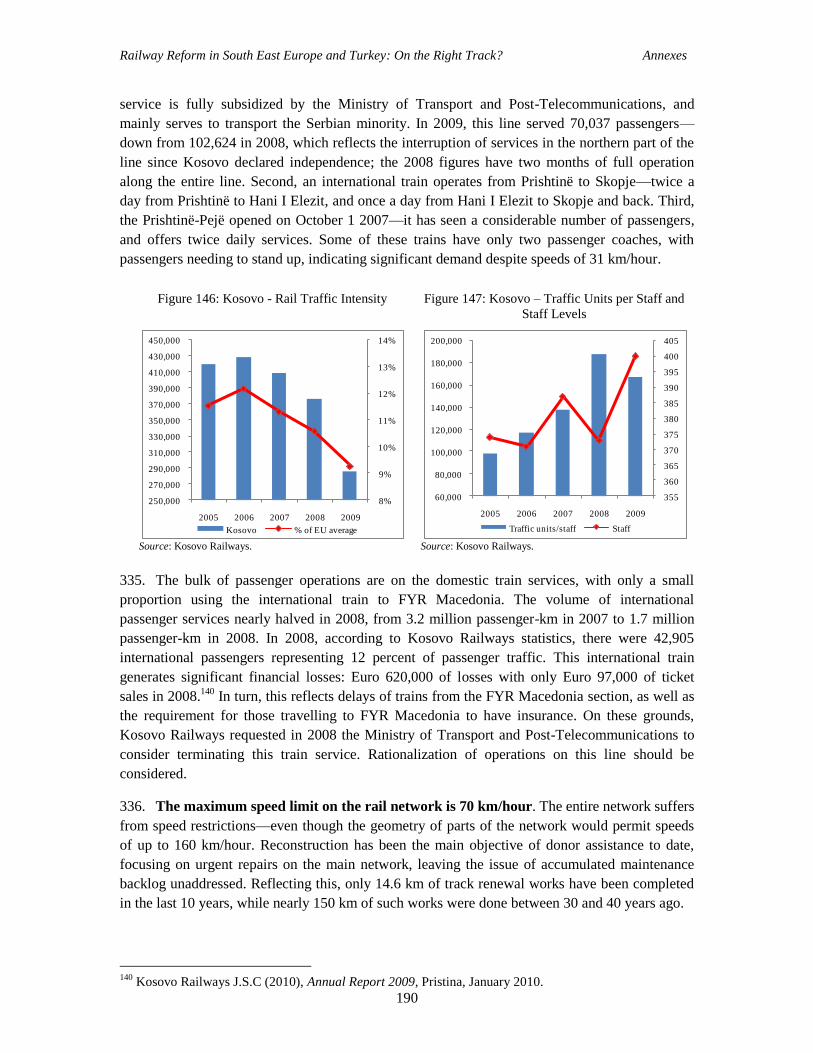
Railway Reform in South East Europe and Turkey: On the Right Track? Annexes
190
service is fully subsidized by the Ministry of Transport and Post-Telecommunications, and
mainly serves to transport the Serbian minority. In 2009, this line served 70,037 passengers—
down from 102,624 in 2008, which reflects the interruption of services in the northern part of the
line since Kosovo declared independence; the 2008 figures have two months of full operation
along the entire line. Second, an international train operates from Prishtinë to Skopje—twice a
day from Prishtinë to Hani I Elezit, and once a day from Hani I Elezit to Skopje and back. Third,
the Prishtinë-Pejë opened on October 1 2007—it has seen a considerable number of passengers,
and offers twice daily services. Some of these trains have only two passenger coaches, with
passengers needing to stand up, indicating significant demand despite speeds of 31 km/hour.
Figure 146: Kosovo - Rail Traffic Intensity Figure 147: Kosovo – Traffic Units per Staff and
Staff Levels
Source: Kosovo Railways. Source: Kosovo Railways.
335. The bulk of passenger operations are on the domestic train services, with only a small
proportion using the international train to FYR Macedonia. The volume of international
passenger services nearly halved in 2008, from 3.2 million passenger-km in 2007 to 1.7 million
passenger-km in 2008. In 2008, according to Kosovo Railways statistics, there were 42,905
international passengers representing 12 percent of passenger traffic. This international train
generates significant financial losses: Euro 620,000 of losses with only Euro 97,000 of ticket
sales in 2008.140
In turn, this reflects delays of trains from the FYR Macedonia section, as well as
the requirement for those travelling to FYR Macedonia to have insurance. On these grounds,
Kosovo Railways requested in 2008 the Ministry of Transport and Post-Telecommunications to
consider terminating this train service. Rationalization of operations on this line should be
considered.
336. The maximum speed limit on the rail network is 70 km/hour. The entire network suffers
from speed restrictions—even though the geometry of parts of the network would permit speeds
of up to 160 km/hour. Reconstruction has been the main objective of donor assistance to date,
focusing on urgent repairs on the main network, leaving the issue of accumulated maintenance
backlog unaddressed. Reflecting this, only 14.6 km of track renewal works have been completed
in the last 10 years, while nearly 150 km of such works were done between 30 and 40 years ago.
140
Kosovo Railways J.S.C (2010), Annual Report 2009, Pristina, January 2010.
8%
9%
10%
11%
12%
13%
14%
250,000
270,000
290,000
310,000
330,000
350,000
370,000
390,000
410,000
430,000
450,000
2005 2006 2007 2008 2009
Kosovo % of EU average
355
360
365
370
375
380
385
390
395
400
405
60,000
80,000
100,000
120,000
140,000
160,000
180,000
200,000
2005 2006 2007 2008 2009
Traffic units/staff Staff

Railway Reform in South East Europe and Turkey: On the Right Track? Annexes
191
337. The rolling stock is characterized by its old age, although its overall condition is
satisfactory thanks to good maintenance. Of Kosovo Railways‘ 10 locomotives, only one
dates from this decade, with the others having been acquired before the 1970s. Kosovo Railways
has less than 20 passenger wagons—10 donated by Sweden in the 1960s, and 7 donated by
Austrian Federail Railways (Österreichische Bundesbahnen; OBB) in 2009—and 70 freight
wagons, again dating from the 1960s. While the quality of rolling stock is sufficient given current
traffic volumes and services, if there are investments for the electrification of lines and signaling
which would allow higher speeds, then more recent rolling stock could be required.
338. In 2009, the central traffic control system of trains was completed, enabling the
control of train traffic from the center. This has improved safety in the stations and will enable
higher maneuvering speeds and higher capacities, and will also improve safety at level crossings.
The relaying system and telecommunication installations date from over 30 years ago—reflecting
limited investment to date. In September 2004, Kosovo Railways established a new container
terminal at Fushë Kosovë, where sea-going containers and swop bodies can be transferred from
road to rail. This is an important intermodal platform, because Kosovo is a landlocked country
without access to sea ports or significant inland waterway ports.
339. Given the size of its network and train operations, the number of Kosovo Railways
employees is small, at fewer than 400 in 2009. Staffing for freight and transport services are
under 100 and have risen modestly from 71 in 2005 to 92 by the first half of 2009; the majority of
staff, 221, work in the infrastructure division. Nevertheless, given the low levels of overall traffic,
labor productivity is not high, although it has risen by 69 percent over 2005-2009, equivalent to
28 percent of the EU average (Figure 147).
Financial Performance and Investment Plans of Kosovo Railways
340. Kosovo Railways is a profitable public company, with net income of Euro 3.8 million
in 2008. With a working ratio considerably below 1, at 0.46 in 2008, Kosovo Railways is able to
recover operating costs. Ticket sales represent only a small fraction of passenger revenues, equal
to 21.3 percent of passenger revenues excluding subsidies, but this has been rising steadily from
5.8 percent in 2005. One reason for this is that the Freedom of Train service, one of three
services, is fully paid by the Ministry of Transport and Post-Telecommunication. However, as
already mentioned, it is estimated that the number of passengers circulating without paying for
tickets is very high, and could be equal to those actually paying for their seats. As also already
mentioned, the international train is a significant loss-maker, and Kosovo Railways management
has proposed that this service be discontinued.
341. Freight operations are profitable and the source of Kosovo Railways’ positive
financial results. From 2005 to 2008, there was generally a large positive gap between total
operating revenues and total expenses, although this narrowed in 2009, reflecting the impact of
the international economic crisis on traffic volumes, particularly for key metal commodities.
However, these freight service financial results do not include the cost of using infrastructure,
which is priced at zero at present, as is the case for passenger services. In the future, once
infrastructure access charges are introduced, ceteris paribus, the profitability of freight services
would be dampened.

Railway Reform in South East Europe and Turkey: On the Right Track? Annexes
192
Table 33: Financial Performance of Kosovo Railways (Euro millions)
2005 2006 2007 2008
Q1
2008
Q2 2008
2009
Q1
2009
Q2
TOTAL REVENUE 6.5 8.5 10.7 2.3 2.6 11.0 2.2 2.3
Passenger 1.5 1.6 1.7 0.3 0.3 1.1 0.3 0.3
Tickets 0.1 0.1 0.1 0.1 0.1 0.2 0.1 0.1
Freight 1.4 1.8 2.6 1.1 1.1 4.0 0.5 0.6
Other 0.7 1.2 1.5 0.4 0.4 1.6 0.4 0.4
Total operating revenues 3.5 4.5 5.7 1.8 1.8 6.7 1.1 1.2
State operating subsidies 3.1 4.0 5.0 0.4 0.9 4.3 1.1 1.1
Passenger 1.5 1.5 1.5 0.4 0.3 1.3 0.4 0.4
Freight 1.0 1.0 1.8 0.0 0.0 1.5 0.3 0.3
Infrastructure 0.6 1.5 1.6 0.0 0.6 1.5 0.5 0.5
TOTAL EXPENDITURE 5.4 4.9 5.4 2.2 1.8 7.8 1.6 1.5
Materials 0.2 0.3 0.2 0.1 0.0 0.2 0.0 0.0
Fuel, electricity 0.9 1.0 1.2 0.5 0.4 1.4 0.2 0.1
Salaries and allowances 1.2 1.4 1.3 0.5 0.4 1.8 0.5 0.5
Outsourcing and other
services 0.6 0.8 1.0 0.5 0.3 1.7 0.2 0.2
Depreciation 1.2 1.1 1.0 0.5 0.5 2.1 0.6 0.6
Total operating expenditures 4.1 4.5 4.9 2.1 1.6 7.2 1.5 1.5
Non-operating expenditures 1.3 0.4 0.5 0.2 0.1 0.6 0.1 0.1
NET INCOME
With state contribution
2.48
3.93
5.85
0.21
0.97
3.83
0.73
0.86
Without state contribution
(0.60)
(0.03)
0.87
(0.21)
0.11
(0.46)
(0.37)
(0.24)
WORKING RATIO
With state contribution 0.44 0.41 0.36 0.69 0.43 0.46 0.41 0.38
Without state contribution 0.82 0.77 0.67 0.84 0.65 0.76 0.81 0.72 Source: Kosovo Railways.
342. The wage bill as a percentage of operating cost stood at 31.6 percent by the first half
of 2009, up from 25.1 percent in 2008. However, this hides considerable variation among the
lines of business, with the wage bill lowest for passenger services (22.9 percent) and highest for
infrastructure services (42.2 percent). Total staff productivity has been rising over 2005-2008,
from 138,444 traffic units per staff in 2005 to 237,342 traffic units per staff, a 70.9 percent rise
over the four-year period. Productivity declined in the first half of 2009, reflecting lower traffic
volumes and higher staff levels. However, freight staff productivity is considerably higher, at
1,009,776 traffic units in 2008; passenger staff productivity more than fifty percent lower, at
435,250 traffic units. Staff per km of track is low, at 0.88 in 2008, and if one looks exclusively at
infrastructure staff, this falls to 0.6.

Railway Reform in South East Europe and Turkey: On the Right Track? Annexes
193
Figure 148: Kosovo Railways -Wage Bill Indicators
Source: Kosovo Railways.
343. The infrastructure division’s revenues are broadly sufficient to meet expenses
incurred. In 2008, Kosovo Railways spent Euro 2.52 million on rail infrastructure and received
Euro 3.15 million from the state for operating the infrastructure, rent and other revenues.
However, given that the entire network is operating with speed restrictions and that reconstruction
has been the major focus of expenditures to date, this leaves an important and accumulating
maintenance and rehabilitation backlog, which remains unaddressed. However, revenues are
insufficient to upgrade existing rail infrastructure.
Figure 149: Kosovo Railways Infrastructure Revenues and Expenses (Euro millions)
Source: Kosovo Railways.
344. A recent study has estimated rail infrastructure investment needs at Euro 466.9
million over 2009-2030.141
The total cost of all candidate infrastructure projects envisages the
upgrading of existing lines, either electrification or converting single to double track, and the
construction of a new line from Prizren to Vermice in Albania (Table 34). The Plan assumes EU
141
European Commission Liaison Office to Kosovo (2009), Railway Transport in Republic of Kosovo,
Action Plan and Investment Plan. Technical Support to the Ministry of Transport and Communications to
continue the development of a Multi-Modal Transport Strategy nd Action Plan, March 2009.
29 30
2725
34
30
23
27
34
22
18
22
0
5
10
15
20
25
30
35
40
2005 2006 2007 2008
Wage bill as % of operating costs Wage bill as % of operating revenue (excl state contribution) Wage bill as % of total revenue
0
500,000
1,000,000
1,500,000
2,000,000
2,500,000
3,000,000
3,500,000
2005 2006 2007 2008 Q1 2008 Q2 2008 2009 Q1 2009 Q2
Total revenues Total expenses

Railway Reform in South East Europe and Turkey: On the Right Track? Annexes
194
grant financing of Euro 233.4 million, out of which Euro 116.7 million would be covered from
the central budget of Kosovo, and an equal amount by IFI loans. Investments are proposed under
two scenarios: (i) without major modification of the modal split between road and rail; and (ii)
with the development of integrated public transport services, combining urban public transport,
inter-urban bus transport, and passenger rail transport. In the second scenario, the investments
would be phased, with Euro 100 million over 2009-2015—encompassing the first five projects,
with the remainder over 2006-2030 (Figure 150). Given the volumes, a rather more modest
investment plan to kep the network open in the short to medium-term, until traffic builds up, or
some of the regional aspects are addressed, would seem to be more appropriate.
Table 34: Investment Plan for Kosovo Railways (Euro millions)
Source: European Commission Liaison Office to Kosovo (2009).
345. As a share of GDP, state support to Kosovo Railways has been declining over 2005-
2009. State support has fallen from 0.15 percent of GDP in 2005 to 0.10 percent in 2009 (Figure
151). This reached Euro 3.9 million in 2009, with 28 percent for passenger transport subventions,
36 percent for both rail infrastructure investments and transport services investments (Figure
152). The decline in state funding occurred during a period of rising traffic—81 percent rise over
2005-2009, albeit from a low a base. In other words, state contributions on a per traffic unit basis
have declined over the period in question. With this level of funding, it is unlikely that Kosovo
Railways will be able to maintain expenditures even to rehabilitate its existing rail infrastructure.
Railway project Description Total
Cost
Completion
date
Fushë Kosovë - Prishtinë
Double track electrification 160
km/hour 29.0 2015
Fushë Kosovë - Ferisaj
Double track electrification 160
km/hour 38.1 2015
Prishtinë multimodal station 10.0 2015
Fushë Kosovë - airport
Single track 160 km/hour
electrification 14.6 2015
Rail/road freight terminals 8.5 2011
Fushë Kosovë - Mitrovicë
Single track 160 km/hour
electrification 42.1 2019
Bardh – Pejë Single track 160 km/hour 77.9 2021
Klinë - Prizren Single track 160 km/hour 58.1 2022
Ferisaj - Hani I Elezit
Double track electrification 160
km/hour 72.4 2025
Prishtinë - Podujevë Single track 160 km/hour 39.7 2026
Prizren - Vermice (Albania) New line single track 160 km/hour 13.4 2027
Mitrovicë - Leshak
Single track 160 km/hour
electrification 63.1 2030
Total 466.9

Railway Reform in South East Europe and Turkey: On the Right Track? Annexes
195
Figure 150: Kosovo Railways - Investment Plan 2009-2030 (Euro millions)
Source: European Commission Liaison Office to Kosovo (2009).
Figure 151: State Contributions to Kosovo
Railways (in units indicated)
Figure 152: Breakdown of State Contributions to
Kosovo Railways (percentages)
Sources: Kosovo Railways, IMF. Source: Kosovo Railways, IMF.
0
5
10
15
20
25
30
35
40
0
50
100
150
200
250
300
350
400
450
500
2009 2011 2013 2015 2017 2019 2021 2023 2025 2027 2029
An
nu
al in
ves
tmen
ts (
Euro
mil
lions)
Cu
mu
lari
ve
inv
estm
ent
(Eu
ro m
illi
on
s)
Cumulative investment expenditure Investment expenditure
0.15
0.14
0.13
0.10
0.11
0.00
0.02
0.04
0.06
0.08
0.10
0.12
0.14
0.16
3.0
3.5
4.0
4.5
5.0
5.5
2006 2007 2008 2009 2010 (Planned)
State contributions (Euro millions) % of GDP
3041
31 28 26
3628
4136 37
35 31 2836 37
0
10
20
30
40
50
60
70
80
90
100
2006 2007 2008 2009 2010 (Planned)
Passenger transport subventions
Investments in infrastructure
Investments in transport services

Railway Reform in South East Europe and Turkey: On the Right Track? Annexes
196
THE RAILWAYS OF MONTENEGRO
346. The three rail companies operating in Montenegro are Railway Infrastructure of
Montenegro (ŽICG), Railway Transport of Montenegro (ŽPCG), and Montecargo AD. The
former rail company, Ţeljeznice Crne Gore (ŢCG), was transformed into a public company in
1989; it was partly privatized in June 2002 as a vertically integrated rail company. In accordance
with the Law on Railways, adopted in 2004, ŢCG ceased to exist on December 21, 2008, and was
replaced by two newly established joint stock companies: ŢICG and ŢPCG. In June 2009, ŢPCG
was further restructured, by spinning off the freight division and establishing this as Montecargo,
which is a fully independent joint stock company. On October 21, 2009, the Government of
Montenegro announced its decision to sell the entire state‘s stake in Montecargo, 85.4 percent.
However, on March 17, 2011, Montenegro‘s Privatisation Council cancelled the tender talks with
the sole bidder, Romania‘s consortium Grampet, due to failure to conclude negotiations.
347. The rail network consists of 248 km of track, the smallest of all the countries covered
in this study. Of these, 168 km are electrified and there are no double lines. A 167 km main
line connects the Port of Bar on the Adriatic city to the capital, Podgorica, and to the border with
Serbia—with this line forming an ―X‖ with an 83 km second line that connects Niksic to
Podgorica and to the Albanian border. Rail lines are standard gauge, with the line to Bar
electrified. In general, the terrain is mountainous and the line has numerous bridges and tunnels.
Operational Performance
348. Rail traffic in Montenegro, measured in million traffic units, has declined over 2001-
2009, reflecting a steady decline of passenger traffic. Total rail traffic declined by 22 percent
over 2001-2009, from 263 million traffic units in 2000 to 205 million traffic units in 2009.
Freight operations was more dynamic, rising three-fold from 51 million ton-km in 2001 to 186
million ton km in 2008, before declining to 104 ton-km in 2009 (Figure 154). Passenger volumes
halved over the decade, from 212 million passenger-km in 2001 to 101 million passenger-km in
2009. Thus, the structure of traffic has changed: in 2001, passenger traffic accounted for 80
percent of total rail traffic, but by 2009 this had fallen to 50 percent. Of the 10 countries included
in this report, only Albania and Kosovo have lower overall traffic volumes than Montenegro—the
small traffic volume in part reflects the small network and population sizes.
349. Freight traffic has demonstrated considerable growth in recent years. The main source
of cargo is via the Port of Bar, Montenegro‘s main seaport and a key gate to South East Europe,
especially for neighboring landlocked countries. The aluminum factory KAP near Podgorica, the
bauxite mines in Nikšić, and the steel mill in Zeljezara in Nikšić are three of the main national
industries relying on regular and rail transport, and key Montecargo clients. In addition, transit
cargo from and to Albania has increased significantly, connecting Podogrica to Albania via
Shkoder. In 2009, the global financial crisis and its impact on the metals market adversely
affected key clients of Montecargo. This resulted in a 44 percent decline in traffic measured in
ton-km, and a 52 percent decline when measured in tons—from 1,749,027 tons in 2008 to
844,104 in 2009. With an upturn in international markets and the metal market in particular,
future freight demand has positive potential, driven by the ongoing privatization of the port
company operating the container and general cargo terminal in the Port of Bar, and the ongoing

Railway Reform in South East Europe and Turkey: On the Right Track? Annexes
197
privatization of Montecargo, which will strengthen the logistical chain and enhance the Port of
Bar‘s role as multimodal distribution center.
Figure 153: The Rail Network of Montenegro
Source: World Bank.

Railway Reform in South East Europe and Turkey: On the Right Track? Annexes
198
Figure 154: Railway Traffic in Montenegro, 2001-2009
Source: UIC.
350. Rail traffic intensity vis-à-vis the EU average has halved over 2005-2009. In 2005, rail
traffic intensity stood at 28 percent of the EU average, before declining sharply to 16 percent in
2008 and 14 percent in 2009 (Figure 155). In 2009, rail traffic density stood at 454—148 traffic
units per km of network—which is half of its value five years earlier. Traffic intensity is being
pulled down by passenger transport. Freight traffic intensity, at 454, 148 traffic units per rail
route-km in 2009, was equal to 35 percent of the EU average—double the value for overall rail
traffic intensity vis-à-vis the EU average. With the privatization of Montecargo it is can be
expected that more aggressive marketing and a more focused profit strategy could raise freight
traffic intensity over the medium-term, although poor rail passenger transport remains an
outstanding issue.
Figure 155: Montenegro - Rail Traffic Intensity Figure 156: Montenegro – Traffic Units per Staff
and Staff Levels
Source: UIC. Source: UIC.
351. Labor productivity, as measured by the number of traffic units per employees
working in the rail sector in Montenegro, has remained largely flat over 2005-2009. Labor
productivity fell from 132,154 traffic units per employee in 2005 to 120, 239 traffic units per
employee in 2009 (Figure 156). This has risen from 31 percent to 38 percent of the EU average.
0
50
100
150
200
250
2001 2002 2003 2004 2005 2006 2007 2008 2009
Passenger (million pass-km) Freight (million ton-km)
10%
15%
20%
25%
30%
35%
400,000
500,000
600,000
700,000
800,000
900,000
1,000,000
1,100,000
1,200,000
1,300,000
2005 2006 2007 2008 2009
Montenegro % of EU average
1,550
1,600
1,650
1,700
1,750
1,800
1,850
1,900
1,950
2,000
0
20,000
40,000
60,000
80,000
100,000
120,000
140,000
160,000
180,000
2005 2006 2007 2008 2009
Traffic units/staff Staff

Railway Reform in South East Europe and Turkey: On the Right Track? Annexes
199
There is considerable variation in labor productivity by company. Thus, with only 209 staff and
freight traffic of 104 million ton-km, Montecargo labor productivity stood at 497,608 traffic units
per employee, 83 percent of the EU average.
352. Turning to ŢICG, infrastructure staff productivity, measured as the total staff divided by the
length of the network, was equal to 3.92 staff per km in 2009—with 961 staff—which is on the
high side. Productivity at ŢPCG in 2009 was equal to 135,741 traffic units per staff. Nevertheless,
the labor figures indicate that the freight rail company has rather high labor productivity, while
ŢPCG and ŢICG have low levels of efficiency. Whereas Kosovo has 400 staff with a rail network
of 333 km, Montenegro has over 1,700 staff working on 249 km of network—suggesting
significant overstaffing. Since its creation as an independent company through May 2009, ŢICG
had made redundant 281 employees, with severance payments financed from an EBRD loan.142
Improving traffic intensity and labor productivity will require some trimming of staff and
unneeded secondary track, although ultimately for both indicators, improvements will depend on
increased traffic coming from the Port of Bar and on increased trade with neighboring countries.
353. There is a significant backlog of rail substructure and superstructure. The rail network
has suffered from chronic underfunding in the 1990s; this has resulted in deterioration to the point
of becoming unsafe. With a credit financed by EBRD, Montenegro has Euro 12 million funds for
civil works. Those funds are being used for rehabilitation of tunnels, landslides, and slopes,
reconstruction of level crossings, and electrification along the Vrbnica-Bar line. In the beginning
of 2010, the ŢICG signed a Euro 7.9 million contract with Austrian Swietelsky Bau for the
reconstruction of an 18 km section of the Belgrade-Bar line, from Bijelo Polje to the Serbian
border. An additional Euro 10 million to reconstruct this section is being financed by the
Instrument of Pre-Accession (IPA) funds. By the middle of 2011, new tracks should be in place
from Kolašin to the border with Serbia. Commercial speed of international passenger trains on the
Bar-Belgrade line is only 50 km/hour, with the main constraint being the quality of rail
infrastructure.
354. As with the rail network and infrastructure, the rolling stock in Montenegro is quite
aged. As of mid-2009, Montecargo‘s rolling stock consisted of 17 locomotives and 713 freight
wagons. Of these freight wagons, only 4 percent are less than 10 years old, with over half
exceeding 31 years of age. The average age of locomotives is high, with 71 percent exceeding 31
years, and none of the stock acquired less than 20 years ago (Figure 157). Less than 30 percent of
passenger coaches have been purchased in the last 30 years, and over 29 percent are 40 or more
years old. As with other railways in the region, the operational fleet of freight wagons, coaches
and locomotives is considerably below the total fleet size.
355. Rolling stock productivity is about a third of the EU average. Freight wagon
productivity has fluctuated significantly and stood at 24 percent of the EU average in 2009, down
from 32 percent in 2008, reflecting the large fall in freight traffic volume. Coach productivity
increased modestly over 2005-2008, to 37 percent of the EU average. In 2008, locomotive
productivity stood at 31 percent of the EU average. In 2009, only 47 percent of rolling stock was
in good working order—which reflected a high level of immobilization due to the fact that the
142
As a legal successor to ŢCG, ŢICG paid severance payments for the 281 employees equaled Euro 2.95
million in 2009. This includes 212 employees working in infrastructure and 69 working in transport. See
ŢICG (2010), Report on Business Activities and Results for 2009, Podgorica.

Railway Reform in South East Europe and Turkey: On the Right Track? Annexes
200
majority of rolling stock is close to the end of its technical working life, with an average age of 35
years.
Figure 157: Montenegro – Age Structure of Rolling Stock
Sources: ŢPCG, ŢICG.
Table 35: Montenegro - Rolling Stock Productivity
Year
Freight Wagon Productivity Coach Productivity Locomotive Productivity
Montenegro EU average =
100 Montenegro EU average = 100 Montenegro
EU average =
100
2009 145,455 24 n/a n/a n/a n/a
2008 244,605 32 1,487,162 37 8,697,788 31
2007 230,465 28 1,480,964 33 9,010,882 31
2006 167,817 21 1,301,205 30 7,105,353 26
2005 152,074 20 1,469,880 39 7,470,588 27 Source: UIC.
Financial Performance of Montenegro’s Rail Companies143
356. ŽICG remains a loss-making firm. The company, which has been in existence since
2009, has seen a considerable improvement in its financial performance, despite declining traffic
volumes. Nevertheless, it remains a loss-making company, in spite of significant budget support
(Table 36). Income from charges paid by the two operators reached Euro 2.6 million in 2009,
compared to Euro 9.7 million transferred from the central budget—TAC represent only 15
percent of total revenues. Funds from the Montenegrin budget rose by Euro 1.2 million in 2009—
but despite this and significantly higher overall total revenue, there were net losses, with a decline
from Euro 9.5 million in 2008 to Euro 3.6 million in 2009. The working ratio including budget
funds is 1.04—significant progress compared to 1.56 in 2008. Excluding budget funds, the
working ratio equaled 2.43 in 2009, an improvement over 4.5 in 2008. Collection of outstanding
debts owed by ŢPCG is an issue, and the infrastructure company has instituted legal proceedings
against it.
143
Given the organizational changes, which made ŢCG go from one vertically integrated company over
2005-2008, to two independent companies in 2009, to three by June 2009, comparisons over time are
difficult.
4
12
14
17
13
26
71
43
52
18
29
1
Locomotives
Passenger coaches
Freight wagons< 10 years
11-20 years
21-25 years
26-30 years
31-40 years
> 40 years

Railway Reform in South East Europe and Turkey: On the Right Track? Annexes
201
Table 36: Financial Performance of ŢICG, 2008-2009 (Euro millions)
2008 2009
TOTAL REVENUE 11.8 16.9
Charge paid by operators 1.2 2.6
Other income 2.9 4.6
Total operating revenues 4.1 7.2
State contribution 7.7 9.7
TOTAL EXPENDITURE 21.4 21.1
Materials 2.6 1.2
Fuel, electricity 1.9 2.0
Salaries and allowances 7.3 7.1
Outsourcing and other services 3.1 1.3
Depreciation 2.9 3.5
Other operating expenditures 2.6 5.8
Total operating expenditures 20.5 21.0
Non-operating expenditures 0.9 0.1
NET INCOME
With state contribution (9.5) (3.6)
Without state contribution (17.3) (13.9)
WORKING RATIO
With state contribution 1.56 1.04
Without state contribution 4.50 2.43 Source: ŢICG.
357. The wage bill of ŽICG represents a high share of operating revenues. Figure 158
shows that the wage bill in 2009 was equal to 99 percent of operating revenues (excluding
support from the Montenegro budget), and 42 percent of total revenues—down from 177 percent
and 61 percent respectively the preceding year. The company has implemented a redundancy
program over 2008-2009—this helps explain the reduction in the wage bill over 2008-2009 in
absolute terms and as a proportion of revenues. Nevertheless, with 3.92 staff per km of track,
ŢICG has a long way to go towards improving staff productivity in line with some of the better
performing infrastructure managers in the EU.
Figure 158: Railway Infrastructure Company of Montenegro -Wage Bill Indicators
Source: ŢICG.
36 34
177
99
61
42
0
20
40
60
80
100
120
140
160
180
200
2008 2009
Wage bill as % of operating costs Wage bill as % of operating revenue Wage bill as % of total revenue

Railway Reform in South East Europe and Turkey: On the Right Track? Annexes
202
358. Montecargo is a profitable freight company. The company posted a profit of Euro
427,364 in the second half of 2009. Revenues are dominated by international transport, which
generated Euro 2.83 million or 78 percent of the total. The wage bill was equal to 31.6 percent of
operating costs and 27.9 percent of total revenues. Profits have risen in 2010 and had reached
Euro 1.29 million in the first nine months.144
With the expectation of higher traffic in the fourth
quarter—mainly due to 20,000 tons of bauxite for export to Hungary as well as 500,000 tons for
Greece through the Port of Bar—management is expecting profits to rise to Euro 1.6 million in
2010. These results exceed the projections made by the company in its business plan, which
assumed an annual profit of only Euro 135,000 on 1,118,000 tons of cargo—43.9 percent higher
than in 2009. The strength of its financial performance is what made Montecargo an attractive
company to offer for privatization, even if on March 17, 2011, Montenegro‘s Privatisation
Council cancelled the tender talks with the sole bidder, with Romania‘s consortium Grampet. In
terms of the wage bill, Montecargo was projecting that it would be 26.3 percent of total
expenditures in 2010, which is significantly lower than for ŢPCG and ŢICG. According to
Montecargo, one of the main constraints on its operational and financial performance is the
condition of the rail infrastructure.
Table 37: Financial Performance of ŢPCG, 2009 (Euro millions)
2009
TOTAL REVENUE 11.0
Transport income 7.3
Passenger 4.7
Freight 2.6
Income from subsidies 0.6
Support by the government for restructuring 0.2
Other 2.9
TOTAL EXPENDITURE 13.7
Materials 0.4
Fuel, electricity 1.4
Salaries and allowances 6.4
Depreciation 1.9
Costs of rail infrastructure 1.1
Other operating expenditures 2.5
Total operating expenditures 13.7
Non-operating expenditures 0.0
NET INCOME
With state contribution (2.8)
Without state contribution (3.6)
WORKING RATIO
With state contribution 1.07
Without state contribution 1.16 Source: ŢPCG.
359. ŽPCG is a structurally loss-making firm, posting a loss of Euro 2.8 million in 2009. If
one excludes freight traffic, the loss in 2009 would have been Euro 5.3 million. The projection for
144
Given that the company was created in 2009 and that ŢPCG does not provide a breakdown of costs
between freight and passenger services, Montecargo‘s financial results have not been compared to those of
the freight division of ŢPCG in 2009.

Railway Reform in South East Europe and Turkey: On the Right Track? Annexes
203
2010 is a loss of Euro 2.64 million—reflecting a rise in state contributions from Euro 600,000 in
2009 to a projected Euro 2.4 million in 2010. The wage bill is on the high side, at 46 percent in
2009. State support equaled only 7.4 percent of total income in 2009, but this was projected to
rise to 31 percent in 2010. With only passenger transport, ŢPCG lost its profitable business and is
structurally loss-making. As noted in its 2010 business plan, without a further process of
restructuring or the introduction of PSO, the company remains unviable and will accumulate
mounting losses, hence the necessity of accelerating the pace of reforms aimed at enhancing
operational performance.
360. State funding to the rail sector was equal to 0.32 percent of GDP in 2009. In 2009, state
funding reached Euro 10.3 million, of which 94 percent was destined for rail infrastructure.
Following the adoption of the 2010 budget law, subsidies to rail infrastructure are Euro 9.6
million, down from Euro 9.7 million in 2009. State subsidies to rail infrastructure consist of Euro
1.1 million of investment maintenance, Euro 3.56 million for traffic management and regulation,
and Euro 4.9 million for current maintenance. In 2010, state funding to the rail sector was
estimatiated to have risen to Euro 12 million, or 0.41 percent of GDP.

Railway Reform in South East Europe and Turkey: On the Right Track? Annexes
204
THE RAILWAYS OF ROMANIA
361. Following reforms in the late 1990s, Romania has three state railway undertakings.
With the Government Ordinance No.12/7 of July 1998, the vertically integrated rail company
Societatea Nationala a Cailor Ferate Române (SNCFR) was restructured with separate joint
stock companies for passenger transport, freight transport, and infrastructure management:
respectively, CFR Calatori, CFR Marfa and CFR.145
The main objective of the reorganization was
to allow the newly created companies the opportunity to operate on a commercial basis that
would eventually allow the privatization of the successor companies. The sole shareholder of
these companies remains the Romanian state, through the Ministry of Transport and
Infrastructure. These reforms also allowed the entry of new private rail operators, and to date, the
development of private freight operators has been strong, eroding the market share of CFR Marfa.
362. The rail network of Romania is the largest of the countries included in this report, at
10,776 km. Of these, 2,909 km are double lines and 4,002 km are electrified. Network density,
defined as the length of the rail network divided by the surface area of the country, is equal to the
EU average, highlighting the size of the network. Romania is traversed by two Trans-European
Transport Network (TEN-T) rail corridors: (i) Corridor IV, which connects Arad to Bucarest and
Constanta, starting in Dresden and ending in Istanbul; and (ii) Corridor IX, which connects
Romania to Moldova, Bulgaria and beyond (Figure 159).
Operational Performance
363. Rail traffic has declined by 47 percent over the last decade, to reach 14.9 billion traffic
units (Figure 160).146
The traffic carried by the state rail companies has declined markedly over
the last decade. The combined traffic of CFR Calatori and CFR Marfa declined by 59 percent
over 2000-2009, from 28 billion million traffic units in 2000 to 11.3 billion traffic units in 2009.
Compared to 2000, CFR Calatori‘s traffic declined by 49 percent, and CFR Marfa‘s freight traffic
declined by 67 percent. In both cases, the declines in traffic volume preceded the international
global crisis. Then, traffic volumes plummeted in 2009, by 13 percent for passenger services and
by 40 percent for freight transport. In part this reflects the inability of rail transport to counteract
the growing importance of road transport. In 2008, rail represented 7 percent of passenger traffic
by inland mode, measured in pass-km, down from 14 percent in 2000 (Figure 161), and rail
represented 18.6 percent of freight traffic, down from 47.2 percent in 2005 (Figure 162). While
the declining share of rail in freight transport has been particularly acute, reflecting changes in the
economy and a decline in heavy industry, it remains above EU levels.147
145
The successor entities also included Railway Assets Administration Company (SAAF) and the Railway
Management Services Company (SMF), with the latter being absorbed by the other successor companies. 146
The data on traffic was obtained from UIC, and for freight is based on traffic in ton-km for CFR Marfa,
in addition to private rail companies GFR, Servtrans, TFG, and Unifertrans. 147
For freight, the average EU modal split was 17.1 percent in 2008, up from 16.6 percent in 2005, while
for passenger services the modal split was 9.5 percent in 2008, down from 9.8 percent in 2005. These
modal split calculations are limited to inland transport and therefore exclude air transport.

Railway Reform in South East Europe and Turkey: On the Right Track? Annexes
205
Figure 159: The Rail Network of Romania
Source: World Bank.
Figure 160: Railway Traffic in Romania - Passenger and Freight, 2000-2009
Source: UIC.
5,000
7,000
9,000
11,000
13,000
15,000
17,000
2000 2001 2002 2003 2004 2005 2006 2007 2008 2009
Passenger (million pass-km) Freight (million ton-km)

Railway Reform in South East Europe and Turkey: On the Right Track? Annexes
206
Figure 161: Passenger: Market Share of Rail
versus Roads (percentages)
Figure 162: Freight: Market Share of Rail versus
Roads (percentages)
Source: EU Statistical Pocketbook 2010 Source: EU Statistical Pocketbook 2010.
364. The steep decline in the market share of CFR Marfa reflects in part successful
competition from private operators. Figure 163 presents freight traffic volumes, in thousand
tons, over 2000-2009 for CFR Marfa and private operators. It reveals a very rapid rise in market
share for the private operators starting in 2003, increasing to 42 percent of the market by 2009.
While traffic declined by 34 percent for CFR Marfa in 2009, it only decreased by 5 percent for
the private operators—the impact of the financial crisis was therefore substantially more severe
for CFR Marfa than it was for the private companies. The burden that CFR Marfa inherited in
terms of staffing levels and rolling stock—and its inability to adjust in light of increased
competition and changing needs of clients—have adversely affected traffic volumes, and as a
concomitant, operational and financial performance.
Figure 163: CFR Marfa Traffic and Market Share vis-à-vis Private Operators (‗000 tons)
Source: CFR Marfa.
0
10
20
30
40
50
60
70
80
90
2000 2005 2006 2007 2008
Road Railways
10
20
30
40
50
60
70
80
2000 2005 2006 2007 2008
Road Railways
0
20
40
60
80
100
120
0
10,000
20,000
30,000
40,000
50,000
60,000
70,000
80,000
2000 2001 2002 2003 2004 2005 2006 2007 2008 2009
CFR Marfa Private operators CFR Marfa % share Private operators (% share)

Railway Reform in South East Europe and Turkey: On the Right Track? Annexes
207
Figure 164: Romanian State Rail Undertakings -
Traffic Intensity
Figure 165: Romanian State Rail Undertaking -
Traffic Units per Staff and Staff Levels
Source: UIC. Source: UIC.
Figure 166: CFR Calatori Traffic Units per Staff
and Staff Levels
Figure 167: CFR Marfa Traffic Units per Staff and
Staff Levels
Source: UIC. Source: UIC.
Figure 168: CFR Staff per KM of Track
Figure 169: Romanian Rail Companies Compared
to EU Average, 2009 (EU=100)
Source: UIC. Source: UIC.
365. Rail traffic intensity of the state rail undertakings has nearly halved over 2005-2009,
reflecting poor traffic development. Rail traffic density stood at 1,937,350 traffic units per km
of network in 2009, down by 46 percent compared to 2006. Traffic intensity is being pulled down
30%
35%
40%
45%
50%
55%
1,000,000
1,100,000
1,200,000
1,300,000
1,400,000
1,500,000
1,600,000
1,700,000
1,800,000
1,900,000
2,000,000
2005 2006 2007 2008 2009
Romania % of EU average
58,000
59,000
60,000
61,000
62,000
63,000
64,000
65,000
66,000
100,000
150,000
200,000
250,000
300,000
350,000
2005 2006 2007 2008 2009
Traffic units/staff Staff
15,800
16,000
16,200
16,400
16,600
16,800
17,000
17,200
30,000
32,000
34,000
36,000
38,000
40,000
42,000
44,000
46,000
48,000
2005 2006 2007 2008 2009
Traffic units/staff Staff
16,000
16,500
17,000
17,500
18,000
18,500
19,000
19,500
30,000
35,000
40,000
45,000
50,000
55,000
60,000
65,000
70,000
2005 2006 2007 2008 2009
Traffic units/staff Staff
26,000
26,500
27,000
27,500
28,000
28,500
29,000
2.40
2.45
2.50
2.55
2.60
2.65
2.70
2005 2006 2007 2008 2009
Infrastructure staff per km
32
25
21
48
34
100
Staff Productivity
Locomotive productivity
Freight productivity
Coach productivity
Traffic density
Network density
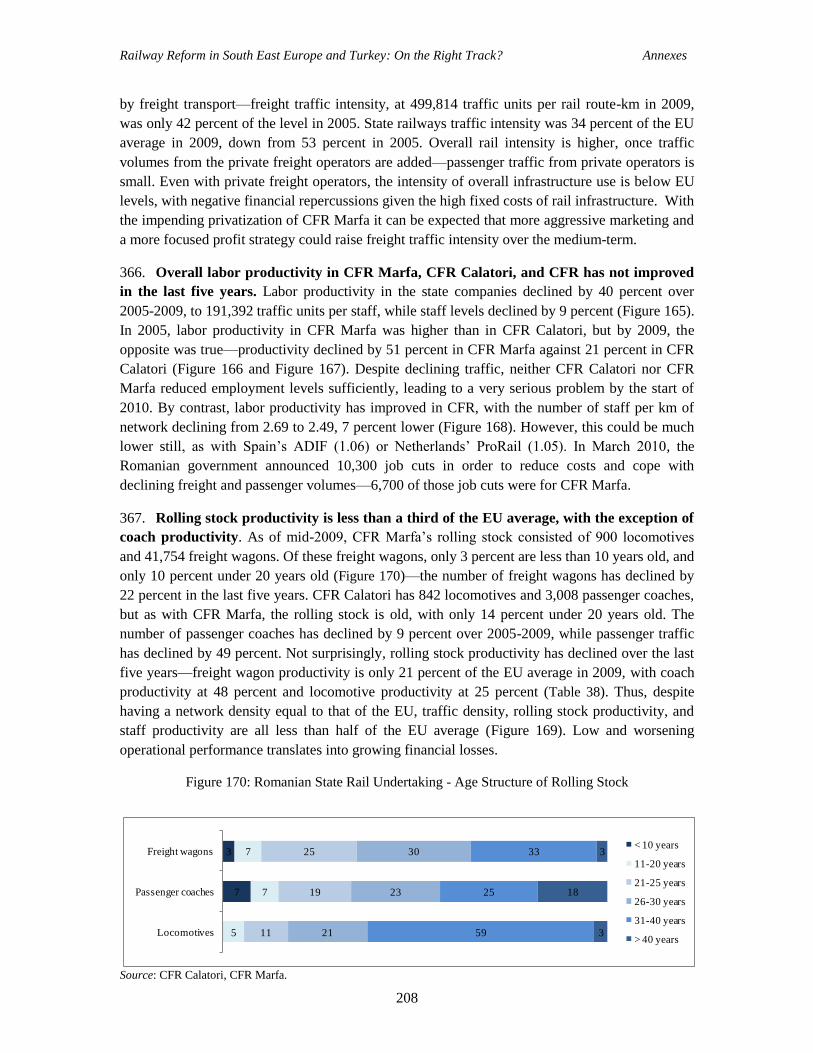
Railway Reform in South East Europe and Turkey: On the Right Track? Annexes
208
by freight transport—freight traffic intensity, at 499,814 traffic units per rail route-km in 2009,
was only 42 percent of the level in 2005. State railways traffic intensity was 34 percent of the EU
average in 2009, down from 53 percent in 2005. Overall rail intensity is higher, once traffic
volumes from the private freight operators are added—passenger traffic from private operators is
small. Even with private freight operators, the intensity of overall infrastructure use is below EU
levels, with negative financial repercussions given the high fixed costs of rail infrastructure. With
the impending privatization of CFR Marfa it can be expected that more aggressive marketing and
a more focused profit strategy could raise freight traffic intensity over the medium-term.
366. Overall labor productivity in CFR Marfa, CFR Calatori, and CFR has not improved
in the last five years. Labor productivity in the state companies declined by 40 percent over
2005-2009, to 191,392 traffic units per staff, while staff levels declined by 9 percent (Figure 165).
In 2005, labor productivity in CFR Marfa was higher than in CFR Calatori, but by 2009, the
opposite was true—productivity declined by 51 percent in CFR Marfa against 21 percent in CFR
Calatori (Figure 166 and Figure 167). Despite declining traffic, neither CFR Calatori nor CFR
Marfa reduced employment levels sufficiently, leading to a very serious problem by the start of
2010. By contrast, labor productivity has improved in CFR, with the number of staff per km of
network declining from 2.69 to 2.49, 7 percent lower (Figure 168). However, this could be much
lower still, as with Spain‘s ADIF (1.06) or Netherlands‘ ProRail (1.05). In March 2010, the
Romanian government announced 10,300 job cuts in order to reduce costs and cope with
declining freight and passenger volumes—6,700 of those job cuts were for CFR Marfa.
367. Rolling stock productivity is less than a third of the EU average, with the exception of
coach productivity. As of mid-2009, CFR Marfa‘s rolling stock consisted of 900 locomotives
and 41,754 freight wagons. Of these freight wagons, only 3 percent are less than 10 years old, and
only 10 percent under 20 years old (Figure 170)—the number of freight wagons has declined by
22 percent in the last five years. CFR Calatori has 842 locomotives and 3,008 passenger coaches,
but as with CFR Marfa, the rolling stock is old, with only 14 percent under 20 years old. The
number of passenger coaches has declined by 9 percent over 2005-2009, while passenger traffic
has declined by 49 percent. Not surprisingly, rolling stock productivity has declined over the last
five years—freight wagon productivity is only 21 percent of the EU average in 2009, with coach
productivity at 48 percent and locomotive productivity at 25 percent (Table 38). Thus, despite
having a network density equal to that of the EU, traffic density, rolling stock productivity, and
staff productivity are all less than half of the EU average (Figure 169). Low and worsening
operational performance translates into growing financial losses.
Figure 170: Romanian State Rail Undertaking - Age Structure of Rolling Stock
Source: CFR Calatori, CFR Marfa.
7
3
5
7
7
11
19
25
21
23
30
59
25
33
3
18
3
Locomotives
Passenger coaches
Freight wagons< 10 years
11-20 years
21-25 years
26-30 years
31-40 years
> 40 years

Railway Reform in South East Europe and Turkey: On the Right Track? Annexes
209
Table 38: Romanian State Rail Undertakings - Rolling Stock Productivity
Year
Freight Wagon
ProductivityYear Coach Productivity Locomotive Productivity
CFR -
Marfa
EU
average
= 100
CFR-
Calatori
EU
average
= 100
CFR Marfa
EU
average
= 100
CFR
Calatori
EU
average
= 100
Total
EU
average
= 100
2009 128,994 21 1,986,370 48 5,984,444 23 7,096,200 27 6,521,814 25
2008 209,482 28 2,282,443 57 9,914,002 36 8,177,170 29 9,078,375 33
2007 203,166 24 2,317,088 51 10,624,609 37 8,705,399 30 6,521,814 23
2006 227,654 28 2,381,361 55 12,134,172 44 9,502,952 35 9,078,375 33
2005 242,020 32 2,404,834 63 13,097,264 48 9,397,875 34 9,721,701 35 Source: UIC.
Financial Performance of Romania’s State Rail Companies
368. All three state railways operate with financial losses over the course of 2005-2009. In
2008, CFR Calatori posted a loss of Euro 71 million, despite Euro 312 million of funds through
PSC and funds to subsidize passenger tickets in the amount of Euro 64 million. The cost coverage
ratio improved in 2008 compared to 2005, but worsened in 2009 given the downturn in traffic.
CFR Marfa posted financial losses in 2008 and 2009, which climbed to Euro 71 million in 2009,
reflecting the impact of the global financial crisis and declining market share vis-à-vis private rail
operators.148
In January 2009, CFR Marfa started to identify and implement expenditure-cutting
measures, part of a restructuring and reorganization program for 2009-2010. Despite these efforts,
the working ratio rose to 1.2, and the cost coverage ratio declined to 0.79. CFR experienced
losses throughout 2005-2009, rising to Euro 291 million in 2009 and a working ratio of 1.85.
Given the difficult fiscal situation in Romania, and strict fiscal targets in the context of the Stand-
by Arrangement with the IMF, Euro 832 million of budget support to the rail sector—a large
amount of support—has proved unable to reverse the impact of poor operational performance on
financial results.
369. Given the losses in CFR Marfa, the government has decided to privatize the company.
According to its Letter of Intent dated June 16, 2010, the Romanian government remains
committed to privatizing the freight company by end-March 2011, as part of its efforts to reduce
losses among the largest loss-making public companies.149
In 2009, CFR Marfa implemented
cost-cutting measures, but was not able to reduce the number of employees, one of its main costs.
It systematically postponed the payments of its debts to the national budget, to fuel suppliers, and
to companies repairing rolling stock. The restructuring program, together with 6,700 jobs cut in
the first quarter of 2010, brought the number of personnel to 11,030; it is expected to decline by a
148
Revenues for international freight transported declined by 60 percent, from Euro 178 million in 2008 to
Euro 61 million in 2009, while domestic freight transported declined by 25 percent, to Euro 173 million in
2009.
149 IMF, 2010, Romania—Staff Report for the 2010 Article IV Consultation, Fourth Review Under the
Stand-By Arrangement, and Requests for Modification and Waiver of Nonobservance of Performance
Criteria—Staff Report; Staff Supplement; Public Information Notice and Press Release on the Executive
Board Discussion; Statement by the Executive Director for Romania. IMF Country Report No. 10/227, July
2010, p.97.

Railway Reform in South East Europe and Turkey: On the Right Track? Annexes
210
further 3,000-4,000 during the course of the year, which should lead to a significant reduction in
the wage bill. In 2009, the wage bill was equal to 56 percent of operating revenues, up from 44
percent in 2008 (Figure 172). Other measures adopted in 2010 include: (i) adapting the traffic
schedule on low traffic sections; (ii) reorganizing traction units and wagon subunits; and (iii)
eliminating activities on traffic sections where the operation of local trains at least once a week is
not justified. In the first quarter of 2010, net losses declined by 44 percent, to Euro 16 million,
compared to the same period in 2009.
Table 39: CFR Calatori, CFR Marfa, and CFR: Financial Performance (Euro millions)
2005 2006 2007 2008 2009
CFR Calatori
Total revenue 396 703 650 647 n/a
State contribution (excl PSC) 48 53 65 64 n/a
Total expenditure 477 595 690 718 n/a
Net income
With state contribution (81) 108 (40) (71) n/a
Without state contribution (128) 55 (105) (135) n/a
Working ratio
With state contribution 1.13 0.78 0.96 0.96 n/a
Without state contribution 1.28 0.84 1.06 1.07 n/a
State capital subsidies 19 76 123 178 n/a
Cost coverage ratio 0.83 1.18 0.94 0.90 n/a
CFR Marfa
Total revenue 534 531 568 496 276
State contribution 0 0 0 0 0
Total expenditure 527 522 567 526 347
Net income 7 8 2 (30) (71)
Working ratio 0.96 0.95 0.96 1.02 1.20
Cost coverage ratio 1.01 1.02 1.00 0.94 0.79
CFR
Total revenue 657 450 454 489 301
State contribution 114 11 8 29 13
Total expenditure 706 641 564 701 592
Net income
With state contribution (49) (190) (110) (212) (291)
Without state contribution (162) (201) (119) (241) (304)
Working ratio
With state contribution 0.97 1.24 1.15 1.33 1.85
Without state contribution 1.18 1.27 1.18 1.41 1.94
State capital subsidies 80 139 51 67 n/a
Cost coverage ratio 0.93 0.70 0.80 0.70 0.51 Sources: CFR Calatori, CFR Marfa, CFR.
370. The wage bill of both CFR Calatori and CFR remain very high. Although the wage bill
is equal to only 27 percent of CFR Calatori‘s revenue, this rises to 84 percent when all forms of
budget support are excluded (Figure 171)—a very rapid rise compared to five years earlier. In
the case of CFR, salaries and other employee expenses are equal to 70 percent of total revenues in
2009 (Figure 173), a large and unsustainable proportion; this rises to 94 percent of total revenue,
if one adds social security contributions.

Railway Reform in South East Europe and Turkey: On the Right Track? Annexes
211
371. An improvement in financial performance for CFR Calatori will require revising a 4-year
service plan in order to create adequate incentives for efficiency improvements over time through
a new, more affordable but fully funded PSC. Because there are unfunded public service
obligations, it is important for CFR Calatori to review which stations and branches would no
longer be served. A less expensive option could be for the government to offer PSC contracts for
bus services. Likewise, CFR needs to divest, mothball, or close all branch lines on which the
affordable PSC and new CFR Marfa services would leave no significant train services. For the
remaining lines, it will be critical to specify the unfunded maintenance needs, so that budget
funds are made available to this end. Reductions in train services and network size, in line with
existing and project demand—together with incentives to improve efficiency—will be critical to
reverse the performance of the last five years for CFR Calatori and CFR.
Figure 171: CFR Calatori – Wage Bill Indicators Figure 172: CFR Marfa – Wage Bill Indicators
Source: CFR Calatori. Source: CFR Marfa.
Figure 173: CFR – Wage Bill Figure 174: Investments per KM of Track (Euro)
Source: CFR. Source: CFR.
21 20 23 2530
52 5256
63
84
24
17
24 27 27
0
10
20
30
40
50
60
70
80
90
2005 2006 2007 2008 2009
% of operating costs
% of operating revenue (excl state contribution)
% of total revenue
414544
56
0
10
20
30
40
50
60
2008 2009
% of operating costs % of operating revenue
38 37
73 7369 70
0
10
20
30
40
50
60
70
80
2008 2009
% of operating costs
% of operating revenue (excl state contribution)
% of total revenue
209
324 324
151
19,394
30,06430,498
14,050
100
150
200
250
300
350
10,000
15,000
20,000
25,000
30,000
35,000
2005 2006 2007 2008
Inv
estm
ents
(E
uro
mil
lion
s)
Inv
estm
ent
per
km
of
rrac
k (
Eu
ros)
Investments Investment per km

Railway Reform in South East Europe and Turkey: On the Right Track? Annexes
212
Figure 175: CFR Calatori – Unit Revenue and
Unit Costs (Euro cents)
Figure 176: CFR Marfa – Unit Revenue and Unit
Costs (Euro)
Source: CFR Calatori. Source: CFR Marfa.
372. Track access charges are the main source of revenue for CFR. Track access charge
revenues are equal to 73 percent of CFR‘s revenues in 2009, and as a proportion they have risen
considerably, up from 44 percent in 2004. Romania has implemented a methodology for TAC
calculation, which generates a specific tariff for each train function of its type (passenger or
freight), tonnage, distance of circulation, or services required from the infrastructure manager.
Figure 177 presents the share of train km for CFR Calatori and CFR Marfa, excluding private
operators, and the share of TAC each pays. Over 60 percent of TAC is paid by CFR Calatori,
which accounts for 86 percent of traffic. Passenger trains use over two-thirds of existing railway
transport capacity, use almost all railway lines, and need speeds up to 160 km/hour on mainlines.
Freight trains use a reduced length of railway network—concentrated on main lines and using a
limited number of local railway lines and limited number of railway stations—and do not need
speeds higher than 100 km/hour. Thus, the current distribution of revenues suggest that CFR
Marfa is partly subsidizing CFR Calatori. Figure 178 presents the evolution of average TAC per
train-km for both state railways—with passenger services paying more than 50 percent less than
freight transport.
Figure 177: Share of Passenger versus Freight
Train KM and TAC, 2009 (percentages)
Figure 178: Average TAC per Train-km, 2009
(Euro/train-km)
Sources: CFR, UIC. Sources: CFR, UIC.
3.03.5
4.7 5.0
5.9
7.4
9.3
10.3
2005 2006 2007 2008
Unit total revenue Unit operating cost
4.14.6
5.65.4
5.1
3.84.2
5.2 5.3
6.4
2005 2006 2007 2008 2009
Unit total revenue Unit operating cost
86.0
65.8
14.0
34.2
Train-km TAC
CFR Calatori
CFR Marfa
2.4 2.52.7
2.4 2.5
3.93.6
4.4
5.25.4
2005 2006 2007 2008 2009
Passenger Freight

Railway Reform in South East Europe and Turkey: On the Right Track? Annexes
213
373. Rail infrastructure investments averaged Euro 252 million over 2005-2008, and
remain insufficient to tackle the need to upgrade the network along priority axes. However,
the program of medium-term rail infrastructure investments financed from EU grants and co-
financed by the Romanian government is ambitious, with planned annual investments of Euro
457 million, more than triple investment levels in 2008. The Sector Operational Programme for
Transport (SOP-T), prepared by the government in 2007-2008, defines the investments that
would be financed over 2007-2013 for the transport sector, including railways. For rail
infrastructure, investments total Euro 3.2 billion for the entire period, of which the EU is
financing Euro 1.83 billion through the Cohesion and European Regional Development Fund,
with the remainder to be financed by the Government. The program focuses on the modernization
and development of TEN-T priority axis 22, for which 83 percent of the funds are destined, but
also includes the rehabilitation and modernization of railway stations and priority railway bridges
and tunnels. However, to date the rate of implementation of SOP-T has been disappointing, with
CFR upgrading on average only 60 km of track in each of the past four years. This is putting into
question the capacity of CFR to improve the quality and stock of its rail infrastructure, with
negative effects on average travel speeds. The average speed of its freight trains is about 17.5
km/hour, while the EU average is 70 km/hour.150
Raising commercial speeds requires
maintenance, rehabilitation and modernization of rail infrastructure on high traffic track, but to do
so will require CFR to improve its capacity to implement and manage projects. This, in turn,
requires strengthened administrative capacity and predictability of financing from the
Government.
Figure 179: CFR Rail Infrastructure Investments, 2005-2008
Source: CFR
374. As a share of GDP, state support to the rail sector has been increasing in the last five
years. State support to the rail sector was equal to 0.63 percent of GDP in 2000, declining to a
low of 0.5 percent of GDP in 2005, before rising to 0.60 percent of GDP in 2008 (Figure 180). In
absolute terms, state support has risen from Euro 256 million at the start of the decade to Euro
832 million in 2008. State funds finance the public service obligation (PSO) contracts, subsidized
tickets and investments for passenger services, as well as rail infrastructure overhaul and
investment, and debt repayments—the freight company receives no subsidies. Overall, the
150
The average speed for passenger trains is 48 km/hour.
209
324 324
151
100
150
200
250
300
350
10,000
15,000
20,000
25,000
30,000
35,000
2005 2006 2007 2008
Inv
estm
ents
(E
uro
mil
lio
ns)
Inv
estm
ent p
er k
m o
f rr
ack (
Euro
s)
Investments Investment per km

Railway Reform in South East Europe and Turkey: On the Right Track? Annexes
214
subsidy level is high due to the high PSO contract—which does not present value for money, and
leads to under-utilized trains running in parts of the network that should be closed. It should be
noted that despite the high subsidies, CFR Calatori operates with financial losses—the current
model of rail services is therefore not affordable given the current fiscal situation and declining
market demand.
Figure 180: State Contribution to Romanian Rail Sector, 2000-2008
Sources: CFR Calatori, CFR, IMF.
375. Less than a quarter of state funds are allocated for rail infrastructure. Whereas 71
percent of budget funds to the rail sector were allocated to the PSO in 2000, this had fallen to 37
percent by 2008 (Figure 181). The amount of funds allocated to investment have been rising,
from Euro 44 million in 2000 to Euro 349 million in 2008, of which Euro 137 million was for
infrastructure overhaul and investments. Budget funds for passenger transport, in terms of PSO,
subsidies to tickets, investments, and debt service, equaled Euro 642 million, or 77 percent of
total funds allocated to the rail sector. Funds for infrastructure investment rose from Euro 8
million in 2005 to Euro 132 million in 2008, but funds for infrastructure overhaul remain
limited—Euro 10 million in 2008. The PSO and subsidized tickets, by taking 44 percent of
budget funds, do not leave enough funds to support infrastructure overhaul and investments. Only
23 percent of budget funds were dedicated to rail infrastructure in 2008, up from17 percent in
2000, compared to 77 percent for passenger services. Reviewing the PSO would not allow a
reduction in overall budget support to the rail sector, but would enable more funds to be
earmarked for rail infrastructure as opposed to transport services.
376. The operational and financial performance of the three state railway undertakings
highlights the importance of creating a profit-oriented management culture. Despite
undertaking considerable institutional reforms in the1990s, the operational and financial
performance of CFR Calatori, CFR Marfa, and CFR has been disappointed to date. On the
management side, there have been unclear mandates to manage the rail companies, and unstable
executive management. For example, over 2003-2010, CFR had no less than six changes in the
general manager. Corporate governance of these joint stock companies is weak, with boards of
directors that do not have seem to have well-defined powers, and weak reporting and disclosure
requirements. The legal and organizational changes that occurred with the creation of the three
state rail companies was not accompanied by a new mentality or culture, focused on meeting
market demands, structured by lines of business. It is also clear that there is a misallocation of
public funds, with too much going to passenger transport. Reversing the downward trend will
0.63
0.57
0.56
0.63
0.56
0.50
0.69
0.54
0.60
0.45
0.50
0.55
0.60
0.65
0.70
0.75
0
100
200
300
400
500
600
700
800
900
2000 2001 2002 2003 2004 2005 2006 2007 2008
Total budget support (Euro millions) % of GDP
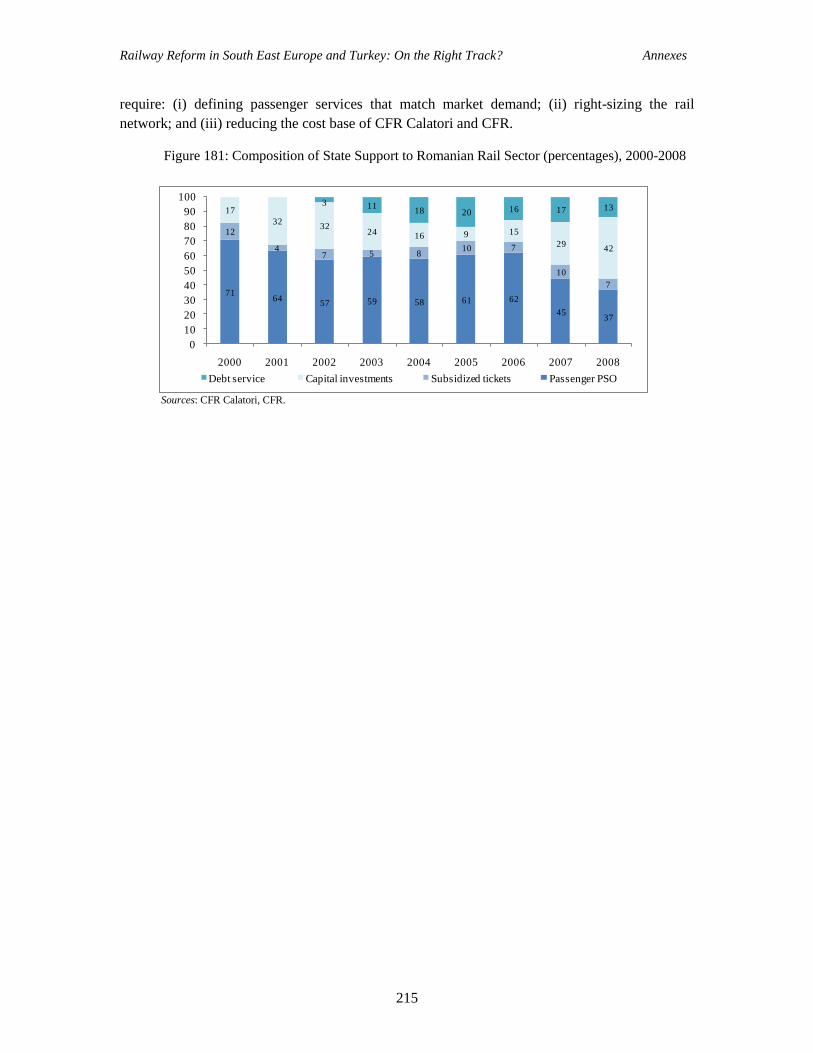
Railway Reform in South East Europe and Turkey: On the Right Track? Annexes
215
require: (i) defining passenger services that match market demand; (ii) right-sizing the rail
network; and (iii) reducing the cost base of CFR Calatori and CFR.
Figure 181: Composition of State Support to Romanian Rail Sector (percentages), 2000-2008
Sources: CFR Calatori, CFR.
7164
57 59 58 61 62
4537
12
47 5 8
10 7
10
7
17
3232
24 16 9 15
2942
3 1118 20 16 17 13
0
10
20
30
40
50
60
70
80
90
100
2000 2001 2002 2003 2004 2005 2006 2007 2008
Debt service Capital investments Subsidized tickets Passenger PSO

Railway Reform in South East Europe and Turkey: On the Right Track? Annexes
216
SERBIAN RAILWAYS
377. Serbian Railway (Želzenice Srbije, ŽS) is the state-owned railways created on March
1, 2005. This is the date when a new railway law and decree on the reorganization of the railways
were enacted. The operating assets of the former railway ZTP were transferred to Serbian
Railways. The Parliament of the Republic of Serbia passed the new Law on Railways on
February 17, 2005; it became effective on March 1, 2005. The Law indicates that public rail
infrastructure is owned by the state and open to all licensed rail transporters. Initially, Serbian
Railways will be the public rail infrastructure manager, but the law allows the licensing of other
infrastructure managers. Likewise, it allows for multiple rail operators, of which the Serbian
Railways freight and passenger units will be only two. The new law also allows the Government
to provide subsidy through the introduction of a Public Service Obligation (PSO) to continue
loss-making passenger services—thereby making the provision of any subsidy explicit for each
and every loss-making service—and to consolidate the historic debt of the railways.
378. The reform of the railway sector in Serbia remains very much a work-in-progress,
with delays leading to considerably adverse impacts on operational and financial
performance. Serbian Railways faces a number of immediate challenges. These include: (i)
obtaining sufficient funding to maintain and improve rail infrastructure, and clear the backlog of
deferred maintenance, manifest in the form of speed restrictions on the network, and eliminate
critical bottlenecks; (ii) defining and implementing a network rationalization program in order to
focus resources on the most important parts of the network; (iii) obtaining sufficient investment to
replace its life-expired rolling stock; (iv) developing and introducing a new contractual
relationship between the Government and Serbian Railways for socially necessary but loss-
making passenger services through Public Service Obligation/Contracts (PSO/PSC); (v) financial
restructuring through consolidation of historical debt and liabilities of Serbian Railways; (vi)
capacity-building to strengthen railway maintenance and rehabilitation practices; (vii) introducing
of a strategic approach to network management and investment planning; (viii) implementing an
appropriate track access charge system; (ix) realizing further productivity improvements,
particularly that of its labor force; and (x) developing and establishing an integrated financial and
cost accounting system.
Operational Performance
379. Freight and passenger traffic volumes have been moving in opposite directions over
2000-2007, whereas in 2008-2009 both suffered declines due to the impact of the
international financial crisis. In 2009, passenger traffic declined to 582 million passenger-km,
down from 648 million in 2008, and freight traffic plummeted by 32 percent, to 2,723 million
ton-km. As Figure 182 shows, the rise in traffic volume has been uneven, with a steady rise in
freight traffic in 2000-2007, compensating for a decline in passenger traffic over the same period.
If we take traffic in 2000 as a base, freight traffic rose by 42 percent over 2000-2009; in stark
contrast, passenger traffic declined by 58 percent. Overall, freight and passenger traffic equaled
3,305 million traffic units in 2009, while in 2000 total traffic equaled 3,304 million traffic units—
thus, there has been no increase in the period, with traffic peaking at 5,078 million traffic units in
2006, and declining thereafter, well before the international financial crisis.

Railway Reform in South East Europe and Turkey: On the Right Track? Annexes
217
Figure 182: Serbian Railways – Passenger and Freight Traffic, 2000-2009
Source: UIC.
380. Rail traffic intensity has declined over 2005-2009, representing a little over a quarter
of the EU average. In 2009, traffic intensity in Serbia with 867,682 traffic units per rail route-
km—is equivalent to 28 percent of the average traffic intensity of the EU, compared to 38 percent
in 2000. Considering the high percentage of infrastructure fixed costs, lower traffic intensity
makes access to the country‘s infrastructure more expensive than for other railway networks.
Traffic intensity is being pulled down by passenger services. In 2009, freight traffic intensity, at
714,886 traffic units per rail route-km, is equal to 56 percent of the EU average—with the latter
measure twice as high as the total traffic density vis-à-vis the EU average. Nevertheless, the
intensity of infrastructure usage remains low, with negative financial implications given the high
fixed-costs of rail infrastructure.
Figure 183: Serbia – Rail Traffic Intensity Figure 184: Serbia – Traffic Units per Staff and
Staff Levels
Source: UIC. Source: UIC.
0
500
1,000
1,500
2,000
2,500
3,000
3,500
4,000
4,500
2000 2001 2002 2003 2004 2005 2006 2007 2008 2009
Passenger (million pass-km) Freight (million ton-km)
20%
22%
24%
26%
28%
30%
32%
34%
36%
38%
40%
600,000
700,000
800,000
900,000
1,000,000
1,100,000
1,200,000
1,300,000
1,400,000
2005 2006 2007 2008 2009
Serbia % of EU average
17,500
18,000
18,500
19,000
19,500
20,000
20,500
21,000
21,500
22,000
22,500
0
50,000
100,000
150,000
200,000
250,000
300,000
2005 2006 2007 2008 2009
Traffic units/staff Staff

Railway Reform in South East Europe and Turkey: On the Right Track? Annexes
218
Figure 185: The Rail Network of Serbia
Source: World Bank.

Railway Reform in South East Europe and Turkey: On the Right Track? Annexes
219
381. Transit traffic has been the large driver in the growth of freight traffic over the
decade. Domestic traffic in 2006 was only 546 million ton-km, or 15 percent of the total,
declining to a mere 399 million ton km in 2009, or 13 percent. According to Serbian Railways, 87
percent is international transport, and in turn this is dominated by transit traffic, which accounts
for 66 percent of freight traffic in terms of ton-km. Freight traffic started to decline in the first
half of 2008. The decline accelerated in 2009, when industrial production fell by 12.1 percent,
local clients such as US Steel Serbia reduced freight transport needs significantly, and European
freight forwarders reduced their traffic through Serbia. A mild recovery was underway in the
second half of 2009.151
However, low freight traffic volumes are also due to the poor condition of
the infrastructure, and the lack of adequate shunting engines and diesel locomotives.152
The main
commodities carried are coal and coke, metallurgy products, and ores and concentrates. The
average commercial speed on freight trains fell from 25.1 km/hour in 2006 to 23.6 km/hour in
2007; it rose to 23.9 km/hour in 2008 and to 25.19 km/hour in 2009.
382. Poor performance of the passenger sector has continued during the decade, with
significant traffic decline. Passenger traffic has been declining continuously over the decade—
from 1,387 million pass-km in 2000, to 762 million pass-km in 2007, and to 582 million pass-km
in 2009. Out of 8.37 million passengers transported in 2009, 36 percent used Belgrade‘s urban
rail system Beovoz, although this market segment generated a mere 6 percent of total revenues.
The number of international passengers, at 688,000 in 2009 is small, and nearly half that of 2007.
Although international passenger transport volumes are low and equal to a mere 8 percent of the
total, revenues from these services account for 53 percent of total passenger revenues. Other
domestic passenger transport accounts for 56 percent of the total number of passengers
transported, and around 40 percent of revenue. These figures suggest that revenue collected from
the urban rail system is sub-optimal, due to a combination of low tariffs, significant fare evasion,
and poor-quality unreliable service.
383. Although staffing levels have declined in recent years, staff productivity as measured
by traffic unit per staff, has not improved over 2005-2009. At the start of the decade staff
numbers stood at 32,800, but had declined to 22,271 by 2005 and to 19,249 by 2009 (Figure 184).
Staff productivity, measured by total traffic units—freight million ton-km and million passenger-
km—has not improved significantly despite the reductions in staff: from 194,603 in 2005 to
232,259 in 2008, before dropping to 171,697 in 2009. Productivity rises have slowed over 2005-
2009. This reflects declining passenger volumes, a slowdown in voluntary departures, and the
impact of the financial crisis on traffic volumes in the second half of 2008 and in 2009. Despite a
reduction of about 12,000 employees—a third of its work force—in the past six years, Serbian
Railways remains overstaffed. To put this in perspective, Serbia‘s productivity level is only 28.7
of the EU average, which stood at 597,618 traffic units per employee in 2009. Reductions in staff,
which have occurred on a voluntary basis, have been dependent on budget support for financing
151
Serbian Railways (2010a), Business Plan Implementation Report of the PE ―Serbian Railways‖ for
2009, Belgrade, April 2010. 152
This may be not only to insufficient locomotives but suboptimal fleet management. Locomotives are
often not available when needed due to train delays and the inability to fulfill scheduled timetables.

Railway Reform in South East Europe and Turkey: On the Right Track? Annexes
220
of severance payments, because Serbian Railways uses funds from the central government for
payment of wages.153
384. Low commercial speeds, lack of attractive coaches, and limited rolling stock adversely
affect rail passenger services. The average commercial speed for passenger services in 2007 was
only 43.3 km/hour, and this has remained unchanged over 2008-2009. Apart from the low speed,
factors adversely affecting passenger transport include train cancellations due to lack of traction
and train delays caused by slow runs—all of which make passenger services unattractive when
compared to bus services or cars. For 2010, Serbian Railways is forecasting a modest recovery, to
645 million passenger-km. The broader issue of how Serbian Railways can continue operating the
same level of services with traffic levels equal to less than half of the start of the decade remains
an unanswered question. Closure of services that cannot be justified from a public service
perspective and increased efforts to raise urban rail transport revenue appear critical.
385. Railway infrastructure is aging and in poor condition. There are about 3,809 km of
network, of which only 31 percent is electrified, and 7 percent is double-tracked, with an average
age of 38 years.154
Line speeds do not exceed 60 km/hour on 57 percent of the network, and only
3 percent of the network has a line speed that exceeds 100 km/hour—this, despite the fact that the
average design speed is 94.5 km/hour. In 39 percent of the network the loading capacity is below
18 tons. Insufficient investments in maintenance have caused the instability and deformation of
tracks, eroded tracks, and rotten sleepers. To preserve safety, temporary speed restrictions have
been introduced, which is actually something of a misnomer, because limited resources mean that
the restriction stays for a lengthy period of time. In 2009, 33 slow runs on 658 km of track were
introduced due to the poor conditions of superstructure and substructures in order to maintain
traffic safety levels. About 57 percent of the main lines last had a major overhaul more than thirty
years ago, with only 294 km in the last 10 years.
386. Important backlogs have accumulated with regard to the telecommunication systems,
signaling systems, power supply, catenaries, and interlocking systems. The average ages of
these asset types are presented in Figure 186, with the age of over three-quarters of them 31-40
years. This also reveals the limited nature of investments in the last 10 years—in all cases, 2
percent or less has been modernized. The poor condition of the rail infrastructure has not only
affected service quality and reliability, but will also lead to higher future costs, because costs of
rehabilitation of infrastructure are high when compared to timely maintenance.
153
Serbian Railways uses subsidies from the central government for payment of wages. See Serbian
Railways (2010), Business Plan of the PE ―Serbian Railways‖ For 2010, Belgrade, February 2010. 154
Total network length includes 334 km in Kosovo and Metohija, 39 km used only as factory sidings, and
180 km which are out of service.

Railway Reform in South East Europe and Turkey: On the Right Track? Annexes
221
Figure 186: Serbian Railways - Age Structure of Rail Infrastructure Equipment
Source: Serbian Railways.
387. The rolling stock fleet is aged and in need of replacement, but the overall situation is
better than with rail infrastructure. The locomotive fleet consisted of 413 locomotives in 2009,
but the active fleet was 119. The current fleet of active freight wagons totals approximately 8,980
wagons; a little over a third is in good working order—the average operational age is in excess of
30 years of age, close to the end of their operational life. Serbian Railways estimates that 67
percent of its locomotives, 69 percent of its passenger cars, and 46 percent of its freight wagons
are over 30 years old. It is clear that a considerable portion of this fleet will need to be retired
from operational service in the next few years (Figure 187). In addition, the technical
characteristics of the current fleet are inconsistent with current and projected market demands. A
modernization plan, partly funded by an EBRD loan includes the delivery of 30 electric motor
trains.
Figure 187: Serbian Railways - Age Structure of Rolling Stock
Source: Serbian Railways.
388. Rolling stock productivity is less than 50 percent of the EU average, and has
deteriorated over 2005-2009. Freight wagon productivity increased by 46.3 percent over 2005-
2008, attaining 64 percent of the EU average, before declining in 2009 due to the 32.4 percent
decline in freight traffic, measured in ton-km. Likewise, locomotive productive rose over 2005-
2008 by nearly 20 percent, before declining by 59 percent in 2009. However, coach productivity
has performed poorly throughout 2005-2009, reflecting continuing declines in passenger traffic—
by 2009 coach productivity stood at a mere 18 percent of the EU average. Low utilization levels
of rolling stock reflect in part low availability of fleet due to the operational fleet being a fraction
of the total. For freight wagons, the operational fleet is only 54 percent of the total stock, and for
passenger coaches the figure is 28 percent. However, it is also likely to reflect low fleet
management efficiency. Given the low and continuously declining passenger volumes, a
downsizing of the coach fleet appears sensible. The combination of these factors generate higher
2
1
2
1
2
1
2
1
15
15
10
15
75
77
82
77
6
6
5
6
Signalling System
Relay/interlocking sytem
Catenary system
Telecommunication installations
< 10 years 11-20 years 21-30 years 31-40 years > 40 years
3
5
11
2
2
3
13
15
22
16
9
17
36
38
39
31
31
7
Locomotives
Passenger coaches
Freight wagons< 10 years
11-20 years
21-25 years
26-30 years
31-40 years
> 40 years

Railway Reform in South East Europe and Turkey: On the Right Track? Annexes
222
freight and passenger operating costs for Serbian Railways, making them less competitive vis-à-
vis trucks and buses.
Table 40: Serbian Railways - Rolling Stock Productivity
Year
Freight Wagon Productivity Coach Productivity Locomotive Productivity
Serbia EU average = 100 Serbia EU average = 100 Serbia EU average = 100
2009 303,229 49 742,347 18 10,015,152 38
2008 482,232 64 826,531 21 14,125,680 51
2007 506,944 61 972,360 21 15,094,653 53
2006 469,492 58 1,079,082 25 14,935,294 54
2005 329,704 44 1,086,735 29 11,873,973 43 Source: UIC.
Financial Performance and Investment Plans of Serbian Railways
389. Financial performance remains weak, with continued financial losses over the course
of 2005-2009. In 2008, financial losses reached Euro 193 million, despite revenues from the
Serbian central budget equal to Euro 138 million. In the last five years, Serbian Railways has
generated losses despite higher traffic volumes, because commercial revenues cover only a small
fraction of total operating costs, and total budgetary support in 2009 was equal to 72 percent of
operating revenues (Table 41). In 2009, freight and passenger revenues accounted for 57 percent
and 9 percent of the railway commercial revenues respectively, with other operating revenues
generating the remainder. The working ratio, a key financial indicator, improved from 1.67 in
2005 to 1.52 in 2008, but remains unsatisfactory.155
This reflects the fact that operating costs
(without depreciation) exceeded operating revenue—in fact, operating revenues covered only 50
percent of operating costs. State operating subsidies from the budget cover 36 percent of working
costs, allowing the working ratio to be under one 1, when the state‘s funds are included. Serbian
Railways incurred accounting losses because of uncompensated depreciation and financial and
non-operating costs. Comparing the first half of 2009 with the same period in 2008, reveals
worsening financial results, due to sharply lower traffic volumes.
390. Cumulative financial losses over 2000-2009 reached Euro 1.24 billion by end 2009.156
The cumulative losses over 2000-2009 amount to 45 percent of Serbian Railways‘ capital, up
from 42.82 percent in 2008. As stated in Serbian Railways‘ Business Plan 2010, the continued
reduction in capital puts into question its financial sustainability in the absence of countervailing
measures. Among the causes for this poor financial performance are: (i) unprofitable passenger
services not financed through PSO contracts or terminated; (ii) lack of business operational
efficiency; (iii) excessive staffing levels in relation to traffic volumes; (iv) poor quality and
reliability of services due to condition of infrastructure and rolling stock, which reduces demand,
155
This is defined as the operating cost before depreciation and provisioning divided by the operating
revenue, excluding budget support. 156
Cumulative financial losses over 2000-2007 reached RSD 93.7 billion (Euro 1.17 billion), rising to
RSD116.3 billion (Euro 1.24 billion) in 2009.

Railway Reform in South East Europe and Turkey: On the Right Track? Annexes
223
particularly for passenger transport; and (v) the absence of financial consolidation to deal with
historic debts of Serbian Railways and its daughter companies.
Table 41: Serbian Railways Financial Performance (Euro millions)
2005 2006 2007 2008
Q1
2008
Q2 2008
2009
Q1
2009
Q2
TOTAL REVENUE 241 312 374 58 81 329 52 68
Passenger 18 17 19 4 3 18 3 3
Tickets 18 17 19 4 3 18 3 3
Freight 83 102 113 20 32 109 15 13
Other 28 71 101 1 11 64 0 17
Total operating revenues 129 190 233 25 47 191 18 33
State operating subsidies 112 122 141 33 34 138 34 35
Passenger 0 0 0 0 0 0 0 0
Freight 0 0 0 0 0 0 0 0
Infrastructure 0 0 0 0 0 0 0 0
TOTAL EXPENDITURE 465 393 436 91 103 522 77 87
Materials 18 19 23 4 4 19 4 4
Fuel, electricity 20 24 26 7 7 29 4 5
Salaries and allowances 120 127 135 41 38 160 36 36
Outsourcing and other services 57 66 103 13 18 83 10 10
Depreciation 98 99 93 22 23 89 19 19
Total operating expenditures 313 335 380 87 90 379 73 73
Non-operating expenditures 151 57 57 4 14 143 5 14
NET INCOME
With state contribution (223) (81) (63) (33) (23) (193) (25) (19)
Without state contribution (335) (202) (203) (67) (56) (331) (59) (54)
WORKING RATIO
With state contribution 0.89 0.76 0.77 1.11 0.83 0.88 1.02 0.79
Without state contribution 1.67 1.24 1.23 2.63 1.42 1.52 2.94 1.62 Source: Serbian Railways.
391. Despite declines in staff levels, the wage bill as a share of operating costs has been
rising and remains high. The wage bill as a percentage of operating costs has risen from 38
percent in 2005 to 42 percent in 2008 (Figure 188). However, expressed as a percentage of
operating revenue, excluding the state contribution, the wage bill stood at 83 percent in 2008,
rising after having declined in 2006 and 2007. Part of the rise may be explained by the cost of
severance payments aimed at reducing staffing levels. But, overall, the wage bill remains on the
high side, despite the implementation in 2009 of a law on the temporary reductions of salaries and
other benefits for the state administration and public sector helped contained the wage bill in
2009. Average wages in the company are significantly lower than the average in other Serbian
public companies.157
392. Average revenue per passenger km and per net ton km has improved over 2005-2008.
Figure 189 presents the average revenue per passenger km expressed in euro cents; for 2006-2008
average operating costs per passenger km exceeded average revenue per passenger km (excluding
state subsidies) by a significant margin, although the gap narrowed in 2008. Passenger tariff
157
In 2008 the net average wage at Serbian Railways was RSD27,770 (Euro 551), compared to RSD44,921
(Euro 341) for public enterprises.

Railway Reform in South East Europe and Turkey: On the Right Track? Annexes
224
policy is such that there could be scope for increased tariffs without reducing demand for
services. In 2007, the Government approved a price increase in passenger tariffs of about 20
percent—the first such rise since 2004. Railway passenger tariffs remain lower than alternative
transport modes, particularly buses. Serbian Railways calculates that bus transport prices, when
compared to regular second class train prices, are about 70 to 150 percent higher—but with a
much higher quality of service. Although there may be issues regarding reliability and quality of
services on trains, there does appear to be scope for further price increases.
Figure 188: Serbian Railways Wage Bill Indicators
Source: Serbian Railways.
393. Freight average revenues per net ton km increased over 2006-2008, and is more than
twice the average cost. Average revenues per net km rose from 2.4 euro cents per ton-km in
2006 to 2.7 euro cents per ton-km in 2008 (Figure 190). This is slightly lower than for passenger
transport, but the costs are markedly lower. Whereas the average cost per passenger-km was 3.3
Euro cents in 2008, for freight average costs were 1.2 euro cents per ton-km, or 175 percent less.
The very large difference is explained by the low and declining levels of passenger volume. In
2008, freight transport revenue reached Euro 109 million, while total expenses were only Euro 61
million. By contrast, passenger transport revenue in 2008 reached Euro 19 million, and total
expenses were Euro 23 million.
Figure 189: ŢS – Average Revenue and Cost per
Passenger Unit (Euro cents/pass-km)
Figure 190: ŢS – Average Revenue and Cost per
Passenger Unit (euro cents/ton-km)
Source: Serbian Railways. Source: Serbian Railways.
38 38 36
42
93
67
58
83
50
4136
48
0
10
20
30
40
50
60
70
80
90
100
2005 2006 2007 2008
Wage bill as % of operating costs Wage bill as % of operating revenue (excl state contribution) Wage bill as % of total revenue
2.0
2.5
2.82.7
3.63.3
2006 2007 2008
Unit total revenue (excluding state contribution)
Unit operating cost
2.4
2.7 2.7
1.0
1.3 1.2
2006 2007 2008
Unit total revenue Unit operating cost
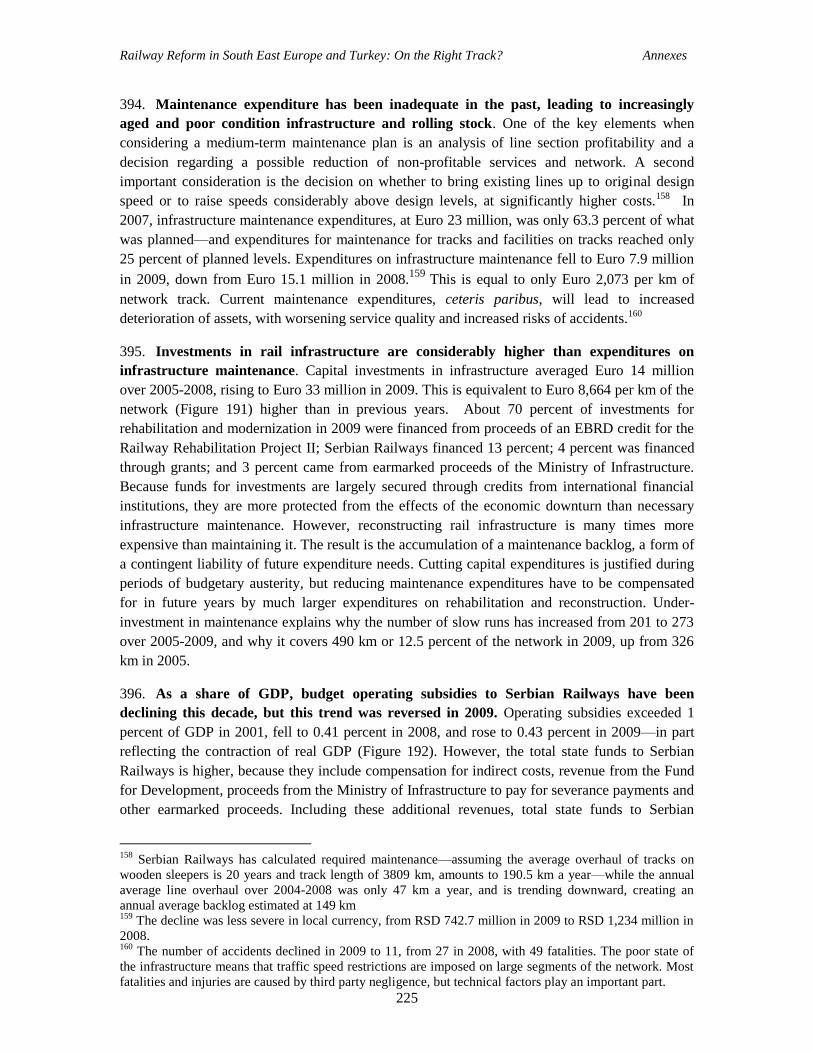
Railway Reform in South East Europe and Turkey: On the Right Track? Annexes
225
394. Maintenance expenditure has been inadequate in the past, leading to increasingly
aged and poor condition infrastructure and rolling stock. One of the key elements when
considering a medium-term maintenance plan is an analysis of line section profitability and a
decision regarding a possible reduction of non-profitable services and network. A second
important consideration is the decision on whether to bring existing lines up to original design
speed or to raise speeds considerably above design levels, at significantly higher costs.158
In
2007, infrastructure maintenance expenditures, at Euro 23 million, was only 63.3 percent of what
was planned—and expenditures for maintenance for tracks and facilities on tracks reached only
25 percent of planned levels. Expenditures on infrastructure maintenance fell to Euro 7.9 million
in 2009, down from Euro 15.1 million in 2008.159
This is equal to only Euro 2,073 per km of
network track. Current maintenance expenditures, ceteris paribus, will lead to increased
deterioration of assets, with worsening service quality and increased risks of accidents.160
395. Investments in rail infrastructure are considerably higher than expenditures on
infrastructure maintenance. Capital investments in infrastructure averaged Euro 14 million
over 2005-2008, rising to Euro 33 million in 2009. This is equivalent to Euro 8,664 per km of the
network (Figure 191) higher than in previous years. About 70 percent of investments for
rehabilitation and modernization in 2009 were financed from proceeds of an EBRD credit for the
Railway Rehabilitation Project II; Serbian Railways financed 13 percent; 4 percent was financed
through grants; and 3 percent came from earmarked proceeds of the Ministry of Infrastructure.
Because funds for investments are largely secured through credits from international financial
institutions, they are more protected from the effects of the economic downturn than necessary
infrastructure maintenance. However, reconstructing rail infrastructure is many times more
expensive than maintaining it. The result is the accumulation of a maintenance backlog, a form of
a contingent liability of future expenditure needs. Cutting capital expenditures is justified during
periods of budgetary austerity, but reducing maintenance expenditures have to be compensated
for in future years by much larger expenditures on rehabilitation and reconstruction. Under-
investment in maintenance explains why the number of slow runs has increased from 201 to 273
over 2005-2009, and why it covers 490 km or 12.5 percent of the network in 2009, up from 326
km in 2005.
396. As a share of GDP, budget operating subsidies to Serbian Railways have been
declining this decade, but this trend was reversed in 2009. Operating subsidies exceeded 1
percent of GDP in 2001, fell to 0.41 percent in 2008, and rose to 0.43 percent in 2009—in part
reflecting the contraction of real GDP (Figure 192). However, the total state funds to Serbian
Railways is higher, because they include compensation for indirect costs, revenue from the Fund
for Development, proceeds from the Ministry of Infrastructure to pay for severance payments and
other earmarked proceeds. Including these additional revenues, total state funds to Serbian
158
Serbian Railways has calculated required maintenance—assuming the average overhaul of tracks on
wooden sleepers is 20 years and track length of 3809 km, amounts to 190.5 km a year—while the annual
average line overhaul over 2004-2008 was only 47 km a year, and is trending downward, creating an
annual average backlog estimated at 149 km 159
The decline was less severe in local currency, from RSD 742.7 million in 2009 to RSD 1,234 million in
2008. 160
The number of accidents declined in 2009 to 11, from 27 in 2008, with 49 fatalities. The poor state of
the infrastructure means that traffic speed restrictions are imposed on large segments of the network. Most
fatalities and injuries are caused by third party negligence, but technical factors play an important part.

Railway Reform in South East Europe and Turkey: On the Right Track? Annexes
226
Railways reached Euro 138 million in 2008 or 0.41 percent of GDP; they rose to Euro 170
million—compared to Euro 134 million of operating subsidies—in 2009, equal to 0.55 percent of
GDP.
Figure 191: Serbian Railways – Rail Infrastructure Investments, 2005-2008
Source: Serbian Railways.
397. It will be difficult to reduce budgetary dependence, because there has been a need to
maintain budget support levels due to the difficult financial position of Serbian Railways.
This is largely caused by the delay in financial consolidation, and by the cumulative effects of
inadequate investments in railway capacities and the absence of charging for infrastructure. Until
an infrastructure access charge regime is established, the budgetary subsidy will need to
compensate the infrastructure manager, otherwise any reduction in subsidy is likely to translate
into higher annual financial losses. At present the subsidy level is insufficient to cover the total
cost of necessary infrastructure maintenance and passenger railway operations. A study has
examined the effects of rationalization through a reduction in non-profitable services, and found
that irrespective of the level of rationalization, the necessary subsidy substantially exceeds the
available subsidy—which highlights the need to introduce an infrastructure access charge and a
public service obligation regime. 161
398. In 2008, the government announced its plans to begin the modernization and
reconstruction of the Corridor X rail line. The stated objective is to raise speed in this corridor
to 160 km/hour, which will require among other things, electrification and the construction of a
second railway track on a number of sections.162
The total value of the necessary investment is
estimated at Euro 1.7 billion to Euro 2 billion, for total track length of 1,016 km. However, the
cost could be considerably reduced if it was decided to have speeds of 120 km/hour or less, which
would be more in keeping with the composition and level of current and projected traffic. All
electrical-technical plants on all lines on Corridor X, with the exception of the Niš-Dimitrovgrad
line, allow for speeds of 120 km/hour—and 55.4 percent of lines were designed with route
elements for speeds of 120 km/hour. In other words, the lower speed objective would be more in
line with the design speed of the existing infrastructure and would be considerably cheaper.
161
Booz, Allen and Hamilton, Designing an Infrastructure Access Regime and Network Statement for the
Rail Sector in Serbia, November 2007. 162
The National Road and Rail Infrastructure Development Plan for the Republic of Serbia for 2008-2012
sets out the road and rail infrastructure projects that are considered national priority objectives.
20.516.2
8.410.8
33.0
5,392
4,233
2,2092,838
8,664
0.0
5.0
10.0
15.0
20.0
25.0
30.0
35.0
0
1,000
2,000
3,000
4,000
5,000
6,000
7,000
8,000
9,000
10,000
2005 2006 2007 2008 2009
Inv
estm
ents
(E
uro
mil
lio
ns)
Inv
estm
ent p
er k
m o
f rr
ack (
Euro
s)
Investments Investment per km

Railway Reform in South East Europe and Turkey: On the Right Track? Annexes
227
According to Serbian Railways own estimates, total superstructure and substructure costs are
estimated at Euro 880,000 per track km for a speed of 120 km/hour, but rise sharply to Euro 2.12
million per track km for 160 km/hour.163
Figure 192: Serbian Railways Operating Subsidy, 2005-2009
Sources: Serbian Railways, IMF.
399. In addition, the economic and financial case for increasing design speed on the
infrastructure of Corridor X remains to be made. A number of factors should be considered
when making such a decision. These include: (i) the scale of the investments and associated
expenditures; (ii) the cost differential of upgrading infrastructure from 120 km/hour versus 160
km/hour; (iii) the fact that freight traffic constitutes over 80 percent of total traffic and revenue—
traffic that does not require speeds in excess of 100 km/hour; and (iv) the maintenance backlog on
other parts of the railway network that will require upgrading over the medium to long-term. It
appears necessary to assess alternative options in terms of the standard that would be consistent
with the nature and scale of current and projected demand. Meanwhile, an agreement has been
signed with Deutsche Bahn to prepare a master plan for the modernization of Corridor X, and this
could review alternative design speeds. This master plan will be used as the basis to access EU
funds for future investments in the sector.
400. There is another option, which may even be preferable in the short-to-medium term,
and would likely have higher economic returns. This would be to defer large-scale investment
to upgrade the rail infrastructure on Corridor X, and make necessary investments to address
current speed restrictions and reduce the physical and institutional impediments at the border-
crossings. The required measures include: (i) relocation of the change of locomotives for freight
trains and the related train technical checks (brake testing) from border-crossing points to the
nearest marshalling yard; (ii) implementation of IT solutions to facilitate advance processing by
railways and border agencies; (iii) promotion of joint processing of freight trains by Customs
administrations at inland terminals; and (iv) improvment of scheduling to build on the first three
163
A comparison with the costs quoted by a railway company operating in the region suggests that these
unit costs are on the high side, and may be applicable only to those parts of the infrastructure which are in
the poorest condition. These alternative costs for scheduling a railway line overhaul for 1 km of track
include €210,000 for materials, which is half of the cost quoted by Serbian Railways, and an additional
€110,000 of labor costs.
0.55
0.52
0.48
0.41
0.43
0.40
0.45
0.50
0.55
0.60
100
105
110
115
120
125
130
135
140
145
2005 2006 2007 2008 2009
Operating subsidies (Euro millions) % of GDP

Railway Reform in South East Europe and Turkey: On the Right Track? Annexes
228
points. The improvement in trade facilitation at the border is likely to have a greater impact on the
operating speed of transit traffic for a modest cost, than significant investments in upgrading at
this time. The more logical choice under the circumstances would appear to be: (i) implementing
a program of investment to address all the speed restrictions; (ii) investing to return to the current
design standard of 100 km/hour and 120 km/hour; and (iii) improving border-crossing times.
Railway Reform in South East Europe and Turkey: On the Right Track? Annexes
229
TURKISH RAILWAYS
401. Turkish Railways, Türkiye Cumhuriyeti Devlet Demiryolları (TCDD), is the public
enterprise that operates the public rail system in Turkey. It operates the state railways and
several large ports; it also manufactures and repairs locomotives, wagons, and passenger coaches.
As the sole train operator in the country, Turkish Railways operates all passenger, freight and
suburban trains, including domestic and international departures. Turkish Railways is the largest
loss-making state public enterprise in Turkey, although the ports are profitable and cross-
subsidize rail transport. Turkish Railways faces a number of challenges. Its regional structure
creates redundant activities and causes problems of coordination and distribution of
responsibilities, with negative effects on resource efficiency. The eventual privatization of the
ports will reduce Turkish Railways‘ revenue by an estimated 50 percent. The company has
identified a number of long-term problems that will need to be resolved in order to improve the
overall performance of the company. These include: (i) heavy financial losses and growing debt;
(ii) products and services not meeting market demand; (iii) highway-oriented transport policy and
regulations; (iv) intensive political interference; and (v) high labor costs.164
402. Until the opening of the Marmaray tunnel—a Bosporus undersea railway tunnel currently
under construction—Turkey will continue to have two separate rail networks in Thrace and
Anatolia that are only connected through the Bosporus railway ferry in Istanbul. Turkish
Railways operates 8,686 km of network, of which 1,919 km are electrified, 443 km are double
track and 397 km are high speed train lines. Infrastructure deficiencies, single line operation, old
and insufficient rolling stock continue to adversely affect performance. In 2009, there was a 100
percent rise in train cancellations, and a 36 percent rise in freight train delays.165
Operational Performance
403. Rail traffic did not rise over 2000-2009, reflecting declining passenger traffic. Freight
traffic declined sharply in 2001, by 23 percent, when the Turkish economy contracted by 5.7
percent. Thereafter, freight traffic recovered during the course of the decade. However, it then
declined by 4 percent in 2009—to 10.326 million ton-km. This reflected the impact of the
international financial crisis—with a 22 percent decrease in the transportation of imported goods
and a 30 percent decline for the transport of exported goods. Passenger traffic declined by 7.9
percent over 2000-2009, from 5,832 million passenger-km in 2001 to 5,374 million passenger-km
in 2009 (Figure 194).166
In part this reflects the impact of the crisis, but also a shift to air
transport, due to special promotions of airlines with the opening up to the private sector.167
Overall, combined freight and passenger traffic equaled 15,700 million traffic units in 2009,
while in 2000 total traffic equaled 15,481 million traffic units—thus, there has not been a
significant increase. It is estimated that by 2000 road transport represented 93 percent of the total
164
TCDD (2009), TCDD Business Plan 2010-2014, Ankara, September 2009. 165
TCDD (2009), Annual Report 2009. September 2009, Ankara, p.97. 166
In terms of number of passengers, Turkish Railways transported 57.2 million passengers through its
suburban lines in 2009, up from 55.2 million in 2008. In contrast, main line passenger declined by 5
percent in 2009, to 22.8 million. 167
TCDD (2009), Annual Report 2009. Ankara, September 2009, p.74.
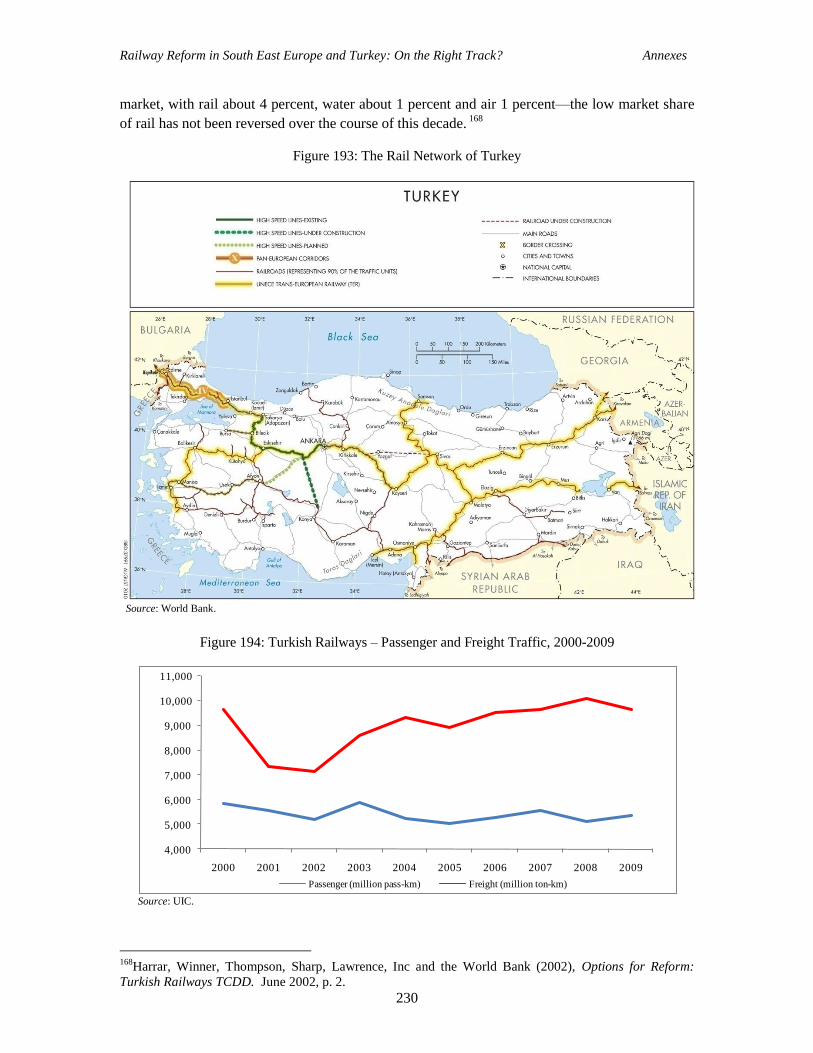
Railway Reform in South East Europe and Turkey: On the Right Track? Annexes
230
market, with rail about 4 percent, water about 1 percent and air 1 percent—the low market share
of rail has not been reversed over the course of this decade. 168
Figure 193: The Rail Network of Turkey
Source: World Bank.
Figure 194: Turkish Railways – Passenger and Freight Traffic, 2000-2009
Source: UIC.
168
Harrar, Winner, Thompson, Sharp, Lawrence, Inc and the World Bank (2002), Options for Reform:
Turkish Railways TCDD. June 2002, p. 2.
4,000
5,000
6,000
7,000
8,000
9,000
10,000
11,000
2000 2001 2002 2003 2004 2005 2006 2007 2008 2009
Passenger (million pass-km) Freight (million ton-km)

Railway Reform in South East Europe and Turkey: On the Right Track? Annexes
231
404. Freight traffic is dominated by domestic transport, which accounts for 92 percent of
total traffic. International transit traffic is limited and accounts for a mere 31 million ton-km in
2009, compared to 519 million for export traffic and 304 million for import traffic. The main
types of commodities carried are machines and vehicles, followed by ores and solid minerals
(Figure 195). Freight traffic is adversely affected by bottlenecks due to operational problems.
These include lack of active staff and traction power, and capacity bottlenecks due to the central
train dispatch system. Under the circumstances, most of the lines and trains operated are
uneconomic.169
Daily loading volumes are about 50,000 to 60,000 tons, with turnaround taking as
long as 11.5 days. Since 2003, Turkish Railways has operated block trains; this has allowed for
the use of heavier trains, leading to higher freight volumes, longer average haul distances, and
reduced operating costs.
405. Rail traffic intensity has increased over 2005-2009, but is equal to only 59 percent of
the EU average. In 2009, traffic intensity in Turkey with 1,807,506 traffic units per rail route-km
is equivalent to 59 percent of the average traffic intensity of the EU—compared to 45 percent in
2000. Traffic intensity is being pulled down by passenger transport, which measured in
passenger-km has declined over the last nine years. In 2009, freight traffic intensity, at 1,114,552
traffic units per rail route-km, is equal to 87 percent of the EU average, the highest for the
countries covered in this report—compared to 68 percent of the EU average in 2008. Raising the
intensity of infrastructure usage further, to reduce the high financial costs associated with the high
fixed costs of rail infrastructure, will be difficult unless the trend decline of passenger transport is
reversed, and uneconomic lines are closed, focusing investments on a core network.
Figure 195: Turkish Railways – Composition of Freight Traffic, 2005-2009
Note: Freight traffic by type of commodity, measured in net ton-km.
Source: T.C. Devlet Demiryollari Istatistik Yilligi (2010).
406. Staffing levels have risen in recent years, while staff productivity as measured by
traffic unit per staff, has declined over 2005-2009. At the start of the decade staff numbers
stood at 26,347, but had risen to 29,966 by 2009, a 14 percent rise. Staff productivity, measured
by total traffic units—freight million ton-km and million passenger-km—has fallen from 538,505
in 2005 to 523,927, but remains the highest of the 10 countries included in this study. Compared
to the EU average, Turkey‘s staff productivity has risen from 79 percent in 2005 to 88 percent in
2009—significant progress, although the improvement only occurred in 2008-2009. There is
169
TCDD (2009), TCDD Business Plan 2010-2014, Ankara, September 2009, p.14.
13 17 21 25 26
3232 29 22 24
1715 14 12 11
1214 13
13 8
43 3
4 6
22 18 20 24 25
0%
10%
20%
30%
40%
50%
60%
70%
80%
90%
100%
2005 2006 2007 2008 2009
Others
Metallurgical products
International
Solid minerals
Ores
Machines, vehicles

Railway Reform in South East Europe and Turkey: On the Right Track? Annexes
232
evidence that Turkish Railways is overstaffed—the 2010-2014 business plan of the company
envisages an employment restructuring project that would result in a 29 percent reduction of
staff.170
This is a clear indication that the company itself is fully aware of low staff productivity
and the remedial actions necessary to improve productivity growth.
Figure 196: Turkish Railways – Rail Traffic
Intensity
Figure 197: Turkish Railways – Traffic Units per
Staff and Staff Levels
Source: UIC. Source: UIC.
Figure 198: Turkish Railways – Wage Bill
Indicators
Figure 199: Turkey Rail Sector Compared to EU
Average, 2009 (EU=100)
Source: Turkish Railways. Source: UIC.
407. The average age of the rail infrastructure equipment is younger in Turkey than in the
Western Balkans. About 27.8 percent of rail is under 10 years of age; 25.2 percent is between
11 and 20 years; 24.7 percent is between 21 and 30 years of age; and 22.3 percent is over 30
years. In 2009, 423 km of lines and 226 switches were renewed. Meanwhile, rail infrastructure
equipment is more recent, with over 75 percent of the telecommunications installations, catenary
system, and signaling system under 20 years old (Figure 200). In 2009, the lines controlled
through a centralized traffic control (CTC) system were 3,029 km in length.
170
TCDD (2009), TCDD Business Plan 2010-2014, Ankara, September 2009.
40%
42%
44%
46%
48%
50%
52%
54%
56%
58%
1,500,000
1,550,000
1,600,000
1,650,000
1,700,000
1,750,000
1,800,000
2005 2006 2007 2008 2009
Turkey% of EU average
25,000
26,000
27,000
28,000
29,000
30,000
31,000
32,000
460,000
470,000
480,000
490,000
500,000
510,000
520,000
530,000
540,000
2005 2006 2007 2008 2009
Traffic units/staff Staff
45 44 46 44
65
121111 110
70
53 57 56
0
20
40
60
80
100
120
140
2005 2006 2007 2008
% of operating costs
% of operating revenue (excl state contribution)
% of total revenue
84
109
89
100
56
25
Staff Productivity
Locomotive productivity
Freight productivity
Coach productivity
Traffic density
Network density
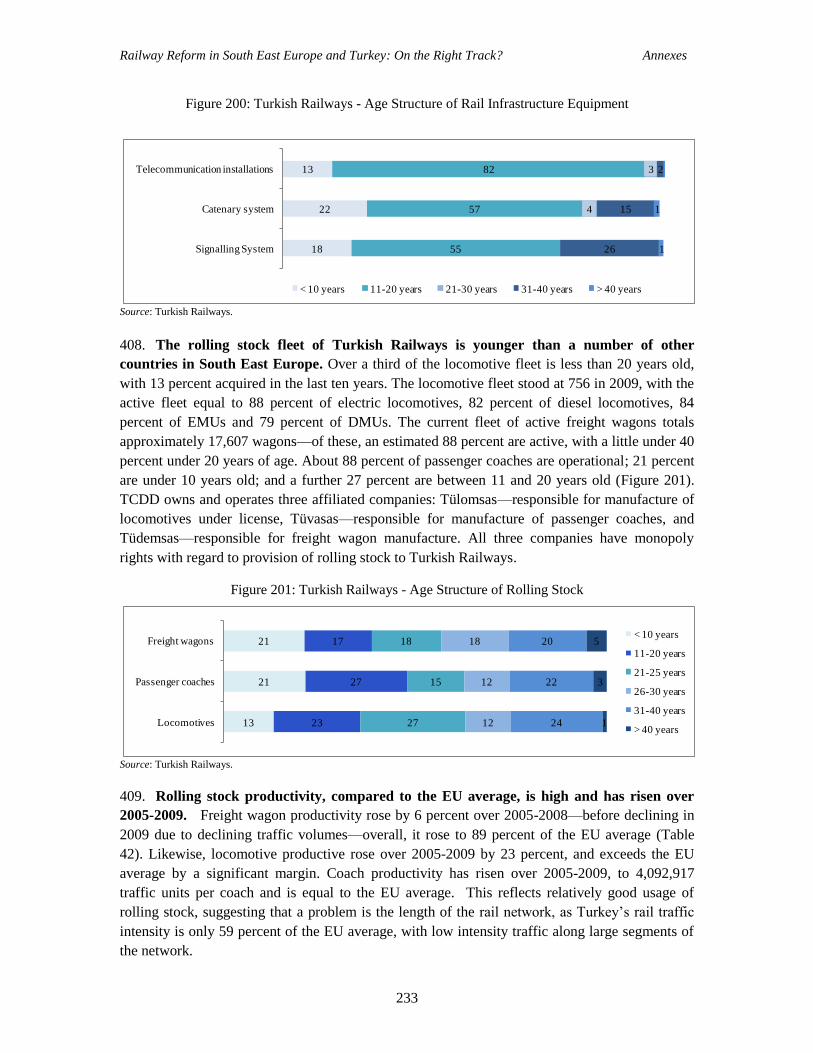
Railway Reform in South East Europe and Turkey: On the Right Track? Annexes
233
Figure 200: Turkish Railways - Age Structure of Rail Infrastructure Equipment
Source: Turkish Railways.
408. The rolling stock fleet of Turkish Railways is younger than a number of other
countries in South East Europe. Over a third of the locomotive fleet is less than 20 years old,
with 13 percent acquired in the last ten years. The locomotive fleet stood at 756 in 2009, with the
active fleet equal to 88 percent of electric locomotives, 82 percent of diesel locomotives, 84
percent of EMUs and 79 percent of DMUs. The current fleet of active freight wagons totals
approximately 17,607 wagons—of these, an estimated 88 percent are active, with a little under 40
percent under 20 years of age. About 88 percent of passenger coaches are operational; 21 percent
are under 10 years old; and a further 27 percent are between 11 and 20 years old (Figure 201).
TCDD owns and operates three affiliated companies: Tülomsas—responsible for manufacture of
locomotives under license, Tüvasas—responsible for manufacture of passenger coaches, and
Tüdemsas—responsible for freight wagon manufacture. All three companies have monopoly
rights with regard to provision of rolling stock to Turkish Railways.
Figure 201: Turkish Railways - Age Structure of Rolling Stock
Source: Turkish Railways.
409. Rolling stock productivity, compared to the EU average, is high and has risen over
2005-2009. Freight wagon productivity rose by 6 percent over 2005-2008—before declining in
2009 due to declining traffic volumes—overall, it rose to 89 percent of the EU average (Table
42). Likewise, locomotive productive rose over 2005-2009 by 23 percent, and exceeds the EU
average by a significant margin. Coach productivity has risen over 2005-2009, to 4,092,917
traffic units per coach and is equal to the EU average. This reflects relatively good usage of
rolling stock, suggesting that a problem is the length of the rail network, as Turkey‘s rail traffic
intensity is only 59 percent of the EU average, with low intensity traffic along large segments of
the network.
18
22
13
55
57
82
4
3
26
15
2
1
1
Signalling System
Catenary system
Telecommunication installations
< 10 years 11-20 years 21-30 years 31-40 years > 40 years
13
21
21
23
27
17
27
15
18
12
12
18
24
22
20
1
3
5
Locomotives
Passenger coaches
Freight wagons< 10 years
11-20 years
21-25 years
26-30 years
31-40 years
> 40 years

Railway Reform in South East Europe and Turkey: On the Right Track? Annexes
234
Table 42: Turkish Railways - Rolling Stock Productivity
Year Freight Wagon Productivity Coach Productivity Locomotive Productivity
TCDD EU average = 100 TCDD EU average = 100 Turkey EU average = 100
2009 549,838 89 4,092,917 100 28,676,190 109
2008 590,497 78 5,122,613 129 24,797,716 89
2007 568,042 68 4,210,008 93 25,515,913 89
2006 584,804 73 4,040,582 93 24,619,601 89
2005 555,148 74 3,829,658 101 23,291,667 85 Source: UIC.
Financial Performance and Investment Plans of Turkish Railways
410. Financial performance remains weak, with continued financial losses over the course
of 2005-2009. In 2008, financial losses reached Euro 588 million, despite state operating
subsidies equal to Euro 337 million (Table 43). In the last five years, Turkish Railways has
generated losses, because commercial revenues cover only a fraction of total operating costs and
state operating subsidies exceed commercial revenues. The working ratio—a key financial
indicator—improved from 0.99 in 2005 to 0.64 in 2008, but without state funds the working ratio
exceeds 3 and has not improved in recent years. According to TCDD‘s 2009 Annual Report, total
financial losses reached Euro 239 million in 2009, down from Euro 412 million in 2008.
According to the 2010-2014 business plan, one of the main objectives of Turkish Railways is to
improve the financial performance of the company by 2014. However, this will not occur unless a
number of reforms are undertaken—these include staff retrenchment, closure of uneconomic lines
and services, and adequate annual tariff indexation.
411. Profit and loss by line of business indicates that the biggest source of losses is freight
transport, followed by mainline passenger services. Table 44 reveals that losses from freight
transport reached Euro 435 million in 2009, with a cost coverage ratio of 30 percent. Although
the cost coverage ratio for mainline passenger services was only 15 percent in 2009, losses in that
year were Euro 333 million. By contrast, suburban passenger services generated only Euro 11
million of losses in 2009, and the cost coverage ratio was 72 percent. High speed train services
introduced in 2009 are loss-making—losses equaled Euro 2 million—nevertheless, the cost
coverage ratio, at 67 percent is more than 4 times higher than for mainline services. In most
countries, freight services are profitable, but in the case of Turkey the cost coverage ratio has
remained stubbornly low, at around 31 percent for the last five years. Increasing freight tariffs
and reviewing the business model for freight will be essential to reverse losses in the future—
particularly as freight traffic density is not particularly low, suggesting that pricing is an
important issue.
412. While all main line passenger trains lose money with the exception of sleeper trains,
the government subsidizes only three express trains. It is expected that after passage of the
Draft Railway Sector Law, loss-making trains will be cancelled or else will receive compensation
through the introduction of public service contracts (PSCs)—because the principle should
become that uneconomic trains are cancelled. Turkish Railways is focusing its investments and
hopes to raise market share for three key routes: (i) Ankara-Istanbul; (ii) Ankara-Izmir; and (iii)
Istanbul-Izmir. In particular, the investments regarding the rehabilitation of infrastructure and

Railway Reform in South East Europe and Turkey: On the Right Track? Annexes
235
reduced travel times should help raise traffic along the Ankara-Istanbul route. Turkish Railways
has initiated the process of transferring responsibility for suburban services to local authorities—
in this model, pricing and scheduling of trains will be the responsibilities of local authorities,
whereas the operation will be carried out by the rail company. It is expected that agreements with
municipalities should raise the current cost recovery ratio from 0.7 at present.
Table 43: Turkish Railways - Financial Performance (Euro millions)
2005 2006 2007 2008
TOTAL REVENUE 522 548 604 639
Passenger 77 79 89 86
Tickets 73 75 86 83
Freight 172 175 198 214
Other 1 1 1 1
Total operating revenues 250 255 288 302
State operating subsidies 272 293 315 337
Passenger 30 29 31 32
Freight 9 9 10 12
Infrastructure 233 255 274 294
TOTAL EXPENDITURE 1,085 1,001 1,141 1,227
Materials 50 64 61 66
Fuel, electricity 171 177 176 207
Salaries and allowances 409 405 469 474
Outsourcing and other services 8 11 19 24
Depreciation 103 97 113 117
Total operating expenditures 907 915 1025 1083
Non-operating expenditures 178 86 116 144
NET INCOME
With state contribution (563) (453) (537) (588)
Without state contribution (835) (746) (852) (925)
WORKING RATIO
With state contribution 0.99 0.64 0.65 0.64
Without state contribution 3.22 3.21 3.16 3.20 Source: Turkish Railways.
413. The wage bill as a share of operating revenues remains extremely high and impacts
adversely on profitability. The wage bill as a percentage of operating revenues—excluding state
funds—reached 110 percent in 2008, up from 65 percent in 2005 (Figure 198). As a percentage of
operating costs, the wage bill was 44 percent in 2008, largely unchanged from earlier years.
About 5 percent of Turkish Railways employees are located at headquarters, and 95 percent
scattered throughout seven regions; many of the headquarter departments have regional units,
which results in duplication of activities. This impacts negatively on labor productivity, as does
the abundance of staff working in repair and maintenance units. In its 2010-2014 Business Plan,
Turkish Railways lays out a personnel plan assuming a business unit reorganization that would
see its rail staff decline from 26,175 in 2009 to 18,600 in 2014, with the aim of scaling-down to
12,000 in ten years time. 171
171
TCDD (2009), TCDD Business Plan 2010-2014, Ankara, September 2009, p 56-57.

Railway Reform in South East Europe and Turkey: On the Right Track? Annexes
236
Table 44: Turkish Railways - Profit and Loss by Line of Business (Euro millions)
2005 2006 2007 2008 2009
Suburban passenger
Revenues 26 27 30 30 29
Expenditures 37 34 38 39 40
Profit/loss (11) (7) (8) (9) (11)
Cost coverage ratio (%) 69 79 79 76 72
Mainline passenger
Revenues 51 52 59 57 51
Expenditures 303 308 356 343 333
Profit/loss (252) (256) (296) (286) (282)
Cost coverage ratio (%) 17 17 17 17 15
High Speed Trains
Revenues 0 0 0 0 5
Expenditures 0 0 0 0 8
Profit/loss 0 0 0 0 (2)
Cost coverage ratio (%) 0 0 0 0 67
Total passenger
Revenues 77 79 89 86 85
Expenditures 340 342 393 382 381
Profit/loss (263) (263) (304) (295) (296)
Cost coverage ratio (%) 23 23 23 23 22
Freight
Revenues 172 175 198 214 190
Expenditures 557 563 621 689 625
Profit/loss (386) (388) (423) (475) (435)
Cost coverage ratio (%) 31 31 32 31 30
Total rail traffic
Revenues 249 254 287 301 275
Expenditures 898 906 1,015 1,071 1,006
Profit/loss (649) (652) (727) (771) (731)
Cost coverage ratio (%) 28 28 28 28 27
Port services
Revenues 211 229 182 151 122
Expenditures 128 120 117 102 88
Profit/loss 83 109 64 49 34
Cost coverage ratio (%) 164 191 155 148 138
Lake Van operation
Revenues 1 1 1 1 1
Expenditures 9 9 10 12 8
Profit/loss (9) (8) (9) (10) (7)
Cost coverage ratio (%) 9 12 9 11 10
Grand total
Revenues 461 484 470 453 397
Expenditures 1,035 1,035 1,142 1,185 1,102
Profit/loss (575) (551) (672) (732) (704)
Cost coverage ratio (%) 44 47 41 38 36 Source: T.C. Devlet Demiryollari Istatistik Yilligi (2010).

Railway Reform in South East Europe and Turkey: On the Right Track? Annexes
237
414. Unit revenue per passenger km and per net ton km have increased modestly over
2005-2008. Figure 202 presents average revenue per passenger km expressed in euro cents;
Figure 203 presents average revenue per freight km. Unit revenues for both passenger and freight
traffic are relatively low and have risen by a mere 0.2 euro cents in the last four years. Freight
revenues are relatively low compared to other countries included in this study—for example, unit
revenue from freight equaled 9.1 euro cents in Montenegro, 5.4 euro cents in Romania, and 6.3
euro cents in Croatia. Such low freight tariffs have an adverse effect on the profitability of freight
transport—Turkish Railways should focus on reducing overall costs, while reviewing freight
tariffs. In the past, Turkish Railways decreased freight tariffs to attract freight traffic, while at the
same time increasing passenger tariffs, shifting transport benefits from passengers—most likely
poor—to major industrial clients.172
This may also reflect annual indexation of passenger and
freight tariffs not rising to keep up with average annual inflation, which averaged 9.2 percent over
2005-2008. Since 1990, freight revenues have declined in real terms by 46 percent, reflecting in
part the fact that tariff adjustments did not keep pace with high inflation.
Figure 202: Turkish Railways - Passenger
Transport: Unit Revenue (Euro cents)
Figure 203: Turkish Railways Freight Transport:
Unit Revenue (Euro cents)
Source: Turkish Railways. Source: Turkish Railways.
415. Infrastructure investment has been increasing sharply in recent years due to investments in
high speed lines. Infrastructure investments have risen from Euro 169 million in 2005 to Euro
442 million in 2009, and to an estimated Euro 972 million in 2010, which translates into higher
investments per km of track (
416. Figure 204). Rolling stock investments have risen more modestly, from Euro 54 million in
2005 to Euro 77 million in 2008. In 2009, Turkish Railways renovated 423 km of track—and
funds were spent on the Ankara-Istanbul High-Speed Train, the Ankara-Konya High Speed Train
Project, and the Ankara-Sivas Railway Project, and on equipment for maintenance of high-speed
train lines. As Figure 205 indicates, the large rise in rail infrastructure investment reflects rising
funds allocated to high-speed lines. Recent rolling stock acquisitions include: (i) nine high-speed
trains supplied in 2009; (ii) 2 EMU units for high-speed trains—one in 2007 and the other in
2008; (iii) 89 diesel locomotives manufactured between 2003 and 2008; and (iv) 12 DMU train
172
Harrar, Winner, Thompson, Sharp, Lawrence, Inc and the World Bank (2002), Options for Reform:
Turkish Railways TCDD. June 2002, p. 2.
2.1
2.0
2.2
2.3
2005 2006 2007 2008
Unit total revenue
2.0
1.9
2.2
2.2
2005 2006 2007 2008
Unit total revenue

Railway Reform in South East Europe and Turkey: On the Right Track? Annexes
238
sets financed from EIB funds—with the delivery of 6 in 2008 and 6 in 2009. Investments in
freight wagons include 509 units in 2005, 620 units in 2006, 990 units in 2007, 833 units in 2008,
and 849 units in 2009.
Figure 204: Turkish Railways – Rail Infrastructure Investments
Note: 2010 figures are estimates.
Source: Turkish Railways.
417. Turkish Railways has a rail investment plan for the period 2010-2012. This plan was
approved by Turkish Railways‘ Board of Directors and the State Planning Organization. It totals
Euro 3.57 billion, of which Euro 2.44 billion is for infrastructure. Nearly half the infrastructure
investment program funds allocated for 2010-2012 are for the Ankara-Istanbul High-Speed
Train—which also includes high-speed train sets—with investments nearly four times higher than
for track renewals and track investments. Investments in rolling stock total Euro 314 million, of
which under half is for freight wagons. Clearly, a large fraction of government funds are being
allocated to the development of high-speed passenger trains. For routes under 300 km, high-speed
rail tends to substitute air transport, and can be important for relieving airport congestion, while
for distances exceeding 1,000 km, air transport becomes more attractive. Investments in high-
speed rail should reflect the nature of potential traffic along those lines, composition of traffic, the
economic development benefits, and cost-recovery considerations.
Figure 205: Turkish Railways – Rail Infrastructure Investments by Type of Line
Note: 2010 figures are estimates.
169
327 270338
442
972
19,432
37,599 31,04538,855
50,810
111,737
100
200
300
400
500
600
700
800
900
1,000
1,100
10,000
30,000
50,000
70,000
90,000
110,000
130,000
2005 2006 2007 2008 2009 2010
Inv
estm
ents
(E
uro
mil
lio
ns)
Inv
estm
ent p
er k
m o
f rr
ack (
Euro
s)
Investments Investment per km
33 73 54122 107
316136
254216
216335
656
0
100
200
300
400
500
600
700
800
900
1,000
2005 2006 2007 2008 2009 2010
High speed lines
Other lines

Railway Reform in South East Europe and Turkey: On the Right Track? Annexes
239
Source: Turkish Railways.
418. As a share of GDP, total state support to Turkish Railways has increased in the last
five years. Total operating subsidies have remained relatively stable over 2005-2009, rising from
0.7 percent of GDP in 2005 to 0.8 percent of GDP in 2009, and equal to Euro 345 million in
2009. However, total state support to Turkish Railways rose from Euro 859 million in 2005 to
Euro 1,418 million in 2009. This is equal to a rise from 0.22 percent of GDP to 0.32 percent of
GDP over the last five years (Figure 206). As per Article 37 of Law No.233, investment
expenditures and operational financing deficits of state-owned enterprises are financed by
Turkey‘s Under-secretariat of the Treasury. In addition, where the prices of services have been set
below the cost of service for public service reasons, Turkish Railways benefits from duty loss
payments, which are equal to the amount of loss for these services plus a 10 percent of profits
calculated over the sales cost of the service. The legal basis for duty loss payments is the Council
of Ministers Decision No.1989/14558—this covers losses stemming from 12 non-economic lines,
Eastern, Southern and Lake Van Express Trains, and Lake Van Ferry. State support is expected
to decline to Euro 1,312 million in 2010, equal to 0.23 percent of GDP.
Figure 206: Turkish Railways - Total State Contribution, 2005-2010
Sources: Turkish Under-secretariat of the Treasury, IMF.
0.220.20
0.16
0.24
0.32
0.23
0.00
0.05
0.10
0.15
0.20
0.25
0.30
0.35
0
200
400
600
800
1,000
1,200
1,400
1,600
2005 2006 2007 2008 2009 2010 (Planned)
Total operating subsidies (Euros) % of GDP

Railway Reform in South East Europe and Turkey: On the Right Track? Annexes
240
ANNEX 2: THE THREE EU RAIL PACKAGES
THE FIRST EU RAILWAY PACKAGE
The European rail strategy aims are: (i) to promote market opening; (ii) to improve performance
of rail freight; (iii) to create incentives for product innovation and service quality—improving the
interoperability and safety of national networks; and (iv) to encourage the development of a
sustainable, well-integrated and efficient rail system. Rail legislation in the 1990s introduced a
certain degree of market opening and prompted the railways to concentrate more on
competitiveness. Since then, the European Commission has put forward further initiatives in the
shape of packages of legislative measures. The First Railway Package, which was adopted by the
European Commission on February 21, 2001, is an important suite of European Directives:
Directive 2001/12/EC, Directive 2001/13/EC and Directive 2001/14/EC. Member States had until
March 15, 2003 to implement the provisions of the Directives in national legislation.
Directive 2001/12/EC was designed to: (i) open the international rail freight market; (ii) establish
a general framework for the development of European railways; and (iii) clarify the formal
relationship between the State and the infrastructure manager on the one hand—and between the
infrastructure manager and railway undertakings (rail undertaking) on the other hand. Directive
91/440/EEC was designed to facilitate the adoption of the Community railways to the needs of
the Single Market by ensuring management independence of rail undertaking. Directive
2001/12/EC amended Directive 91/440/EEC by: (i) separating the management of railway
operation and infrastructure from the provision of railway transport services; (ii) improving the
financial structure of undertakings; and (iii) ensuring access to the networks of Member States for
rail undertaking engaged in international intermodal transport of goods.
More specifically, Directive 2001/12/EC makes the following additions: The infrastructure
manager must have responsibility for its own management, administration and internal control,
and must have established a business plan that includes the investment program and that is
designed so as to ensure financial equilibrium and optimum use of infrastructure. Capacity
allocation, infrastructure licensing and charging must be undertaken by an organization that does
not provide transport operations, in order to create non-discriminatory access to infrastructure.
The Member States must also ensure that compliance with safety standards are verified, rolling
stock and rail undertaking certified, and accidents investigated. Concerning the financial
statements of rail undertaking revenues from Public Service Obligation (PSO) must be shown
distinctively and not be transferred to another item.
Directive 2001/13/EC sets out the conditions that freight operators must meet in order to be
granted a license to operate services on the European rail network, and amends council Directive
95/18/EC. Directive 2001/13/EC states that the license issuing body must be independent from
rail undertaking—and a rail undertaking can also refer to the commission if it claims that the
national requirements are applied in a discriminatory manner. In case of such an appeal, the
Commission must issue a statement. Moreover, the license issuing body must be independent
from the rail undertaking.

Railway Reform in South East Europe and Turkey: On the Right Track? Annexes
241
Directive 2001/14/EC introduces a defined policy for capacity allocation and infrastructure
charging. It replaces Directive 95/19/EC. It defines the conditions for capacity allocation for
infrastructure capacity and management—and for access charge rules—and applies to the entire
network. According to the directive, the infrastructure manager must publish a network statement
that describes the condition and limitation of the network, details of the charging scheme, rules
governing the capacity allocation, and priority rules that apply in case of conflicting demand. The
infrastructure managers must also cooperate to ensure the effectiveness of cross Member States
transport operations.
Furthermore, Member States must establish a charging framework and its specific rules. The
calculation of the charge and the collecting of that charge must be performed by the infrastructure
manager, which will receive the track access fees and will use them to fund its business. If the
infrastructure manager is not independent from a Railway Undertaking, these functions other than
the collection of the fees must to be performed by an independent body. Finally, Member States
must also establish an independent regulatory body with the responsibility to receive claims and
appeals to the decisions of the infrastructure manager. This directive also introduces compulsory
safety certificates for rail undertaking.
THE SECOND EU RAILWAY PACKAGE
The First Rail Package was introduced on February 21, 2001, and Member States had until March
15, 2003 to implement the provisions of the Directives in national legislation. Subsequently, on
January 23, 2002, the European Commission proposed a new set of measures, known as the
"Second Railway Package", aimed at revitalizing the railways through the rapid construction of
an integrated European railway area. The actions presented are based on the guidelines of the
transport White Paper and are aimed at improved safety, interoperability and opening up of the
rail freight market. The Second Railway Package has accelerated the liberalization of rail freight
services by fully opening the rail freight market to competition as of January 1, 2007. In addition,
the package created the European Railway Agency situated in Valenciennes (France), introduced
common procedures for accident investigation, and established safety authorities in each Member
State.
The Second Railway Package was adopted by the European Commission on April 29, 2004; its
aim is to create a legally and technically integrated European railway area. The package contains
four pieces of legislation and a recommendation: (i) Directive 2004/49/EC; (ii) Directive
2004/50/EC; (iii) Directive 2004/51/EC; (iv) Regulation (EC) 881/2004; and (v) the
recommendation covering the accession of the European Community to the Intergovernmental
Organization for International Carriage by Rail (COTIF). The organization is responsible for
further development of rail transport law in areas such as contracts of carriage for the
international carriage of passengers and goods and procedures for the technical admission of
railway vehicles and other railway material used in international traffic and the removal of
obstacles to the crossing of frontiers in international rail transport.
Directive 2004/49/EC (the Railway Safety Directive, now amended by Directive 2008/110/EC)
develops a common approach to rail safety. It lays down a clear procedure for granting the safety

Railway Reform in South East Europe and Turkey: On the Right Track? Annexes
242
certificates that every railway company must obtain before it can run trains on the European
network. It harmonizes safety levels across Europe by, among other things, specifying what
infrastructure managers need to do in order to receive safety authorization.
It also obliges each Member State to establish binding national safety rules. Member States must
annually collect standard safety indicators and must establish a safety authority independent from
any railway undertaking (rail undertaking), infrastructure manager, or applicant and procurement
entity in charge of issuing, renewing, and amending the safety certificates. Moreover, Member
States must also establish an investigating body independent from any rail undertaking,
infrastructure manager, or charging or allocating body. It must investigate any serious accident
and publish an annual report. Finally, any rail undertaking must hold a standard safety certificate
defined in the same directive, and any infrastructure manager must obtain a safety authorization
also defined in the same directive.
Directive 2004/50/EC amended Directives 96/48/EC and 2001/16/EC on the interoperability of
the European high speed and conventional rail systems respectively and is now updated by
Directive 2008/57/EC (the Interoperability Directive). This directive harmonizes and clarifies
interoperability requirements. These requirements concern the design, construction, placing in
service, upgrading, renewal, operation and maintenance of the parts of this system placed in
service after April 30, 2004, as well as the qualifications and health and safety conditions of the
staff who contribute to its operation.
Directive 2004/51/EC opens up both national and international freight services on the entire
European network from 1 January 2007, and amends Directive 91/440/EEC. The EC expects
these measures to lead to greater than expected gains in terms of modal shift and the development
of international rail freight. Furthermore, they should improve the efficiency of the rail mode
relative to other modes of transport. They would also facilitate sustainable transport between and
within Member States by encouraging competition and allowing entry of new enterprises.
Regulation (EC) 881/2004 (now amended by Regulation (EC) 1335/2008) sets up an effective
steering body, the European Railway Agency, to co-ordinate groups of technical experts seeking
common solutions on safety and interoperability. The Agency is a driving force in the policy for
modernizing the European railway sector. Mutually incompatible technical and security
regulations in the twenty-five Member States are a major handicap to the development of the
railway sector. The Agency will work to gradually align these regulations and establish common
safety objectives that all Europe's railways must achieve.
THE THIRD EU RAILWAY PACKAGE
On September 27, 2007, the Commission adopted its "Third Rail Package" containing measures
to revitalize the railways in Europe. The European Commission put forward new proposals to
open up the international passenger transport market by 2010, and to regulate passenger rights
and the certification of train crews. This third package is composed of Directive 2007/58/EC,
Directive 2007/59/EC and Regulation (EC) 1371/2007.

Railway Reform in South East Europe and Turkey: On the Right Track? Annexes
243
Directive 2007/58/EC of the European Parliament and of the Council of October 23, 2007
amends Council Directive 91/440/EEC on the development of the Community‘s railways and
Directive 2001/14/EC on the allocation of railway infrastructure capacity and the levying of
charges for the use of railway infrastructure. Railway undertakings (rail undertaking) established
in Member States must by January 1, 2010 be granted the right of access to the infrastructure in
all Member States for the purpose of operating international passenger service. Furthermore, rail
undertaking must in the course of an international passenger service have the right to pick up
passengers at any station located on the international route and set them down at another,
including stations that are located in the same Member State.
Directive 2007/59/EC lays down conditions and procedures for the certification of train crews
operating locomotives and trains. More specifically, it introduces a European driver license
allowing train drivers to circulate on the entire European network (the certification of cross-
border drivers is foreseen as from 2009, and of all other drivers as from 2011). Drivers have to
meet basic requirements concerning their educational level, age, physical and mental health,
specific knowledge and practical training of driving skills. It also specifies the tasks for which the
competent authorities of the Member States, the train drivers and other stakeholders in the sector,
the rail undertaking, infrastructure managers and training centers are responsible.
Regulation (EC) 1371/2007 on rail passengers' rights and obligations ensures basic rights for
passengers in such areas as insurance, ticketing, and passengers with reduced mobility. While
long-distance travelers will enjoy a wider range of rights, minimum quality standards will have to
be guaranteed to passengers on all lines. Regulation (EC) 1371/2007 establishes quality standards
in the following areas: (i) non-discrimination toward handicapped travelers or persons with
reduced mobility; (ii) liability in case of accidents; (iii) availability of train tickets; and (iv)
personal security of passengers in stations. This proposal sets minimum requirements for
information to be provided to passengers relative to their journey, contract conditions, and the
liability of rail undertaking in cases of accidents, delays or cancellations of services.
The Commission also made a proposal in 2004 for a regulation aiming to improve the quality of
rail services, but the European Parliament rejected it first time around. In particular, the text
proposed establishing mandatory minimum clauses in transport contracts, including a proposal for
a compensation system in the event that freight is delayed or damaged. It would have encouraged
railway undertakings and their clients to regulate quality management contractually.

Railway Reform in South East Europe and Turkey: On the Right Track? Annexes
244
ANNEX 3: EU LEGISLATION APPLICABLE TO THE RAIL SECTOR173
Economic/Market Access Legislation
Regulation No 11, concerning the abolition of discrimination in transport rates and conditions, in
implementation of Article 79 (3) of the Treaty establishing the European Economic Community.
(OJ L 532, 16.8.1960, p1121)
Council Directive 91/440/EEC of 29 July 1991 on the development of the Community's railways
(OJ L 237, 24.8.1991, p. 25);
Directive 2001/12/EC of the European Parliament and of the Council of 26 February 2001 on the
development of the Community's railways (OJ L 75, 15.3.2001, p. 1);
Directive 2001/14/EC of the European Parliament and of the Council of 26 February 2001 on the
allocation of railway infrastructure capacity and the levying of charges for the use of railway
infrastructure and safety certification (OJ L 75, 15.3.2001, p. 29);
Directive 2004/51/EC of the European Parliament and of the Council of 29 April 2004 amending
Council Directive 91/440/EEC on the development of the Community's railways (OJ L 164,
30.4.2004, p. 164-172 and OJ L 220, 21.6.2004, p. 58-60);
Regulation (EC) No 1371/2007 of the European Parliament and of the Council of 23 October
2007 on rail passengers‘ rights and obligations (OJ L 315, 3.12.2007, p. 14).
Interoperability and Safety Regulation
Council Directive 95/18/EC of 19 June 1995 on the licensing of railway undertakings (OJ L 143,
27.6.1995, p. 70);
Directive 2001/13/EC of the European Parliament and of the Council of 26 February 2001 on the
licensing of railway undertakings (OJ L 75, 15.3.2001, p. 26);
Council Directive 96/48/EC of 23 July 1996 on the interoperability of the trans-European high-
speed rail system (OJ L 235, 17.9.1996, p. 6);
Directive 2001/16/EC of the European Parliament and of the Council of 19 March 2001 on the
interoperability of the trans-European conventional rail system (OJ L 110, 20.4.2001, p. 1);
Council Directive 96/49/EC of 23 July 1996 on the approximation of the laws of the Member
States with regard to the transport of dangerous goods by rail (OJ L 235, 17.9.1996, p. 25);
173
This is taken from Annex 1, European Commission (2009), Commission Staff Working Document
accompanying document to the Report from the Commission to the Council and the European Parliament
on Monitoring Development of the Rail Market. Brussels: December 18, 2009, SEC (2009) 1687.

Railway Reform in South East Europe and Turkey: On the Right Track? Annexes
245
Directive 2004/50/EC of the European Parliament and of the Council of 29 April 2004 amending
Council Directive 96/48/EC on the interoperability of the trans-European high-speed rail system
and Directive 2001/16/EC of the European Parliament and of the Council on the interoperability
of the trans-European conventional rail system (OJ L 164, 30.4.2004, p. 114-163 and OJ L 220,
21.6.2004, p. 40 - 57.);
Directive 2004/49/EC of the European Parliament and of the Council of 29 April 2004 on safety
on the Community's railways and amending Council Directive 95/18/EC on the licensing of
railway undertakings and Directive 2001/14/EC on the allocation of railway infrastructure
capacity and the levying of charges for the use of railway infrastructure and safety certification
(OJ L 164, 30.4.2004, p. 44-113 and OJ L 220, 21.6.2004, p. 16 -39);
Regulation (EC) No 881/2004 of the European Parliament and of the Council of 29 April 2004
establishing a European Railway Agency (OJ L 164, 30.4.2004, p. 1-43 and OJ L 220, 21.6.2006,
p.3-14);
Directive 2007/58/EC of the European Parliament and of the Council of 23 October 2007
amending Council Directive 91/440/EEC on the development of the Community‘s railways and
Directive 2001/14/EC on the allocation of railway infrastructure capacity and the levying of
charges for the use of railway infrastructure (OJ L 315, 3.12.2007, p. 44);
Directive 2007/59/EC of the European Parliament and of the Council of 23 October 2007 on the
certification of train drivers operating locomotives and trains on the railway system in the
Community (OJ L 315, 3.12.2007, p. 51);
Directive 2008/57/EC of the European Parliament and of the Council of 17 June 2008 on the
interoperability of the rail system within the Community (Recast) (OJ L 191, 18.07.2008, p. 1);
Directive 2008/68/EC of the European Parliament and of the Council of 24 September 2008 on
the inland transport of Dangerous Goods (OJ L 260, 30.9.2008, p. 13);
Directive 2008/110/EC of the European Parliament and of the Council of 16 December 2008
amending Directive 2004/49/EC on safety on the Community's railways (Railway Safety
Directive) (OJ L 345, 23.12.2008, p. 62);
Regulation (EC) No 1335/2008 of the European Parliament and of the Council of 16 December
2008 amending Regulation (EC) No 881/2004 establishing a European Railway Agency (Agency
Regulation) (OJ L 354, 31.12.2008, p. 51).
Public Service Obligations
Regulation (EC) No 1370/2007 of the European Parliament and of the Council of 23 October
2007 on public passenger transport services by rail and by road and repealing Council
Regulations (EEC) Nos 1191/69 and 1107/70 (OJ L 315, 3.12.2007, p. 1).

Railway Reform in South East Europe and Turkey: On the Right Track? Annexes
246
Freight Rail Corridors
Regulation (EC) No 913/2010 of the European Parliament and of the Council of 22 September
2010 concerning a European rail network for competitive freight (OJ L 276, 20.10.2010, p.22).

Railway Reform in South East Europe and Turkey: On the Right Track? Annexes
247
ANNEX 4: FRAMEWORK BORDER-CROSSING AGREEMENT
Framework Agreement
between
the Government of the Republic of XXX
and
the Government of the Republic of XXX
on
Border Dispatching for Rail Transport
The Government of the Republic of ......... and the Republic of ......, - hereinafter referred to as
Contracting Parties , having the intention to establish a Framework Agreement setting out the
principles of an open access border-crossing among themselves by concluding the Border
Dispatching for Rail Transport with the aim of increasing the competitiveness of the rail services,
have adopted the present Framework Agreement - hereinafter called ―Agreement‖ - which shall
be the basis, in structure and contents of further subsequent agreements between the respective
authorities of the Contracting Parties.
Article 1
Definitions
For the purpose of the Agreements the following definitions are applied:
1. "Border dispatching for rail transport" the implementation of all rules and regulations of the
Contracting Parties which are applied for the border-crossing of persons as well as the import,
export and transit of goods.
2. "Border Network Statement" means the statement which sets out in detail the general rules,
deadlines, procedures and criteria concerning the charging and capacity allocation schemes of
the infrastructure in the ZONE. It shall also contain such other information as is required to
enable application for infrastructure capacity. It may be part of the Network Statements of the
infrastructure managers of the Contracting Parties.
3. ―Border Railway Line‖ border line between the railway infrastructure networks of the
Contracting Parties.
4. ―Border Section‖ the part of the network between the border railway station and the border
railway line of the Contracting Parties.
5. "Border Railway Station‖ a railway station in the ZONE.
6. ―Domestic State‖ the territory of the State of the Contracting Party, where the border
dispatching for rail transport shall be performed by the official personnel of the other
Contracting Party.
7. ―Goods‖ are parcels, luggage, other consignments and the means of transport.

Railway Reform in South East Europe and Turkey: On the Right Track? Annexes
248
8. ―Infrastructure Manager‖ any body or undertaking responsible in particular for establishing
and maintaining railway infrastructure. This may also include the management of
infrastructure control and safety systems. The functions of the infrastructure manager on a
network or part of a network may be allocated to different bodies or undertakings. (Article 3 of
91/440/EEC).
9. "International Rail Service" any freight and passenger transport service where the train
crosses the border of a Contracting Parties; the train may be joined and/or split and the
different sections may have different origins and destinations, provided that all wagons or
cars cross the border".
10. "Joint Border Railway Station‖ the border railway station in the ZONE where joint border
dispatching for rail transport is carried out.
11. ―Neighbouring State‖ the territory of the State of the other Contracting Party".
12. "Network" means the entire railway infrastructure managed by an infrastructure manager;
(Article 3 of 2001/14/EC).
13. ―Official Personnel‖ all personnel who perform, on behalf of the competent state border
authorities of the Contracting Parties, the obligatory border dispatching for rail transport on
the territory of the domestic and neighbouring state as well as on the moving trains.
14. "One-stop-shop (OSS)" the joint network statement of the infrastructure managers of the
Contracting Parties, who manage the infrastructure in the ZONE;
15. ―Railway Personnel‖ all personnel who participate, on behalf of a railway undertaking or an
infrastructure manager, in the rail border dispatching.
16. ―Railway undertaking‖ any public or private organisation licensed according to applicable
Community legislation, the principal business of which is to provide services for the transport
of goods and/or passengers by rail with a requirement that the undertaking must ensure
traction; this also includes undertakings, which provide traction only. (Article 3 of
91/440/EEC).
17. "Single Window" all customs services carried out by the customs authorities of the Contracting
Parties at one and the same location in the ZONE in order to allow to lodge customs
documents.
18. "Zone" the part of the territory of the Domestic State, on which the official personnel of the
neighbouring state is authorised to perform border dispatching for rail transport.
Article 2
General Provisions, Objectives and Principles
1. It is the objective of the Agreement to simplify the border dispatching for rail transport and
reduce the waiting times at the Border-crossing Point by:
carrying out border dispatching for rail transport activities of one Contracting Party on
the territory of the other Contracting Party;
establishing the rules for the border dispatching for rail transport of one Contracting Party
on trains that are moving on the territory of the other Contracting Party;
2. The Contracting Parties guarantee the:

Railway Reform in South East Europe and Turkey: On the Right Track? Annexes
249
open access for rail undertakings which wish to enter into the Zone with the aim of
crossing the border by means of a simplified procedure of mutual acceptance of licences,
safety certificates, traction, rolling stock and driving licences for train drivers;
non-discrimination and fair competition in respect to the open access;
acceptance of International Conventions (e.g. COTIF - CIM -/SMGS) as freight and
passenger documents;
acceptance of other internationally accepted transport documents;
freedom of rail undertakings to organise their own rail border dispatching procedures by
making subsequent agreements between the respective authorities of the Contracting
Parties.
freedom of the border authorities to conclude subsequent bilateral agreements with each
other, in particular;
3. The Contracting Parties undertake steps to transfer border dispatching for rail transport to
hinterland terminals as far as the laws and regulations render it possible. Such border
dispatching for rail transport will be accepted by the same border authority at the border.
4. The Contracting Parties agree to publish on the website all documents and procedures
required by the border authorities and the infrastructure managers for a smooth border-
crossing.
5. The Contracting Parties agree that their infrastructure managers establish a joint network
statement ensuring:
non-discriminatory network admission procedures for the rail undertakings to enter the
Zone;
one-stop-shop procedures to render easy purchasing of infrastructure services possible;
path allocation procedures;
procedures on infrastructure fee and invoicing that are non-discriminatory, ensure fair
competition and render easy payments possible by the rail undertakings.
Article 3
The Railway Zone
1. The Railway Zone comprises:
a) the premises where the border authorities of the other Contracting Party can carry out
their functions, the tracks and lines, freight and passenger stations, warehouses, waiting
facilities for passengers, other buildings and facilities;
b) the trains moving between the defined sections or stations during which border
authorities carry out their duties.
2. The general provisions, objectives and principles enumerated in Article 2 are valid in the
Railway Zone.
3. The following service principles are valid in the Railway Zone:
the single window principle for freight customs;
the one-stop-shop for the use of rail infrastructure in the Zone;

Railway Reform in South East Europe and Turkey: On the Right Track? Annexes
250
rail passenger control on moving trains;
4. In the Agreement, the Railway Zone comprises:
a) the border railway stations ...... and .......,
b) the border sections between the two border railway stations;
c) the sections between ....... and .......... for rail passenger control on moving trains;
d) the sections between ...... and ........ for moving freight trains;
5. The joint border railway station shall be ..........
6. Each border authority of the Contracting Party is free to extend the Railway Zone for its own
purposes in agreement with the general provisions, objectives and principles stipulated in
Article 2, by concluding subsequent agreements between the respective authorities of the
Contracting Parties.
Article 4
Border Dispatching for rail transport in the Railway Zone
1. In the Zone, the laws and regulations of the other Contracting Party are valid concerning the
border-crossing of persons, of goods (import, export and transit) with the following
principles:
Persons and goods are treated with the same procedures and with the same legal
consequences as if they were in the territory of the other Contracting Party;
Actions such as police, customs or other interventions and the putting into custody of
persons and goods have to be agreed in subsequent agreements between the respective
authorities of the Contracting Parties.
2. In such subsequent agreements, the border authorities may also transfer their border
dispatching powers to each other in order to achieve the objectives and principles stipulated
in Article 2.
3. As long as the border authorities of the other Contracting Party have not transferred border
dispatching powers to each other, the border authorities of the one Contracting Party carry out
the procedures before the border authorities of the other Contracting Party carry out their
procedures. The same shall be valid if the official personnel of the exit state refuse
performance of border control and procedures. This point is valid until entering into force of
other subsequent agreements
4. Once the border dispatching for rail transport procedure of the other Contracting Party has
started, the authorities of the one Contracting Party have terminated their functions unless
they have judicial reasons to intervene but only with agreement of the respective authorities
of the other Contracting Party.
5. The rights concerning political asylum and the human rights of the one Contracting Party
remain valid.
6. The personnel of the border authorities of the other Contracting Party carrying out their
functions shall be liable solely to their own authorities.
7. The personnel of the Contracting Parties shall co-operate with each other.

Railway Reform in South East Europe and Turkey: On the Right Track? Annexes
251
8. The official personnel of the other Contracting Party shall have the right of free transfer of
financial resources and the commodities detained and confiscated in the territory of the one
Contracting Party.
9. Commodities detained and confiscated during the checks performed at the exit and returned
to the other Contracting Party by its official personnel, shall not be subject of border
inspection by the personnel of the one Contracting Party.
Article 5
Border Dispatching on Board of Passenger Trains
1. Border dispatching for rail transport shall be jointly carried out either in trains running in the
Zone or stopping in the border railway stations by the personnel of the border authorities of
the Contracting Parties.
2. External security at the border stations shall be ensured by the respective border authorities of
the one Contracting Party.
3. The performance of the border dispatching for rail transport on board of passenger trains shall
be regulated by subsequent agreements between the respective authorities of the Contracting
Parties.
Article 6
Border Dispatching and Checking of Freight Trains
1. Border dispatching shall be performed in the Zone by the border authorities of the
Contracting Parties.
2. External security in the Zone shall be ensured by the respective border authorities of the one
Contracting Party.
3. The performance of the border dispatching and checking of freight trains shall be regulated
by subsequent agreements between the competent authorities of the Contracting Parties.
4. Border checking of freight trains may also be done outside the Zone in hinterland terminals in
the sense of Article 2, Paragraph 3. In this case, the customs of the Contracting Parties shall
conclude the relevant agreements which define the terminals and the respective dispatching
and checking procedures.
5. Article 14 (Commission) shall be applied accordingly.
Article 7
Exchange of Information
While on duty, the personnel may exchange information. Information exchange shall be carried
out on the basis of subsequent agreements concluded between the respective border authorities of
the Contracting Parties.
Railway Reform in South East Europe and Turkey: On the Right Track? Annexes
252
Article 8
Status of the Official Personnel
1. The personnel of the border authorities have, while on duty, free access into the Zone of the
other Contracting Party, in uniforms. The personnel of the other Contracting Party receive the
same protection and support as the personnel of the one Contracting Party.
2. For its personnel, the laws and regulations of the other Contracting Party are valid in the
Zone.
3. Its personnel need special identification cards to act in the Zone. The issuing procedure is
defined in Article 10.
4. If one of the personnel of the other Contracting Party is killed or injured or loses goods which
they carry with them (arms, uniforms etc.), while on duty, the laws and regulations of the
other Contracting Party apply.
5. Further details concerning duration, prolongation, withdrawal, questions on liability and
insurance as well as other issues for the personnel are regulated in subsequent agreements
between the respective authorities of the Contracting Parties.
6. Criminal acts or violations directed against the official or railway personnel of the other
Contracting Party on duty shall be treated in accordance with the legislation of the one
Contracting Party, under the same conditions as if occurred to the personnel of the domestic
state. Further details shall be concluded in subsequent agreements.
7. Based upon an inquiry for bearing the responsibility for the activities performed by the
personnel of the other Contracting Party in the Zone, a subsequent agreement shall detail the
legal assistance. Upon such inquiries the official personnel, citizens of both Contracting
Parties, shall be entitled to equal rights.
8. The official and the railway personnel of the other Contracting Party on duty in the Zone
must wear official uniform or visible official insignia.
Article 9
Border Dispatching Facilities
1. On trains, the rail undertakings offer reserved compartments, free of charge, for the official
personnel on duty.
2. Concerning the space and rooms in the Zone assigned to the border authorities of the other
Contracting Party, the border authorities conclude subsequent agreements between the
respective authorities of the Contracting Parties detailing the rent, compensation for services
rendered as well as issue of liability for damage.
3. Space and rooms are to be identified by inscription and the national coat-of-arms. The
inscriptions on office premises shall be written in the official languages of the Contracting
Parties and English language, with the official language of the other Contracting Party
inscribed first.
4. No customs formalities for the personnel on duty are required. Material, including motor
vehicles of the border authorities and of its personnel used for the execution of the duties is
not subject to customs declaration and excise duties or other duties.
5. The border authorities are free to conclude subsequent agreements between the respective
authorities of the Contracting Parties concerning the issues mentioned in this Article in
accordance with Article 2 of this Agreement.

Railway Reform in South East Europe and Turkey: On the Right Track? Annexes
253
Article 10
Identification Card for the official and railway personnel
1. In accordance with Article 8, Paragraph 3, specific identification cards shall be issued by the
competent authorities of the Contracting Parties for the length of one year. Its term of validity
and must be legalised by the competent authorities of both Contracting Parties.
2. The issuing authority shall be obliged to immediately invalidate the specific identification
card if the respective person does not carry out any longer his duties in the Zone.
3. The issuing authority shall immediately notify the competent authority of the neighbouring
state of the invalidation.
4. In order to facilitate the rail dispatching operations, the railway personnel without specific
identification card must be registered in the Staff List. The model is shown in the Attachment
No. 1.
5. The persons mentioned on the Staff List shall have the right to cross the state border inside
the ZONE while on duty and to stay in the territory of the state of the other Contracting Party
during the performance of their duties. All the persons, whose names are on the Staff List,
must possess their identification cards with photos or passports.
Article 11
Communication Devices
The one Contracting Party shall grant the permission of installing communication devices for the
border authorities of the other Contracting Party on its territory. The installation, maintenance and
operation of communication devices shall be subject of subsequent agreements between the
respective authorities of the Contracting Parties.
Article 12
Language
The Contracting Parties guarantee that the border authorities are free to choose which language to
use, in subsequent agreements between the respective authorities of the Contracting Parties.
Article 13
Management Funds of Railway Personnel
The railway personnel shall have the right to carry the amounts collected for the rail services
across the border in both directions.
Article 14
Commission
1. The Contracting Parties will establish a Commission comprised of one member of each
border authorities which is to ensure:

Railway Reform in South East Europe and Turkey: On the Right Track? Annexes
254
Implementation of the Framework Agreement;
non-discriminatory access for rail undertakings into the Zone;
an environment fostering fair competition;
arbitration between infrastructure managers and railway undertakings concerning the
border network statement;
arbitration between railway undertakings using rail border facilities;
solutions of problems arising from the cooperation of the border authorities in the Zone;
improvement of border services;
solution of any other differences between the Contracting Parties resulting from the
present Agreement;
2. The Commission might invite to their meetings rail undertakings and infrastructure managers
that are involved in the border dispatching for rail transport.
3. The Commission shall meet at least once a year.
4. The rules and regulations of the work of the Commission shall be decided at its first meeting.
Article 15
Validity
1. This Agreement is concluded for an indefinite period.
2. Any Contracting Party has the right to terminate it.
3. This Agreement shall be terminated 6 (six) months after the receipt of the diplomatic note by
which the other Contracting Party notifies its intention to terminate the Agreement.
4. With the Agreement entering into force, the Interim Protocol for the Regulation of Border
Railway Traffic signed on December 20, 2005 shall cease its validity.
Article 16
Modification of the Agreement
1. The Agreement may be subject to modification upon receipt of a formal request by one of the
Contracting Parties.
2. Within 30 days upon receipt, the Contracting Parties shall convene for the first time to deal
with the request.
3. The result of the negotiations shall be reported to the Governments which shall decide upon
the modification proposal.
Article 17
Mandate
The Contracting Parties may give mandate to their competent rail undertakings and infrastructure
managers to conclude subsequent agreements for the purpose of improving the border-crossing in
the sense of Article 2.

Railway Reform in South East Europe and Turkey: On the Right Track? Annexes
255
Article 18
Subsequent agreements between the respective authorities of the Contracting Parties
Within 90 days after the Agreement has entered into force, the following subsequent agreements
shall signed:
Implementing Subsequent Agreement between Border Police of the Contracting Parties ;
Implementing Subsequent Agreement between Customs of the Contracting Parties;
Implementing Subsequent Agreement between Phyto-sanitary of the Contracting Parties;
Implementing Subsequent Agreement between Sanitary of the Contracting Parties;
Implementing Subsequent Agreement between Veterinary of the Contracting Parties;
Implementing Subsequent Agreement between Radiation of the Contracting Parties;
Implementing Subsequent Agreement between other border authorities of the Contracting
Parties if necessary;
Implementing Subsequent Agreement between the Infrastructure managers on the
interconnection of networks of the Contracting Parties;
Border Network Statement agreed between the infrastructure managers, which will be a
common Annex to the Network Statement of the two infrastructure managers.
Article 19
Concluding Provisions
The Agreement shall be subject to ratification and shall enter into force 8 (eight) days after the
Contracting Parties have informed each other by diplomatic notes that the ratification has been
performed in compliance with the provisions of their national legislation.
IN WITNESS WHEREOF, the undersigned, duly authorised by their Governments, have signed
this Agreement.
Signed in………… on ……………..…. 2010 in two (2) original copies in..... and .........
languages.
In case of divergence in interpretation the English text shall prevail.
FOR THE GOVERNMENT OF the REPUBLIC
of............
FOR THE GOVERNMENT OF REPUBLIC of
.............

Railway Reform in South East Europe and Turkey: On the Right Track? Annexes
256
ANNEX 5: MODEL AGREEMENT ON INFRASTRUCTURE
INTERCONNECTION
Agreement on the interconnection of rail infrastructure networks between
infrastructure manager A and infrastructure manager B concerning the border-crossing between
……………………….. and ……………………..
Final Version (Version 5)
Preamble
Pursuant to the bilateral border-crossing agreement between …. and ….., dated …..on
Border Dispatching for Rail Transport in the SEETO Region and with the neighbouring countries
of the European Union - hereinafter called the Border-crossing Agreement -
and
in order to improve international rail transport between the railway networks of …… and ….. the
present agreement shall be concluded between the two infrastructure managers, hereinafter called
the Party or Parties.
The present Agreement – hereinafter called the Agreement - is based on the European Directives
91/440 ECC, 2001/14/EC and 2001/16 EC as in force.
Article 1 – Scope of the Agreement
1.1 The Agreement contains the framework conditions for the interconnection of rail
infrastructure between the contracting parties – hereinafter called the Parties – for the
border-crossing between …. and …
1.2 Whenever specific rules and regulations are required in order to regulate particular local
and operational matters, the Parties shall conclude specific agreements.
Note for the reader: Special agreements might be necessary whenever there are different
electrification systems which require specific operational matters such as speed, catenary without
current or catenaries with double current.
Article 2 – Definitions
For the purpose of the Agreement the definitions of Article1 of the Border-crossing Agreement
are applied.
Article 3 – Principles for the provision of services
3.1 The Parties shall make separate agreements for any kind of services that will be provided
in the realm of the Agreement, in particular concerning
a) the detailed scope and form of the services provided
b) the remuneration for the services
c) the payment procedures for the services rendered
3.2 Unless agreed separately, the payments shall be made on a monthly basis immediately
after the provision of services.

Railway Reform in South East Europe and Turkey: On the Right Track? Annexes
257
3.3 The Parties shall not invoice each other for the following services:
a) installation and continuance on the site of signals, other operational signposts, cables,
installations for electrification including catenary, on the territory of the other Party;
b) technological testing operations on the infrastructure of the other Party;
c) operation on the infrastructure of the other Party for maintenance and repair of
installations and the infrastructure.
Article 4 - Personnel
4.1 Each Party is responsible for its personnel operating in the ZONE.
4.2 The Parties support each other in the training and further education of their respective
personnel working in the ZONE. The costs for training and further education shall be borne by
the Party who assigns its personnel.
4.3 In case of prosecution subject to penal, civil or police action concerning the assigned
personnel working in the ZONE, the dispositions and procedures of the Border-crossing
Agreement shall be applied. Each Party shall be obliged to provide the necessary information
required by the other Party and by the respective border authorities.
4.4 Whenever the personnel of one Party shall be injured or become ill during the execution
of its duties on the territory of the other Party, the other Party shall be obliged to supply the
necessary aid to help the personnel concerned. The Party the personnel of which are affected shall
bear the cost for such aid.
4.5 Each Party shall be entitled to supervise its personnel on the territory of the other Party.
4.6 In accordance with the Border-crossing Agreement, the language shall be ……
Article 5 – Laws, rules and regulations
5.1 The laws of the country are valid, on which the territory the railway infrastructure is
situated. The same applies for all safety and operational rules and regulations of the Party on the
territory of which the infrastructure is situated.
5.2 The Parties exchange, free of charge, all rules and regulations concerning the
infrastructure and the operation of the infrastructure in the ZONE.
5.3 In case that the signaling and operational rules and regulations of both Parties differ, the
Parties shall agree to develop specific safety and operational rules for the ZONE in a separate
agreement.
5.4 The personnel of both Parties are obliged to know the respective safety and operational
rules and regulations which are valid in the ZONE. If specific training is required for the
personnel of one Party, such party shall train, and if required, examine and certify the personnel
of the other Party free of charge.
Article 6 – Mutual acceptance of licenses, certifications, authorisations and permits
The Parties agree to mutually accept any licenses, safety certificates, safety authorisations and
other permits dealing with safety and interoperability issued by the competent Regulatory
Authority of the neighbouring country.

Railway Reform in South East Europe and Turkey: On the Right Track? Annexes
258
Article 7 – Mutual acceptance of rolling stock
7.1 The Parties agree to accept any technical inspections or checks on rolling stock carried
out by railway undertakings with agreements of mutual confidence with other railway
undertakings or the other Party in the sense of mutual confidence in order to speed up the border
dispatching procedures in the ZONE. Such mutual acceptance of rolling stock may not be limited
to the ZONE.
7.2 The rolling stock is meant to be any type of wagon, car, traction and other material on rail
wheels.
7.3 The mutual acceptance shall, in particular, be applied to passenger trains, container trains
and other trains the wagon and car composition of which does not change.
7.4 One Party may also carry out the technical inspection of rolling stock in one of its
hinterland terminals. In this case, the other Party shall notify which rolling stock or trains it
accepts.
7.5 The Parties agree to accept agreements on mutual acceptance of technical inspections or
checks on rolling stock, concluded by railway undertakings after due and joint consideration, in a
non-discriminatory and fairest manner. In case of disagreement on the acceptance of such an
agreement, the Parties shall call upon the Border Commission or the competent regulatory
authority for final decision.
7.6 If one Party does not deem it necessary to carry out the technical inspections or checks on
rolling stock in the ZONE, the Party shall notify the other Party. The Parties shall decide on how
to proceed in the mutual acceptance of the rolling stock and, if necessary, shall conclude the
respective agreements of mutual acceptance with the railway undertakings.
Article 8– Measures in case of incidents, accident, operational irregularities or dangerous
events
8.1 In case of incident, accident, operational irregularities or dangerous events the Party on
the territory of which it has occurred shall report immediately to the other Party. The Parties shall
agree on the procedure on how to communicate.
8.2 The Party on the territory of which the incident, accident, operational irregularity or
dangerous event has occurred, shall be responsible for its removal. The Party shall also be in
charge of supervising the event. The Party is obliged to reinstall the operations as quickly as
possible. The Party may ask the other Party for support. Any support in personnel and material
shall be compensated by the other Party. The compensation shall be based on the purchasing costs
or the cost occurred to the other Party.
8.3 The accident and incident investigation shall be carried out according to the rules and
regulations in force on the territory of which the event occurred. The Party shall invite
representatives of the competent body of the neighbouring state to participate in the investigation.
8.4 The results of the investigation shall be communicated to the other Party as soon as
possible.
8.5 In case of dangerous events which must be reported to the competent regulatory
authority, the Party on the territory of which the event occurred, must carry out such
communication as soon as possible in order to receive instructions on how to proceed with the

Railway Reform in South East Europe and Turkey: On the Right Track? Annexes
259
investigation. Until reception of instructions from the competent regulatory authority, no activity
for the removal of the dangerous event shall be undertaken.
Article 9 - Maintenance in the ZONE
9.1 Each Party is responsible for the maintenance of its section of infrastructure in the
ZONE.
9.2 The Parties may agree upon joint maintenance measures.
9.3 The Parties shall jointly plan the maintenance measures in the ZONE before commencing
any maintenance works.
9.4 Unless agreed separately, the costs of maintenance shall be borne by each Party for its
own infrastructure in the ZONE.
9.5 Any major construction and maintenance work which requires to be planned ahead shall
be communicated not later than 9 months before its commencement to the other Party in order to
ensure a harmonised planning.
9.6 Smaller works which require to be planned ahead shall be communicated to the other
Party not later than 3 months before their commencement in order to ensure a harmonised
planning.
9.7 All works carried out by one Party in the ZONE which has repercussions on the costs of
the other Party shall be borne by the Party that carries out the works unless agreed differently.
Cost sharing may be possible for the purpose of ensuring a harmonious maintenance programme
in the ZONE.
Article 10 – Liability
10.1 Each Party is liable for any damage occurred on its section of the infrastructure in the
ZONE.
a) The liability covers damage caused by 3rd
parties including railway undertakings
according to the liability clauses stipulated in the respective network statements.
b) The Parties may agree to define the liability for damages occurring inside the ZONE in
separate agreements or joint network statements. Such agreements and joint network
statements must be published.
10.2 In case of any damage caused by any infrastructure installation, the Party is liable that is
in charge of such infrastructure installation unless the Party can prove that the damage has been
caused by the 3rd
party.
10.3 In case that the both Parties are liable for the damage occurred; each Party shall be liable
for its share of the damage.
10.5 The same applies for damages occurred by the respective personnel of the Parties.
10.6 The Parties may make out joint civil liability insurances for the infrastructure in the
ZONE.

Railway Reform in South East Europe and Turkey: On the Right Track? Annexes
260
10.7 The Parties agree to relieve themselves from any mutual claims. This applies in particular
whenever one Party shall receive a claim from a 3rd
party which should have been directed to the
other Party.
10.8 In case that one Party shall have to indemnify the other Party its personnel, independent
or dependent contractors against all actions, claims, costs (including costs and expenses in
defending such matter and the proper compromise of), losses (including without limitation)
consequential losses and loss of profits or demands for personal injury or death or for loss of or
damage to property arising directly or indirectly out of or incidental to or in connection with
damage hereunder.
10.9 The Parties shall wholly relieve each other of liability and indemnity occurring form the
following risks: War, invasion of foreign enemy, hostilities (whether war be declared or not),
civil war, rebellion, revolution, insurrection, mutiny, riot, civil commotion, military or other
usurpation, a group of persons acting on behalf of or in connection with any political
organisation, conspiracy, confiscation, commandeering, requisition, destruction or damage by
order of any government de jure or de facto or by any public authority, or radioactive
contamination, or pressure waves (such as Tsunami), other pressure waves caused by aircraft or
other aerial devices travelling at sonic or supersonic speed.
10.10 Each Party shall inform its insurers and the other Party in writing of any legal disputes,
claims or proceedings brought or instituted against it. Each Party shall render all reasonable
assistance to the other in its defense or other action in respect of all such claims, disputes or
proceedings made by Passengers or their representatives.
Article 11 – Force majeure
11.1 ―Force majeure‖ means an event beyond the control of either Party which by its nature
could not have been foreseen by such party or if it could have been foreseen was unavoidable and
includes but shall not be limited to acts of beyond the force of mankind (Acts of God), storms or
flood, fires, riots, sabotage, civil commotion or civil unrest, interference by civil or military
authorities, acts of war (declared or undeclared) and failure of energy sources.
11.2 Neither Party shall be under any liability for failure to fulfill any obligation under the
Agreement so long as and to the extent to which the fulfillment of such obligation is prevented,
frustrated, hindered or delayed as a consequence of circumstances of force majeure.
11.3 Promptly on becoming aware of force majeure causing a delay in performance or
preventing performance of any of the obligations imposed or matters contemplated by this
Agreement (and termination of such delay), either Party effected by force majeure shall notify the
other Party of the force majeure on its nature without delay and not later than twelve hours from
the occurrence of the force majeure.
Article 12 – Exchange of data
12.1 The exchange of data shall have as its basis the European Directive 95/46/EC dated
24.10.1995.
12.2 The Parties agree not to communicate any data to third parties without the agreement of
those that have made available the data, except for those data which must be communicated to the
respective national regulatory authorities. In case that one Party is an integrated railway company,
such Party in its function as infrastructure manager, be it a department or an independent legal
Railway Reform in South East Europe and Turkey: On the Right Track? Annexes
261
entity of the integrated railway, is not allowed to communicate the exchange data to other
departments or entities of the integrated railway company.
12.3 The exchange of data shall be free of charge.
Article 13 – Validity
13.1 The Agreement is concluded for an indefinite period. Each Party has the right to terminate
it.
13.2 The Agreement shall be terminated 6 (six) months after the receipt of the written notification
by which the other Party notifies its intention to terminate the Agreement.
13.3 With the Agreement entering into force, the following agreement(s)
………………..
shall cease its (their) validity.
Article 14 – Applicable law
The Agreement shall be subject to the law of the respective state in which each Party is registered
for the section of the infrastructure in the ZONE that belongs to the respective state. The EU
Directive 2001/14/EC shall be applied in an analogous manner.
Article 15 – Arbitration
15.1 Any differences resulting from the Agreement shall be dealt with in the Border
Commission as stipulated in the Border-crossing Agreement.
15.2 In case that the Border Commission does not arrive at a decision acceptable to the Parties,
the Parties are free to use an international arbitration commission upon mutual agreement.
15.3 In case that the Parties cannot agree on the international arbitration commission, the
Parties are free to appeal to the competent International Court of Justice.
Article 16 – Concluding Provisions
The Agreement shall enter into force ………days after the Parties have signed it.
IN WITNESS WHEREOF, the undersigned, duly authorised, have signed the Agreement.
Signed in………… on ……………..…. 20XX in two (2) original copies in ……….. and
………….. languages, all texts being equally authentic.
For the Infrastructure Manager A For the Infrastructure Manager B

Railway Reform in South East Europe and Turkey: On the Right Track? References
262
REFERENCES
BDZ EAD (2009), Annual Management Report 2008 Consolidated. Sofia, June 2009.
Booz, Allen and Hamilton (2007), Designing an Infrastructure Access Regime and Network
Statement for the Rail Sector in Serbia. Methodology Report. November 2007.
Bosnia and Herzegovina Railways Public Corporation (2005), Investment Plan 2005 – 2009,
Sarajevo.
CER (2008), Towards a Sustainable Rail Network. Annual Report, May 2008.
CFR Calatori SA (2009), Consolidated Financial Statements as at and for the Year Ended 31
December 2008 Prepared in Accordance with the International Financial Reporting Standards.
26 June 2009.
CFR Marfa SA (2010), Consolidated Financial Statements as at and for the Year Ended 31
December 2009 Prepared in Accordance with the International Financial Reporting Standards.
15 June 2010.
CFR SA (2009), Consolidated Financial Statements Prepared in Accordance with International
Financial Reporting Standards. December 31, 2009.
Council of the European Union (2009), Council Regulation 169/2009 applying rules of
competition to transport by rail, road, and inland waterways. Brussels, February 26, 2009.
DB International, Vienna Consult and viadonau (2008), Provision of Studies for Intermodal
Transport in Bosnia and Herzegovina. A study funded by the European Union.
Di Pietrantonio, Loris and Pelkmans, Jacques (2004), The Economics of EU Railway Reform,
Bruges European Economic Policy Briefing No.8. Bruges, September 2004.
ECORYS (2005), Trade and Transport Facilitation in Southeast Europe (TTFSE) 2—Railway
Corridor and Border-crossing Study.
European Commission (2010), State Aid: Commission Temporarily Authorizes BGN 249 Million
Rescue Aid for Bulgarian Railway Company, Press Release IP/10/1733, Brussels, December 16,
2010
European Commission (2010), Rail services: Commission legal action against 13 Member States
for failing to fully implement first railway package. Press release IP/10/509, Brussels, June 24,
2010.
European Commission (2010), Rail transport: Commission warns Bulgaria over lack of
implementation of the ‗First Rail Package‘. Press release IP/10/509, Brussels, May 5, 2010.
European Commission (2010), Analytical Report accompanying the Communication from the
Commission to the European Parliament and the Council, Commission Opinion on Albania‘s
application for membership of the European Union. Commission Staff Working Paper,
SEC(2010) 1335, November 9, 2010.
Railway Reform in South East Europe and Turkey: On the Right Track? References
263
European Commission (2010), Bosnia and Herzegovina 2010 Progress Report, accompanying
the Communication from the Commission to the European Parliament and the Council.
Commission Staff Working Document, SEC(2010) 1331, Brussels, November 9, 2010.
European Commission (2010), Croatia 2010 Progress Report, accompanying the Communication
from the Commission to the European Parliament and the Council. Commission Staff Working
Document, SEC(2010) 1326, Brussels, November 9, 2010.
European Commission (2010), Former Yugoslav Republic of Macedonia 2010 Progress Report,
accompanying the Communication from the Commission to the European Parliament and the
Council. Commission Staff Working Document, SEC(2010) 1332, Brussels, November 9, 2010.
European Commission (2010), Kosovo 2010 Progress Report, accompanying the Communication
from the Commission to the European Parliament and the Council. Commission Staff Working
Document, SEC(2010) 1320, Brussels, November 9, 2010.
European Commission (2010), Montenegro 2010 Progress Report, accompanying the
Communication from the Commission to the European Parliament and the Council. Commission
Staff Working Document, SEC(2010) 1334, Brussels, November 9, 2010.
European Commission (2010), Serbia 2010 Progress Report, accompanying the Communication
from the Commission to the European Parliament and the Council. Commission Staff Working
Document, SEC(2010) 1330, Brussels, November 9, 2010.
European Commission (2010), Turkey 2010 Progress Report, accompanying the Communication
from the Commission to the European Parliament and the Council. Commission Staff Working
Document, SEC(2010) 1327, Brussels, November 9, 2010.
European Commission (2009), Albania 2009 Progress Report, accompanying the Communication
from the Commission to the European Parliament and the Council. Commission Staff Working
Document, SEC(2009) 1337, Brussels, October 14, 2009.
European Commission (2009), Commission warns Member States over lack of implementation of
the ‗first rail package‘. Press release IP/09/1438, Brussels, October 8, 2009.
European Commission (2009), Report from the Commission to the Council and the European
Parliament, Second Report on Monitoring Development of the Rail Market. COM (2009) 676
final, Brussels, December 18, 2009.
European Commission (2009), Commission Staff Working Document accompanying document to
the Report from the Commission to the Council and the European Parliament, Second Report on
Monitoring Development of the Rail Market, SEC(2009) 1687, Brussels, December 18, 2009.
European Commission (2009), EU Energy and Transport in Figures: Statistical Pocketbook
2009, Directorate-General for Energy and Transport. Luxembourg: Office for the Official
Publications of the European Communities.
European Commission (2009), Serbia 2009 Progress Report, accompanying the Communication
from the Commission to the European Parliament and the Council. Commission Staff Working
Document, SEC(2009) 1339, Brussels, October 14, 2009.
European Commission (2009), Albania 2009 Progress Report, accompanying the Communication
from the Commission to the European Parliament and the Council. Commission Staff Working
Document, SEC(2009) 1337, Brussels, October 14, 2009.

Railway Reform in South East Europe and Turkey: On the Right Track? References
264
European Commission (2008), Turkey 2008 Progress Report, accompanying the Communication
from the Commission to the European Parliament and the Council. Commission Staff Working
Document, SEC(2008) 2699, Brussels, November 5, 2008.
European Commission (2008), Peer Review 2008: Evaluation Mission on Rail Transport issues
in Serbia. Ref. 31088. Technical Assistance Information Exchange Unit, DG Enlargement, in
close cooperation with DG TREN, Brussels, European Commission.
European Commission (2008), Commission calls on Member States to ensure correct
implementation of the First Rail Package. Press release IP/09/1438, Brussels, 26 June 26, 2008.
European Commission (2008), Western Balkans: Enhancing the European perspective.
Communication from the Commission to the European Parliament and the Council,
COM(2008)127 final, Brussels, March 5, 2008.
European Commission (2008), Progress of Exploratory Talks Regarding Cooperation in the
Field of Transport with the Neighbouring Countries. Communication from the Commission to the
European Parliament, the Council, the European Economic and Social Committee and the
Committee of the Regions. COM(2008)125 final, Brussels, March 3,2008.
European Commission (2008), Turkey 2008 Progress Report, accompanying the Communication
from the Commission to the European Parliament and the Council: Enlargement Strategy and
Main Challenges 2008-2009, Commission Staff working Paper. SEC (2008) 2699, Brussels,
November 5, 2008.
European Commission (2007), Towards a Rail Network Giving Priority to Freight:
Communication from the Commission to the Council and the European Parliament,
COM(2007)608 final, Brussels, October 18, 2007.
European Commission (2007), Extension of the Major Trans-European Transport Axes to the
Neighbouring Countries. Guidelines for Transport in Europe and Neighbouring Regions:
Communication from the Commission to the Council and the European Parliament.
COM(2007)32 final, Brussels, January 31, 2007.
European Commission (2006), Report from the Commission to the European Parliament, The
Council, the European Economic and Social Committee and the Committee of the Regions on the
Implementation of the First Rail Package, COM(2006) 189 final, Brussels, May 3, 2006.
European Commission (2004), Commission Adopts New Rules Governing Aid to Firms in
Difficulty, Memo/04/172, Brussels, July 7, 2004.
European Commission (2001), White Paper: European Transport Policy for 2010: Time to
Decide, COM (2001) 370 final, Brussels, September 12, 2001.
European Commission Liaison Office in Kosovo (2010), Railway Law, Technical Report V2.1,
Support in the Implementation of Transport Community Agreement (EU TCA). Report prepared
by EGIS BCEOM, December 3, 2010.
European Commission Liaison Office to Kosovo (2009), Railway Transport in Republic of
Kosovo, Action Plan and Investment Plan. Technical Support to the Ministry of Transport and
Communications to continue the development of a Multi-Modal Transport Strategy and Action
Plan, March 2009.

Railway Reform in South East Europe and Turkey: On the Right Track? References
265
European Commission Liaison Office to Kosovo (2008), Railway Transport in Republic of
Kosovo, Draft Report, Review of the Current Situation. Technical Support to the Ministry of
Transport and Communications to continue the development of a Multi-Modal Transport Strategy
and Action Plan, December 2008.
European Commission Liaison Office to Kosovo (2008), Railway Transport in Republic of
Kosovo, Draft Report, Proposal for Reform. Technical Support to the Ministry of Transport and
Communications to continue the development of a Multi-Modal Transport Strategy and Action
Plan, December 2008.
European Community (1996), White Paper: A Strategy for Revitalising the Community‘s
Railways, COM (96), 421, Brussels, July 30, 1996.
European Environment Agency (2010), The European Environment - State and Outlook 2010:
Synthesis. European Environment Agency: Copenhagen.
European Environment Agency (2007), Size, Structure and Distribution of Transport Subsidies
in Europe, EEA Technical Report No.3/2007. European Environment Agency: Copenhagen.
European Rail Infrastructure Managers (2008), Recast of the First Railway Package. EIM
Position Paper. Brussels, May 20, 2008.
European Union‘s CARDS Programme for the Western Balkans (2009), Albanian Railways
Network: Infrastructure and Signaling Improvement Project, TA-ALB-06, Infrastructure Projects
Facility in the Western Balkans. Draft Final Report, Vol 1 – Main Report, November 2009.
European Union‘s CARDS Programme for the Western Balkans (2009), Technical Assistance to
the Ministry of Public Works, Transport and Telecommunications of Albania in the field of
Transport. Final Report. Vol. 1 – Main Report. December 2009.
Global Audit Services Ltd (2010), Independent Audit Report of BDZ EAD 2009. Sofia, June 29,
2010.
Government of Republika Srpska (2009), Development Strategy for Railways of Republika
Srpska 2009-2015, Banja Luka, August 2009.
Harrar, Winner, Thompson, Sharp, Lawrence, Inc and the World Bank (2002), Options for
Reform: Turkish Railways TCDD. June 2002.
HŢ Holding (2010), Business Report For Affiliated Companies of HŽ Holding for the period from
Jan-Dec 2009, Zagreb, March 2010.
IBM Global Business Services (2007), Rail Liberalization Index 2007. Market Opening:
Comparison of the Rail Markets of the Member States of the European Union, Switzerland and
Norway. A study by IBM Global Business Services in conjunction with Professor Christian
Kirchner, Humboldt University. Brussels, October 17, 2007.
IMF, 2010, Romania—Staff Report for the 2010 Article IV Consultation, Fourth Review Under
the Stand-By Arrangement, and Requests for Modification and Waiver of Nonobservance of
Performance Criteria—Staff Report; Staff Supplement; Public Information Notice and Press
Release on the Executive Board Discussion; Statement by the Executive Director for Romania.
IMF Country Report No. 10/227, July 2010.

Railway Reform in South East Europe and Turkey: On the Right Track? References
266
International Transport Forum (2009), EU Transport Legislation. Paris, April 3, 2009.
Infrastructure Steering Group (2003), Implementing Regional Transport Priorities in the Western
Balkans. A Report by the Chair of the ISG. Brussels, December 2003.
Kosovo Railways J.S.C (2010), Annual Report 2009, Pristina, January 2010.
KPMG (2007), Final Report (Railways FBH), Assistance with the restructuring of the Railways
of the Federation of Bosnia and Herzegovina and Railways of Republic of Srpska, Sarajevo,
December 5, 2007
KPMG (2007), Final Report (Railways RS), Assistance with the restructuring of the Railways of
the Federation of Bosnia and Herzegovina and Railways of Republic of Srpska, Doboj, December
7, 2007.
Macedonian Railways Infrastructure (2010), Business Plan PE MZ Infrastructure: 2010-2012,
Skopje, May 2010.
Macedonian Railways Infrastructure (2010), Annual Report About the Work of the PE MZ-
Infrastructure 2009, Skopje, 2010.
Macedonian Railways Transport JSC (2010), 2010 Business Plan, Skopje, January 2010.
Macedonian Railways Transport JSC (2010), Report on the Operations of MZ Transport AD
Skopje for the Period 1.01-31-12.2009, Skopje, May 2010.
Montecargo AD (2009), Financial Report for the Period 1 July-31 December 2009. Report of the
Independent Auditor. Podgorica, March 5, 2010.
National Railway Infrastructure Company (2010), Consolidated Financial Statement for Year
Ended on 31st December 2009. Sofia, 2010.
National Railway Infrastructure Company (2009), National Railway Infrastructure Company
Business Plan for 2010, Sofia, December 2009.
National Railway Infrastructure Company (2009), Consolidated Financial Statement for Year
Ended on 31st December 2008. Sofia, 2009.
NEA (2008), Impact Assessment of Guidelines on State Aid to Railway Undertakings. Study
financed by the European Commission available at:
http://ec.europa.eu/transport/stateaid/transport/doc/2008/2008_ia_railway_guidelines.pdf
NERA (2004), Study of the Financing and Public Contributions to Railways, Final Report for
European Commission DG TREN, London, January 2004.
OECD/ International Transport Forum (2008), Charges for the Use of Rail Infrastructure 2008.
Paris: OECD.
OECD (2005), Guidelines on Corporate Governance of State-owned Enterprises, Paris: OECD.
OECD (2004), OECD Guidelines of Corporate Governance, Paris: OECD.
Railways of Federation Bosnia and Herzegovina Ltd (2010), Report on Operations Railway of
Federation B&H For Year 2009, Sarajevo, February 2010.
Railway Reform in South East Europe and Turkey: On the Right Track? References
267
Railways of Federation Bosnia and Herzegovina Ltd (2010), Business Operation Plan of FB&H
Railway Public Company for 2010, Sarajevo, January 2010.
Railways of Federation Bosnia and Herzegovina Ltd (2009), Report on Operations Railway of
ŽFBH During the Period January-December 2008, February 2009.
Railway Transport of Montenegro AD (2010), Business Plan for 2010, Podgorica, December
2009.
Railway Transport of Montenegro AD (2009), Annual Report, Podgorica.
Rechnungshof (2010), ÖBB: Langsamfahrstellen, Bund 2010/5.
Republic of Serbia (2009), Action Plan: Construction of Roads and Railways on Corridor 10 for
2009. Belgrade, January 2009.
Republic of Serbia (2008), National Road and Rail Infrastructure Development Plan for the
Republic of Serbia for 2008-2012. Belgrade, October 2008.
Republic of Serbia (2007), Strategy of Railways, Road, Inland Waterway, Air and Intermodal
Development in the Republic of Serbia, 2008-2015.
SEETO (2009), South-East Europe Core Regional Transport Development Plan, Five Year Multi
Annual Plan 2010 to 2014, Common Problems-Sharing Solutions. Vol. 1. December 2009.
SEETO: Belgrade, Serbia.
SEETO (2008), Conclusions on Implementation of MoU until the end of 2008. Fourth Annual
Meeting of Ministers on the Development of the South East Europe Core Regional Transport
Network, Bečići, December 4, 2008.
SEETO (2008), South-East Europe Core Regional Transport Network Development Plan. Five
Year Multi-Annual Plan 2009 to 2013, Common Problems-Sharing solutions. Vol 1. December
2008.
SEETO (2007), Addendum to the Memorandum of Understanding on the Development of the
South East Europe Core Regional Transport Network for a South East European Railway
Transport Area. Third Annual Meeting of Ministers on the Development of the South East
Europe Core Regional Transport Network, Tirana, December 4, 2007.
Serbian Railways (2010), Business Plan Implementation Report of the PE ―Serbian Railways‖
for 2009, Belgrade, April 2010.
Serbian Railways (2010), Business Plan of the PE ―Serbian Railways‖ for 2010, Belgrade,
February 2010.
Serbian Railways (2008), Business Plan PE ―Serbian Railways‖ for 2008, Belgrade, October
2008.
Serbian Railways (2008), Business Report for 2007, Belgrade, March 2008.
Serbian Railways (2006), 2006-10 Business Plan – Strategic Plan, Belgrade, October 2006.

Railway Reform in South East Europe and Turkey: On the Right Track? References
268
Serbian Railways (2005), Business Plan PE ―Serbian Railways‖ for 2006, Belgrade, December
2005.
Statistical Office of the Republic of Serbia (2008), Serbian Statistical Yearbook. 41st edition,
Belgrade, October 2008.
T.C. Devlet Demiryollari Istatistik Yilligi (2010), Turkish Railways Annual Statistics, 2005-2009.
Ankara.
TCDD (2010), Annual Report 2009, Ankara.
TCDD (2009), TCDD Business Plan 2010-2014, Ankara, September 2009.
TCDD (2008), TCCD Business Plan 2009-2013, Ankara, September 2008.
Uhl, Klaus-Juergen (2010), Review of practices at border-crossing points in selected rail
corridors and assessment to improve performance. Consultant Report prepared for the World
Bank, July 2010.
UK Trade & Investment (2010), Sector Report: Railways Romania, May 2010.
van Greuning, Hennie, Scott, Darrel, and Terblanche, Simone (2011), International Financial
Reporting Standards: A Practical Guide. World Bank Training Series. Washington, DC: World
Bank.
World Bank (2011), Poland Transport Policy Note-Towards a Sustainable Land Transport.
Sustainable Development Department, Europe and Central Asia Region. Report No. 59715-PL.
Washington DC: World Bank.
World Bank (2010), Bosnia and Herzegovina: The Road to Europe, Transport Sector Review,
Transport Unit, Sustainable Development Department, Europe and Central Asia Region, Report
No. 54406-BH. Washington, DC: World Bank.
World Bank (2009), Serbia: Doing More with Less. Address the Fiscal Crisis by Increasing
Public Sector Productivity. Poverty Reduction and Economic Management Unit, South East
Europe Country Unit, Europe and Central Asia Region. Report No. 48620-YF. Washington, DC:
World Bank.
World Bank (2009), Bulgaria Railways Policy Note. Sustainable Development Department.
Europe and Central Asia Region, Washington, DC.
World Bank (2008), Restructuring Public Finance to Sustain Growth and Improve Public
Services: A Public Finance Review. Poverty Reduction and Economic Management Unit, Europe
and Central Asia Region. Report No. 37321-HR. Washington, DC: World Bank.
World Bank (2008), Options for the Development of the Road and Railway Infrastructure on
Corridor X. Policy Note prepared by theTransport Unit, Infrastructure Department in the Europe
and Central Asia Region, Washington, DC.
World Bank (2005), Railway Reform in the Western Balkans, Report by the Transport Unit,
Infrastructure Department in the Europe and Central Asia Region. Washington, DC.
http://siteresources.worldbank.org/INTECAREGTOPENERGY/Resources/WesternBalkansRailw
ayReportFinalDec2005.pdf

Railway Reform in South East Europe and Turkey: On the Right Track? References
269
World Economic Forum (2010), Global Competitiveness Report 2010-2011, edited by Professor
Klaus Schwab. Geneva, Switzerland.
ŢICG (2010), Report on Business Activities and Results for 2009, Podgorica.
ŢRS (2009), Business Plan Railways of the Republika Srpska, JSC Doboj, 2009-2011. Doboj,
January 2009.