in situ microarray fabrication and analysis using a...
TRANSCRIPT

In Situ Microarray Fabrication and Analysis Usinga Microfluidic Flow Cell Array Integrated withSurface Plasmon Resonance Microscopy
Jianping Liu,† Mark A. Eddings,‡ Adam R. Miles,§ Rostislav Bukasov,† Bruce K. Gale,| andJennifer S. Shumaker-Parry*,†
Department of Chemistry, Department of Bioengineering, and Department of Mechanical Engineering, University ofUtah, Salt Lake City, Utah 84112, and Wasatch Microfluidics, 825 N. 300 W. Street NE 129,North Salt Lake City, Utah 84054
Surface Plasmon Resonance Microscopy (SPRM) is apromising label-free analytical tool for the real-time studyof biomolecule interactions in a microarray format. How-ever, flow cell design and microarray fabrication havehindered throughput and limited applications of SPRM.Here we report the integration of a microfluidic flow cellarray (MFCA) with SPRM enabling in situ microarrayfabrication and multichannel analysis of biomoleculeprobe-target interactions. We demonstrate the use of theMFCA for delivery of sample solutions with continuousflow in 24 channels in parallel for rapid microarraycreation and binding analysis while using SPRM for real-time monitoring of these processes. Label-free measure-ment of antibody-antibody interactions demonstrates thecapabilities of the integrated MFCA-SPRM system andestablishes the first steps of the development of a high-throughput, label-free immunogenicity assay. After in situprobe antibody immobilization, target antibody bindingwas monitored in real time in 24 channels simulta-neously. The limit of detection for this particular antibodypair is 80 ng/mL which is ∼6 times lower than theindustry recommended immunogenicity assay detectionlimit. The integrated MFCA-SPRM system is a powerfuland versatile combination for a range of array-basedanalyses,includingbiomarkerscreeninganddrugdiscovery.
Surface Plasmon Resonance (SPR)-based sensors have beenwidely used in biomedical, food, and environmental research forreal-time, label-free analysis of biomolecule adsorption/desorptionon a surface by monitoring local refractive index changes.1-4 SPRsensors can be divided into two groups: SPR spectroscopy andSPR microscopy (also called SPR imaging or SPRi). SPR spec-
troscopy typically relies on measuring a SPR curve dependent onexcitation light wavelength or incident angle; however, this is oftenlimiting in terms of running multiple simultaneous experiments.Development of SPR microscopy (SPRM) has led to the extensionof SPR-based sensing to a microarray format.5,6 SPRM offers manyof the advantages of SPR spectroscopy with the added ability toincrease throughput by measuring an array of binding interactionssimultaneously.2,4,7-9 SPRM is based on using an expanded andcollimated light source to probe a large region of a sensor surfaceand a CCD camera to monitor the reflected light intensity fromthe entire sensing region to form a digital image. The intensityvalues for selected pixels in the generated gray scale images canbe correlated with the amount of material adsorbed on the sensorsurface.10,11 The microscopy format provides parallel processingadvantages of larger data sets, opportunities for multiple simul-taneous control experiments, and improved statistically significantresults.
The ability to analyze an array of biomolecule interactions inparallel has made SPRM an attractive option for protein microarraystudies.11-14 To apply SPRM, deposition and arraying technologymust be used to functionalize the sensing surface and create themicroarray. Protein pin spotting, ink jet printing, and microcontactprinting have been used to create large numbers of denselyarrayed spots.15-17 Typically array fabrication is done ex situ,introducing potential protein denaturation and conformation
* To whom correspondence should be addressed. E-mail: [email protected].
† Department of Chemistry, University of Utah.‡ Department of Bioengineering, University of Utah.§ Wasatch Microfluidics.| Department of Mechanical Engineering, University of Utah.
(1) Liedberg, B.; Nylander, C.; Lundstrom, I. Sens. Actuators 1983, 4, 299–304.
(2) Knoll, W. Annu. Rev. Phys. Chem. 1998, 49, 569–638.(3) Homola, J. Surface Plasmon Resonance-Based Sensors; Springer: Berlin/
Heidelberg, 2006.(4) Smith, E. A.; Corn, R. M. Appl. Spectrosc. 2003, 57, 320A–332A.
(5) Rothenhausler, B.; Knoll, W. Nature (London) 1988, 332, 615–616.(6) Yeatman, E.; Ash, E. A. Electron. Lett. 1987, 23, 1091–1092.(7) Phillips, K.; Cheng, Q. Anal. Bioanal. Chem. 2007, 387, 1831–1840.(8) Ruemmele, J. A.; Golden, M. S.; Gao, Y.; Cornelius, E. M.; Anderson, M. E.;
Postelnicu, L.; Georgiadis, R. M. Anal. Chem. 2008, 80, 4752–4756.(9) Shumaker-Parry, J. S.; Campbell, C. T. Anal. Chem. 2004, 76, 907–917.
(10) Jung, L. S.; Shumaker-Parry, J. S.; Campbell, C. T.; Yee, S. S.; Gelb, M. H.J. Am. Chem. Soc. 2000, 122, 4177–4184.
(11) Shumaker-Parry, J. S.; Aebersold, R.; Campbell, C. T. Anal. Chem. 2004,76, 2071–2082.
(12) Hong, M. Y.; Lee, D.; Kim, H. S. Anal. Chem. 2005, 77, 7326–7334.(13) Wegner, G. J.; Wark, A. W.; Lee, H. J.; Codner, E.; Saeki, T.; Fang, S.;
Corn, R. M. Anal. Chem. 2004, 76, 5677–5684.(14) Peluso, P.; Wilson, D. S.; Do, D.; Tran, H.; Venkatasubbaiah, M.; Quincy,
D.; Heidecker, B.; Poindexter, K.; Tolani, N.; Phelan, M.; Witte, K.; Jung,L. S.; Wagner, P.; Nock, S. Anal. Biochem. 2003, 312, 113–124.
(15) Shumaker-Parry, J. S.; Zareie, M. H.; Aebersold, R.; Campbell, C. T. Anal.Chem. 2004, 76, 918–929.
(16) Singh, B. K.; Hillier, A. C. Anal. Chem. 2007, 79, 5124–5132.(17) Wilkop, T.; Wang, Z.; Cheng, Q. Langmuir 2004, 20, 11141–11148.
Anal. Chem. 2009, 81, 4296–4301
10.1021/ac900181f CCC: $40.75 2009 American Chemical Society4296 Analytical Chemistry, Vol. 81, No. 11, June 1, 2009Published on Web 05/01/2009

changes because of drying of the surface.18 Other disadvantagesof traditional arraying include poor spot quality, extensive sampleprocessing, and the requirement for expensive robotic control.15,19,20
In addition, array fabrication suffers from inadequate methods tocharacterize protein immobilization strategies and to quantifyimmobilized probe molecules.
Microfluidic technology provides an alternative approach toaddress challenges related to array fabrication and biomoleculeimmobilization.21,22 When a microfluidic system is used to deliverbiomolecules, mass transport to regions of the sensor surface issignificantly enhanced as diffusion lengths are minimized andconvective transport replenishes sample across the surface.23 Two-dimensional microfluidic approaches have been used in conjunc-tion with SPRM.24-28 However, these microfluidic systems arelimited by the density that can be achieved and the extendedlengths of the regions that are created leading to sample depletionproblems. Sample adsorption to the surface of the microchannelscan be reduced through blocking agents; however, sampledepletion during probe immobilization still occurs leading to adecrease in sample near the end of the reaction zone because ofthe large reactive surface region defined by the microfluidic lanes.Because of this problem, high probe concentration is needed forimmobilization to avoid formation of a gradient of probe densitieson the sensor surface. The large regions of immobilized probealso can lead to a low target surface density which may impactdetection limits.
Recent microfluidic developments have focused on three-dimensional (3D) microfluidic networks to confine deposition tospecific locations on the substrate to minimize sample depletionand increase array density. One example is the development ofthe 3D Continuous Flow Microspotter (CFM). Gale and co-workers demonstrated a dramatic increase in spot uniformity andquality for the CFM compared with standard pin-spotting microar-ray fabrication.29,30 Despite the advantages of the CFM, theproblem of performing the spotting step ex situ and separatedfrom the detection step remains and can lead to potential proteindenaturation, contamination, and delayed assay time. Also theability to perform large numbers of separate, simultaneousexperiments is eliminated because of the use of a single or limited-channel flow cell used for the detection step of array-basedassays.31,32
In this report, we demonstrate the integration of the CFM asa microfluidic flow cell array (MFCA) directly with an SPRmicroscope for in situ microarray fabrication and real-timeanalysis. The MFCA enables simultaneous operation of 48 separatemicrofluidic cells to address 48 individual sensing regions on aSPR sensor surface using an SPR microscope as the detector. Ahigh-throughput approach to SPRM calibration, microarray fab-rication, and biomolecule probe-target interaction analysis dem-onstrates the multiplexing capability of the integrated MFCA-SPRM system.
EXPERIMENTAL SECTIONMaterials. (1-Mercapto-11-undecyl) tetra (ethylene glycol)
(OEG) and biotin-terminated tri (ethylene glycol) hexadecanethiol(BAT) were purchased from Asemblon (Redmond, WA). Immu-nopure streptavidin (SA), human IgG (Ab2), and biotin-conjugatedgoat antihuman IgG (Ab1) were used as received from Pierce(Rockford, IL). Absolute ethanol was purchased from AAPERAlcohol (Shelbyville, Kentucky). Nanopure water was producedusing Barnstead Nanopure Diamond laboratory water system, andphosphate buffered saline (PBS, 150 mM NaCl, pH ) 7.4) wasprepared in the laboratory.
SPR Microscope. The SPR microscope is custom-built andis similar to a previously described system.9 An intensity-stabilized,HeNe laser from Melles Griot (Carlsbad, California) is used as alight source. The laser beam is expanded and collimated by opticsfrom Newport Corporation (Irvine, CA) before traveling througha SF14 hemispherical prism (R. Mathews Optical Works,Poulsbo, WA) and SF14 substrate from Schott AG (Elmsford,NY). The substrate is coated with 2 nm of titanium and 50 nmof gold using a Denton electron-beam evaporator. The reflectedlight is detected by a CCD camera (IMB-3145FT) from k-SpaceAssociates (Ann Arbor, MI). Two rotation stages from NewportCorporation (Irvine, CA) are used to control the angles ofincidence and reflection of the laser beam. The whole systemis mounted on a laser table. An imaging angle of 54.8° wasused for the experiments described in this paper. Software fromk-Space Associates (Ann Arbor, MI) was used to acquire,record, and process images. For real-time analysis, circularregions (20-pixel radii) were selected in the center of regionsof interest (ROIs) in the SPRM image. Intensity signals fromthese pixels were integrated with 1 s resolution. The PDMSMFCA was integrated into the SPRM optical system with acustom-made manifold mounted on an X-Y stage from NewportCorporation (Irvine, CA).
Microfluidic Flow Cell Array. MFCAs (Wasatch Microflu-idics, Salt Lake City, UT) were fabricated in PDMS by adaptingsoft lithography methods and using injection molding to increasethroughput as described previously.30 Master molds were fabri-cated by micromilling the pattern in brass to the proper dimen-sions. A polycarbonate replica was made and used for casting thePDMS devices. Multiple layers of PDMS were combined togetherto form sophisticated three-dimensional networks through partialcuring of layers or oxygen plasma treatment of the surface.30
Flow Control. A 24-channel peristaltic pump from Ismatec(Glattbrugg, Switzerland) was used for loading samples anddriving solutions through the MFCA. The peristaltic pumpcontains eight rollers to minimize pulsing in the flow rate.Distinguishable pulsing was noticed at flow rates above
(18) Glokler, J.; Angenendt, P. J. Chromatogr. B 2003, 797, 229–240.(19) Barbulovic-Nad, I.; Lucente, M.; Sun, Y.; Zhang, M.; Wheeler, A. R.;
Bussman, M. Crit. Rev. Biotechnol. 2006, 26, 237–259.(20) Wu, P.; Grainger, D. W. J. Proteome 2006, 5, 2956–2965.(21) Whitesides, G. M. Nature (London) 2006, 442, 368–373.(22) Delamarche, E.; B., A.; Schmid, H.; Michel, B.; Biebuyck, H. J. Am. Chem.
Soc. 1998, 120, 500–508.(23) Myszka, D. G.; H., X.; Dembo, M.; Morton, T. A.; Goldstein, B. Biophys. J.
1998, 75, 583–594.(24) Wegner, G. J.; Lee, H. J.; Corn, R. M. Anal. Chem. 2002, 74, 5161–5168.(25) Kurita, R.; Yokota, Y.; Sato, Y.; Mizutani, F.; Niwa, O. Anal. Chem. 2006,
78, 5525–5531.(26) Foley, J. O.; Nelson, K. E.; Mashadi-Hossein, A.; Finlayson, B. A.; Yager,
P. Anal. Chem. 2007, 79, 3549–3553.(27) Lee, H. J.; Goodrich, T. T.; Corn, R. M. Anal. Chem. 2001, 73, 5525–5531.(28) Wang, Z.; Wilkop, T.; Cheng, Q. Langmuir 2005, 21, 10292–10296.(29) Natarajan, S.; Miles, A.; Eckman, J.; Rich, R.; Gale, B. K.; Myszka, D. Anal.
Biochem. 2008, 373, 141–146.(30) Chang-yen, D. A.; Myzska, D.; Gale, B. K. J. Micromech. Sys. 2006, 15,
1145–1151.(31) Lee, H. J.; Nedelkov, D.; Corn, R. M. Anal. Chem. 2006, 78, 6504–6510.(32) Campbell, C. T.; Kim, G. Biomaterials 2007, 28, 2380–2392.
4297Analytical Chemistry, Vol. 81, No. 11, June 1, 2009

250 µL/min. To avoid pulsing issues, we used flow rates in therange of 20-50 µL/min which are well below this flow rate.Tubing connections to the MFCA were cut to the same length tomaintain the same volume across all of the channels. The MFCAfluidic design also ensures nearly simultaneous fluid arrival to thesensor surface. Confirmation of the flow rate was achieved byinjections of fluids with different refractive indices and monitoringtheir arrival to the surface with the SPR microscope.
SPR Microscope Sensitivity Measurement. The SPR mi-croscope’s response to bulk refractive index changes was char-acterized by preparing mixtures of ethanol and Nanopure water.The refractive indices of the solutions (ethanol/water) weremeasured by an Abbe-3 L refractometer from Milton Roy(Rochester, NY).
Self-Assembled Monolayer (SAM) Formation. Freshlyprepared gold-coated glass substrates were immersed in 0.1 mMmixed BAT and OEG solutions (1:9 BAT/OEG) for 24 h from amixed-SAM on the surface. Then, the substrate was removed fromthe solution, rinsed with pure ethanol, and dried by a stream ofnitrogen. Finally, the substrate was mounted on the planar faceof the SPRM prism with refractive index matching liquid fromCargille Laboratories (Cedar Grove, NJ).
Antibody-Antibody Interaction Analysis. A streptavidin (SA)layer was formed on the mixed SAM by introducing SA solutions(100 µg/mL SA in PBS) using the MFCA. Next, biotin-labeledgoat antihuman antibody (Ab1, 1:100 dilution in PBS) wasintroduced and adsorbed on the SA-coated surface. In the finalstep, human IgG (Ab2) was delivered at the concentrations shownin the main text. All steps of SA and Ab1 immobilization, as wellas Ab2 binding, were monitored by SPRM. We used 24 microfluidicchannels of the MFCA with one channel serving as a control. Themicroarray creation and antibody assay takes about 1 h.
Surface Coverage Calculations. SPR sensing is based on theexcitation of surface plasmon polaritons (SPPs) at a metal-dielectric interface. The propagating charge density waves createan evanescent electromagnetic wave extending several hundrednanometers above the sensor surface. Under energy and momen-tum matching conditions, incident light couples with the SPPsleading to a loss of reflected light at a specific wavelength or angle,depending on the instrument configuration. Binding eventsoccurring within the evanescent wave result in effective localrefractive index changes at the metal-dielectric interface leadingto a shift in the wavelength or angle of coupling (i.e., SPRwavelength or SPR angle) which can be monitored. Changes inreflected light intensity at a properly selected fixed angle ofincidence may be related to changes in effective refractive indexbecause of molecules binding to the SPR sensor surface andconverted to surface coverages.9,33 ηprotein and ηsolvent are therefractive indices of protein and buffer, respectively. We useda value for ηprotein of 1.5733 and ηsolvent was measured using arefractometer. Mw is the molecular weight of the protein. Fprotein
is the density of protein and typically equal to 1.37 g/cm3.9,33
NA is avogadro’s number. The value for m, the SPRM sensitivityfactor, was measured as 2905% Reflectivity/refractive index unit(RIU) for our system. The linear dynamic range for the SPRMis 0.01 RIU which is equivalent to about 4 layers of protein.
RESULTS AND DISCUSSIONIntegrated MFCA-SPRM System. Figure 1a-c present the
general MFCA design composed of a layered PDMS structurewith a sample well configuration based on a standard 96-well plate.Figure 1d presents details of the 5-layer PDMS MFCA structure.The top PDMS layer has 96 holes which connect to outside tubing.Each of the bottom four layers has 24 microchannels thatcorrespond to specific wells of the top layer. For each flow cell,one microchannel begins at an inlet well and the other micro-channel begins at an outlet well. Both microchannels terminateat the joint at the tip face. When the face of the MFCA tip (Figure1b) is pushed against a substrate (e.g., glass slide), an array ofmicrofluidic cells formed at the substrate-tip interface seals theflow cells and creates continuous flow paths between the inletand outlet sample wells.
The integration of the MFCA with the SPRM is shown inFigure 1e. The SPRM image of the MFCA in contact with thegold-coated SPR substrate in Figure 1f shows that the 48 individualMFCA flow cells filled with water are clearly distinguishable from
(33) Jung, L. S.; Campbell, C. T.; Chinowsky, T. M.; Mar, M. N.; Yee, S. S.Langmuir 1998, 14, 5636–5648.
Figure 1. MFCA design and integration with SPRM for in situmicroarray fabrication and real-time parallel analysis. (a) Photoshowing top view of the MFCA. The MFCA tip extending out fromthe main rectangular area is shown in more detail in (b) and (c). b)Photo of the MFCA tip face. The 48 openings comprise the 48microfluidic cells when the face of the tip is sealed against a substrate.(c) Top view of a row of joints where the inlet and outlet microchannelsmeet. (d) Schematic of the layered MFCA structure and the relation-ship between the channels and the sample wells. (e) Cartoon ofMFCA mounted at the planar face of the prism in the SPRM. (f) SPRMimage of 48 microfluidic cells filled with water. ROIs are selected byselecting pixels in the image. The 400 × 400 µm cells appear asrectangles in the SPRM image because of the imaging angle used.(g) Changes in reflected light intensity in ROIs selected from theSPRM image in (f) may be monitored in real time and plotted asadsorption/desorption curves.
4298 Analytical Chemistry, Vol. 81, No. 11, June 1, 2009

the surrounding PDMS. Intensity changes in regions of interest(ROIs) selected from the image are monitored as a function oftime to generate real-time response curves (e.g., binding curvesor sensorgrams) as shown in Figure 1f. Two detection modulationsare possible with the SPR microscope. In one mode, an SPR anglecurve is collected by measuring reflected light intensity as afunction of incident angle. Because of the time it takes to scanthrough a range of angles, a second mode is used for kineticmeasurements. In this mode, the intensity is monitored at a fixedangle as the local effective refractive index changes because ofthe introduction of solutions with different refractive indices orbiomolecule adsorption/desorption.9
SPR Microscope Calibration. After integration of the MFCAwith the SPRM, we used the microfluidic system to introducesolutions with different refractive indices for parallel multichannelSPR microscope calibration. A 24-channel peristaltic pump con-trolled the solution flow in 24 channels individually and simulta-neously. The flow control configuration is expandable for simul-taneous fluidics control in all 48 MFCA channels. The calibrationprovides characterization of SPRM sensitivity and monitoring ofthe MFCA flow control. In the calibration, six solutions containingdifferent volume ratios of water/ethanol with different bulkrefractive indices (RI) were loaded into the inlet wells and flowedthough the microfluidic cells at the substrate/MFCA interface andinto the outlet wells. Water was used to establish a baselinebetween the introduction of each calibration solution. Figure 2bpresents the in situ, real time SPRM response to the bulk RIchanges monitored in ROIs in the 24 flow cells. The good overlapof the rise and fall time points demonstrates the uniform channelflow rates which are important for minimizing variations in kineticdata because of flow rate effects. More detailed microfluidiccharacterization and analysis will be reported in a future publica-tion. The SPR response to each solution is uniform with relativestandard deviations (RSDs) of less than 10%. The SPR micro-scope’s sensitivity factor was found from the slope of the plot ofthe average SPRM response for each solution as shown in Figure
2c. The sensitivity factor is used to calculate biomolecule surfacecoverages and estimate the dynamic range of detection.9 Theaverage sensitivity factor for 24 flow cells is 2905% Reflectivity/RIU and the dynamic range is 0.01 RIU. We discuss therelationship of these SPRM system metrics to protein bindingbelow.
Microarray Fabrication and Real-time Biomolecule Inter-action. We are using the MFCA-SPRM for in situ microarrayfabrication and real-time biomolecule interaction analysis in thedevelopment of an array-based protein interaction platform formonitoring antibody-antibody interactions. This platform mimicsan immunogenicity assay which is typically based on immobiliza-tion of an antibody-based drug on the sensor surface and thencapture of probe antidrug antibodies from patients’ sera. The firststep in this assay development is immobilization of the probeantibody on the SPR sensor surface. The integrated MFCA-SPRMsystem was used to control and monitor in situ array fabrication.We used a well-characterized, versatile immobilization strategybased on a tethered streptavidin (SA) layer formed on a mixedself-assembled monolayer (SAM) containing biotin- and oligo(et-hylene)glycol-terminated alkyl thiols.14,34 The SAM-functionalizedgold-coated substrate was mounted on the SPRM prism usingrefractive index match fluid. Figure 3a shows real-time adsorptiondata from the in situ array fabrication and antibody binding assay.Adsorption on the sensor surface was tracked by measuringchanges in the SPRM response in ROIs within the MFCAmicrofluidic cells in the image. As shown in Figure 3a, a baselineSPR response was established with PBS buffer. Next, SA wasintroduced into the flow cells. The SA bound to the biotin groupson the SAM-covered substrate surface (see Figure 3b). Theconcentration used resulted in a saturation level of SA on thesurface to create a nearly close-packed SA layer which wasthe binding surface used to capture biotinylated goat antihumanIgG (Ab1). The immobilization of the probe antibody Ab1 also
(34) Nelson, K. E.; Gamble, L.; Jung, L. S.; Boeckl, M. S.; Naeemi, E.; Golledge,S. L.; Sasaki, T.; Castner, D. G.; Campbell, C. T.; Stayton, P. S. Langmuir2001, 17, 2807–2816.
Figure 2. SPRM calibration using 24 microfluidic cells of MFCA. (a) SPRM image of 24 microfluidic cells filled with water. The image wasacquired at an incident light angle of 54.8°. (b) SPRM curves showing the system response to solutions with different refractive indices. A CCDcamera with acquisition software was used to measure reflected light intensity from 20 × 20 pixel ROIs selected from the SPRM image for eachmicrofluidic cell. The legend shows each curve and the position of the corresponding MFCA microfluidic cell in the SPRM image in (a). Therefractive indices of the solutions are (baseline) 1.3320, (P1) 1.3331, (P2) 1.3340, (P3) 1.3350, (P4) 1.3370, (P5) 1.3396, and (P6) 1.3421. (c)SPRM responses from (b) are used to obtain the average SPRM sensitivity factor from the slope of the line.
4299Analytical Chemistry, Vol. 81, No. 11, June 1, 2009
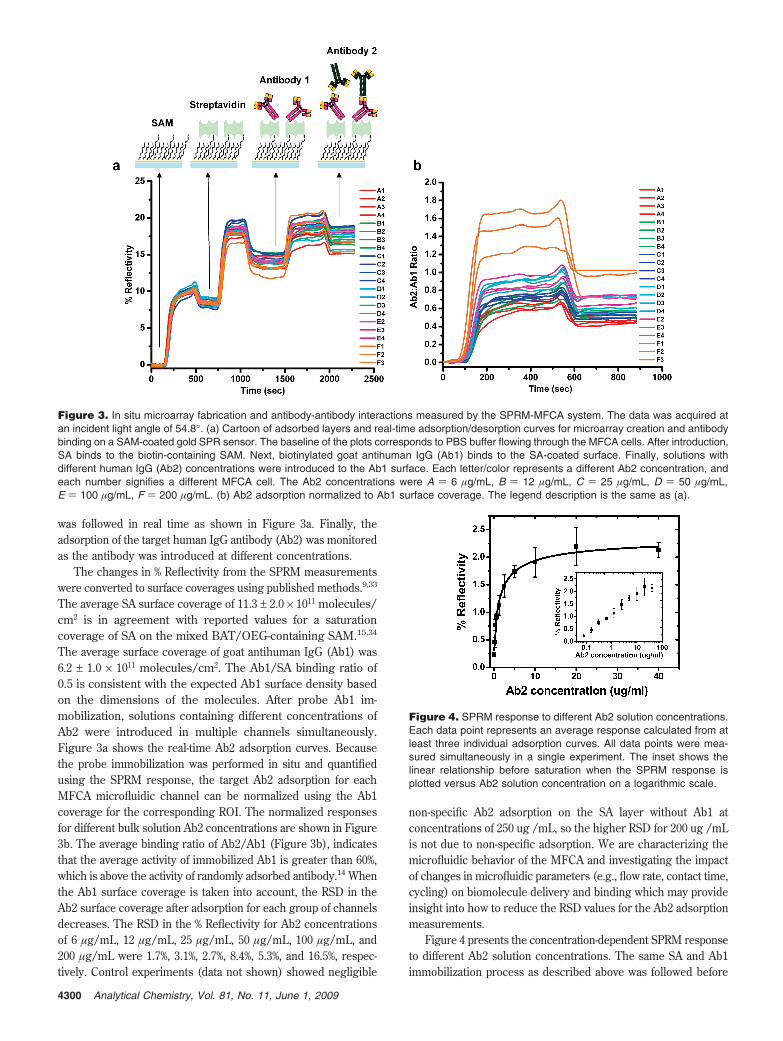
was followed in real time as shown in Figure 3a. Finally, theadsorption of the target human IgG antibody (Ab2) was monitoredas the antibody was introduced at different concentrations.
The changes in % Reflectivity from the SPRM measurementswere converted to surface coverages using published methods.9,33
The average SA surface coverage of 11.3 ± 2.0 × 10¹¹ molecules/cm2 is in agreement with reported values for a saturationcoverage of SA on the mixed BAT/OEG-containing SAM.15,34
The average surface coverage of goat antihuman IgG (Ab1) was6.2 ± 1.0 × 10¹¹ molecules/cm2. The Ab1/SA binding ratio of0.5 is consistent with the expected Ab1 surface density basedon the dimensions of the molecules. After probe Ab1 im-mobilization, solutions containing different concentrations ofAb2 were introduced in multiple channels simultaneously.Figure 3a shows the real-time Ab2 adsorption curves. Becausethe probe immobilization was performed in situ and quantifiedusing the SPRM response, the target Ab2 adsorption for eachMFCA microfluidic channel can be normalized using the Ab1coverage for the corresponding ROI. The normalized responsesfor different bulk solution Ab2 concentrations are shown in Figure3b. The average binding ratio of Ab2/Ab1 (Figure 3b), indicatesthat the average activity of immobilized Ab1 is greater than 60%,which is above the activity of randomly adsorbed antibody.14 Whenthe Ab1 surface coverage is taken into account, the RSD in theAb2 surface coverage after adsorption for each group of channelsdecreases. The RSD in the % Reflectivity for Ab2 concentrationsof 6 µg/mL, 12 µg/mL, 25 µg/mL, 50 µg/mL, 100 µg/mL, and200 µg/mL were 1.7%, 3.1%, 2.7%, 8.4%, 5.3%, and 16.5%, respec-tively. Control experiments (data not shown) showed negligible
non-specific Ab2 adsorption on the SA layer without Ab1 atconcentrations of 250 ug /mL, so the higher RSD for 200 ug /mLis not due to non-specific adsorption. We are characterizing themicrofluidic behavior of the MFCA and investigating the impactof changes in microfluidic parameters (e.g., flow rate, contact time,cycling) on biomolecule delivery and binding which may provideinsight into how to reduce the RSD values for the Ab2 adsorptionmeasurements.
Figure 4 presents the concentration-dependent SPRM responseto different Ab2 solution concentrations. The same SA and Ab1immobilization process as described above was followed before
Figure 3. In situ microarray fabrication and antibody-antibody interactions measured by the SPRM-MFCA system. The data was acquired atan incident light angle of 54.8°. (a) Cartoon of adsorbed layers and real-time adsorption/desorption curves for microarray creation and antibodybinding on a SAM-coated gold SPR sensor. The baseline of the plots corresponds to PBS buffer flowing through the MFCA cells. After introduction,SA binds to the biotin-containing SAM. Next, biotinylated goat antihuman IgG (Ab1) binds to the SA-coated surface. Finally, solutions withdifferent human IgG (Ab2) concentrations were introduced to the Ab1 surface. Each letter/color represents a different Ab2 concentration, andeach number signifies a different MFCA cell. The Ab2 concentrations were A ) 6 µg/mL, B ) 12 µg/mL, C ) 25 µg/mL, D ) 50 µg/mL,E ) 100 µg/mL, F ) 200 µg/mL. (b) Ab2 adsorption normalized to Ab1 surface coverage. The legend description is the same as (a).
Figure 4. SPRM response to different Ab2 solution concentrations.Each data point represents an average response calculated from atleast three individual adsorption curves. All data points were mea-sured simultaneously in a single experiment. The inset shows thelinear relationship before saturation when the SPRM response isplotted versus Ab2 solution concentration on a logarithmic scale.
4300 Analytical Chemistry, Vol. 81, No. 11, June 1, 2009

the SPRM response to a series of solutions with different Ab2concentrations was monitored. Each data point is an average of3-4 measurements from a single multichannel experiment. Thebinding isotherm of Ab2 to surface-immobilized Ab1 shows thatthe Ab2 adsorption reaches a saturation level at Ab2 concentra-tions above 20 µg/mL. The Ab2/Ab1 binding ratio indicates thissaturation occurs at 60-70% maximum occupancy of the Ab1 onthe surface which is typical for the SA-immobilized Ab1. The insetin Figure 4 shows the linear trend in the response when the Ab2solution concentration is plotted on the log scale. We found thelimit of detection for this particular antibody pair based on a signalgreater than 3 times the noise to be approximately 80 ng/mLwhich is well below the industry recommended assay detectionlimit of 500 ng/mL for immunogenicity assays.35 The correlationof the minimum detectable signal with concentration of analytein solution depends on the affinity constant for the interactionbetween the target analyte (e.g., Ab2) and the probe (e.g., Ab1)immobilized on the sensor surface and will need to be determinedfor specific biomolecules. The linear dynamic range of the SPRMis 0.01 RIU which is equivalent to approximately four close-packedlayers of protein. This dynamic range allows measurement of allsteps of probe immobilization and target binding without the needto adjust the SPRM imaging angle. If necessary, the imaging anglecould be adjusted between steps in an experiment which wouldextend the linear dynamic range.
Because the signals that are monitored by the SPRM are basedon changes in % Reflectivity, the signal limit of detection can beused to estimate a minimal detectable Ab coverage on the sensorsurface. The average standard deviation of the measured reflectedintensity (σ) is 0.072%Reflectivity. On the basis of a minimaldetectable signal equivalent to 3σ and use of the SPRM sensitivityfactor (2905%Reflectivity/RIU), the minimal detectable Ab surfacecoverage is 1.2 ng/cm2, or 2.40 × 10⁹ Ab/cm2. This is equivalentto 3.84 × 10⁶ antibodies per array feature area.
CONCLUSION
The MFCA-SPRM integration represents a significant stepforward in the throughput of SPR-based analysis which has beenone of the major obstacles for the expansion to applications outsideof kinetic analysis. The parallel performance capability of theMFCA dramatically increases the number of options available inplanning experiments. Optimization of probe immobilization andmicroarray fabrication can be performed in a single experimentincluding controls and replicates. Biomolecule interactions indifferent buffers and flow conditions can be investigated on thesame sensor chip. Concentration analysis for biomarker screeningis a more realistic option with the ability to create standard curveswhile screening separate analytes with a statistically relevantnumber of replicates. The current MFCA configuration enables48 separate flow cells in a 4 mm × 10 mm footprint. On-goingdevelopment of the MFCA is focused on shrinking the overallspot size and increasing the density of flow cells within the samefootprint (e.g., 96 and 192 channels). Future studies toward thedevelopment of immunogenicity assays based on the integratedSPRM-MFCA system will involve immobilizing an antibody-baseddrug as a probe to assay for target antidrug antibodies frompatients’ sera. In addition to immunogenicity assays, the integratedsystem also could be applied in biomarker screening and extendedto array-based, label-free analysis of a wide range of molecularinteractions involving proteins, nucleic acids, lipids, and carbo-hydrates. The flexibility of the MFCA also provides the optionfor application to other sensing platforms (e.g., fluorescence-baseddetection).
ACKNOWLEDGMENTThe first two authors contributed equally to this work.
Received for review January 23, 2009. Accepted April 6,2009.
AC900181F
(35) Liang, M.; Klakamp, S. L.; Funelas, C.; Lu, H.; Lam, B.; Herl, C.; Umble,A.; Drake, A. W.; Pak, M.; Ageyeva, N.; Pasumarthi, R.; Roskos, L. K. AssayDrug Dev. Technol. 2007, 5, 655–662.
4301Analytical Chemistry, Vol. 81, No. 11, June 1, 2009