in situ and laboratory mechanical characterization of … · in situ and laboratory mechanical...
TRANSCRIPT
In situ and laboratory mechanical characterization of a loess sequence from Middle Belgium
Simon Delvoie1,*
, Robert Charlier1, Frédéric Collin
1
1 University of Liège, Department of Architecture, Geology, Environment and Civil Engineering (ArGEnCo),
Geomechanics and Engineering Geology Research unit, Allée de la Découverte 9, B52/3, Quartier Polytech 1,
B-4000, Liège, Belgium. *Corresponding author: [email protected]
RÉSUMÉ. Une séquence lœssique (limon éolien) d’une épaisseur de 10 m, située à proximité de la carrière de Romont (Eben-
Emael, Moyenne Belgique) a été investiguée en vue de caractériser les propriétés mécaniques du matériau limoneux. Une
série d’essais de pénétration statique (CPT) ont été réalisés au moyen de différents cônes (type M1, type M2 et électrique)
afin de vérifier l’influence du type de cône sur le comportement mécanique du matériau. Parallèlement, une campagne
d’essais en laboratoire a été effectuée à partir d’échantillons non remaniés prélevés par forage. L’analyse en laboratoire
consiste en une caractérisation physique (granulométrie, limites d’Atterberg), et mécanique (œdomètre) du matériau. Cette
étude met l’accent sur la comparaison de la caractérisation du lœss au moyen d’une part d’essais in situ, et d’autre part
d’essais en laboratoire. Les résultats de l’analyse des graphiques d’identification des sols sur base des résultats des essais
de pénétration sont comparés à la classification internationale des sols (Unified Soil Classification System - USCS). Par
ailleurs, de nombreuses relations permettant de relier les paramètres issus des essais de pénétration statique avec les
paramètres obtenus en laboratoire, existent dans la littérature. Cette étude explore les relations existantes entre la résistance
au cône et le module œdométrique afin de vérifier les coefficients proposés dans la littérature pour des matériaux limoneux.
ABSTRACT. A 10 m thick loess (aeolian silt) layer located beside the Romont quarry (Eben-Emael, Middle Belgium) has been
investigated in order to characterize the mechanical behaviour of the silty material. Cone penetration tests (CPT) have been
performed with different cones (M1-type, M2-type and electric) in order to evaluate the influence of the cone on the
mechanical behaviour interpretation. Concurrently, laboratory tests have been performed on undisturbed samples from core
drillings. Laboratory tests consist of a physical characterization (grain size distribution, Atterberg limits) and a mechanical
characterization (oedometer tests). This comprehensive investigation study focuses on the comparison of the loess
characterization between in situ and laboratory approaches. CPT-based soil behaviour type charts are analyzed and
compared with the Unified Soil Classification System. Many relations also exist in the literature between parameters
obtained from CPT results and from laboratory tests. The study explores the existing relations between the cone resistance
and the oedometer constrained modulus in order to verify the related coefficients proposed in the literature for silty material.
MOTS-CLÉS : essai de pénétration statique, résistance au cône, module œdométrique, limon, Romont, Pléistocène supérieur.
KEY WORDS: cone penetration test, cone resistance, oedometer constrained modulus, silt, Romont, Late Pleistocene.

34èmes Rencontres de l’AUGC, Université de Liège, Belgique, 25 au 27 mai 2016 2
1. Introduction
Loess is an aeolian detrital deposit characterized by a very well sorted grain size distribution ranging
between 10-50 µm, with coarse silt predominant in grain size. In its detailed definition of loess, Pécsi [PÉC 90,
95] added that the weight percentage of the silt fraction corresponds to 40-70 %. Loess and loess derivates (loess
affected by diagenetic processes, inducing a modification of certain features compared to typical loess) cover as
much as 10 % of the Earth’s surface [SMA 01]. In Europe, the loess layer is widespread around a 50° N latitude
band, covering land from NW France to Siberia, over Belgium, the Netherlands, Germany, Poland, Ukraine and
the Russian Plain. The thickness of the European loess belt can locally reach more than 100 m [HAA 07]. The
belt is a product of the Quaternary Glacial Periods. In Belgium, the loess layer is mainly related to the last
glaciation (Weichselian, 112-12 ka). It covers a low plateau (altitudes ranging between 50-200 m) running from
the West to the East, North of the Sambre and Meuse rivers. Data from the central part of the Belgian loess belt
(Hesbaye region) indicate the loess thickness is highly variable and can locally reach more than 20 m [DEL in
press, a].
From a mechanical point of view, loess is considered as a porous material, characterized by a cohesion
related to diagenetic processes, with a low bearing capacity. It may be affected by settlement after loading and
susceptible to collapse. The material is also easily eroded by surface water flow.
In this study, a loess sequence of 10 m thick has been investigated on a site located in the eastern part of the
Hesbaye region (Belgium). An in situ and laboratory geotechnical campaign was performed in order to
characterize the mechanical properties of the loess and its variability. The in situ tests include a series of cone
penetration tests (CPT) using different well-known cone tips. Penetrometer is a worldwide test, commonly
performed for civil engineering applications (e.g. estimation of the bearing capacity [BUS 82], settlement [TON
11] and liquefaction [ZHA 02]). CPT is also often used to deduce the different soil layers intersected by the cone
tip. In addition laboratory tests were carried out on undisturbed samples from core drillings. Laboratory tests
consist of a physical characterization (grain size distribution, Atterberg limits) and a mechanical characterization
from oedometer tests. Firstly, this comprehensive investigation study focuses on results obtained from the
different cone types. They are analyzed to evaluate the influence of the cone on the measured parameters.
Secondly, many studies classify the soil type based on CPT results in order to define soil behaviour type chart
(SBT chart) (e.g. [DOU 81], [ROB 90], [ROB 09]). These charts are commonly used to deduce the different soil
layers intersected by the cone. In this study, the most common SBT charts are analyzed and results are compared
with the Unified Soil Classification System (USCS). Thirdly, some authors proposed relations between the cone
resistance (qc) measured by CPT and the tangent constrained modulus (M) measured in an oedometer test (e.g.
[BUI 41], [SAN 72]). Both parameters are linked by a coefficient α depending on the soil type. This relation is
commonly used to deduce settlement, under a given loading, from CPT. Results obtained from CPT and
oedometer tests are compared in order to calculate the coefficient α for the most common existing relations, and
to compare these values with the literature.
2. Investigation site and geological setting
2.1. Investigation site
The investigated site is located beside the CBR’s Romont quarry (Eben-Emael, Belgium), in the eastern part
of the Hesbaye region (Figure 1). This site offers a well-developed 10 m thick loess sequence which is visible
along an old working face of the quarry. The in situ tests were performed behind the working face, at a distance
ranging between 10 and 30 m, along a 100 m long section parallel to the working face.

Mechanical characterization of a loess sequence from Belgium 3
Figure 1. Location map of the investigated site beside the Romont quarry (Eben-Emael, Belgium).
Coordinates in Belgian Lambert 72.
The in situ geotechnical testing campaign consisted of a line of 9 electric CPTs with a regular spacing of 10
m in the central part (Figure 2). These tests were increased by 4 CPTs with a M2-type cone and 3 CPTs with a
M1-type cone. A drilling was also carried out into the central area of the investigated site.
Figure 2. In situ geotechnical testing campaign on the site of the Romont quarry. Coordinates in Belgian
Lambert 72.

34èmes Rencontres de l’AUGC, Université de Liège, Belgique, 25 au 27 mai 2016 4
2.2. Geological setting
The working face of the quarry intersects from the base, the Maastrichtian (70.6-65.5 Ma) chalk and
calcarenite of the Maastricht Formation [MOT 12]. During Rupelian (33.9-28.4 Ma) (Lower Oligocene), the
Maastrichtian Formation was covered by fine sands, silts and clays of the Sint-Huibrechts-Hern Formation
[LAG 88]. The marine regression at the end of Oligocene allowed the establishment of a river network. Rivers
partly or totally eroded the Sint-Huibrechts-Hern Formation and caused the deposition of lenticular layers
including fine to coarse sands and gravels [JUV 92]. Oligocene deposits and fluvial terraces were then overlaid
by aeolian silt layers during Quaternary (2.588-0 Ma).
At the studied site, the loess layer reaches a maximum of 12 m thick. It is mainly related to Late Pleistocene
corresponding to the Last Interglacial (Eemian, 128-112 ka) and the Last Glaciation (Weichselian, 112-12 ka).
A detailed description of the Late Pleistocene deposits, visible from the working face, points out the presence of
a series of lithological and pedological horizons, from the base : Rocourt Pedocomplex, Humiferous Complex of
Remicourt, Malplaquet Soil, Vaux Soil, Nagelbeek Tongued Horizon [DEL in press, b]. These horizons are
well-known in Middle Belgium and in neighbouring regions. Studies of the loess layer from different sites in
Middle Belgium established stratigraphic correlations at regional scale (e.g. [HAE 11]). The description of the
studied section of the working face also reveals the presence of lens-shape loess layers and a palaeovalley
characterized by a N-S axis at the base of Weichselian loess [DEL in press, b]. The water table is located into
the Maastricht Formation. As a result, the studied sequence is partially saturated.
3. Investigation methods
Cone Penetration Tests (CPT) consist of pushing continuously or intermittently a cone at the end of a series
of rods into the ground at a constant rate of 2 cm/s. The load pushing the equipment into the ground is provided
by a 25 T lorry equipped by a HYSON 200 kN penetrometer developed by A.P. van den Berg. The strength
required to push the cone into the ground is exerted by a hydraulic system and the resulting hydraulic pressure is
read on two manometers 0-20 MN/mm² and 0-200 MN/m².
Three common, convenient and robust cones were tested in this study: M1, M2 and electric E (Figure 3). The
mechanical jacket cone (M1-Type) consists of a mechanical cone used from the 1950s. It is characterized by a
diameter of 35.7 mm (10 cm² cross-sectional area) and a 60° apex angle. The cone resistance, qc, is read each 20
cm on the manometers and the pushing is intermittent. The local sleeve friction, fs, cannot be measured with the
cone M1. This parameter is available with a mechanical friction jacket cone (cone M2, also called Begemann
Type) and with an electric cone. The cone M2 is pushed intermittently into the ground, with a measurement of qc
and fs each 20 cm with depth. The electric cone is pushed continuously allowing a measurement each centimetre
of the same parameters as the cone M2. The electric cone gives then a more detailed section of the intersected
subsoil layers than the mechanical cones.
Figure 3. Cone types used and terminology. M1 = mechanical jacket cone; M2 = mechanical friction jacket
cone; E = electric cone.

Mechanical characterization of a loess sequence from Belgium 5
The drilling method was chosen to sample undisturbed core samples of loess, continuously with depth. A
core drill was intermittently pushed into the subsoil. 50 cm long and 100 mm diameter samples were then
extracted. These soil samples were carefully used for laboratory tests. A total amount of 12 samples has been
chosen to be analyzed in the laboratory. Oedometer tests, Atterberg limits and grain size distribution analyses
(sieving and sedimentation methods) were carried out on each sample.
4. Results
4.1. Influence of the cone
Many studies point out a deviation of the cone resistance between mechanical and electric cones. The
deviation results from a coupled effect between geometry differences of cones (presence of a mantle behind the
cone, diameter of the part behind the cone) and the friction acting between the inner rods and the sounding tubes
for mechanical cones [ROL 82]. Each effect is also influenced by the soil type. A study [WHE 04] of different
sites investigated in Belgium concludes that the ratio between the qc-values obtained with mechanical cones
(M1 and M2) and electric cones are slightly below unity in sand (0.90-0.97). A clear trend also appears for clays
in which mechanical cones give an increase of the cone resistance up to 30 %. For silty materials, the cone
resistance is not influenced by the cone type. Kulhawy et al. [KUL 90] proposed the following relation, where pa
is the atmospheric pressure:
1.19
0.47c c
a aE M
q q
p p
[ 1 ]
Cone resistance data of the loess layer from the site of Romont are compiled in Figure 4A & B. The physical
characterization performed in the laboratory reveals that the loess may be classified as silty clay to lean clay
after the Unified Soil Classification System (USCS) [AST 06]. For this type of material, the qc-values measured
from both mechanical and electric cones are similar. No difference also exists between the cone M1 and the
cone M2. These results are in good agreement with previous studies.
Figure 4. (A) Evolution of the mean qc for each cone type through depth. (B) Correlation of qc between
mechanical (M1 and M2) and electric (E) cones (after [KUL 90]).
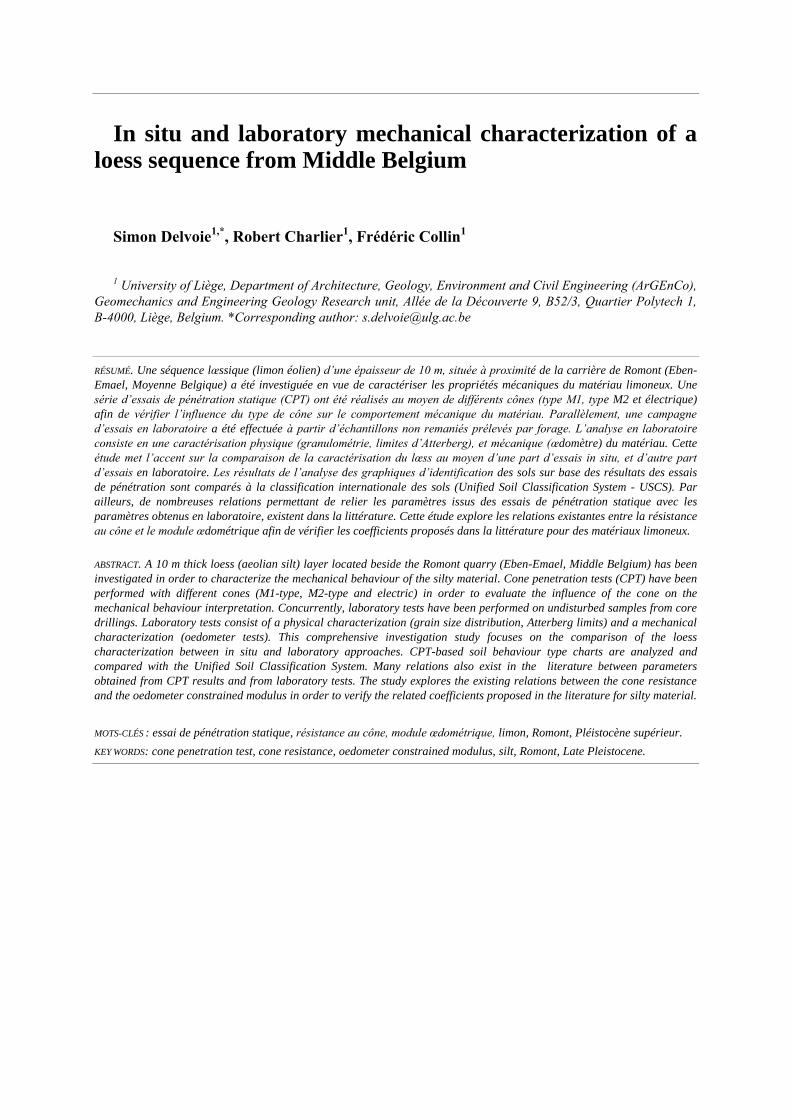
The analysis of the local sleeve friction is more complex and less documented in the literature. Kulhawy et
al. [KUL 90] noticed that the mechanical cones give higher readings than electric cones in all soils. In sands, the
ratio is about 2 and in clays, the ratio varies from 2.5 to 3.5. The obtained ratio for clays was confirmed more
recently by measurements in Belgian Tertiary clays [MEN 01]. Measurements from the site of Romont (Figure
5) indicate a ratio between 1 and 2.6 for the loess layer and rapidly decrease below unity into the sand and clay
deposits of the Sint-Huibrechts-Hern Formation, in relation with the very low values of fs acquired by the
Begemann cone.
34èmes Rencontres de l’AUGC, Université de Liège, Belgique, 25 au 27 mai 2016 6
Figure 5. Comparison of fs between mechanical (M2) and electric (E) cones.
4.2. Soil behaviour type chart analysis
Cone penetration tests are often performed as a method for soil profiling. This has been accomplished using
soil behaviour type (SBT) charts that link cone parameters to soil types. Many SBT charts have been developed
since the CPT was created to make a more accurate determination of soil types. These charts have also evolved
to take into account technological developments of cones. However, attention may be paid to the interpretation
of data from SBT charts, in terms of soil type classification. Indeed, they are based on the in situ mechanical
behaviour of the soil and not directly to soil classification criteria based on grain size distribution and Atterberg
limits (e. g. Unified Soil Classification System, USCS [AST 06]).
The first most commonly used SBT chart was undoubtedly the chart developed by Robertson et al. [ROB
86]. The chart uses qc and Rf (the friction ratio), where
100%s
f
c
fR
q
[ 2 ]
It has been improved to account for the cone resistance increases with depth [ROB 90]. The chart is based on Qt
and Fr given by:
0
,
0
t v
t
v
[ 3 ]
0
s
r
t v
fF
q
[ 4 ]
where qt is the cone resistance corrected for pore water effects in saturated medium (qt is equivalent to qc in a
partially saturated medium), σv0 is the vertical stress and σ’v0 is the effective vertical stress.
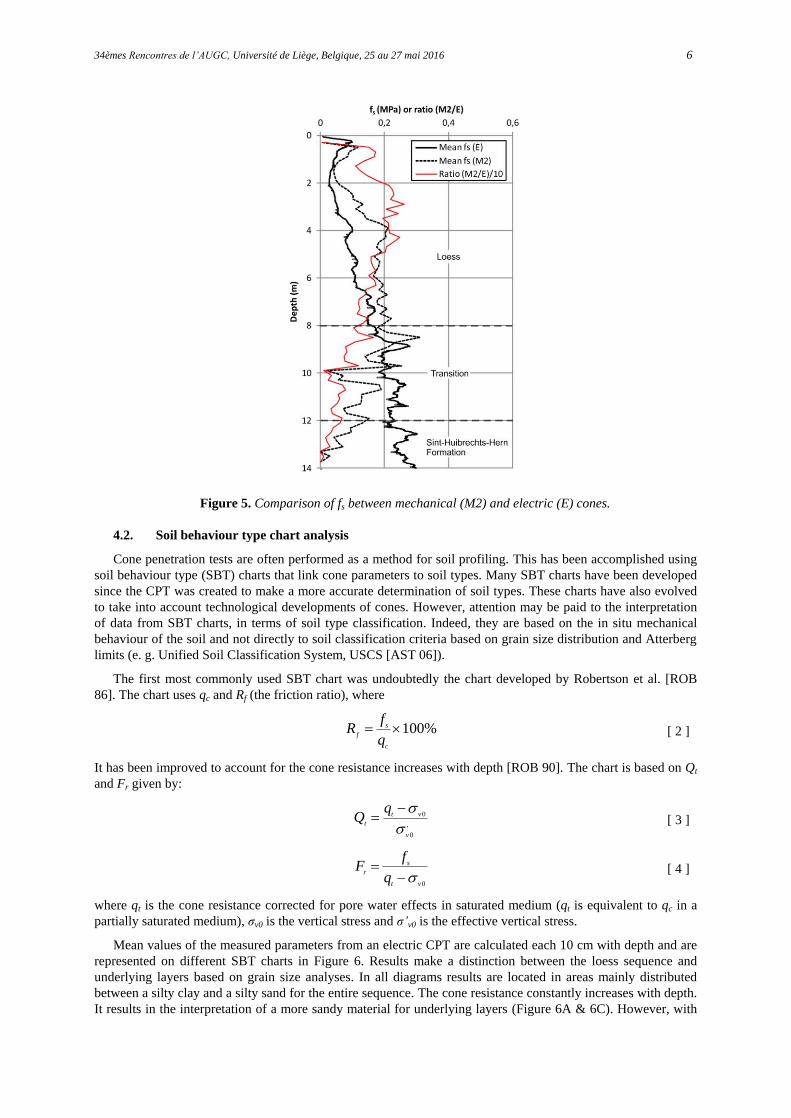
Mean values of the measured parameters from an electric CPT are calculated each 10 cm with depth and are
represented on different SBT charts in Figure 6. Results make a distinction between the loess sequence and
underlying layers based on grain size analyses. In all diagrams results are located in areas mainly distributed
between a silty clay and a silty sand for the entire sequence. The cone resistance constantly increases with depth.
It results in the interpretation of a more sandy material for underlying layers (Figure 6A & 6C). However, with
Mechanical characterization of a loess sequence from Belgium 7
normalized Qt and Fr values, the distinction between both layers is not possible any more (Figure 6B). This is in
agreement with the local geological context where the Sint-Huibrechts-Hern Formation is composed of fine
sands, silts and clays [LAG 88]. These materials are too similar compared to loess to make possible the
distinction based on SBT charts.
Figure 6. (A) SBT chart using uncorrected qc data, after [ROB 86] (CPTE-05; see Figure 2 for location)
(1:sensitive fine grained; 2:organic material; 3:clay; 4:silty clay to clay; 5:clayey silt to silty clay; 6:sandy silt
to clayey silt; 7:silty sand to sandy silt; 8:sand to silty sand; 9:sand; 10:gravelly sand to sand; 11:very stiff fine
grained*; 12:sand to clayey sand*) (*overconsolidated or cemented). (B) SBT chart using normalized Qt and Fr
data, after [ROB 90] (CPTE-05) (1:sensitive, fine grained; 2:organic soils-peats; 3:clays-clay to silty clay;
4:silt mixture; clayey silt to silty clay; 5:sand mixture; silty sand to sand silty; 6:sands; clean sands to silty
sands; 7:gravelly sand to sand; 8:very stiff sand to clayey sand; 9:very stiff fine grained). (C) SBT chart after
[ESL 04] (CPTE-05) (1:sensitive and collapsible clay and/or silt; 2:clay and/or silt; 3:silty clay; 4:clayey silt;
5:sandy silt; 6:silty sand; 7:sand; 8:sandy gravel).
4.3. Estimation of deformation characteristics
Deformation characteristics of soils are generally expressed as a soil modulus. This parameter is usually
calculated in the laboratory from oedometer tests performed on undisturbed samples. The 1-D constrained
modulus (M) is expressed as follows:
0
2.3(1 )v v
c
eM
C
[ 5 ]
where ε is the axial strain, e0 is the initial void ratio, σ’v is the applied vertical loading and Cc is the compression
index measured on the linear plastic portion of the compressibility curve (after national and international norms;
e.g. [ISO 14]). The soil modulus can alternatively be calculated from the cone resistance:
cM q [ 6 ]
where α is a coefficient depending on soil types.
Sanglerat [SAN 72] developed a comprehensive array of values for different soil types. In order to
consider the plastic portion of the compressibility curve, Sanglerat suggested referring to the formula [ 8 ] for
normally (OCR = 1) or underconsolidated (OCR < 1) soils and to the formula [ 9 ] for overconsolidated (OCR >
1) soils (see Table 1). The author added that the calculation of Cc is performed with a loading increment
corresponding to 1 bar. This increment was chosen to be consistent with settlement estimations of shallow
footings. Many national and international norms (e.g. [BSE 07]) are referring to α values obtained by Sanglerat
[SAN 72] to evaluate deformation characteristics from CPT data.
Finally, Senneset et al. [SEN 89] proposed to calculate the constrained modulus as a function of the net cone
resistance [ 10 ] (see Table 1).
In this study, the coefficient α is calculated from the oedometer test results and the cone resistance performed
on the site of Romont. The different methods for the calculation of the coefficient α, summarized in Table 1, are
applied and compared to values proposed in the literature for a corresponding soil type. Previously to the
analysis, the OCR of the loess profile has been estimated from oedometer test results. The uppermost four
metres are characterized by an OCR decreasing with depth from 4.5 to 2. Underlying loess are characterized by
an OCR ranging between 1 and 2. The analysis based on Sanglerat methods [SAN 72] is in agreement with α

34èmes Rencontres de l’AUGC, Université de Liège, Belgique, 25 au 27 mai 2016 8
values proposed for comparable soils. Results concerning the method proposed by Senneset [SEN 89] are also
consistent with α values referred in the literature. Finally, methods suggested by norms give a higher coefficient
α than values obtained by Sanglerat methods. This is related to the portion of the consolidation curve that is
considered to determine Cc. The ratio of the calculated mean value of α, between methods suggested by norms
and methods proposed by Sanglerat, is about 2. By referring to α values calculated by Sanglerat, norms
overestimate the oedometer modulus and thus the settlement under shallow footings.
Table 1. Different methods for the calculation of the coefficient α. Calculated α values for the site of Romont
and proposed α values from the literature and for a corresponding soil type are summarized. (1) Method
proposed by international norms and Eurocode 7 [BSE 07]; (2a) Method proposed by Sanglerat for normally or
underconsolidated soils [SAN 72]; (2b) Method proposed by Sanglerat for overconsolidated soils [SAN 72]; (3)
Method proposed by Senneset [SEN 89].
Authors and norms α calculation Proposed α value in the
literature
Calculated α mean value (and
standard
deviation)
1. Norms (e.g. [BSE 07]) 0
2.3(1 )
.
v
c c
e
C q
[ 7 ]
1 to 2.5 (for CL with qc>20
bar) (after [SAN 72]) 3.57 (±1.33)
where σ’v is the applied vertical loading and Cc is the compression index measured on the linear plastic part of the
compressibility curve.
2a. [SAN 72] for OCR ≤ 1 0 0
0
2.3(1 )v
c c
e
C q
[ 8 ]
1.5 (for loose sand) (after
[SAN 72]) 1.42 (±0.64)
where σ’v0 is the effective vertical stress, e0 is the initial void ratio and Cc0 is the compression index calculated between σ’v0
and (σ’v0+1bar).
2b. [SAN 72] for OCR > 1 2.3(1 )
c c
cc c
e
C q
[ 9 ]
1<α<2.5 (for CL with qc>20
bar) (after [SAN 72]) 1.85 (±1.10)
where σ’c is the overconsolidation stress, ec is the void ratio corresponding to σ’c and Ccc is the compression index calculated
between σ’c and (σ’c+1bar).
3. [SEN 89] 0
( )c v
M
q
[ 10 ]
≈ 5 (for soft to firm clays and
NC sands) and;
1 to 2 (for organic plastic clays
of Sweden) (after [MAY 07])
3.66 (±1.36)
where M is the constrained modulus from oedometer tests. M is expressed as a function of the net cone resistance (qc - σ’v0).
5. Discussions and conclusions
The site of Romont (Eben-Emael, Belgium) offers a great opportunity to study the mechanical behaviour of a
well-developed 10 m thick loess sequence from in situ and laboratory tests. A series of cone penetration tests
have been performed on the site with different cone types: M1, M2 and electric. Contrary to sandy or clayey
materials, the cone resistance measurement is not influenced by the choice of the cone type for silty soils.
However, the local sleeve friction is greatly influenced by the choice of the cone type. Inside the loess layer, the
mechanical cone M2 estimates a larger local sleeve friction than measurements from the electric cone. This
difference has already been observed in many sites. Quite surprisingly, this trend is reversed in the clay, silt and
sand deposits of the underlying Sint-Huibrechts-Hern Formation. Further analyses of the skin friction, and of the
deposits characterizing the Sint-Huibrechts-Hern Formation, are certainly needed to increase the understanding
of the observed trend.
Soil behaviour type (SBT) charts are based on parameters measured with electric cones. As a result the
mechanical cone measurements performed on the site of Romont are not considered in this section. From the

Mechanical characterization of a loess sequence from Belgium 9
SBT charts, data related to the loess layer are located in areas corresponding to intermediate material, between
sand and clay. This is in agreement with grain size distribution results. Cone resistance constantly increases with
depth. The material characterizing the Sint-Huibrechts-Hern Formation is thus interpreted as more sandy
according to non normalized SBT charts. Whereas the normalized SBT chart of Robertson [ROB 90] indicates
no difference between loess and underlying deposits. Grain size distribution data of the Sint-Huibrechts-Hern
Formation are needed to make more accurate the type of material localized under the loess layer on the
investigated site. Indeed, the regional geological description includes clay, silt and sand deposits inside the Sint-
Huibrechts-Hern Formation.
This study offers an uncommon and comprehensive geotechnical investigation campaign on loess material,
with data from cone penetrometers in the one hand, and oedometers in the other hand. Interesting results
concern the analysis of the coefficient α, linking the cone resistance to the oedometer constrained modulus [ 6 ].
Different existing relations from the literature are summarized. The coefficient α is calculated according to each
method, and obtained values are compared to related α value tables, for a corresponding soil. Methods proposed
by Sanglerat [SAN 72] and by Senneset [SEN 89] give consistent calculated α values compared with suggested
values in the corresponding tables. Norms refer to the table proposed by Sanglerat [SAN 72] while the
calculation of the oedometer contrained modulus is different. As a result the calculated α coefficient is about
two times higher than the value suggested by Sanglerat. This means the settlement is overestimated. The method
proposed by norms is thus conservative.
6. References
[AST 06] ASTM D2487-06, 2006. Standard Practice for Classification of Soils for Engineering Purposes (Unified
Classification System). ASTM International, West Conshohocken, PA, United-States, 2006, www.astm.org.
[BSE 07] BS EN 1997-2, 2007. Eurocode 7 – Geotechnical design – Part 2: Ground investigation and testing. BSI, London,
196 p.
[BUI 41] BUISMAN, A.S.K., 1941. Grondmechanica. Bandoengse Technische Hoogeschool, Fonds Kleijne, Bandoeng, 349 p.
[BUS 82] BUSTAMANTE, M. & GIANESELLI, L., 1982. Pile bearing capacity prediction by means of static penetrometer CPT.
Proceedings of the 2nd European Symposium on Penetration Testing, ESOPT-II, Amsterdam, p. 493-500.
[DEL in press, a] DELVOIE, S., BOULVAIN, F., CHARLIER, R. & COLLIN, F., in press. Detailed characterization of the Late
Pleistocene loess sequence stratigraphy of Remicourt (Hesbaye Region, Belgium) with cone penetration tests. Geologica
Belgica.
[DEL in press, b] DELVOIE, S., PIRSON, S., CHARLIER, R. & COLLIN, F., in press. Etude da la séquence stratigraphique des
loess de la carrière de Romont (Eben-Emael, Belgique) par une campagne géotechnique. Notae Praehistoricae, 36.
[DOU 81] DOUGLAS, B.J. & OLSEN, R.S., 1981. Soil classification using electric cone penetrometer. Cone Penetration
Testing and Experience. Proceedings of the ASCE National Convention, St-Louis, American Society of Engineers, p.
209-227.
[ESL 04] ESLAMI, A. & FELLENIUS, B.H., 2004. CPT and CPTu data for soil profile interpretation: review of methods and a
proposed new approach. Iranian Journal of Science & Technology, 28, p. 69-86
[HAA 07] HAASE, D., FINK, J., HAASE, G., RUSKE, R., PÉCSI, M., RICHTER, H., ALTERMANN, M. & JAEGER, K.D., 2007. Loess
in Europe; its spatial distribution based on a European loess map, scale 1:2,500,000. Quaternary Science Reviews, 26, p.
1301-1312.
[HAE 11] HAESAERTS, P., DI MODICA, K. & PIRSON, S., 2011. Le gisement paléolithique de la Sablière Gritten à Rocourt
(province de Liège). In : TOUSSAINT, M., DI MODICA, K. & PIRSON, S. (eds). Le Paléolithique Moyen en Belgique.
Mélanges Marguerite Ulrix-Closset. Bulletin de la Société royale belge d’Études géologiques et archéologiques « Les
Chercheurs de la Wallonie » (hors-série n°4) et Etudes et Recherches archéologiques de l’Université de Liège (n°128), p.
359-374.
[ISO 14] ISO/TS 17892-5, 2014. Geotechnical investigation and testing – Laboratory testing of soil – Part 5 : Incremental
loading oedometer test. International Organization for Standardization, Geneva, Switzerland, 30 p.
[JUV 92] JUVIGNÉ, E., 1992. Les formations cénozoïques de la carrière C.B.R. du Romont (Eben/Bassange, Belgique).
Annales de la Société Géologique de Belgique, 115, 159-165.
34èmes Rencontres de l’AUGC, Université de Liège, Belgique, 25 au 27 mai 2016 10
[KUL 90] KULHAWY, F.H. & MAYNE, P.W., 1990. Manual on estimating soil properties for foundation design. EPRI EL-
6800, Reaserch Project 1493-6, Final report, August 1990, Cornell University, Ithaca, New York, 308 p.
[LAG 88] LAGA, P., 1988. Formatie van Sint-Huitbrechts-Hern. In : MARÉCHAL, R. & LAGA, P. (eds). Voorstel
lithostratigraphische indeling van het Paleogeen. Belgische Geologische Dienst, Brussel, p. 164-169.
[MAY 07] MAYNE, P. W., 2007. Cone Penetration Testing. A synthesis of highway practice. Project 20-5 NCHRP Synthesis
368. Transportation Research Board of National Academies, Washington, D.C., 118 p.
[MEN 01] MENGÉ, P., 2001. Soil investigation results at Sint-Katelijne-Waver (Belgium). Proceedings of the Symposium on
Screw Piles, Brussels, Belgium, Balkema Publishers, Rotterdam, p. 19-62.
[MOT 12] MOTTEQUIN, B. & MARION, J.M., 2012. Carte géologique Tongres-Herderen (34/5-6) : notice explicative.
Provisional version of the 05/09/2012, 29 p.
[PÉC 90] PÉCSI, M., 1990. Loess is not just the accumulation of dust. Quaternary International, 7-8, p. 1-21.
[PÉC 95] PÉCSI, M., 1995. The role of principles and methods in loess-paleosol investigations. GeoJournal, 36, p. 117-131.
[ROB 86] ROBERTSON, P.K., CAMPANELLA, R.G., GILLESPIE, D. & GREIG, J., 1986. Use of piezometer cone data.
Proceedings of the ASCE Specialty Conference In Situ ’86: Use of In Situ Testing in Geotechnical Engineering,
Blacksburg, p. 1263-1280.
[ROB 90] ROBERTSON, P.K., 1990. Soil classification using the cone penetration test. Canadian Geotechnical Journal, 27, p.
151-158.
[ROB 09] ROBERTSON, P.K., 2009. Interpretation of cone penetration tests – a unified approach. Canadian Geotechnical
Journal, 46, p. 1337-1355.
[ROL 82] ROL, A.H., 1982. Comparative study on cone resistances measured with three types of CPT tips. In: VERRUIJT, A.,
BERINGEN, F.L. & DE LEEUW, E.H.(eds). Penetration Testing. Proceedings of the Second European Symposium on
Penetration Testing, Amsterdam, 24-27 May, Volume 2, Balkema Publishers, Rotterdam, p. 813-819.
[SAN 72] SANGLERAT, G., 1972. The penetrometer and soil exploration. Interpretation of penetration diagrams – theory and
practice. Elsevier Publishing Company, Amsterdam, 464 p.
[SEN 89] SENNESET, K., SANDVEN, R. & JANBU, N., 1989. The evaluation of soil parameters from piezocone tests.
Transportation Research Record, 1235, p. 24-37.
[SMA 01] SMALLEY, I.J., JEFFERSON, I.F., DIJKSTRA, T.A. & DERBYSHIRE, E., 2001. Some major events in the development of
the scientific study of loess. Earth Science Reviews, 54, p. 5-18.
[TON 11] TONNI, L. & GOTTARDI, G., 2011. Analysis and interpretation of piezocone data on the silty soils of the venetian
lagoon (Treporti testsite). Canadian Geotechnical Journal, 48, p. 616-633.
[WHE 04] WHENHAM, V., HUYBRECHTS, N., DE VOS, M., MAERTENS, J., SIMON, G. & VAN ALBOOM, G., 2004. Results of a
comparative study on cone resistance measurements. Proceedings of the second International Conference on
Geotechnical and Geophysical site characterization, Porto, Portugal, 19-22 Septembre 2004, p. 399-406.
[ZHA 02] ZHANG, G., ROBERTSON, P.K. & BRACHMAN, R.W.I., 2002. Estimating liquefaction-induced ground settlements
from CPT for level ground. Canadian Geotechnical Journal, 39, p. 1168-1180.