in business for you - unit4 · more revenue, higher profits, faster growth the business-critical...
TRANSCRIPT

In Business for You
E X E C U T E P R O F I TA B L E P R OJ E C T S

E X E C U T E P R O F I TA B L E P R OJ E C T S
2

E X E C U T E P R O F I TA B L E P R OJ E C T S
3
Overview – visibility through technology 4
The KPIs 5
Repeatable processes 6
Coming of age 7
Seeing ahead 8
The case for automation 9
Summary – path to profit 10
Contents

E X E C U T E P R O F I TA B L E P R OJ E C T S
4
Overview – Visibility through technology
Time for change
The unbridled progress of digital technology has enabled disruption in almost every sector. It’s irreversibly affected the talent market and driven up competition across the board.
But digital technology has also matured. Today, dashboards are user-friendly, data is collected in real-time and every aspect of a people-centric, project-based business can be integrated into a single, cloud-based system of record. It’s no surprise that the top five percent of professional services organizations (PSOs) are tech-enabled*.
“Technology understanding and use has become a strategic imperative to exploit globalization and drive market growth. Barriers to entry are being lowered as faster, nimbler, more technology-savvy firms seize top clients and markets. In a business climate driven by technology, disruption and skilled talent shortages, professional services organizations must themselves become technology-enabled.*”
Optimize, bill, winThe top-performing PSOs execute profitable projects by hitting revenue and margin targets thanks to greater visibility and control over their project plan, schedule, cost and budget.
They reach optimal utilization rates by synchronizing availability, requests, allocations and project backlog. These market-leaders have shorter sales-to-cash cycles because they bill with precision, avoiding invoice disputes and payment delays. They win more business thanks to close customer relationship management and more accurate proposals based on past project success.
They owe much of this success to the insight and foresight afforded by an enterprise resource planning (ERP) solution for services.
New records set for services industry >>>
E X E C U T E P R O F I TA B L E P R OJ E C T S
5
The KPIs
All set? Let’s go >>>
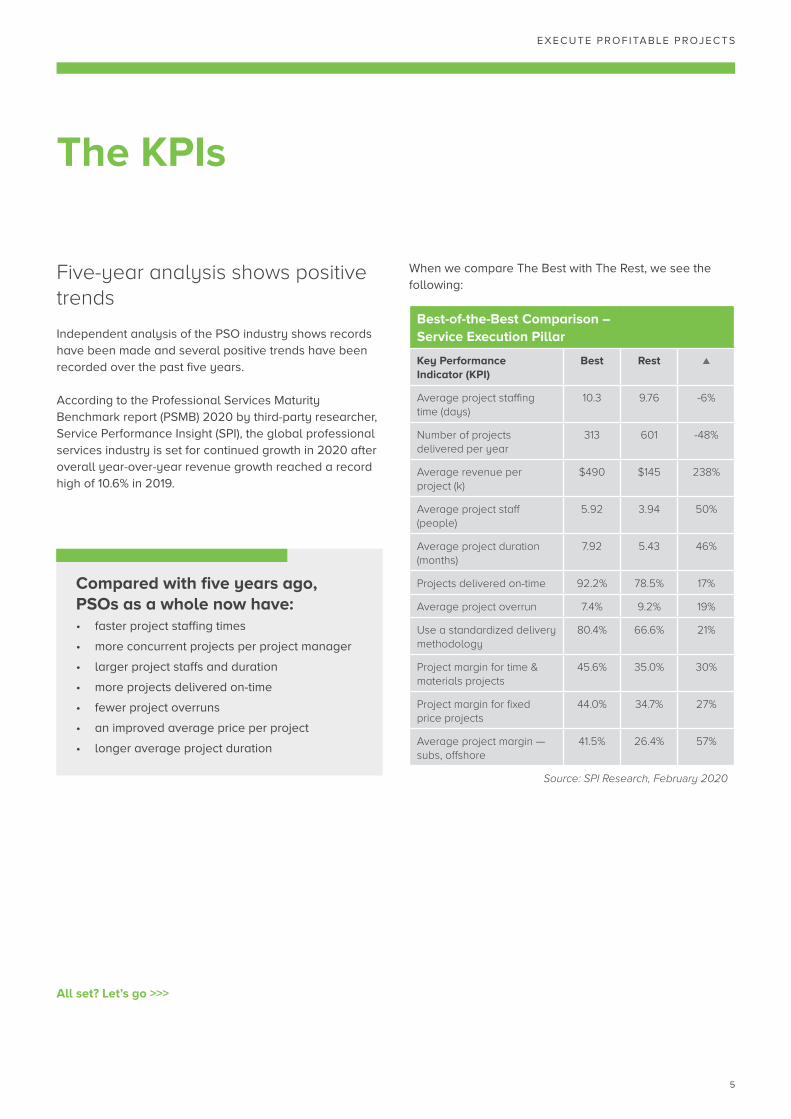
Five-year analysis shows positive trends
Independent analysis of the PSO industry shows records have been made and several positive trends have been recorded over the past five years.
According to the Professional Services Maturity Benchmark report (PSMB) 2020 by third-party researcher, Service Performance Insight (SPI), the global professional services industry is set for continued growth in 2020 after overall year-over-year revenue growth reached a record high of 10.6% in 2019.
When we compare The Best with The Rest, we see the following:
Compared with five years ago, PSOs as a whole now have: • faster project staffing times
• more concurrent projects per project manager
• larger project staffs and duration
• more projects delivered on-time
• fewer project overruns
• an improved average price per project
• longer average project duration
Best-of-the-Best Comparison – Service Execution Pillar
Key Performance Indicator (KPI)
Best Rest ▲
Average project staffing time (days)
10.3 9.76 -6%
Number of projects delivered per year
313 601 -48%
Average revenue per project (k)
$490 $145 238%
Average project staff (people)
5.92 3.94 50%
Average project duration (months)
7.92 5.43 46%
Projects delivered on-time 92.2% 78.5% 17%
Average project overrun 7.4% 9.2% 19%
Use a standardized delivery methodology
80.4% 66.6% 21%
Project margin for time & materials projects
45.6% 35.0% 30%
Project margin for fixed price projects
44.0% 34.7% 27%
Average project margin — subs, offshore
41.5% 26.4% 57%
Source: SPI Research, February 2020

E X E C U T E P R O F I TA B L E P R OJ E C T S
6
PSA is coming of age. Let’s see how >>>
Repeatable processes
Top five percent rely on repeatable processes
Third-party research shows that The Best PSOs (the top five percent) are “uniform” in their commitment to developing standardized methodologies which result in more projects delivered on-time, fewer project overruns and fewer project cancellations.
They rely on repeatable processes and project templates within a PSA-integrated project management system, alongside tools for planning, budgeting, forecasting and analyzing.
As well as this, they are focused on measuring quality and client satisfaction, with most estimates, proposals and changes going through a “rigorous evaluation” to ensure proper risk management and margin analysis.
“Because almost every leader relies on a PSA application they can build and reinforce project delivery standards which result in precision execution and high levels of quality, productivity and profitability.
They credit their PSA with improving resource, project management, time and expense capture and billing, leading to higher levels of billable utilization and on- time project completion.*”
These business are winning more business thanks to standardized methodologies, repeatable processes and more accurate proposals based on past project success. They have switched from being reactive and tactical to strategic and proactive.
E X E C U T E P R O F I TA B L E P R OJ E C T S
7
PSA allows PSOs to become more proactive and strategic >>>
Coming of age
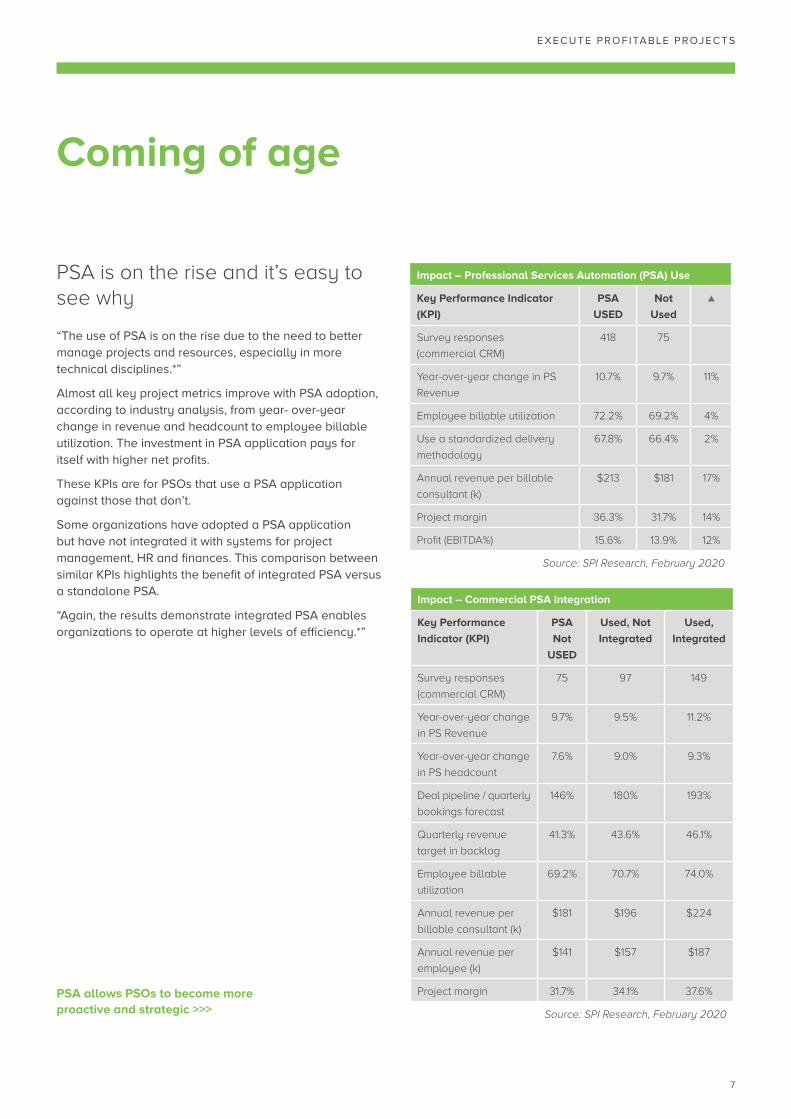
PSA is on the rise and it’s easy to see why
“The use of PSA is on the rise due to the need to better manage projects and resources, especially in more technical disciplines.*”
Almost all key project metrics improve with PSA adoption, according to industry analysis, from year- over-year change in revenue and headcount to employee billable utilization. The investment in PSA application pays for itself with higher net profits.
These KPIs are for PSOs that use a PSA application against those that don’t.
Some organizations have adopted a PSA application but have not integrated it with systems for project management, HR and finances. This comparison between similar KPIs highlights the benefit of integrated PSA versus a standalone PSA.
“Again, the results demonstrate integrated PSA enables organizations to operate at higher levels of efficiency.*”
Impact – Professional Services Automation (PSA) Use
Key Performance Indicator
(KPI)
PSA
USED
Not
Used
▲
Survey responses
(commercial CRM)
418 75
Year-over-year change in PS
Revenue
10.7% 9.7% 11%
Employee billable utilization 72.2% 69.2% 4%
Use a standardized delivery
methodology
67.8% 66.4% 2%
Annual revenue per billable
consultant (k)
$213 $181 17%
Project margin 36.3% 31.7% 14%
Profit (EBITDA%) 15.6% 13.9% 12%
Source: SPI Research, February 2020
Impact – Commercial PSA Integration
Key Performance
Indicator (KPI)
PSA
Not
USED
Used, Not
Integrated
Used,
Integrated
Survey responses
(commercial CRM)
75 97 149
Year-over-year change
in PS Revenue
9.7% 9.5% 11.2%
Year-over-year change
in PS headcount
7.6% 9.0% 9.3%
Deal pipeline / quarterly
bookings forecast
146% 180% 193%
Quarterly revenue
target in backlog
41.3% 43.6% 46.1%
Employee billable
utilization
69.2% 70.7% 74.0%
Annual revenue per
billable consultant (k)
$181 $196 $224
Annual revenue per
employee (k)
$141 $157 $187
Project margin 31.7% 34.1% 37.6%
Source: SPI Research, February 2020

E X E C U T E P R O F I TA B L E P R OJ E C T S
8
Seeing ahead
Thanks to real-time visibility and analysis
The best-performing PSOs have become more proactive thanks to real-time visibility and analysis, which has transformed decision-making from tactical to strategic.
With powerful software tools, planning is no longer a dreaded, once-a-year, laborious process. It has become a fluid, collaborative, all-year-long process that facilitates input and cooperation across all functions and levels. With the right tools, managers at all levels are empowered to analyze business performance, conduct their own root cause analysis and take immediate action before it is too late.
Dashboards to track, capture and forecastThese days, user displays and dashboards mimic social tools, making it intuitive and easy-to-use.
With all data in the system and role-based dashboards at their fingertips, your operations and finance teams can keep tabs on all project KPIs.
In the field, consultants can log actual time, expenses and purchases on each project or task.
Because forecasting is based on actual costs and hours, it’s possible to assess and analyze a project’s financial performance relative to the baseline. You can also predict potential project risks and make changes in governance or methodology before it’s too late.
Next: The business-critical benefits of ERP >>>
E X E C U T E P R O F I TA B L E P R OJ E C T S
9
The case for automation
More revenue, higher profits, faster growth
The business-critical benefits of ERP system use include increases in pre-tax profit, higher average revenue per project and faster growth. PSOs can manage the front- and back-office with lower administrative overheads and deliver more projects on time, driving better financial performance. Organizations that also use a PSA solution grow faster, are much more profitable, and simply operate far more efficiently.
Unifying finance and operations An ERP solution provides the basis for initiation, planning, resource management, scheduling, execution, and close control of projects and services. It helps you manage service delivery by overseeing opportunities, staffing, project management, and collaboration.
ERP is typically the system of record for resource skills, competencies and preferences with integration to the employee and contractor database. It is used to capture time and expense and purchases by project and resource down to the task level, and it is the system of record for resource utilization and project cost and estimating.
The right solution for services firms integrates with billing capabilities with different levels of revenue recognition by type of billing method – time and materials, work in process or fixed price.
An integrated solution allows you to effectively unify finance teams in the back office with front-office operations teams.
Margins and revenueProject margin is 37.6% higher in professional services firms which have completely embraced information systems and optimized operation.
Average revenue per project is 238 percent higher in the best performing PS firms which rely on a PSA application.
That’s a lot to take in. Let’s sum it all up >>>

E X E C U T E P R O F I TA B L E P R OJ E C T S
For more information, go to:
unit4.com
Summary – path to profit
The road to profit is paved with accuracy, automation and visibility
There are many ERP solutions out there. The right one should be specifically built for services firms and allow you to do all this:
Win more businessGrow new business win rates and client profitability with more accurate proposals based on past project success.
Optimize resource utilizationAttract the best talent and attain optimal utilization rates by synchronizing availability, requests, allocations and project backlog.
Execute profitable projectsAchieve revenue and margin targets with 360-degree visibility and control of project plan, schedule, cost and budget.
Bill with precisionSelf-driving timesheets help shorten the service-to-cash cycle with fast invoicing and tight cash collection control.
If your ERP software hampers your progress in any way, there could be something wrong. If you’re yet to adopt an ERP for services, the right time could be now.
Thank you for reading.With the right partner, you can also integrate systems for managing client relationships, human resources and finance into your PSA solution.
Read more about these performance pillars in our e-guides on clients, talent and finance. To read more independent insights from SPI, you can download the 2020 PSMB.
References
*Source: 12th annual Professional Services Maturity Benchmark (PSMB) report 2020, by third-party research firm, Service Performance Insight (SPI).
Copyright © Unit4 N.V. All rights reserved. The information contained in this document is intended for general information only, as it is summary in nature and subject to change. Any third-party brand names and/or trademarks referenced are either registered or unregistered trademarks of their respective owners. WP200329INT
Ready for a demo?
We would like to get in touch to show you our solutions and answer any questions you might have. Click here to request a personal demo.

E X E C U T E P R O F I TA B L E P R OJ E C T S
1 1

E X E C U T E P R O F I TA B L E P R OJ E C T S
1 2