imra small business merchandise market study...
TRANSCRIPT

IMRA Small Business Merchandise Market StudyMay 2015
Background
2
The Incentive Manufacturers and Representatives Alliance (IMRA) includes manufacturer’s representatives who provide name-brand merchandise to companies for their reward/motivation and appreciation needs.
IMRA sought to learn more about the small business market – companies with between $1 million and $50 million in annual sales.
In partnership with the Incentive Research Foundation (IRF), IMRA retained Intellective Group to conduct an online survey of small business merchandise decision-makers to understand:
▫ Incidence of various types of programs (sales, employee, channel, customer)
▫ Use of merchandise
▫ Types of merchandise used
▫ Sourcing for merchandise
▫ Buying behaviors
▫ Awareness of other options for sourcing merchandise
▫ Merchandise purchase criteria
▫ Size of this market opportunity

Methods
3
Intellective Group facilitated an online survey of small business merchandise decision-makers during April 2015.
A total of 215 decision-makers qualified and completed the full survey as those:▫ Whose companies use name brand merchandise to reward one or more audiences
(salespeople, distributors, employees, or customers)▫ ...and who offer merchandise awards/gifts and/or logo’d brand name merchandise and/or
premium symbolic awards/gifts▫ ... And who are knowledgeable and make purchase decisions as they relate to merchandise
825 people
451 people
404 people
Began survey; asked about use of name brand merchandise to
reward and/or thank salespeople, distributors,
employees, and customers
..Use name brand merchandise to reward and/or thank one or
more audiences of interest; asked about types of
merchandise rewards they offer
..Offer merchandise awards/gifts and/or logo’d brand name
merchandise and/or premium symbolic awards/gifts; NOT
logo’d standard merchandise exclusively
..Knowledgeable about and responsible for purchasing
decisions as it relates to merchandise incentives – for one
or more audiences of interest• Completed full survey
• Results were weighted to reflect the true proportion of U.S. businesses $1MM-$10MM and $11MM-$50MM in annual revenue size.
• This study achieves a 95% confidence level with a 6.68% margin of error*An additional ten decision-makers proceeded partway through the survey. This data was used.

Summary (1)
4
Smaller U.S. companies (those with $1MM-$50MM in annual revenue) represent a considerable opportunity for sellers of name-brand merchandise for a variety of reasons:
As it relates to: Smaller businesses:
Use and purchase of merchandise rewards
• These companies use name brand merchandise reward/recognition for salespeople, employees, distributors, and customers.
• They provide top merchandise rewards for a variety of objectives (e.g., sales quotas, top performers, etc.) and they purchase many different types of merchandise.
Attitudes relative to merchandise rewards
• The buyers believe in the positive impact of merchandise incentives.• They recognize positive aspects of merchandise incentives in terms of participant benefits
Company health • Companies using merchandise tend to be in good health: most report growth.
The number of businesses this size
• The sheer number of smaller companies that exist. A majority of those using merchandise have budgets of $10,000 or more, and many report their budgets are increasing.
Interest in what salespeople can provide
• They value but are generally unaware what manufacturer’s representatives can bring to their programs.• Decision-makers are generally unfamiliar with all of the services and advantages a representative can provide,
however they indicate value for services a rep can provide that they don’t currently have. For example, below MSRP pricing is something they do not currently get, and they are keenly interested.
• For these small businesses, the most important merchandise provider decision criteria are those offered by manufacturer’s reps, e.g., customization, name-brand items, etc.

Summary (2): The Market Opportunity
5
Number of U.S. Firms
% of U.S. Firms that
Use Merch
Awards
Within Those Firms Using
Merch Awards, % of Firms That Offer Qualifying
Merch Categories*
Number of Firms That Use Merch Awards and
Offer Qualifying
Merch Categories*
Among Firms that
Offer Qualifying
Merch Categories:
Average Merch Budget
Total Segment Spend on Merchandise
$1 million to $10 million 1,244,164 51% 86% 545,690 $ 23,139 $ 12,611,773,785
$11 million to $50 million 155,985 59% 93% 85,589 $ 44,402 $ 3,772,188,286
The activities reported by these smaller companies look in many ways like their larger counterparts, with the exceptions that:
• Their budgets are smaller
• They utilize online and retail for merchandise more than they do representatives of manufacturers
In sum, smaller U.S. businesses represent over $16 billion in merchandise spend:
*Qualifying merchandise categories: merchandise awards/gifts and/or logo’d brand name merchandise and/or premium symbolic awards/gifts. Excludes firms using only promotional products.

Respondent Profiles (1): Revenue and Audiences
$1MM to $10MM
52%
$11MM-$50MM
48%
n=825
45%
26%
44%
22%
34%
44%
23%
37%
19%
27%
44%
23%
38%
19%
28%
Customers, Prospects, Clients:Appreciation
Customers: Loyalty
Employees
Distributors
Salespeople
Total (n=825) $1MM-$10MM (n=430) $11MM-$50MM (n=395)
S1: “Please select the option that best describes the annual revenue for your company?” (based to total market)S3: “To the best of your knowledge, does your company use name brand merchandise to reward/motivate/thank .:” (based to total market) (see questionnaire for exact language by audience)
Annual Revenue Reward: Audiences
6
By design, responding decision-makers were equally divided between the $1MM-$10MM and $11MM-$50MM annual revenue groups.
In terms of audiences they offer name brand merchandise rewards: employees are most included, followed by salespeople. Overall, the distribution is consistent with larger companies.

Respondent Profiles (2): Company Growth
0%
4%
24%
46%
26%
Shrunk significantly
Shrunk moderately
Stayed the same
Grown moderately
Grown significantly
D1. “Which of the following best describes your organization – in the past year?” (based to qualifying respondents: use qualifying merchandise categories and knowledgeable about/make merchandise purchasing decisions)
$1MM-$10MM(n=104)
$11MM-$50MM(n=101)
7
Smaller, merchandise-purchasing companies are in good health: most decision-makers report growth.
Total(n=205)
0%
3%
21%
47%
30%
Shrunk significantly
Shrunk moderately
Stayed the same
Grown moderately
Grown significantly
0%
4%
25%
46%
25%
Shrunk significantly
Shrunk moderately
Stayed the same
Grown moderately
Grown significantly
Merchandise: Salespeople
76%
40%
27%
50%
75%
39%
27%
50%
79%
44%
28%
49%
Merchandise awards/gifts Logo'd brand name merchandise Premium symbolic awards/gifts Logo'd standard merchandise
Total (n=252) $1MM-$10MM (n=117) $11MM-$50MM (n=135)
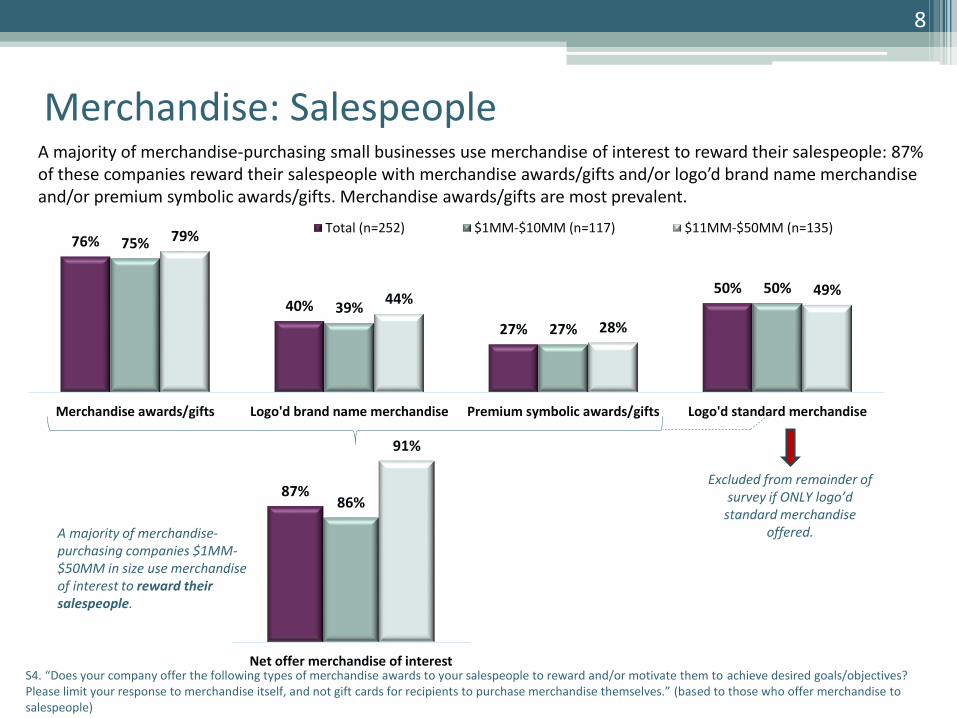
S4. “Does your company offer the following types of merchandise awards to your salespeople to reward and/or motivate them to achieve desired goals/objectives? Please limit your response to merchandise itself, and not gift cards for recipients to purchase merchandise themselves.” (based to those who offer merchandise to salespeople)
8
87%86%
91%
Net offer merchandise of interest
A majority of merchandise-purchasing companies $1MM-$50MM in size use merchandise of interest to reward their salespeople.
Excluded from remainder of survey if ONLY logo’d
standard merchandise offered.
A majority of merchandise-purchasing small businesses use merchandise of interest to reward their salespeople: 87% of these companies reward their salespeople with merchandise awards/gifts and/or logo’d brand name merchandise and/or premium symbolic awards/gifts. Merchandise awards/gifts are most prevalent.
Merchandise: Distributors
64%
40%
20%
51%
65%
38%
20%
50%59%
51%
20%
54%
Merchandise awards/gifts Logo'd brand name merchandise Premium symbolic awards/gifts Logo'd standard merchandise
Total (n=168) $1MM-$10MM (n=82) $11MM-$50MM (n=86)
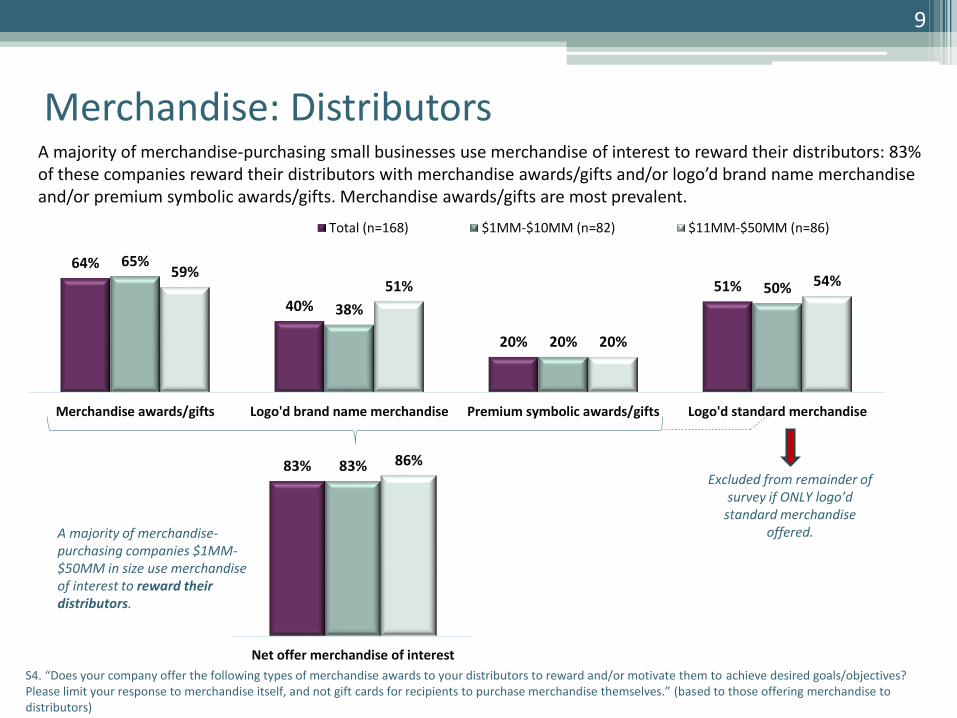
S4. “Does your company offer the following types of merchandise awards to your distributors to reward and/or motivate them to achieve desired goals/objectives? Please limit your response to merchandise itself, and not gift cards for recipients to purchase merchandise themselves.” (based to those offering merchandise to distributors)
9
83% 83% 86%
Net offer merchandise of interest
A majority of merchandise-purchasing companies $1MM-$50MM in size use merchandise of interest to reward their distributors.
Excluded from remainder of survey if ONLY logo’d
standard merchandise offered.
A majority of merchandise-purchasing small businesses use merchandise of interest to reward their distributors: 83% of these companies reward their distributors with merchandise awards/gifts and/or logo’d brand name merchandise and/or premium symbolic awards/gifts. Merchandise awards/gifts are most prevalent.

Merchandise: Employees
67%
42%
22%
47%
66%
42%
22%
47%
73%
44%
25%
50%
Merchandise awards/gifts Logo'd brand name merchandise Premium symbolic awards/gifts Logo'd standard merchandise
Total (n=334) $1MM-$10MM (n=161) $11MM-$50MM (n=173)
S4. “Does your company offer the following types of merchandise awards to your employees to reward and/or motivate them to achieve desired goals/objectives? Please limit your response to merchandise itself, and not gift cards for recipients to purchase merchandise themselves.” (based to those offering merchandise to their employees)
10
89% 88% 92%
Net offer merchandise of interest
A majority of merchandise-purchasing companies $1MM-$50MM in size use merchandise of interest to reward their employees.
Excluded from remainder of survey if ONLY logo’d
standard merchandise offered.
A majority of merchandise-purchasing small businesses use merchandise of interest to reward their employees: 89% of these companies reward their employees with merchandise awards/gifts and/or logo’d brand name merchandise and/or premium symbolic awards/gifts. Merchandise awards/gifts are most prevalent.

Merchandise: Customers
58%
30%
16%
47%
59%
28%
16%
46%55%
43%
16%
56%
Merchandise awards/gifts Logo'd brand name merchandise Premium symbolic awards/gifts Logo'd standard merchandise
Total (n=389) $1MM-$10MM (n=117) $11MM-$50MM (n=135)
S4. “Does your company offer the following types of merchandise awards to your customers to reward and/or motivate them to achieve desired goals/objectives? Please limit your response to merchandise itself, and not gift cards for recipients to purchase merchandise themselves.” (based to those offering merchandise to customers)
11
80% 80% 80%
Net offer merchandise of interest
A majority of merchandise-purchasing companies $1MM-$50MM in size use merchandise of interest to reward/thank their customers.
Excluded from remainder of survey if ONLY logo’d
standard merchandise offered.
A majority of merchandise-purchasing small businesses use merchandise of interest to reward their customers: 80% of these companies reward their customers with merchandise awards/gifts and/or logo’d brand name merchandise and/or premium symbolic awards/gifts. Merchandise awards/gifts are most prevalent.

Points-Based Merchandise Rewards
12
$11MM-$50MM (n=107)
$1MM to $10MM (n=108)
Total (n=215)
Q2. “Does your company offer points-based merchandise rewards – where participants redeem accumulated points for merchandise awards of their choice, or earn different awards based on level of achievement?” (based to those offering qualifying merchandise to one or more audiences)
48%
53%
49%
Half of small businesses that offer qualifying merchandise utilize points-based merchandise reward programs.

Merchandise Budget
1%
13%
15%
16%
11%
8%
17%
13%
5%
1%
0%
1%
2%
4%
5%
7%
13%
14%
27%
11%
11%
4%
2%
1%
2%
5%
6%
8%
13%
13%
26%
11%
10%
4%
2%
1%
$200,000+
$100,000 to $199,999
$50,000 to $99,999
$30,000 to $49,999
$15,000 to 29,999
$10,000 to $14,999
$5,000 to $9,999
$3,000 to $4,999
$1,000 to $2,999
$500 to $999
$1 to $499
NoneTotal (n=215)
$1MM-$10MM(n=108)
(n=107)
Q1. “Please select the option that best describes your company’s spend during the past 12 months for merchandise to incent, recognize, or thank (audiences they include).”Q1a. “Is this more, less, or about the same as your company’s (audiences they include) merchandise spend from the previous 12 months?”(both questions based to businesses offering qualifying merchandise)
13
47%
30%
32%
47%
61%
59%
5%
7%
6%
2%
2%
1%
$11MM-$50MM(n=107)
$1MM-$10MM(n=108)
Total (n=215)
More About the same Less I don't know
The merchandise budgets of small businesses vary considerably. Nearly half (47%) businesses that offer qualifying merchandise have budgets of $10,000 or more.
The vast majority of these businesses report their budgets have grown or stayed steady in the past year. Nearly half (47%) of the $11MM-$50MM companies report their merchandise budgets have increased.

Merchandise Award Types: Total
17% 14% 11% 9% 8% 7% 5% 5% 5% 5% 3% 2%7%
Q3. “Thinking about the merchandise your company provides to (audiences included), approximately what percentage of each of the following types are included as merchandise awards at your company? Please exclude promotional items (e.g., T-shirts, mugs, frisbees) and gift cards.” (based to those offering qualifying merchandise)
14
76%70%
58% 57% 53%44% 44%
36%42% 44%
31% 27%
5% 2% 5%
Merchandise Allocation across Categories (e.g., “on average, 17% of total merchandise purchased is apparel)
n=204
A majority of the target audience include apparel, food/beverage, electronics, writing instruments, and sporting goods in their merchandise award mix. Across all of the award types, apparel is most often offered.
Percent of Companies Using Each Award Type

Merchandise Award Types
16% 15% 11% 9% 8% 7% 5% 5% 5% 4% 3% 2%7%
20%9% 11% 10% 7% 6% 5% 5% 4% 8% 5% 3% 6%
$1MM-$10MM $11MM-$50MM
A higher proportion of the smaller company group’s spend is for food.
n=104 n=101
Q3. “Thinking about the merchandise your company provides to (audiences included), approximately what percentage of each of the following types are included as merchandise awards at your company? Please exclude promotional items (e.g., T-shirts, mugs, frisbees) and gift cards.” (based to those offering qualifying merchandise)
15
A higher proportion of the larger company group’s spend is for watches/clocks.
75% 71%57% 57% 53%
44% 44%35%
42% 42%29% 26%
4% 2% 6%
80%66% 62%
69%56%
42% 44% 43% 45%57%
42%35%
5% 2%8%
Merchandise Allocation across Categories
The larger company group uses watches/ clocks more than the smaller company group.
The $1MM-$10MM and $11MM-$50MM small businesses differ in just a few ways in terms of the merchandise award types they provide. There are more similarities than differences between the two groups, however.
Percent of Companies Using Each Award Type

Benefits to Recipients: Total
Q4. “Thinking about the merchandise your company includes as part of its reward and recognition, how important are each of the following as benefits to your participants/recipients?” (based to those offering qualifying merchandise)
16
56% 32% 12%
Item Practicality
Item Memorability
56%
58%
31%
39%
13%
3%
$1MM-$10MM
$11MM-$50MM
Very Important Somewhat Important Not Very/Not At All Important
Wow Factor
Brand Name Recognition
Customized to Commemorate Achievement
Aspirational Items
Item Exclusivity
Items Pax Would Never Purchase for Themselves
51% 39% 10%
44% 45% 10%
45% 44% 11%
39% 40% 21%
36% 42% 22%
38% 43% 19%
43% 43% 14%
n=205
Across the target audience, buyers prefer merchandise items that are practical, high quality, have a “wow” factor, and name brand.

Comparing the two size groups, results are similar with one exception. The $11MM-$50MM group is more concerned with item practicality than the smaller group.
56%
58%
31%
39%
13%
3%
$1MM-$10MM
$11MM-$50MM
Very Important Somewhat Important Not Very/Not At All Important
Benefits to Recipients
Q4. “Thinking about the merchandise your company includes as part of its reward and recognition, how important are each of the following as benefits to your participants/recipients?” (based to those offering qualifying merchandise)
17
56%
58%
31%
39%
13%
3%
$1MM-$10MM
$11MM-$50MM
50%
54%
39%
41%
11%
5%
$1MM-$10MM
$11MM-$50MM
42%
50%
44%
39%
14%
11%
$1MM-$10MM
$11MM-$50MM
45%
48%
44%
44%
11%
8%
$1MM-$10MM
$11MM-$50MM
43%
52%
46%
42%
11%
6%
$1MM-$10MM
$11MM-$50MM
38%
45%
40%
42%
22%
13%
$1MM-$10MM
$11MM-$50MM
37%
45%
43%
43%
20%
12%
$1MM-$10MM
$11MM-$50MM
35%
41%
43%
39%
22%
20%
$1MM-$10MM
$11MM-$50MM
Significant difference: larger firms more concerned with practicality
$1MM - $10MM (n=104) $11MM - $50MM (n=101)
Item Practicality
Item Memorability
Wow Factor
Brand Name Recognition
Customized to Commemorate Achievement
Aspirational Items
Item Exclusivity
Items Pax Would Never Purchase for Themselves

Program Types for Merchandise Rewards
Q5. “Does your company use merchandise to reward or thank in the following ways..” (see survey for full descriptions of each type) (based to those offering qualifying merchandise)
18
53%
42%
59%
37%
55%
49%
60%
14%
52%
42%
58%
36%
55%
49%
61%
14%
61%
41%
65%
44%
53% 52% 53%
13%
Sales quota Other types of goal-based earning
Top performer Discretionaryrecognition
Team recognition Service anniversary/milestone achievement
Customer gifts Gifts for other people,such as job candidates
or speakers
Total (n=205) $1MM-$10MM (n=104) $11MM-$50MM (n=101)
A majority of the target audience use merchandise to reward or thank for:
▫ Sales quotas
▫ Top performers
▫ Team recognition
▫ Customer gifts

Merchandise Reward Distribution
2%
3%
77%
50%
2%
1%
75%
44%
2%
1%
75%
45%
I don't know
Other
Presented in person, e.g.at company
meetings/functions oron-the-spot
Shipped to individuals'homes
Q8. “How are your merchandise rewards/gifts distributed?”Q8a. “How do you prefer your merchandise rewards/gifts are distributed?” (both questions based to those offering qualifying merchandise)
19
11%
2%
76%
32%
10%
1%
69%
38%
10%
1%
70%
37%
No preference
Other
Presented in person, e.g.at company
meetings/functions oron-the-spot
Shipped to individuals'homes
Total (n=205)
$1MM-$10MM(n=104)
$11MM-$50MM(n=101)
In-person presentation of merchandise rewards are most preferred and most done: for the majority of companies, merchandise is presented in person to recipients and most decision-makers prefer this distribution.
Many companies both present in person and ship items to individuals’ homes.
Merchandise Reward Distribution Preference for Merchandise Reward Distribution

Merchandise Reward Sourcing
20
76%
61%
30%
3% 2%
75%
61%
28%
3% 2%
81%
58%
41%
1% 1%
Online Retail Sales representative(s) Other I don't know
Total (n=205) $1MM-$10MM (n=104) $11MM-$50MM (n=101)
Merchandise-purchasing small businesses source items online or from retailers more often than they do via sales representatives. Results show they use multiple channels to source their merchandise.
Among those who purchase merchandise from sales representative(s), it is equally from those selling promotional products and those focused on brand name merchandise. Many firms use both types of representatives.
76%70%
76%72%
78%
61%
Person(s) sellingpromotional products
Person(s) selling namebrand merchandise
Q6. “How does your company purchase your brand name merchandise rewards?” (based to those purchasing qualifying merchandise)Q7. “Please tell us about the sales representative(s) from whom you purchase brand name merchandise rewards. Are they:” (based to respondents who purchase merchandise from sales representative(s).

Merchandise Reward Sourcing (2)
21
Merchandise purchasers who work with sales representatives are likely to also source items online or from retail. The opposite (that those who source online or from retail also work with reps) is less likely.
• For companies that source items online, 31% of them also source from sales representatives.
• For companies that source items from sales representatives, 71% of them also source from online.
• For companies that source items from retail, 31% of them also source from sales representatives.
• For companies that source items from sales representatives, 54% of them also source from retail.
Purchasers who work with sellers of brand name merchandise are likely to also work with sellers of promotional products.
• For companies that work with persons selling promotional products, 57% of them also work with persons selling name brand merchandise.
• For companies that work with persons selling name brand merchandise, 67% of them also work with persons selling promotional products.
Q6. “How does your company purchase your brand name merchandise rewards?”Q7. “Please tell us about the sales representative(s) from whom you purchase brand name merchandise rewards. Are they:”

Why Companies Don’t Work with Sales Reps
22
6%
12%
12%
13%
Other
No one has ever called on us
Concerns about selection
Unaware of what reps offer
What we do now is easy
We don't see the need
Don't like something about reps
Costs/we don't want to paycommissions
We like/want to handle thisourselves
11%
Q11: “Why does your company not work with a sales representative?” (base 113)Q12: “What, if anything, would make you more likely to work with a sales representative?” (base 113: both questions based to those offering qualifying merchandise who do not work with sales reps)
48%
53%
49%
Among those small businesses that don’t work with sales representatives, reasons for not doing so are varied. Most interesting are factors that would increase likelihood of working with reps: for 20%, it is simply knowing more about what sales representatives can bring to their programs.
Don’t currently work with sales representatives: reasons
6%
3%
3%
20%
What would increase likelihood of working with sales reps
5%
10%
13%
4%
8%
8%
20%
24%
Don't know
Other
Nothing
Selection: better/larger
Rewards/incentives
Improving something aboutperceptions of reps
Knowing more about what salesreps offer
Demonstrated costbenefits/discounts

Sales Representatives
3%
22%
48%
61%
3%
28%
48%
61%
4%
22%
49%
60%
I don't know
We have never beencalled on..
Person(s) selling namebrand merchandise
Person(s) sellingpromotional products
Q9. “Which of these, if any, have ever approached you to describe their services relative to providing merchandise?” (base: companies offering qualifying merchandise)Q10. “Are you aware that sales representatives work with companies like yours to provide the following?” (base: companies offering qualifying merchandise)
23
10%
32%
44%
59%
69%
10%
33%
44%
59%
69%
6%
25%
39%
53%
71%
Before this survey, I was not aware ofany of this
I am aware that sales representativescan help me create effective reward
programs
I am aware that sales reps offerexpert assistance relative to selecting
merchandise to appeal to peoplerelative to incentive and rewards
I am aware that sales reps are able toprovide companies like mine factory-
direct pricing on merchandise
I am aware sales reps work withcompanies like mine to providemerchandise for incentives and
rewards
$1MM-$10MM
$11MM-$50MM
Total
Respondents more frequently report being approached by persons selling promotional products than by those selling brand name merchandise. A notable proportion (22%) have never been approached by either.
While decision-makers are generally aware that reps provide merchandise to companies, they are less familiar with the range of benefits reps offer.
Considerable awareness gap for an important value driver (see following page)

Important Merchandise Provider Selection Factors
11%
26%
16%
27%
20%
28%
25%
34%
41%
35%
40%
10%
14%
17%
20%
27%
27%
30%
31%
39%
42%
42%
Offers consultation/expert advise re creating, planning,executing and measuring performance of merch reward…
Fulfillment capabilities: merch is delivered to recipients
Offers consultation concerning the best merch mix to include
Latest models of merchandise
Marketing/product descriptions are available for pax to see
Factory-direct/below MSRP pricing
Easy to work with merch supplier(s)
Offers online purchasing
Variety of categories of merchandise to choose from
Offers well-known name brands
Customization/personalization of merchandise items
$1MM-$10MM $11MM-$50MM
Q13-Q15. Importance of factors in selecting a merchandise provider. Qsort design questions (based to companies offering qualifying merchandise)
24
Presented: Percentage Each Factor is Among
the Top 3 in Importance
Good news for manufacturer’s representatives: top merchandise provider selection factors are those they can sell to.

$1 million to $10 million
25
Customization/personalization
Easy to work with
Below MSRP pricing
Fulfillment capabilities
Latest merchandise
Marketing/product descriptions
Consultation on merchandise mix
Consultation/expert advice on design
Offers online purchasing
Offers well-known name brands
Variety of merchandise categories
20%
25%
30%
35%
40%
45%
50%
55%
60%
65%
70%
10% 20% 30% 40% 50% 60% 70%
% O
f th
ose
ran
kin
g in
to
p 5
wh
o D
O N
OT
hav
e th
is b
enef
it n
ow
Percent Ranking in Top 5 Importance
Important Merchandise Provider Selection Factors
Q13-Q15. Importance of factors in selecting a merchandise provider. Qsort design questions (base: companies offering qualifying merchandise)
More ImportantDon’t Currently Have
Less ImportantDon’t Currently Have
More ImportantCurrently Have
Less ImportantCurrently Have
Target purchasers within the smallest group of businesses consider important (but don’t get) latest merchandise and below MSRP pricing.

26
Customization/personalization
Easy to work with
Below MSRP pricing
Fulfillment capabilities
Latest merchandise
Marketing/product descriptions
Consultation on merchandise mix
Consultation/expert advice on design
Offers online purchasing
Offers well-known name brands
Variety of merchandise categories
20%
25%
30%
35%
40%
45%
50%
55%
60%
65%
70%
10% 20% 30% 40% 50% 60% 70%
% O
f th
ose
ran
kin
g in
to
p 5
wh
o D
O N
OT
hav
e th
is b
enef
it n
ow
Percent Ranking in Top 5 Importance
Important Merchandise Provider Selection Factors
Q13-Q15. Importance of factors in selecting a merchandise provider. Qsort design questions (based to companies offering qualifying merchandise)
$11 million to $50 million
More ImportantDon’t Currently Have
Less ImportantDon’t Currently Have
More ImportantCurrently Have
Less ImportantCurrently Have
Target purchasers within the $11MM to $50 MM companies consider important (but don’t get) MSRP pricing.

27
Q. “Please indicate your level of agreement with the following statements, where “1” means “strongly disagree” and “5” means “strongly agree.” (based to companies offering qualifying merchandise)
61%
64%
70%
76%
71%
76%
80%
77%
82%
60%
63%
69%
76%
70%
76%
80%
77%
82%
70%
73%
79%
76%
83%
80%
75%
80%
82%
Merchandise rewards are more memorable than cash
In terms of choosing merchandise to offer, we are more concernedwith participant enthusiasm for the merchandise than with getting a…
Our merchandise incentives work: they influence behavior
We are satisfied with the way our merchandise incentives work
The merchandise rewards we provide reflect who we are as a company
We provide merchandise incentives because we want to provideadditional, "different" benefits to participants besides compensation
Merchandise as reward is an effective motivator
The merchandise we include in our incentives is fresh and interestingto participants
Our merchandise incentives work: they influence morale
$1MM-$10MM (n=101) $11MM-$50MM (n=104) Total (n=205)
Attitudes Concerning Merchandise IncentivesThe target audience believes in merchandise reward incentives.

Appendix
28
For comparison purposes, the pages that follow include similar measures for U.S. companies $1 million+ in annual revenue from the Incentive Federation Program Design Study, 2014. The study included U.S. firms as follows:

Types of Merchandise Used in Sales Programs: $1MM+ Annual Revenue
5%
19%
21%
22%
24%
34%
35%
37%
39%
74%
76%
80%
Other
Home décor
Luggage
Watches/clocks
Sporting/recreational goods
Housewares
Writing instruments
Jewelry/accessories
Home improvement items/tools
Apparel
Electronic items
Food and beverages
Merchandise Prevalence in Sales Programs
29
Three merchandise categories dominate in terms of prevalence in Sales programs: food and beverages, electronics, and apparel. The remaining categories of merchandise are not negligible – the least-frequent categories are found in one out of five programs.
n=39

Types of Merchandise Used in Channel Programs: $1MM+ Annual Revenue
0%
32%
32%
32%
32%
0%
63%
31%
32%
33%
68%
100%
Other
Home décor
Luggage
Watches/clocks
Sporting/recreational goods
Housewares
Writing instruments
Jewelry/accessories
Home improvement items/tools
Apparel
Electronic items
Food and beverages
Merchandise Prevalence in Channel Programs
30
Food and beverages are ubiquitous within Channel programs, while electronics and writing instruments also make a strong showing. Housewares are absent within Channel programs.
n=15

Types of Merchandise Used in Employee Programs: $1MM+ Annual Revenue
7%
22%
39%
33%
46%
6%
7%
11%
9%
59%
76%
63%
Other
Home décor
Luggage
Watches/clocks
Sporting/recreational goods
Housewares
Writing instruments
Jewelry/accessories
Home improvement items/tools
Apparel
Electronic items
Food and beverages
Merchandise Prevalence in Employee Programs
31
Electronics take the top spot in Employee programs, followed by food and beverages and apparel. Sporting goods, luggage, watches and clocks, and home décor are other categories favored for Employee programs.
n=62

Sourcing for Merchandise and Gift Cards: $1MM+ Annual Revenue
57%
41%
23%
8%
3%
We get rewards from local retailer locations
We get our rewards from a company that specializes in sellingrewards/merchandise or an incentive/promotional agency.
We work with the corporate offices of a retailer to purchaserewards/merchandise
Other
I don't know
Merchandise And Gift Card Sourcing
32
Among companies using merchandise or gift cards for their programs, a majority source those rewards from local retailers. The next most-prevalent source is incentives-industry companies, followed by the corporate B2B sales team for retailers or merchandisers.
n=164

Sourcing of Merchandise and Gift Cards by Firm Size
56%64%
49%
35%38%
64%
47%
65%
21%
36%43%
56%
9%0%
6%0%3% 3% 4% 4%
$1 TO 9.9 $10 TO 99 $100 TO 999 $1000 +
Merchandise & Gift Card SourcingBy Company Revenue
Local retailer locations
A company that specializes in selling rewards/merchandise (e.g., Amazon) or an incentive/promotional agency.
Corporate offices of a retailer to purchase rewards/merchandise
Other
I don't know
33
The reliance on local retailers for merchandise and gift cards is highest among smaller firms, dropping dramatically for companies over $1 billion in revenues. The largest firms use suppliers in the incentives industry or go directly to corporate B2B retail/merchandise sales teams.
n=164 (in millions)

Rewards Sourcing by Total (Cross-Audience) Spend: $1MM+ Annual Revenue
34
67%
41%
59%
13%
51%
73%
15%
25%
33%
13%8%
0%
<=$50 $50-99 $100+
Merchandise & Gift Card SourcingBy Total Spend
Local retailer locations
A company that specializes in selling rewards/merchandise (e.g., Amazon) or an incentive/promotional agency.
Corporate offices of a retailer to purchase rewards/merchandise (e.g., Coach or TUMI corporate - not the local store -to buy merchandise)
Other
(in thousands)n=164
Firms that spend more across multiple audiences (e.g. Sales and Employees) are more likely to use an incentives-specific supplier for their merchandise and gift cards.

How Merchandise and Gift Cards Are Sourced: $1MM+ Annual Revenue
65%
50%
30% 30%
1%
We order through anaccount manager or
customer servicerepresentative
We order online We order merchandiserewards in bulk
Rewards are fulfilled asparticipants earn and
order them
I don't know
Merchandise and Gift Card Ordering Mechanisms
35
Companies using incentive industry and corporate B2B suppliers have many options available to them in terms of how they source their awards. A majority are working through an account manager or customer service representative, and half are ordering online. Approximately one-third bulk-order rewards and a third opt for fulfillment upon participant order.
n=124

How Merchandise and Gift Cards Are Sourced by Firm Size
72%
35%44%
52%44%
77%
47% 50%
28%
42%33% 36%
28%
38%33%
43%
0 4% 6% 2%
$1 TO 9.9 $10 TO 99 $100 TO 999 $1000 +
Merchandise & Gift Card Acquisit ion By Company Revenue
We order through an account manager or customer service representative
We order online
We order merchandise rewards in bulk
Rewards are fulfilled as participants earn and order them
I don't know
36
n=124
How companies order from incentive industry and corporate B2B suppliers differs by size of firm. The smallest firms are most likely to be working through a service representative, while mid-sized companies ($10 to 99 million) most prevalently order online.
(in millions)

Rewards Ordering by Total (Cross-Audience) Spend
37
57%61%
73%
46%50% 52%
36%
15%
42%
7%
27%
42%
<=$50 $50-99 $100+
Merchandise And Gift Card Acquisit ionBy Total Spend
We order through an account manager or customer service representative
We order online
We order merchandise rewards in bulk
Rewards are fulfilled as participants earn and order them
(in thousands)n=124
Firms with higher cross-audience spend are more likely to engage an account manager or CSR in their ordering process. Additionally, higher-spending firms are more likely to fulfill rewards as participants earn and order them.