improving the sustainability of the brazilian sugar cane the sustainability of the brazilian sugar...
TRANSCRIPT

Improving the sustainability of the Brazilian sugar cane industry
-Can the Dutch play a role?

Improving the sustainability of the Brazilian sugar cane industry | April 27, 2012
Page 2 of 58

Improving the sustainability of the Brazilian sugar cane industry | April 27, 2012
Page 3 of 58
Improving the sustainability of the Brazilian sugar cane industry
-Can the Dutch play a role?
Colophon
Date April 27, 2012 Status Final Report
This study was carried out in the framework of the Netherlands Programmes Sustainable Biomass by Name organisation Ecofys Netherlands B.V. Contact person Arno van den Bos, Ismail Yildiz, Carlo Hamelinck Although this report has been put together with the greatest possible care, NL Agency does
not accept liability for possible errors.


Improving the sustainability of the Brazilian sugar cane industry | April 27, 2012
Page 5 of 58
Contact
Netherlands Programmes Sustainable Biomass
Ir. Kees W. Kwant and Drs. Sietske Boschma NL Agency NL Energy and Climate Change Croeselaan 15, 3521 BJ Utrecht P.O. Box 8242, 3503 RE Utrecht The Netherlands Email: [email protected] Phone: +31 - 88 - 602 2458 www.agentschapNL.nl/biomass Ecofys
Ecofys Netherlands B.V. Bio Energy Kanaalweg 15-G 3526 KL Utrecht The Netherlands E-mail: [email protected] Phone: +31 30 622 3496 www.ecofys.com

Improving the sustainability of the Brazilian sugar cane industry | April 27, 2012
Page 6 of 58
Index
1 INTRODUCTION ..................................................................... 10
1.1 BRAZIL IS A LEADING PLAYER IN SUGAR CANE AND ETHANOL ................... 10 1.2 RESIDUES IN THE CANE SECTOR FOR A BIO-BASED ECONOMY .................. 10 1.3 ROLE OF DUTCH EXPERTISE ......................................................... 11 1.4 THE ASSIGNMENT AND APPROACH .................................................. 12
2 CURRENT STATUS AND PERSPECTIVES OF SUGARCANE INDUSTRY IN BRAZIL ................................................................. 13
2.1 DISTRIBUTION AND CHARACTERISATION OF BRAZILIAN SUGAR MILLS ........ 13 2.2 BASIC SUGAR TO ETHANOL PROCESSES ........................................... 14 2.3 BIOELECTRICITY ...................................................................... 15 2.4 AVAILABILITY OF STRAW. ........................................................... 18 2.5 CELLULOSIC BIOETHANOL FROM BAGASSE/STRAW ............................... 18 2.6 PELLETISATION OF BAGASSE ........................................................ 20
3 CURRENT STATUS OF DUTCH CHP SECTOR ............................. 21
3.1 NUMBER OF CHP UNITS ............................................................. 21 3.2 INSTALLED CAPACITY ................................................................ 22 3.3 CHP SECTORS IN NETHERLANDS ................................................... 23 3.4 RELEVANT CHP FOR SUGAR CANE MILLS .......................................... 24
4 RESULTS: POTENTIAL FOR ADDITIONAL POWER, ETHANOL AND PELLETS ...................................................................................... 26
4.1 RESULTS SUMMARY .................................................................. 26 4.2 RESULTS EXPLANATION .............................................................. 27 4.3 SCENARIOS FOR FURTHER DEVELOPMENT ......................................... 33 4.4 OTHER ESTIMATES OF POTENTIALS ................................................ 36 4.5 GHG IMPROVEMENTS ................................................................ 38
5 IMPLICATIONS AND RECOMMENDATIONS ............................. 40
5.1 THE POTENTIALS IN THE BRAZILIAN CONTEXT .................................... 40 5.2 OPPORTUNITIES FOR DUTCH INITIATIVES ......................................... 42 5.3 ROADMAP FOR THE NETHERLANDS ................................................. 44
6 REFERENCES .......................................................................... 45
7 APPENDIX A - NL CHP SECTOR .............................................. 48
8 APPENDIX B – SÃO PAULO MILLS .......................................... 50

Improving the sustainability of the Brazilian sugar cane industry | April 27, 2012
Page 7 of 58
Executive summary
Introduction Brazil is the world's largest sugarcane producer with 720 million tonnes crushed in 2010. The industry currently only uses part of its bagasse to be electrically self sufficient, but technical improvements in harvesting and processing could potentially free up much larger quantities of bagasse and straw (tops and leaves). These residues could be turned into valuable products like excess electricity, bagasse pellets and extra ethanol, thus improving the sustainability of the ethanol, and the industry as a whole. This study sets out to explore what role Dutch stakeholders can play in these technical improvements, as well as in the entire supply chain to bring some of the available biomass to the Netherlands. Technical potential scenarios Availability of biomass can first be increased through the collection of straw. By replacing manual harvesting (which traditionally includes burning of the fields) with mechanical harvesting, about 97 Mton of straw biomass could be collected. At the mill, two major efficiency improvements are often possible: (1) efficiency improvements through improved steam cycles (improved CHP efficiencies) and (2) efficiency improvements in the milling/distillery process which results in lower internal demands. As the mills have been constructed over the past 40 years, technology levels have remained low, due to the virtually free availability of feedstocks (bagasse from the crushed cane) and lack of stimulation from the government for the production of bioelectricity. Currently, about a quarter of the mills are connected to the grid; these mills convert bagasse with higher efficiencies than average, but improvements are still possible. We assumed that CHP systems used in other mills still have an average electrical efficiency of 8.4% which could be improved to 15% which would mean that more electricity can be produced from the same cane harvest. Calculations show that this could lead to an excess electricity generation of over 50kWh per tonne of cane, which corresponds to more than 8 GW based on the 2008/2009 harvest of 648 Mtonne. When introducing these improvements progressively, an indication can be given of the quantities of new products that can be produced, as shown in the table below. As shown in these scenarios, the potential for producing pellets from residues in the Brazilian cane industry is large (210 PJ + 203 PJ in 2020 from straw and process optimisation respectively) compared to the total primary energy demand in the Netherlands (3 250 PJ in 2011). As the Dutch government is interested in developing a biobased economy, it is valuable to explore this potential further.

Improving the sustainability of the Brazilian sugar cane industry | April 27, 2012
Page 8 of 58
Table 1: Potential availability of pellets, electricity and cellulosic ethanol per improvement
scenario over time (for details and assumptions see Chapter 4)
Year 2010 2015 2020
Collect straw for electricity production (GW)4 7,0 10,1 20,2
Collect straw for pellets (PJ pellets) 0 105 210
Collect straw for extra ethanol (1000 m3) 0 995 4.982
Improved Steam Cycle for surplus electricity
(GW)5
11,5 16,6 33,2
Improved Steam Cycle for pellets (PJ pellets)6 0 35 87
Improved Steam Cycle for extra ethanol (1000
m3)7
0 336 1.682
Process optimisation for surplus electricity
(GW)5
20,7 29,8 59,7
Process optimisation for pellets (PJ pellets) 0 81 203
Process optimisation for extra ethanol (1000
m3)
0 784 3.928
Opportunities along the supply chain for the Netherlands Biomass boilers with steam cycles that resemble bagasse boilers in Brazilian sugar mills are very rare in the Netherlands. Moreover, the existing Dutch bio-CHP’s are relatively small-scale and optimized for delivering heat to local heating network. In this context, the possibilities for collaboration with Brazil are limited. However, the Netherland is still one of the leading countries in technical innovations on the improvement of the overall efficiency. • Agronomic improvements in the sugarcane and recycling of nutrients • Densification of the biomass through pre-treatment technologies like torrefaction and pelletisation
• Logistics and infrastructure development • Advising on sustainability issues and regulations that could hamper access to (European) markets
• Advise on ILUC mitigation projects • Assist and invest in technology research and development, especially in the field of second generation ethanol

Improving the sustainability of the Brazilian sugar cane industry | April 27, 2012
Page 9 of 58
Roadmap for the Netherlands Dutch stakeholders could take an active role in de the development of a new economy based on Brazilian cane residues. The Dutch government could proactively stimulate this development: • By selecting a promising supply chain with relatively low entry barriers, and promoting a complete business case, with the eventual aim that this chain will be demonstrated in practice in the short run;
• Bring Dutch companies into contact with suitable Brazilian counterparts to establish joint ventures, and stimulate them to develop any of the options mentioned above;
• Invite Dutch financial stakeholders to clarify what role they could play and what requirements they would have in the development of technological infrastructure required to facilitate the large-scale export from Brazil and import into the Netherlands;
• Keep an inventory of direct or indirect trade barriers that would hinder the import of Brazilian cane residues, and (assist in) removing such barriers.

Improving the sustainability of the Brazilian sugar cane industry | April 27, 2012
Page 10 of 58
1 Introduction
1.1 Brazil is a leading player in sugar cane and ethanol Brazil is by far the world’s largest sugarcane producer with around 720 million tonne cane crushed in the 2010/2011 harvest season, which is about 43% of the global production. Brazil is also the largest exporter of ethanol, and it is widely expected that Brazil has a large potential for growth in the next decades. At the sugar mills, residues from crushing the sugarcane called bagasse, have been used to fuel the boilers that supply the thermal and electrical power needed for the internal processes of the sugar mills and associated distilleries. In many distilleries, excess electricity production is increasingly sold to the grid. However, a significant part of the bagasse is still left unused and it is widely recognised that the efficiency of the boilers and distillery processes can be significantly increased, so that larger amounts of bagasse can be made available. Most of the global sugarcane cultivation is directed towards sugar production. In Brazil, most of the cane processors are able to switch between sugar and ethanol production, which allows them to respond quickly to changing market prices of sugar and ethanol. Over the last decades the ethanol share has increased and nowadays the share of sugar/ethanol varies between 45% and 55%.
1.2 Residues in the cane sector for a bio-based economy Besides producing sugar and ethanol, the sugar cane industry produces many by-products and residues, as shown in Figure 1. This means that sugar cane can play a larger role in the so-called bio-based economy, in which biomass provides the basis for not only the production of fuels and sugar, but also for electricity, feed, fibre, chemical and pharmaceutical products. By optimising the use of residues, the environmental burden of the production of cane can be shared by the newly created products, and thereby improve the sustainability of sugar cane ethanol. The most prominent residue from sugar cane processing is bagasse. Bagasse is readily available at the mill after crushing the cane, and used to produce the heat and power necessary by the mill for the sugar cane processing allowing the mill to be self sufficient in terms of energy use. However, since the amount of bagasse available is very large, thermal systems have been designed to be very inefficient, so as to reduce the leftover bagasse, which has otherwise to be burnt separately. While some mills optimize the use of bagasse for surplus electricity production, in most mills technical optimisation could generate a (larger) bagasse surplus that could be used for other applications like generating additional electricity, production of pellets, or additional ethanol production through second generation technologies. In Europe there is a large interest to use biomass power production in order to reduce CO2 emissions. If converted into regular or torrefied pellets, or pyrolysis oil, sugarcane residues like bagasse could provide excellent material for burning directly or co-firing in power plants.

Improving the sustainability of the Brazilian sugar cane industry | April 27, 2012
Page 11 of 58
The availability of residues in the current and future situation depends on the bagasse usage at the mills. Efficient cogeneration (CHP) could make a large portion of bagasse available for export. At the same time, the cane industry may utilize part of this surplus bagasse to produce additional ethanol, or surplus electricity for a local grid. Figure 1 By-products of cane sugar industry (adapted from Hein 2007)
Cane mill
Filter cake
Straw
Sugar
Molasses
Bagasse
Sugar cane
• Fuel• Fibrous products• Animal feed
• Fertilizer• Compost• Animal feed
• Fuel • Fiber• Fermentable substrates
• Functional foods• Dextran• Sweeteners
• Animal feed• Fermentation products• Fertilizer
Ethanol• Fuel• Chemical• Solvent
If co-products of biofuels were to be used in a more efficient way, the performance of the ethanol product could improve, greenhouse gas emission reductions could increase, and direct land use would decrease, thus also reducing the drivers behind indirect land use changes
1.3 Role of Dutch expertise Brazil has shown interest in Dutch expertise, for example in the field of technology and logistics, as was expressed in an MOU between the Netherlands and the Brazilian state of Goias in June 20111. Also, the Netherlands is one of the European pioneers on technological development of torrefaction and pyrolysis technologies. For Brazilian ethanol, the Dutch ports are the most important gate to Europe, which creates a joint interest in increasing material trade between Brazil and the Netherlands. Finally, Dutch academia, consultants and certifiers play an important and constructive role on biofuels sustainability and indirect effects. On the other hand, many Dutch innovators in the biobased economy signal the same three key challenges: need for sufficient feedstock volume, for low feedstock market prices and for high sustainability performance. Brazilian bagasse, if brought to the Dutch market may enhance the development of the biobased economy in the Netherlands.
1 Memorandum of understanding and cooperation between the Rotterdam Climate Initiative, the government of the
state of Goias, ACIEG, Novenergias do brasil ltda., and Agrennewenergy b.v. on biomass and bioenergy, June 2011.

Improving the sustainability of the Brazilian sugar cane industry | April 27, 2012
Page 12 of 58
1.4 The assignment and approach This study sets out to explore what role Dutch stakeholders can play in improving the sustainability of the Brazilian sugarcane industry. To answer this overarching question, the report is divided in chapters that answer the following sub-questions: • What is the status of the Brazilian sugar cane industry? • What improvements are possible that could release extra biomass? • How could these extra residues be used? • What is the status of the Dutch expertise in CHP in the Netherlands? First, in Chapter 2, the situation of Brazilian sugar mills and distilleries is reviewed, and potentials for technological improvements are evaluated. In Chapter 3 an overview of the Dutch cogeneration sector is given, with a focus on its relevance for the Brazilian sugar market. Third, in Chapter 4 a number of scenarios are sketched that evaluate the potential for increasing the availability of bagasse, and how it can be used for generating (more) excess electricity, cellulosic ethanol and bagasse pellets. Finally, in Chapter 5, the relevance for the Netherlands in participating in these Brazilian improvements as well as taking part in a possible supply-chain to the Netherlands is discussed.

Improving the sustainability of the Brazilian sugar cane industry | April 27, 2012
Page 13 of 58
2 Current status and perspectives of sugarcane industry in Brazil
This section gives an overview of the state of play of Brazilian sugar mills as well as
expected developments in technology and market. Brazil’s 430 ethanol plants have
different configurations, efficiencies and connectivity to the grid that can be classified
in groups, in order to develop scenarios in the next chapter. In terms of technology
developments, relevant technologies are improved thermal processes (including
higher efficiency-boilers and thermal integration), cellulosic ethanol, and
mechanisation of the cane harvesting, all yielding higher availability of feedstock.
2.1 Distribution and characterisation of Brazilian sugar mills Brazil’s ethanol plants are concentrated in the Southeast-South region (In and around the state of São Paulo) and along the coast in Northeast region (Figure 2). The emerging ethanol-producing region is the Center-West, in the states of Mato Grosso and Gôias. Figure 2 Distribution of sugarcane processing mills in Brazil (source: USDA 2011 based on 2006
data)

Improving the sustainability of the Brazilian sugar cane industry | April 27, 2012
Page 14 of 58
In 2010, Brazil had 430 ethanol-producing plants (distilleries and mixed sugar-ethanol processing mills) (UNICA, 2010a) officially registered at the Ministry of Agriculture. Of these mills, 18% are large plants processing each over 4 million tons annually (most are in the States of São Paulo, Goias, and Mato Grosso), 69% are medium-size plants processing less than 2 million tons per year, and 13% are smaller plants processing less than 1 million tons per year (USDA 2011). About 87% of sugarcane production in Brazil takes place in the Center-South region (including states of São Paulo, Rio, Minas Gerais and Espirito Santo) and the remaining 13% is located in the Northeast, mostly close the coast where rainfall is abundant. Brazilian plants can be classified in three categories: Sugar mills that only produce sugar; sugar mills with distilleries (producing both sugar and bioethanol) and independent distilleries that only produce bioethanol. The largest group is the one that combines sugar mills and distilleries (close to 60% of the plants), followed by a considerable quantity of independent distilleries (close to 35%) and then by units that only process sugar.
2.2 Basic sugar to ethanol processes Figure 3 Schematic representation of the sugar processing. Based on Morandin et al 2010.
(1) Extraction
(2) Juice treatment
(6) Fermentor
Sugar
Cane
Bagasse Cake(4) Multi effect evaporator
(5) Crystallisation and drying
(7) Ethanol distillation
molasses
Vapor
Syrup
Sub-products
Ethanol
Treated juice
wine
Juice
Sugar
Sugar cane contains high amounts of sucrose or reducible sugars which can be fermented into ethanol by yeasts. Sugar content is usually expressed as the amount of total reducible sugars (TRS) per ton of cane (TC) [kgTRS/TC]. Sugar cane cannot be stored for more than a few days and mills operate only during the harvest period, irrespective of the type of facility. The initial processing stages for bioethanol are basically the same as for sugar production, as shown in Figure 3 steps (1) and (2). During the conversion process the cane is washed to remove organic material from the field and shredded into smaller pieces of 20-25 cm. After these pre-treatments the feedstock is fed to and extracted by a set of 4-7 mill combinations into juice and bagasse. The main objective of the milling process is to extract the largest possible amount of sucrose from the cane. A secondary but important objective is the production of bagasse with low moisture content to serve as fuel for the boilers. The cane juice is filtered and treated by chemicals and pasteurized. Before increasing the concentration of sugar by evaporation, the juice is filtered once again

Improving the sustainability of the Brazilian sugar cane industry | April 27, 2012
Page 15 of 58
which leads to the creation of another useful by-product named vinasse2. The evaporation process increases the sugar concentration of the juice from 14-16° Brix3 up to 50-58°Brix. The syrup is then crystallized by either cooling crystallization or boiling crystallization. Crystallization leads to a mixture of clear crystals surrounded by molasses with a concentration of 91-93°Brix. Molasses are removed by centrifugation, and the crystals are washed by addition of steam, after which the crystals are dried by an airflow. In the fermentation process sugars are transformed into ethanol by addition of yeast. Fermentation time varies from 4-12 hours, chemical efficiencies range from 80-90%, resulting in an alcohol content of 7-10°vol, called fermented wine. The wine is centrifuged in order to recover the yeast, and distilled in order to increase the alcohol concentration. The result is hydrated ethanol with a concentration of 96°vol. The possibility of using sugars from sugar cane to produce varying proportions of bioethanol and sugar represents a significant adaptation technology, which sugar mills can use to arbitrage — within certain limits — a cost-effective production programme, depending on fuel and sugar market conditions.
2.3 Bioelectricity Over 98% of Brazilian sugar mills (with integrated distilleries) are electrically self-sufficient. In order to provide just enough steam and electricity to meet onsite factory needs, they use small bagasse-fired steam turbine systems, supplied with steam at 21 bar, with most of these units dating from about 20 years ago. However, Brazilian mills are increasingly using excess bagasse to produce excess electricity, which can be sold to the national grid. Historically, commercialisation of excess electricity from distilleries started in the second half of the 1980s, initially on a small scale in the Northeast, and later in the state of São Paulo. The growth in sales of excess electricity generated from bagasse was accentuated in the 2000s, due mainly to the electricity supply crises of 2001-2002, but also to policies stimulating electricity production from biomass, and a window of opportunity in replacing old power systems in use since the beginning of the Proálcool programme4 (Barbosa et al 2008).
2 Vinasse can be used as a fertilizer in the field. 3 Degrees Brix is the amount of soluble solids (fermentable sugars), in 100 parts of liquid 4 Launched in 1975, Pro-Álcool was a nation-wide programme financed by the government in response to the 1974 oil
crises. It aimed to increase ethanol production from sugarcane (sugar prices where low at the time) in order to substitute fossil gasoline.

Improving the sustainability of the Brazilian sugar cane industry | April 27, 2012
Page 16 of 58
Figure 4 Historical bioelectricity delivered to the grid by Brazilian sugar mills (source: UNICA)
In the last five years, bioelectricity from bagasse has become competitive for large scale generation (see Figure 4). In 2011 sugarcane mills have sold 1268 MW of electricity on average, corresponding to 3% of the country’s electricity demand (UNICA). Since 2005, electricity sold to the grid as a by-product from the sugar industry has benefitted from government feed-in tariffs through the PROINFA feed-in law. Under this law, the price paid for electricity supplied by bio was 93.00 BRL5 / MWhe. However, in practice nobody sells electricity at that price and this system has not been very effective in encouraging the production of bioelectricity so far (Teixeira and Conceição 2009). Currently most bioelectricity is sold through the energy auctions, which means the value may be higher or lower than the feed-in price. The effective price depends on the demand and supply. Some studies count with an optimistic 150 BRL / MWhe for electricity sold to the grid (Sparovek et al 2011). Remaining challenges in practice include getting access to the grid, which can be problematic, especially in areas where land costs are low, where electrical infrastructure is likely to be missing. State of the grid connection From the 430 sugar mills operating in 2010, 23% were connected to the national public grid, with 16% of that capacity being exported (UNICA). The distribution of these refineries in regions is shown in Figure 5. There are certain reasons that hinder the Brazilian sugar plants from connecting to the national grid. The most important restraint is the cost to connect to the grid. To make cogeneration commercially viable, millers’ production costs including capital costs have to be covered. The level of initial investments required to start cogeneration is high and
5 1 Brazilian Real (BRL) = 0.42 EUR as of mid April 2012.

Improving the sustainability of the Brazilian sugar cane industry | April 27, 2012
Page 17 of 58
can be justified only when there are legal long-term commitments of electricity distributors to purchase bagasse-based electricity from sugarcane mills. Another challenge is the unattractive price paid by the grid for the electricity delivered by the mills. Brazilian sugar and alcohol plants produce around 95% of their electricity needs, purchasing the remaining 5% from national transmission and distribution (T&D) companies. The prices that are paid to those companies for this additional power are several times higher than the prices paid by T&Ds for the plants' electricity surplus. Consequently, attempts to generate high pressure steam for efficient electricity generation became minimal because of this low price received for electricity. Figure 5 Distribution of grid-connected sugar mills in 2008 (source: International Sugar
Organisatio 2009)

Improving the sustainability of the Brazilian sugar cane industry | April 27, 2012
Page 18 of 58
2.4 Availability of straw. Sugarcane harvesting can be done manually or mechanically, and cane can be harvested green or burned prior to harvesting. Manual harvesting is economically viable in Brazil, because of the large supply of low-cost labour. The cane is usually burned prior to manual harvesting to remove leaves and straw and to rid the cane field of poisonous snakes. However, burning causes a number of environmental issues: it reduces biological controls by killing natural predators, increases air pollution, risks fires in preservation areas, and results in loss of sucrose. These concerns about cane burning and its harmful CO2 emissions are moving the industry towards phasing out the traditional burning. Since manual harvesting of unburned cane reduces worker productivity by 50-70 % and increases the amount of impurities in the cane (Mitchell 2011), there are both an economic and an environmental case for mechanical harvesting. In the centre-south region, Brazil has increased mechanical harvesting to 55 percent of cane areas, with 41 percent green harvesting. Brazilian regulations on sugarcane harvesting and burning began to phase out sugarcane burning in 2001 on areas that can be mechanically harvested (slope < 12%), and burning should be entirely phased out by 2017. When mechanically harvesting unburned cane, the tops and leaves (collectively known as straw, or trash6) can be collected and brought to the mill, to either be burned for cogeneration, or for use as feedstock for cellulosic ethanol. For every tonne of cane, about 30% straw is produced, of which 50% is left on the field to avoid erosion, for the maintenance of soil agronomic properties related to its carbon–nitrogen ratio, K, P, Ca, Mg and S content, and for the preservation of soil microbiota (Ferrera-Leitão 2010).
2.5 Cellulosic bioethanol from bagasse/straw Although the increase in ethanol production in the near future will largely rely on the expansion of the sugarcane plantations for the production of first-generation ethanol and on the parallel increase of the number of distilleries, it is expected that the production of ethanol from sugarcane biomass (bagasse and straw) will eventually be significant. Second generation biofuel technologies can be sub-divided into bio-chemical and thermo-chemical processes. Biochemical processes mostly focus on the production of ethanol, while thermo-chemical processes can produce a range of fuels including Fischer-Tropsch diesel, bio methanol, green diesel, bio-DME, SNG etc. In this report we will focus on cellulosic ethanol, which is obtained from biomass through a biochemical process. Cellulosic ethanol production uses biological agents (enzymes and micro-organisms) to break down cellulose and lignocellulose into its base polymers, and then into monomeric sugars, including glucose and xylose (C6 and C5 sugars), which can be fermented into ethanol. Many combinations are possible of feedstocks, pretreatment, sacharification and fermentation techniques, that are described in more detail in literature (Dwivedi et al. 2009, Hu et al. 2008).
6 Straw and trash refer to the same thing, namely the tops and leaves of the sugar cane plant. In this study we chose
to refer to this material as straw.

Improving the sustainability of the Brazilian sugar cane industry | April 27, 2012
Page 19 of 58
Figure 6 Simplified representation of biochemical production of cellulosic ethanol (source: Larson
2008)
Figure 6 shows a simplified representation of the main steps involved in a biochemical conversion to ethanol, and where the opportunities lie for cost reductions, namely a) simultaneous saccharification and fermentation (SSF) and b) consolidated bioprocessing (CBP) which is being developed by Mascoma. The National Renewable Energy Laboratory (NREL) of the United States Department of Energy projects that by 2030, technology developments will enable yields of ethanol to approach some 400 litres per dry metric ton of biomass feedstock converted, compared with about 280 litres per tonne (db) that can be achieved with known technology today (Larson-UNCTAD 2009). Other sources predict yields of 0.407 GJeth/GJfeedstock8 (Dwivedi et al 2009). In Brazil one can note the recent partnering of the Brazilian Centre for Sugarcane Technology (CTC) with Danish enzyme producer Novozymes to develop technology to convert bagasse into ethanol. Although, this new industry faces challenges in moving towards commercialization of cellulosic biofuel, exciting developments continue to be made and sugarcane bagasse shows a very strong potential.
7 Based on a state of the art plant from Iogen, who have a demonstration plant running since 2004 which produces
340 litre of ethanol per oven dried tonne of feedstock, or about 41% conversion efficiency.
8 Assuming an energy content of 9 MJ/kg for bagasse at 50% moisture (Rein 2007) and an ethanol energy content of
21MJ/l (LHV).

Improving the sustainability of the Brazilian sugar cane industry | April 27, 2012
Page 20 of 58
2.6 Pelletisation of bagasse Although large quantities of bagasse are burnt for thermal process energy and electricity generation for both the process and delivery to the grid where available, an estimated 20 percent of the excess bagasse, or about 25 million tons, is left to waste (Waltzer 2009). Pellets can be sold on the domestic market to companies in industries like textile, dairy and brewing that generate steam to power turbines in their manufacturing process. If pellets are produced in sufficiently large quantities, they can also be exported to Europe, and in particular the Netherlands, where they can be co-fired in coal-fired power plants and in domestic (district) heating systems. In this way they contribute to achieve the EU’s GHG emission reduction targets. The European Biomass Association predicts that by 2020 the demand for pellets in the EU27 will be around 50-80 million tons, up from 1.4 million tons in 2000 (AEBIOM 2011). The pelletisation of bagasse produces pellets with diameters between 6 and 10mm and a length of 24 to 60mm with an energy density of 16.5 MJ/kg. In order to produce 1kg of pellets (8-10% moisture content), about 2 kg of bagasse are needed (50% moisture content) (Brazilian Pellet 2012). Although the production of pellets from bagasse is currently mostly in an experimental stage, Brazilian Pellet plans to produce over 520 ktons/year by 2015, mostly is the state of São Paulo (Waltzer 2009).

Improving the sustainability of the Brazilian sugar cane industry | April 27, 2012
Page 21 of 58
3 Current status of Dutch CHP sector
CHP in the Netherlands has a significant share in total electricity generation. A total
installed capacity of 13GWe is mainly attributed to the large centralized power plants
(44%) and decentralized gas engines (28%) in the agricultural sector. However,
biomass boilers with steam cycles that resemble bagasse boilers in Brazilian sugar
mills, are very rare in Netherlands. Moreover, the existing Dutch bio-CHP’s are
relatively small-scaled and optimized for delivering heat to local heating network. In
this context, the possibilities for collaboration with Brazil are limited. However, the
Netherland is still one of the leading countries in technical innovations on the
improvement of the overall efficiency.
3.1 Number of CHP units The Netherlands is one of the leading countries in the EU in terms of cogeneration, with a share of electricity generation through CHP of around 30%. The share of the installed capacity is even higher; approximately 40% of the electricity production capacity in the Netherlands comes from CHP installations. CHP systems can be categorized into centralized and decentralized systems. Central power stations are installations that are linked to the grid and are operated by energy companies. Decentralized plants are plants in which energy companies are not the primary operators. These include greenhouse companies (for food production), industrial companies, hospitals and CHP installations for district heating. There are various types of CHP installations. The most important ones are the combined cycle gas turbines (CCGT), gas turbines, gas engines and steam turbines. These types have their own specifications such as the electricity-to-heat ratio, temperature and pressure of generated steam etc. Figure 7 breaks down the number of installations in the Netherlands in different types. Figure 7 Number of decentralized (left) and centralized (right) CHP installations in the
Netherlands (CBS, 2009)

Improving the sustainability of the Brazilian sugar cane industry | April 27, 2012
Page 22 of 58
The gas engine is the dominant form of decentralized cogeneration (97%) in terms of installed numbers of units. Gas engines are reciprocating engines that predominantly use natural gas and sometimes biogas. Biogas-driven CHPs are often used at locations where biogas is produced, e.g. waste water or sewage treatment plants, landfills and anaerobic digestion plants. Gas engines produce primarily heat extracted from exhaust gases which is mostly applied for heating purposes at greenhouses and hospitals. The generated electricity is usually a by-product. These kind of decentralized systems are flexible, compact, modular and available in different types and capacities varying from a few kWe up to 2MWe. The centralized cogeneration installations are lead by combined cycle gas turbines (CCGT) which represent 68% of the total amount. CCGTs installations combine gas turbines and steam turbines in one integrated system. The heat in the exhaust gas from the turbine is used to generate steam in a steam boiler. The steam can either be used for industrial processes or used for production of electricity in a back pressure steam turbine. These kinds of installations can reach very high overall efficiencies varying from 80% up to 90%. Typical CCGT plants have capacities varying between 5 MWe to 250 MWe.
3.2 Installed capacity In 2009, the total installed electrical capacity of CHP installations in the Netherlands amounted 13GWe and the total installed thermal capacity of CHP installations was 19GWth. Figure 8 shows the installed electrical and thermal capacities with a breakdown into the applied types CHP installations. Figure 8: Share of different types of CHPs in installed electrical capacity (left) and thermal
capacity (right) in the Netherlands (CBS, 2009)
In terms of total installed capacity, the market is dominated by CCGT plants with a share of 44% of the total electrical capacity and 39% of the total thermal capacity. Gas engines have the second largest share in the installed capacities, 28% and 25% share in electrical and thermal capacity respectively. Steam turbines represent 20% of the installed electrical capacity and 18% of the installed thermal capacity.
Gas engine, 28%
Steam turbine, 20%
CCGT plant, 44%
Gas turbine, 8%Others, 0%
Gas engine, 25%
Steam turbine, 18%
CCGT plant, 39%
Gas turbine, 18%
Others, 0%
Improving the sustainability of the Brazilian sugar cane industry | April 27, 2012
Page 23 of 58
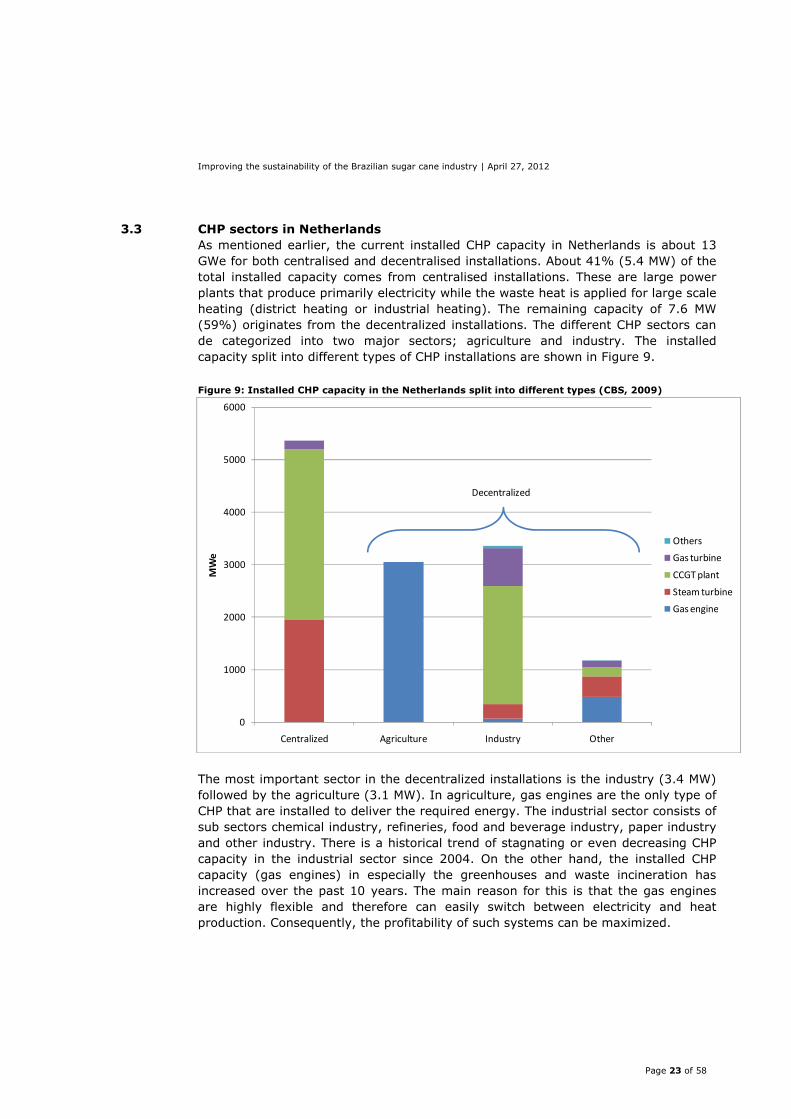
3.3 CHP sectors in Netherlands As mentioned earlier, the current installed CHP capacity in Netherlands is about 13 GWe for both centralised and decentralised installations. About 41% (5.4 MW) of the total installed capacity comes from centralised installations. These are large power plants that produce primarily electricity while the waste heat is applied for large scale heating (district heating or industrial heating). The remaining capacity of 7.6 MW (59%) originates from the decentralized installations. The different CHP sectors can de categorized into two major sectors; agriculture and industry. The installed capacity split into different types of CHP installations are shown in Figure 9. Figure 9: Installed CHP capacity in the Netherlands split into different types (CBS, 2009)
The most important sector in the decentralized installations is the industry (3.4 MW) followed by the agriculture (3.1 MW). In agriculture, gas engines are the only type of CHP that are installed to deliver the required energy. The industrial sector consists of sub sectors chemical industry, refineries, food and beverage industry, paper industry and other industry. There is a historical trend of stagnating or even decreasing CHP capacity in the industrial sector since 2004. On the other hand, the installed CHP capacity (gas engines) in especially the greenhouses and waste incineration has increased over the past 10 years. The main reason for this is that the gas engines are highly flexible and therefore can easily switch between electricity and heat production. Consequently, the profitability of such systems can be maximized.
0
1000
2000
3000
4000
5000
6000
Centralized Agriculture Industry Other
MW
e
Others
Gas turbine
CCGT plant
Steam turbine
Gas engine
Decentralized

Improving the sustainability of the Brazilian sugar cane industry | April 27, 2012
Page 24 of 58
3.4 Relevant CHP for sugar cane mills Traditionally, the cane sugar mills burn bagasse in boilers to produced steam for generating electricity used by the factory, and processing the sugar cane into sugar. This type of bio-CHP systems are in a very limited extent present in Netherlands. From the installed bio-CHP systems in Netherlands, we can distinguish biogas fired CHP’s (anaerobic digestion plants), biomass fired CHP’s with steam cycle and bio-oil fired CHP’s. Only the biomass fired CHP’s with steam cycle are of relevance for the Brazilian cane sugar mills. Therefore, from the different CHP configurations, only steam turbines are relevant for the cane sugar mills. The working principle of bio-CHP is shown in Figure 10. Figure 10: Concept biomass fuelled CHP with steam cycle
Boiler Generator
Heat
Biomass Electricity Steam turbine
Steam
Steam
Steam turbines can be categorized into two types; back pressure turbines and condense turbines. Back pressure turbines are the norm in cane sugar mills. These turbines meet the mill’s electrical and mechanical load without passing all the required process steam flow through the turbines. In the end of the turbine, steam with sufficient pressure and temperature will be released that can be used as process steam. If additional electrical power is required for export and if sufficient generating plant and fuel is available during crushing season, all the required process steam can be obtained as turbine exhaust steam with no letdown. This characteristic makes back pressure turbines ideal for CHP applications with very high conversion efficiencies (with 80 to 90%). An alternative is to use a condensing turbine with no blowing off exhaust steam. These turbines can generate more electrical energy per unit mass of steam. However, this type is less suitable for application as CHP but rather used in situations where maximization of electrical capacity is the primary goal. Consequently, this will result in a lower conversion efficiency (<40%). In the Netherlands, the main purpose of installing biomass CHP’s is to deliver heat as a part of an integrated system such as district heating, process heat, green houses etc. The basis for the design is mostly heat demand rather than electricity demand and in most cases the ultimate goal is to replace fossil originated heat by burning natural gas with biomass originated heat by burning wood. Therefore, the most resembling biomass CHP’s for the Brazilian cane sugar mills are the wood fired bio-CHP’s located in Lelystad, Goor, Sittard, Schijndel, De Lier and Berlikum. An overview of these installations is shown in Table 1.

Improving the sustainability of the Brazilian sugar cane industry | April 27, 2012
Page 25 of 58
Table 1: Overview of the Dutch CHP installations with biomass-based steam cycles.
Location Year Biomass Capacity Heat
application
Lelystad 2001 Clean wood
chips
1.7 MWe / 6 MWth District heating
Goor 2006 Demolition wood 1.75 MWe / 6.7 MWth District heating
Sittard 2005 Thinnings 1.25 MWe / 6.5 MWth District heating
Schijndel 1997 Waste wood 1.4 MWe / 7.4 MWth District heating
De Lier 2005 Waste wood 0.85 MWe / 5.0 MWth Greenhouse
Berlikum 2008 Waste wood 1.2 MWe / 5.0MWth Greenhouse
Most of these installations are delivering primarily heat and are connected to a local district heating network. Some of the installations are directly connected to green houses to deliver the required heat. Because of their application purposes, the biomass CHP installations are relatively small scaled. The electrical capacity ranges from 0.5 to 2 MW and the thermal capacities vary from 5 to 8 MW. The capacity ranges are far below the typical sugar plant capacities in Brazil. However, there are ongoing developments in the Netherlands concerning technological and financial improvements of biomass CHP’s that can be of importance for the Brazilian CHP sector. The most important developments are: • Application of high pressure and high temperature steam cycles in combination with a lower condenser pressure in order to maximize the electrical efficiency;
• Application of exhaust gas condenser in order to utilize low-temperature heat and increase the overall efficiency;
• Application of Organic Rankine Cycle (ORC) to convert low-temperature heat from exhaust gases into electricity and consequently a higher overall efficiency;
• Increase of fuel flexibility in order to minimize risks.

Improving the sustainability of the Brazilian sugar cane industry | April 27, 2012
Page 26 of 58
4 Results: potential for additional power, ethanol and pellets
This section describes how several improvements in harvesting and mill technologies
can lead to larger availability of biomass. This biomass can be converted to pellets
for export or converted to bioelectricity to be sold on the national grid, and/or
converted to cellulosic ethanol. The total quantitative potentials for these options is
then estimated based on a 648Mton Brazilian sugarcane harvest, and introduction
scenarios are presented based on step-wise introduction.
4.1 Results summary
Results of total potentials based on current harvest are summarised in Table 2 below. This table shows the additional products that could be made available, if improvements are introduced in all mills, based on a cane harvest of 648 Mton. Further details of calculations are given in the sections below, and in Table 5. Table 2 Potential additionally available products: pellets, electricity and cellulosic ethanol per
improvement
Improvement Extra surplus
Electricity1 Pellets2
Cellulosic
ethanol
Units TWh GW3 Mtonne PJ 1,000 m3
Collect straw4 57 945 15,552
Improved Steam Cycle5 20 5.12 8 128 2,479
Process optimisation6 8 2.09 30 489 9,488
1- This is additional excess electricity to what may already be produced (as excess electricity)
2- Pellets contain 8-10% moisture content and have a lower heating value of 16.5GJ/tonne
3- Assuming a load factor of 4000 hours per year, which corresponds to a harvest season of 166 days. Note
that cane and bagasse cannot be stored for more than a few days)
4- Straw can either be used for substituting bagasse in the boiler, hence freeing up more bagasse for pellets
OR be turned into cellulosic ethanol, so these options are mutually exclusive. Quantities of pellets here are
based on the reference scenario + straw.
5- Improved steam cycle allows for additional surplus electricity AND [bagasse being freed for pellets OR
turned to ethanol]
6- Process optimisation allows for additional surplus electricity AND [bagasse being freed for pellets OR
turned to ethanol]
The paragraphs below present the details of the calculations that lead to these results.

Improving the sustainability of the Brazilian sugar cane industry | April 27, 2012
Page 27 of 58
4.2 Results explanation The potential availability of biomass for excess electricity, cellulosic ethanol and pellets, depends on the following factors: • The availability of cane-based residues (bagasse and straw). When introducing mechanical harvesting, the tops and leaves of the sugarcane plant (called straw) can be collected;
• The efficiency of energy (co)-generation of energy at the plant. This includes efficiency of the cogeneration systems, including boilers and turbines, which typically depend on steam pressures, condensing technology etc;
• The efficiency of energy use by the milling and distillation processes. This includes demand for steam, mechanical power and electrical power. These can often be improved by thermal integration and use of newer technologies.
Availability and use of straw (tops and leaves) As described in section 2.4, straw represents 30% by mass of the produced sugarcane (on fresh basis) and sustainable harvesting allows for half of the straw to be removed from the field. Using harvest season 2008/2009 as a basis9, and assuming 100% green harvesting (no burning) this would yield 97 Mtonnes of straw (at 50% moisture content, totalling 760 PJ), available either for substituting bagasse in the boiler (hence freeing up bagasse for being converted into pellets) or for conversion into cellulosic ethanol. If the straw is used for substituting bagasse, the amount of excess bagasse that becomes available is 178kg / tonne of cane in the reference scenario (shown in Table 2), which would allow for 8 Mtonne of pellets to be produced nationwide, which is equivalent to 128 PJ worth of energy. The straw could also be used in addition to the improvement scenario’s described below, where it could increase the availability of excess bagasse to 200 kg / tonne of cane (BAT steam cycle) and 268 kg / tonne of cane (process optimisation), which in turn could lead to the production of 65 Mtonne (1,073 PJ) and 87 Mtonne (1,434 PJ) of pellets respectively. It is interesting to note that one tonne of wet bagasse (LHV = 7.8 GJ/tonne) can lead to the production of 0.5 tonne of pellets with a LHV of 16.5 GJ per tonne, which corresponds to a LHV of 8.25 GJ/tonne (> 7.8 GJ/tonne). This is possible because the initial bagasse lost significant amounts of water, which lowered its LHV (but not it’s HHV).
9 Harvest season 2008/2009 yielded 648 M tonnes (Ferrera-Leitão 2010)

Improving the sustainability of the Brazilian sugar cane industry | April 27, 2012
Page 28 of 58
In section 2.5 we described the conversion paths for producing cellulosic ethanol. Considering a yield of the biochemical route of 160l/tonne of cellulosic residue (at 50% moisture content), an extra 24 l of ethanol from straw could be produced on top of the 90 l already produced10 for each tonne of cane. Considering this, ethanol production could increase to 112 l per tonne of sugarcane without increasing the planted area, a topic of great environmental importance. Based on the 2008/2009 harvest, this would yield an extra 15 billion litre of cellulosic ethanol. Finally, the straw could also be converted to electricity at the mill, or, more likely, at a centralised location. If this were realised at an electrical efficiency of 35% (much higher than the cogeneration systems used at the mills) an extra 74 TWh could be produced in Brazil, which is equivalent to an installed capacity of over 18 GW, considering 4000 hours of operation per year. Efficiency improvements of steam cycle (boilers / turbine) Sugar and ethanol plants in Brazil have operated cogeneration systems for a long time. Until 2003, almost all cycles used by the mills operated with back-pressure turbo-alternators. Although the Brazilian industries have technology for high-pressure cogeneration systems, they have not been used by the mills (Olivério and Ferreira 2010). This lack of development is primarily explained by the lack of a well developed market for sale of the surplus electricity and the practical limit of poor grid-connections. Moreover, processes were designed for high steam consumption because there was more than enough power produced in the mills and, as a result, optimisation was not needed (Olivério and Ferreira 2010). For efficiency improvements at the plant level we modelled plant improvements based on a reference sugar and ethanol plant, as described in Olivério et al (2010). The technology level of this reference plant is common in Brazil, where, as far as energy efficiency is concerned, these specifications are representative of more than 70% of the mills. The relevant specifications of this reference mill as well as best available technologies (BAT) are given in Table 4. Note that in the reference case, in reality a large part of the steam produced by the boiler is used directly by the process, so if the systems is considered to be a cogeneration system, its electrical efficiency seems extremely low, at 3.25%, which leads to an underestimation of the potential extra surplus electricity that could be generated. Although the electrical efficiencies could technically be higher, the sugar process requires large amounts of heat, and therefore the dimensioning and H/P ratios are dimensioned based on heat demand. The application of high pressure steam cycles with high heat demand leads to H/P ratios that are not optimal for electricity production.
10 90l/tc is the current average for the whole of Brasil (USDA 2011).

Improving the sustainability of the Brazilian sugar cane industry | April 27, 2012
Page 29 of 58
Figure 11 Schematic representation of energy flows. Better steam cycles allow for smaller heat
losses and higher electrical efficiencies
Table 3 shows how a combination of higher temperatures and pressure can lead to more efficient production of electricity because of higher boiler and turbine efficiencies. This allows for significant quantities of bagasse to become available for other uses.
Table 3 Efficiency of steam cycles by level of technology (Source: Mathias and Balasankari 2009)
Technology level
Steam
cycle El efficiency Steam production
Bagasse
required
Unit bar/C t steam / t bagasse
t bagasse /
MWh
(1) 21/340 8.4% 2.5 4.5
2 32/380 10.6% 2.43 3.5
3 42/400 11.6% 2.4 3.2
4 45/440 12.2% 2.33 3
5 67/480 14.0% 2.27 2.6
6 87/510 14.9% 2.24 2.5
7 110/535 15.8% 2.21 2.3

Improving the sustainability of the Brazilian sugar cane industry | April 27, 2012
Page 30 of 58
Systems featuring steam generation at 22 bar and 300°C are the benchmark for energy self-sufficiency. The usual levels for steam generation have been 32, 42, and 62 bar while steam generation at 82 bar has not been practiced in Brazil (Sparovek et al 2011). Currently the maximum allowed pressure under Brazilian law is 82 bars. Technology level 1 (in Table 3) is closest to the most common use in Brazilian sugar mills, and level 7 represents the best available technology today, which corresponds to a possible electrical efficiency improvement of almost 49%. Calculations:
Assuming a constant thermal and electrical energy demand from the mills processes, we calculated: 1 The amount of bagasse needed to satisfy internal heat demand 2 how much excess electricity would be generated with this amount of bagasse input through the CHP with the new efficiency
3 how much excess bagasse is left after the improvement 4 how much excess electricity would be produced after the improvement and 5 how much excess electricity can be produced from burning excess bagasse in a higher efficiency power plant.
The results are displayed in the second column of Table 4 where calculated values are marked in bold.

Improving the sustainability of the Brazilian sugar cane industry | April 27, 2012
Page 31 of 58
Table 4. Specifications and variables of reference (Olivério and Ferreira 2010) and BAT plant
technology
Parameter Reference mill BAT Steam Cycle Process optimisation Unit
Efficiency boiler 71% 85% 85% %
El efficiency turbine 8% 15% 15% %
Mill's own electricity demand 0.0432 0.0432 0.0432 GJ/tonne
cane
Mill's own heat demand 1.27 1.27 0.89 GJ/tonne
cane
Part of bagasse used for
process
87% 82% 57% %
Bagasse needed for process
heat
249.27 225.36 157.75 kg/tonne
cane
Surplus bagasse 26.73 50.64 118.25 kg/tonne
cane
Surplus electricity 18.7 50.2 31.6 kWh/tonne
cane
Surplus bagasse gained from
improvement
- 23.91 91.52 kg/tonne
cane
Surplus electricity gained
from improvement
- 31.6 12.9 kWh/tonne
cane
Electricity from surplus
bagasse at high electrical
efficiency1
57.9 109.7 256.2 kWh/tonne
cane
1- This is the additional electricity that could be produced if all excess bagasse were burnt in a separate
combined cycle at 30% electrical efficiency. This would require extra investments, and could also occur at
another location than the mill. Improvements of the steam cycle would thus allow a total of 50kg/tcane surplus bagasse to be available at the plant for other uses, which is 24kg/tcane on top of what was available in the reference scenario, where typically 10% of bagasse was left unused. On the 2008/2009 harvest of 648 Mtonnes of cane, this represents 33 Mtonnes of bagasse (50% mc), or 256 PJ. The same improvements allow potential excess electricity to reach 50kWh/tonne of cane, which represents an excess 33TWh (8GW) of electrical capacity on the entire Brazilian sugarcane harvest. These results are summarised in the next section.

Improving the sustainability of the Brazilian sugar cane industry | April 27, 2012
Page 32 of 58
If all surplus bagasse were to be burnt in a central power production unit instead, this would represent an extra 12 TWh, which is equivalent to 3 GW of installed capacity, assuming 4000 hours of operation per year and an electrical efficiency of 35%. Efficiency improvements in process demand Thermal integration in a sugar mill and distillery means using and reusing steam in the most efficient way. According to Dias et al (2011), thermal integration can promote important steam reductions in the anhydrous bioethanol production. For mills with conventional distillation system scheme the reduction of the steam consumption at 2.5 bar can reach 31% with the integration and 34% for the 6.0 bar steam. When double-effect distillation columns are used, the reduction of steam consumption with the thermal integration is 40% for the 2.5 bar steam and 27% for the 6.0 bar steam. Calculations Assuming an average process heat demand reduction of 30% (from 1.27 GJ/tonne cane to 0.89 GJ/ tonne cane), and a constant internal electricity demand (12kWh/tonne cane) we calculated: 1 The amount of bagasse needed to satisfy internal heat demand 2 how much of excess electricity would be generated with this amount of bagasse input
3 how much excess bagasse is left after the improvement 4 how much excess electricity would be produced after the improvement Process optimisation would thus allow for 118kg bagasse/tonne cane to be available at the plant, which is 92kg extra on top of the 26kg typically available in the reference mill. On the 2008/2009 harvest of 648 M tonnes of cane, this bagasse could be converted to 30 Mtonne of pellets corresponding to 489 PJ of exportable material. The same improvements allow potential excess electricity to simultaneously reach 31.5 kWh/tonne of cane, which represents an extra 8 TWh (2GW) of electrical capacity on the entire Brazilian sugarcane harvest. These results are summarised in Table 5.
Table 5. Summary of improvements and change in available excess bagasse, straw, and electricity
Improvement Surplus Bagasse Surplus Straw Surplus Electricity
Units Mtonnes PJ Mtonnes PJ TWh GW1
Reference Mill 17.3 135.1 0 0 12.10 3.03
Improved Steam Cycle 32.8 256.0 0 0 32.57 8.14
Process optimisation 76.6 597.7 0 0 20.46 5.12
Collect straw 97.2 758.16
1 – Assuming a load factor of 4000 hours per year

Improving the sustainability of the Brazilian sugar cane industry | April 27, 2012
Page 33 of 58
If all surplus bagasse were to be burnt in a central power production unit instead, this would represent an extra 45 TWh, which is equivalent to 11 GW of installed capacity, assuming 4000 hours of operation per year and an electrical efficiency of 35%. These last figures are not represented in the table, as they require an external power unit, which would likely not function in a cogeneration set-up, unless an application could be found for the low quality heat. It is important to note that the process optimisation will contain in most cases some form of cogeneration optimisation as well, so the results of additional products made available through the two measures cannot and should not be added.
4.3 Scenarios for further development In order to provide an indication for the potential impact of these improvements over time, several introduction scenarios are developed below. The assumptions underlying these scenarios and their outcome are summarised in Table 6 below.
The basis for calculating the national potential is the sugar cane harvest. The 2010 harvest as well as estimates for future harvests are taken from UNICA, the Brazilian Sugar cane industry association. Note that although the total planted area of cane can be estimated based on agricultural project planning, future harvests are difficult to predict since they depend heavily on weather patterns (especially water availability). Optimising for surplus electricity generation When optimising for surplus electricity production, we assume that the plants perform either an optimisation of steam cycles, or a thermal integration, which would allow plants to produce 50kWh/tonne and 32kWh/tonne respectively. On top of this, we assume that the bagasse freed by the optimisation is combusted separately purely for electricity production at an electrical efficiency of 30%, yielding an extra 109,7 kWh/tonne and 256kWh/tonne respectively. The additional electricity that can be generated from collecting straw is given separately as it can be added to both other improvement scenarios. In 2011, about one quarter of all mills were connected to the grid. If we extrapolate the size distribution of all Brazilian mills from the distribution in the state of São Paulo, and assume that the larger mills are connected first, this means that already half of the Brazilian sugarcane capacity is connected to the grid (Figure 12). Since in reality some small mills will be connected as well, we assume that in 2010, 40% of the cane capacity is processed at mills that are connected to the grid.

Improving the sustainability of the Brazilian sugar cane industry | April 27, 2012
Page 34 of 58
Figure 12 Crushing capacity of sugarmills in SP, ordered from large to small. The 25% largest
mills represent about half the total capacity. The 35% largest mills represent over 65% of total
capacity.
0
1
2
3
4
5
6
7
8
91
9
17
25
33
41
49
57
65
73
81
89
97
10
5
11
3
12
1
12
9
13
7
14
5
15
3
16
1
16
9
Cru
sh c
ap
aci
ty
pe
r p
lan
t (M
ton
ne
)
Number of Unica plants in São Paulo state
25% of mills
35% of mills
Note that for 2010, UNICA estimated the marketable excess electricity potential at 3.9 GW (averaged over the year) when in reality only 1.002 GW were sold to the grid effectively (UNICA 2012). Castro et al (2010) explain the lack of bioelectricity sold to the grid by the inadequate structure of the energy auctions, which favour oil-fired thermoelectric capacity. Given the benefits provided by bioelectricity from sugarcane (see section 5.1), it is likely that the energy auctions will be adapted on the medium term, to make bioelectricity generation more attractive. Therefore our scenarios assume that the technical potential will be realised. Optimisation for pellets Pellets could be produced from both straw and bagasse. The installation of a pellet plant will make it attractive to use both. In our scenario we assume that as this new technology enters the market progressively and that in 2015, the 15 largest plants in SP are equipped with such a facility, which would account for 10% of the Brazilian cane production of that year.

Improving the sustainability of the Brazilian sugar cane industry | April 27, 2012
Page 35 of 58
Table 6. Potential availability of pellets, electricity and cellulosic ethanol per improvement
scenario over time
Year 2010 2015 2020
Total Brazilian power production (GW)1 55 66 83
Electricity delivered to grid by mills (GW)2 1.0 8.6 15.3
Info
Participation of grid-connected mills to national use
(calculated from above)
1,8% 13,0% 18,3%
Sugarcane harvest (Mt)2 720 829 1038
percentage of plants connected to the grid 25% 35% 50%
percentage of electric potential connected to grid3 40% 50% 80%
percentage of cane harvest whose bagasse excess is
converted to pellets
0% 10% 20%
Scenario
assumptions
percent of cane harvest whose excess bagasse is
converted to 2G ethanol
0% 5% 20%
Collect straw for electricity production (GW)4 7,0 10,1 20,2
Collect straw for pellets (PJ pellets) 0 105 210
Collect straw for extra ethanol (1000 m3) 0 995 4.982
Improved Steam Cycle for surplus electricity (GW)5 11,5 16,6 33,2
Improved Steam Cycle for pellets (PJ pellets)6 0 35 87
Improved Steam Cycle for extra ethanol (1000 m3)7 0 336 1.682
Process optimisation for surplus electricity (GW)5 20,7 29,8 59,7
Process optimisation for pellets (PJ pellets) 0 81 203
Results
Process optimisation for extra ethanol (1000 m3) 0 784 3.928
1- Current and expected by ministry of mines
2- Expected by UNICA
3- Guided assumption based on largest plants being connected to grid first (explanation in text)
4- This is the result of converting all collected straw to electricity at 30% electric efficiency (which
requires a new turbine, and does not deliver useful process heat, as its temperature is too low)
5- Electricity produced at 15% el efficiency through CHP (after improvement) and leftover bagasse is
converted at 30% el efficiency.
6- All freed bagasse is converted to pellets. This quantity could be added to pellets from straw.
7- All freed bagasse is converted to ethanol. This quantity could be added to ethanol from straw.

Improving the sustainability of the Brazilian sugar cane industry | April 27, 2012
Page 36 of 58
Optimisation for maximised ethanol production Assuming that second generation ethanol will start to be come commercially viable in the next 5 years, we have assumed only a small fraction of the plants to be equipped with such equipment by 2015 (5% of cane capacity), while in 2020, if the technology has indeed become viable, many more plants should be equipped (20% of cane capacity). These developments are highly dependent on technological breakthroughs and market prices for ethanol with respect to pellets, which is in turn likely to be driven largely by policy developments.
4.4 Other estimates of potentials Regarding surplus electricity production, Macedo et al. (2008) considered that on average 10 kWh/t of sugarcane as surplus electricity have been sold to the electric grid. This figure is representative for the current average in the state of São Paulo, and could be significantly enlarged in the future. UNICA estimated the potential for bio-electricity to be 14,000 MW by 2020, based on the use of 75% of the bagasse and 50% of straw for excess electricity.

Improving the sustainability of the Brazilian sugar cane industry | April 27, 2012
Page 37 of 58
Table 7 provides an overview of estimates from other sources. Table 7 Potentials estimated by various sources.
Source Potential Comments
Oliveira 2012 140 Mt of Bagasse
150 Mt of Straw
Compared with
33-77 Mton bagasse, and
97 Mton straw (this study) on
current harvest
Macedo et al 2008 Surplus electricity:
10 kWh/tc
Current surplus electricity sold.
Representative for state of SP.
UNICA 2010 Potential for bioelectricity from sugar
cane: 14 GW by 2020
Walter et al 2005 (quoted in
Barbosa 2008)
Potential bioelectricity from cane: 3.9
– 7.3 GW on the 2005-2006 harvest
Assuming respectively 62 bar /
470ºC and 82 bar/ 480ºC
cogeneration systems.
Castro et al 2010
80kWh/tc excess el with extraction-
condensation technology
200kWh/tc when including straw
270kWh/tc when using gasification
technology
Costs of technology are estimated
at 3.000 R$/kW (1.160 Euro/kW
at current exchange rate of 1 EUR
= 2.58616 BR)
This Study
50kWh/tc through improved steam
cycles (+110kWh/tc when converting
excess bagasse at high efficiency)
31.6 kWh/tc through process
optimisation (+ 256 kWh/tc when
converting excess bagasse at high
efficiency)
Leading to potential bioelectricity
generation by 2020 of 33 GW - 60GW
from plant optimisations (table 6)
Based on harvest of 1038 Mt of
cane in 2020

Improving the sustainability of the Brazilian sugar cane industry | April 27, 2012
Page 38 of 58
4.5 GHG improvements In this section, the GHG gains in Brazil are calculated as a result of the potentials
described in the previous sections.
Avoided emissions from bioelectricity sold to the grid Since 2002, there have been considerable changes in the production of sugarcane ethanol in Brazil. There has been increased interest in the use of surplus electricity from cane processing mills, to complement the national electricity supply during the dry season. The overall energy surplus selling average was 10.5 kWh/t cane in 2008 (compared to only a few kWh/t cane in 2002); and the average for mills already connected to the grid and selling power was 28 kWh/t cane. Some mills are already selling more than 60 kWh/t cane. Since the additional excess bagasse is being used to avoid greenhouse gas emissions (from the national electricity grid), the avoided emissions shall be considered as a reduction. It would represent a classical use for the displacement method. Therefore, 10.5 kWh/t cane – with 80 L ethanol/tonne cane; 21.3 MJ ethanol/L ethanol; substituting for marginal electricity generated by Natural Gas (at 40% thermal efficiency; releasing 560 kg CO2e/MWh) – saves 3.5 g CO2e/MJ ethanol. This means that 3.5 g CO2e should be deducted from the default value for ethanol produced from sugarcane in Brazil. However, the European Renewable Energy Directive (RED) does not acknowledge this excess electricity to be accounted for emission saving as the GHG emissions from bagasse-fuelled power plant would be zero. The statement in the RED says: Emission saving from excess electricity from cogeneration shall be taken into account
in relation to the excess electricity produced by fuel production systems that use
cogeneration except where the fuel used for the cogeneration is a co-product other
than an agricultural crop residue. In accounting for that excess electricity, the size of the cogeneration unit shall be assumed to be the minimum necessary for the
cogeneration unit to supply the heat that is needed to produce the fuel. The
greenhouse gas emission saving associated with that excess electricity shall
be taken to be equal to the amount of greenhouse gas that would be emitted
when an equal amount of electricity was generated in a power plant using
the same fuel as the cogeneration unit.11
Therefore, any surplus electricity generated from bagasse will not be accounted for in calculating emission savings.
11 Directive 2009/28/EC, Annex V, C, 16.

Improving the sustainability of the Brazilian sugar cane industry | April 27, 2012
Page 39 of 58
GHG emission results The RED outlines the default values for ethanol produced from sugar cane. The total GHG emission of Brazilian sugar cane ethanol transported to Europe yields 24 g CO2e/ MJ ethanol. The total emission is divided into cultivation (14 g CO2e/ MJ ethanol), processing (1 g CO2e/ MJ ethanol) and transportation (9 g CO2e/ MJ ethanol). Compared to a fossil fuel reference (petrol) with an emission factor of 83.8 g CO2e/ MJ ethanol, the overall default emission reduction is 71%. Figure 13 shows the default GHG emissions compared to the GHG emissions from the improvements as described in this chapter. Figure 13 Effect on GHG emission reduction potential of ethanol, after improvements are taken
into account
0.0
5.0
10.0
15.0
20.0
25.0
30.0
Default Surplus
electricity
Improved Steam
Cycle
Process
Optimization
Collect straw for
pellets
Collect straw for
EtOH
g C
O2
,eq
/ M
J E
tha
no
l
Transport
Processing
71% 71%
75%
78%
79%
75%

Improving the sustainability of the Brazilian sugar cane industry | April 27, 2012
Page 40 of 58
5 Implications and recommendations
5.1 The potentials in the Brazilian context This study and other studies have demonstrated a large potential for use of cane residues in Brazil. Especially, through mechanised harvest and further energy efficiency improvements at the mills, about 130-174 Mtonne per year of surplus biomass could be produced and turned either in extra ethanol, pellets or surplus electricity. Incentives for bagasse cogeneration While the regulatory environment for bagasse cogeneration appears to be improving, there remain some key issues that should be addressed if the full potential is to be achieved. These are: • Detailed rules for interconnection apply only to central power, whilst interconnection arrangements for on-site systems in general remain to be clearly defined;
• Utilities often apply old system rules that do not permit ‘inside-the-fence’ generators to run in parallel with the grid. Open access to the electricity system is thus only facilitated for central power. This is likely to predominantly affect the smallest sugar mills that have less weight than larger players.
• Requirements for connection protection and measurement are still strict, causing difficulties and added expense that affect small independent power producers in particular.
Brazilian independent power producers are legally permitted to sell electricity to: • Licensed electricity supply companies or network operators; • Large consumers who have free choice of electricity suppliers; • Consumers of cogenerated electricity; • Consumer co-operatives (provided permission is granted by the local power utility).
Most incentives applying to bagasse cogeneration exist in the form of schemes for the promotion of electricity from biomass, like the PROINFA feed-in scheme (see section 2.3), and the energy auctions. Teixeira and Conceição (2009) pointed out that these programmes have not been very effective in achieving integration of bioelectricity in the grid. Indeed, Proinfa foresaw to install 1.100 MW of sugar cane bagasse generated power, while only 685 MW were installed. Similarly, while the projects listed at the auctions totalled 4.650 MW, only 1.234 MW were effectively installed. Regarding the costs for upgrading Brazilian mills for cogeneration, policies aiming at incentivising the integration of bioelectricity should take into account the difference between retrofitting old installations, and new, greenfield projects. Castro et al (2010) estimate that the electricity price to make new projects viable should be at least 155 R$/MWh, while it should be at least 180 R$/MWh for retrofitted projects (60 EUR and 70 EUR respectively at 1 Euro = 2.58 BRL).

Improving the sustainability of the Brazilian sugar cane industry | April 27, 2012
Page 41 of 58
Also, as the Brazilian natural gas infrastructure is not yet fully developed, many areas are still without a competitively priced supply. In areas where this is the case, bagasse cogeneration can provide a cost-effective source of electricity and perhaps even heat to industrial and commercial users. From a practical perspective, bioelectricity from sugarcane bagasse, which is harvested during the dry season, complements hydro power in a counter-cyclical way. Indeed, as shown in Figure 14, this is also when the hydropower is limited, due to low water availability. Figure 14 Complementarity of hydroelectricity and the sugar-energy sector, as % of the month
with the greatest supply. (source: bioeletricidade.com)
Competition for other uses Besides the use for cogeneration, the residual biomass produced from the sugar industry could also be used for other (local) applications: • Bagasse can be used as a component in animal feed. Such synergies between food and energy production offer real measures for reducing the risk of indirect land-use change (ILUC). See Sparovek et al (2010) and Ecofys (2009) for further details;
• Bagasse could be used as a heat source in other industrial sectors, such as the steel industry, which already uses charcoal for about a third of its energy needs (CGEE 2008).
• Sugargane biomass can also be used for high-value applications such as biochemistry, as is illustrated by the recent deal between European Solvay and the Brazilian National Bioethanol Science and Technology Laboratory (CTBE) with the objective of developing chemical routes to obtain high-added value molecules, hence consolidating the mills as bio-refineries.
Regarding the competition of bagasse for cogeneration with bagasse for ethanol, Castro et al (2010) estimate that investments in cogeneration will not be reduced because of competition from ethanol, based on projections of ethanol and electricity markets. Rather, they are likely to be increased, especially if adequate policies are adopted.

Improving the sustainability of the Brazilian sugar cane industry | April 27, 2012
Page 42 of 58
5.2 Opportunities for Dutch initiatives This potential for residues produced in the Brazilian cane industry (1000-1300 PJ of bagasse and straw) is large compared to the total primary energy demand in the Netherlands (3 250 PJ in 2011 according to CBS). As the Dutch government is interested in developing a biobased economy, it is valuable to explore this potential further. Opportunities along the supply chain All along the supply chain, from the production in the field until the end use Dutch expertise, technologies and services could play a role. Of course, Brazil has much more expertise than the Netherlands on most of the cane feedstock related activities, but gradually, along the supply chain the interest for Dutch activities could increase. At the plantation, first of all the volume of residues can be increased through agronomical improvements. The cane has been optimised for sugar production per hectare. For the biobased economy, it may be more interesting to optimise the total biomass production per hectare, or find an optimum of sugar and residue production in between. At the field, the fraction of straw removed can be optimised (remove as much as is possible without adverse effects). Nutrients from elsewhere in the supply chain could be recycled to the field. If large quantities of residues are going to be exported to the Netherlands, it is important to increase their energy density, in order to reduce the transport costs per unit of energy. The most promising form of pre-treating bagasse is to torrefy and compress the product into high-density, low moisture pellets. This should be done at the plant location, and the Dutch expertise in torrefaction technology could provide a valuable asset. The Dutch expertise in advanced logistics could also be leveraged. Indeed, the large-scale export of biomass will require an adequate infrastructure, which could be further developed with aid of Dutch industry and expertise. Infrastructure elements could include the development of ports, storage, transhipment etc. Sustainability Some of the Brazilian sugarcane ethanol plants set up partnership with European countries to export its ethanol. However, these plans are hindered by unclear sustainability issues around the export process. The Netherlands can advice on the expected and proven effects on sustainability issues as biodiversity, competition with food, competition with suitable land, local environment (water, nutrients, soil erosion), local regional and national social and economic effects etc. Also the when pellets/chips are exported in a non-torrefied form, they carry large amounts of nutrients with them, which may cause nutrient deficits to Brazil. These issues could be studied further by Dutch researchers and solutions could be designed for the long term.

Improving the sustainability of the Brazilian sugar cane industry | April 27, 2012
Page 43 of 58
Price of ethanol In Brazil, there is a current trend that the cost of Brazilian sugarcane ethanol production has increased in recent years. Consequently, some sugar plants are considering to change over to other sectors such as the electricity sector. In order to solve this, Brazil needs to adopt new industrial and agricultural technologies and carry out more research into other productive sugarcane varieties. Increasing investment in research, development and innovation will increase crop yields, conversion yields and the overall productivity of the production process. At this point, Dutch technological knowhow and expertise can play an important role. Indirect land use change (ILUC) Over the past 30 years, Brazil’s ethanol alone has saved 800 million tonnes of CO2 emissions. However, there are concerns regarding the impacts of converting land to the production of feedstocks for the biofuel sector. It is believed some ethanol feedstocks could contribute significantly to indirect deforestation which could create a huge carbon debt. Studies have found that a carbon debt is made when natural lands are cleared for biofuel production and from crop production when agricultural land is diverted. Another concern is that land used for sugarcane production could be used for food crops instead. Because of these worries about the land use effects from the production of biofuel, Brazilian government has introduced a law which has been implemented to help protect specific areas such as the Amazon. The Netherlands can also assist Brazil to help mitigate ILUC by quantification evaluations and policy advice on this issue. Being involved in the recent ILUC policy discussions in the European Commission, The Netherlands has a broad knowledge on ILUC. Second generation technologies Brazilian oil companies are increasingly investing into the research of sustainable biofuel including second generation technologies such as lignocellulosic technology to convert bagasse into ethanol. It is important to pursue these developments to produce ethanol to avoid reaching the biofuel supply limits and to reduce competition for land use with food crops. Also European oil companies such as Shell and BP are collectively investing into advanced biofuels in Brazil. Regulatory issues and lack of investment In the past two years, the Brazilian sugarcane ethanol industry has struggled to meet demand due to the global financial crisis and a couple of bad harvest seasons compared to previous years. Therefore, the Brazilian government announced new financial support and other incentives for sugarcane ethanol production in June 2011. However, uncertainty within the market has had a negative impact on investments in the industry. There is still a lack of clear regulatory measures which brings about a high risk for the investors. Government guidance on what the target for ethanol production should be, what the required ethanol blends in petrol should be, how to increase the long-term contracts between producers and distributors and a way to create stocks to reduce unstable prices are still lacking. Dutch investors and entrepreneurs can help ethanol plants in Brazil who are currently struggling to find investors.

Improving the sustainability of the Brazilian sugar cane industry | April 27, 2012
Page 44 of 58
Trade restrictions and lower EU tariffs The Brazilian cane ethanol industry would like the European Union to provide an attractive framework for their business. As the Brazilian cane industry may be an essential partner to help the EU to meet its 20/20/20 environmental targets, it could be in the interest of the EU to (partially) remove trade restrictions on some related products (decrease tariffs) and to facilitate the recognition of Brazilian sustainable feedstock production – if and where applicable. A level playing field with EU bioenergy industry is needed in a way that benefits both Brazil and the EU. As a member of the EU, the Netherlands can contribute to improving the playing field.
5.3 Roadmap for the Netherlands Dutch stakeholders could take an active role in de the development of a new economy based on Brazilian cane residues. The Dutch government could proactively stimulate this development: • By selecting a promising supply chain with relatively low entry barriers, and promoting a complete business case, with the eventual aim that this chain will be demonstrated in practice in the short run;
• Bring Dutch companies into contact with suitable Brazilian counterparts to establish joint ventures, and stimulate them to develop any of the options mentioned above;
• Invite Dutch financial stakeholders to clarify what role they could play and what requirements they would have in the development of technological infrastructure required to facilitate the large-scale export from Brazil and import into the Netherlands;
• Keep an inventory of direct or indirect trade barriers that would hinder the import of Brazilian cane residues, and (assist in) removing such barriers.

Improving the sustainability of the Brazilian sugar cane industry | April 27, 2012
Page 45 of 58
6 References
AEBIOM 2011- 2011 Annual Statistical Report on the contribution of Biomass to the
Energy System in the EU27. European Biomass Association, June 2011 Arnão and Nebra 2011 - Sosa-Arnão JH, Nebra SA, First and Second Law to Analyze the Performance of Bagasse Boilers. International Journal of Thermodynamics vol 14 (no2), April 2011 Barbosa et al 2008 - Barbosa Cortez LA, Silva Lora EE, Olivares Gómez E, Biomassa
para energia, Unicamp, Brazil, 2008 Brazilian Pellet 2012 – Biopellet, retrieved on February 9th, 2012 from http://brazilianpellet.com/html2/biopellet-ing.htm Bryant 2009, Bryant S – Leading the way – Brazil is one of the first nations to begin the shirt towards cellulosic ethanol production. Biofuels international, issue 9, volume 3, 2009 Castro et al. 2010 - Castro NJ, Brandão R, Dantas GA - Sugar-Ethanol Bioelectricity in the Electricity Matrix CGEE 2008, Ronaldo Santos Sampaio, Uso de Carvão Vegetal em Mini Altos-Fornos,
Situação Atual com Tendências 2025 -Estudo Prospectivo do Setor Siderúrgico, Centro de Gestão e Estudos Estratégicos, June 2008 Dias et al 2011 - Dias MOS, Modesto M, Ensinas AV, Nebra SA, Maciel Filho R, Rossell CEV - Improving bioethanol production from sugarcane: evaluation of distillation,
thermal integration and cogeneration systems, Energy vol 36, 2011 Dwivedi, P., J. R. R. Alavalapati, P. Lal, Cellulosic ethanol production in the United States: Conversion technologies, current production status, economics, and emerging
developments, Energy for Sustainable Development, vol 13, 2009, p. 174-182 Ecofys 2009 - van de Staaij J, Dehue B, Meyer S, RCA feasibility studies Oil palm cultivation on Imperata grassland and sugarcane cattle integration, November 2009, confidential. Ferrera-Leitão 2010 - Ferreira-Leitão V,Gottschalk LM, Ferrara MA, Nepomuceno A, Correa Molinari HB, Bon EPS, Biomass Residues in Brazil: Availability and Potential
Uses, Waste Biomass Valor (2010) 1:65–76 Hu, G., J. A. Heitmann, O. J. Rojas, Feedstock pretreatment strategies for producing
ethanol from wood, bark, and forest residues, BioResources, vol 3 (1), 2008, p. 270-294 ISO 2009 - International Sugar Organization: Cogeneration – Opportunities in the World Sugar Industries, April 2009, MECAS(09)05

Improving the sustainability of the Brazilian sugar cane industry | April 27, 2012
Page 46 of 58
LAHT 2010 – Latin American Herald Tribune, Eight Bagasse-Fired Power Plants Inaugurated in Brazil, published 29th of September 2010. Larson, E., Biofuel production technologies: status, prospects and implications for
trade and development, United Nations Conference on Trade and Development, 2008. Macedo et al 2008 - Macedo IC, Seabra JEA, Silva JEAR, Green house gases emissions in the production and use of ethanol from sugarcane in Brazil: The
2005/2006 averages and a prediction for 2020, Biomass and bioenergy vol 32, 2008 Mitchell 2011 - Mitchell D, Biofuels in Africa, Opportunities, Prospects and
Challenges. World Bank. 2011 Morandin et al 2011 - Morandin M, Toffolo A, Lazzaretto A, Maréchal F, Ensinas AV, Nebra SA, Synthesis and parameter optimization of a combined sugar and ethanol
production process integrated with a CHP system. Energy vol 36, 2011. Olivério JL, Ferreira FM 2010 - Cogeneration - A new source of income for sugar and
ethanol mills, Piracicaba, SP, Brazil Palacios et al 2010 - Palacios-Bereche R, Ensinas A, Nebra SA, Energy Consumption
in Ethanol Production by Enzymatic Hydrolysis - The integration with the
Conventional Process using Pinch Analysis. Chemical engineering transactions volume 24, 2011 Solvay 2012 - Solvay and the National Bioethanol Science and Technology Laboratory in Brazil strike deal to jointly develop bio-based chemistry based on sugarcane. Press release on 26th of April 2012 Sparovek et al 2010 - Sparovek G, Berndes G, Barretto A, Martins SP, Maule R, Burgi R, Smorigo J, Bioenergy and food production for local development in Brazil: inputs
for policy-making. Piracicaba : GAJ Editora e Comunicação, 2010 Teixeira and Conceição 2009 – Teixeira BS, Conceição PHZ, Brazil’s recent
Experience of incorporating bioelectricity into its electric system: success or failure? Department of Economics, University of Brasilia UNICA 2010ª - União da Indústria de Cana-de-Açucar. The Industry Background. Sugarcane: The Economic Cycle. Available online: www.unica.com.br UNICA 2012 - União da Indústria de Cana-de-Açucar. Potencial da Bioeletricidade sucroenergética exportada para a rede elétrica até 2020/21 Available online: www.unica.com.br USDA 2011, Constanza Valdes, Brazil’s Ethanol Industry: Looking Forward. Report from the Economic Research Service, June 2011 Walter and Ensinas 2010 - Walter A, Ensinas AV, Combined production of second-
generation biofuels and electricity from sugarcane residues. Energy vol 35, 2010

Improving the sustainability of the Brazilian sugar cane industry | April 27, 2012
Page 47 of 58
Walzer 2009 - Waltzer RP, Sugar Cane Waste as Pellet Fuel, The New York Times, 23 November 2009. Accessed on 10 February 2012 at http://green.blogs.nytimes.com/2009/11/23/sugar-cane-waste-as-pellet-fuel/

Improving the sustainability of the Brazilian sugar cane industry | April 27, 2012
Page 48 of 58
Appendix A - NL CHP sector
Figure 15 of current installed electrical capacities, split into different sectors.
Total centralised,
41%Agriculture, 24%
Refineries, 3% Food and beverage, 4%
Paper industry, 2%
Chemical industry, 16%
Other industry, 1%
Distribution
companies, 3%
Health care, 1%Incineration, 3%
Other producers, 2%
Total decentralised,
59%
Figure 16 Current installed thermal capacities, split into different sectors.
Total centralised,
19%
Agriculture, 21%
Refineries, 9%
Food and beverage, 8%
Paper industry, 4%
Chemical industry, 31%
Other industry, 2%
Distribution companies, 2%
Health care, 1%
Incineration, 1%
Other producers, 2%
Total decentralised,
81%

Improving the sustainability of the Brazilian sugar cane industry | April 27, 2012
Page 49 of 58

Improving the sustainability of the Brazilian sugar cane industry | April 27, 2012
Page 50 of 58
Appendix B – São Paulo Mills
Ethanol production (1000 liters)
Rank Plant name
Sugar cane
produciton
(tonnes)
Sugar
production
(tonnes) Anhydrous Hydrous Total
1 são martinho 8.004.221 445.903 183.698 228.293 411.991
2 da barra 7.378.408 499.772 197.458 118.346 315.804
3 equipav 6.518.126 289.893 188.553 158.745 347.298
4 colorado 6.103.406 426.430 22.826 254.110 276.936
5 vale do rosário 5.922.940 359.728 122.050 123.207 245.257
6 santa elisa 5.585.370 324.965 109.979 136.612 246.591
7 colombo 5.152.190 394.074 0 200.093 200.093
8 bonfim 4.785.973 371.412 79.992 113.037 193.029
9 alta mogiana 4.751.584 354.500 72.533 92.387 164.920
10 moema 4.608.925 273.611 87.392 135.468 222.860
11 cruz alta 4.436.982 459.022 3.359 75.233 78.592
12 barra grande 4.376.621 252.122 102.575 128.838 231.413
13 são josé - macatuba 4.222.913 225.576 109.555 138.106 247.661
14 costa pinto 4.180.869 311.705 59.463 107.933 167.396
15 nova américa 4.145.247 320.493 107.175 60.884 168.059
16 catanduva 4.039.739 215.791 88.551 130.266 218.817
17 da pedra 4.006.495 198.300 94.929 125.412 220.341
18 santa cruz s/a 3.808.287 233.425 88.442 80.382 168.824
19 cerradinho 3.752.650 198.247 0 195.597 195.597
20 são joão - araras 3.609.207 210.850 125.552 31.360 156.912

Improving the sustainability of the Brazilian sugar cane industry | April 27, 2012
Page 51 of 58
21 bazan 3.465.583 210.653 141.823 31.245 173.068
22 batatais 3.441.118 245.500 95.962 41.260 137.222
23 moreno - monte aprazivel 3.430.389 77.000 226.640 381 227.021
24 moreno 3.362.408 226.617 120.747 25.617 146.364
25 maracaí 3.332.842 258.000 98.295 25.155 123.450
26 clealco ii 3.280.000 251.774 0 102.541 102.541
27 santa cândida 3.203.283 217.657 104.366 38.070 142.436
28 são josé da estiva 3.190.577 95.084 75.450 124.200 199.650
29 andrade 3.187.694 183.794 56.468 114.413 170.881
30 nardini 3.085.700 172.678 75.471 84.453 159.924
31 clealco 3.058.000 217.833 0 114.648 114.648
32 são manoel 2.923.913 167.632 48.305 92.848 141.153
33 dedini agro. ind. (usina s.
luiz ) pirassunga
2.879.622 252.334 27.401 37.721 65.122
34 junqueira 2.807.153 205.838 73.198 44.641 117.839
35 cocal 2.799.302 229.693 18.325 79.289 97.614
36 iracema - (grupo são
martinho)
2.788.230 109.461 70.143 86.493 156.636
37 bela vista 2.741.388 188.328 77.274 41.658 118.932
38 coplasa 2.722.271 50.680 195.459 0 195.459
39 zanin 2.722.197 163.885 0 127.407 127.407
40 unialco 2.704.795 225.045 72.371 12.562 84.933
41 são joão - sjvb 2.628.024 201.135 0 79.154 79.154
42 mandú 2.621.594 154.009 34.416 98.250 132.666
43 mb 2.600.410 114.707 80.800 65.660 146.460
44 guarani 2.596.691 215.643 41.175 48.164 89.339

Improving the sustainability of the Brazilian sugar cane industry | April 27, 2012
Page 52 of 58
45 cerradinho 2 2.595.949 220.390 87.641 10.209 97.850
46 rafard 2.560.605 189.226 41.108 56.857 97.965
47 univalem 2.507.868 149.919 47.651 76.311 123.962
48 santo antonio - sertaozinho 2.502.150 150.690 95.768 15.847 111.615
49 campestre 2.485.506 95.439 0 140.937 140.937
50 aralco 2.466.804 112.526 5.413 145.119 150.532
51 santa fé 2.462.491 71.650 22.997 140.672 163.669
52 guaíra 2.457.118 176.256 44.617 61.007 105.624
53 são luiz - ourinhos 2.408.912 151.444 0 94.150 94.150
54 florálcool 2.398.566 134.240 0 113.709 113.709
55 companhia energética são
josé
2.391.857 236.006 10.193 44.159 54.352
56 jose bonifácio 2.353.597 184.055 84.507 27.825 112.332
57 continental (ex:case
agroindustrial sertãozinho)
2.312.128 150.667 0 109.450 109.450
58 santa isabel 2 2.288.423 197.912 0 74.699 74.699
59 santa adélia 2.287.562 121.696 107.096 20.965 128.061
60 santa rita 2.283.199 80.114 0 139.390 139.390
61 santa helena - sp 2.217.945 199.481 30.560 33.341 63.901
62 virálcool 2.213.754 146.208 81.996 15.973 97.969
63 santa isabel 2.175.555 154.491 8.194 74.674 82.868
64 pitangueiras 2.166.917 137.717 57.744 46.839 104.583
65 buriti 2.160.573 0 65.329 118.366 183.695
66 alcoazul 2.160.056 57.284 90.566 35.774 126.340
67 interlagos 2.151.099 0 0 184.880 184.880
68 ipaussu 2.096.488 179.409 65.009 958 65.967

Improving the sustainability of the Brazilian sugar cane industry | April 27, 2012
Page 53 of 58
69 nossa senhora - pontal 2.085.297 192.045 17.804 37.225 55.029
70 diamante 2.076.543 149.480 26.797 54.671 81.468
71 são domingos 2.048.717 146.652 53.729 35.816 89.545
72 maringa 2.016.522 76.988 0 117.647 117.647
73 alta floresta 2.011.035 188.985 33.897 20.244 54.141
74 coimbra - são carlos agro.
ltda.
1.993.156 116.510 21.825 72.357 94.182
75 da serra 1.946.169 171.672 9.584 57.431 67.015
76 ester 1.928.069 107.750 0 81.454 81.454
77 antonio ruette 1.921.415 140.251 0 79.508 79.508
78 gasa 1.879.159 50.642 36.779 94.905 131.684
79 paraiso -sp 1.871.486 128.102 0 78.327 78.327
80 agro. espirito santo do
turvo (agrest)
1.870.971 43.402 35.452 79.916 115.368
81 ferrari 1.865.947 115.562 30.187 53.277 83.464
82 cresciumal - coimbra 1.860.165 127.834 48.403 22.922 71.325
83 pioneiros 1.817.674 114.472 37.120 61.196 98.316
84 generalco 1.762.476 0 0 137.155 137.155
85 della coletta 1.752.584 124.863 18.072 53.178 71.250
86 bioenergia (ex: centrálcool) 1.735.210 89.472 12.145 80.085 92.230
87 noroeste paulista (ex:
petribu paulista)
1.725.858 49.062 19.510 95.545 115.055
88 batatais - ii - lins 1.666.156 0 0 144.880 144.880
89 quatá 1.655.766 57.047 69.139 10.513 79.652
90 são francisco - ef 1.640.399 168.936 0 0 0
91 vertente 1.623.561 114.205 28.623 44.911 73.534
92 n.s. aparecida - itapira 1.597.772 81.770 74.025 960 74.985

Improving the sustainability of the Brazilian sugar cane industry | April 27, 2012
Page 54 of 58
93 guariroba 1.585.376 82.599 0 85.035 85.035
94 furlan 1.576.543 116.998 45.525 3.805 49.330
95 santo alexandre 1.549.633 94.550 54.398 18.898 73.296
96 colombo 2 1.548.054 0 0 139.456 139.456
97 iberia 1.507.403 79.393 0 74.448 74.448
98 dois corrego (ex: sta
adelaide)
1.503.376 146.397 16.469 20.264 36.733
99 santa maria 1.489.255 78.014 22.630 43.140 65.770
100 virálcool 2 1.483.216 0 0 126.355 126.355
101 destivale 1.459.427 71.075 19.404 62.263 81.667
102 tamoio 1.414.090 161.200 0 0 0
103 alta paulista 1.413.233 38.716 35.276 56.756 92.032
104 albertina 1.412.904 113.421 22.149 17.960 40.109
105 onda verde (ex. vale do rio
turvo )
1.404.172 98.066 5.287 58.198 63.485
106 decasa 1.399.675 47.227 0 89.226 89.226
107 cevasa 1.382.953 0 85.257 27.307 112.564
108 ipe 1.372.251 0 0 123.535 123.535
109 vista alegre 1.362.067 71.134 10.443 53.354 63.797
110 ipiranga 1.362.005 106.903 0 46.426 46.426
111 iacanga 1.361.542 0 0 120.582 120.582
112 ouroeste açúcar e álcool 1.353.937 56.655 51.942 27.232 79.174
113 alcidia 1.350.442 57.576 8.863 76.979 85.842
114 bom retiro 1.337.204 97.924 0 63.872 63.872
115 mundial (ex. alcomira) 1.318.646 77.301 0 65.822 65.822
116 são francisco - sertãozinho 1.291.223 83.941 0 56.350 56.350

Improving the sustainability of the Brazilian sugar cane industry | April 27, 2012
Page 55 of 58
117 agua bonita 1.290.965 88.920 0 41.978 41.978
118 ibirá 1.269.269 81.639 0 59.223 59.223
119 destil 1.267.243 42.386 0 87.529 87.529
120 santa lúcia 1.260.350 64.215 26.308 29.030 55.338
121 central energética ribeirão
preto
1.231.565 29.834 17.316 64.742 82.058
122 guariganga 1.226.830 0 14.009 82.531 96.540
123 guarani 2 - tanabi 1.187.497 0 0 102.724 102.724
124 branco peres 1.179.606 55.888 38.292 25.901 64.193
125 jardest 1.168.221 85.870 36.875 10.738 47.613
126 dacal 1.150.201 44.385 21.018 42.004 63.022
127 são josé - rio das pedras 1.115.906 92.943 0 21.709 21.709
128 bertolo 1.102.491 58.406 0 51.769 51.769
129 benálcool 1.102.185 74.859 36.876 10.539 47.415
130 londra 1.065.032 0 0 83.464 83.464
131 alcoeste 1.029.462 0 72.432 13.279 85.711
132 monções - vo 1.011.427 79.162 0 5.306 5.306
133 agroind. oeste paulisa -
(agua limpa)
1.010.429 0 55.752 27.946 83.698
134 dracena 970.755 0 85.631 0 85.631
135 cocal ii 947.723 4.989 46.621 20.839 67.460
136 paralcool 945.099 48.337 3.307 46.346 49.653
137 biopav 942.659 8.614 16.374 36.956 53.330
138 santa rosa - boituva 941.191 38.212 0 39.793 39.793
139 nova união - sp 927.041 20.525 0 69.944 69.944
140 pau d'alho 911.000 37.350 0 49.598 49.598
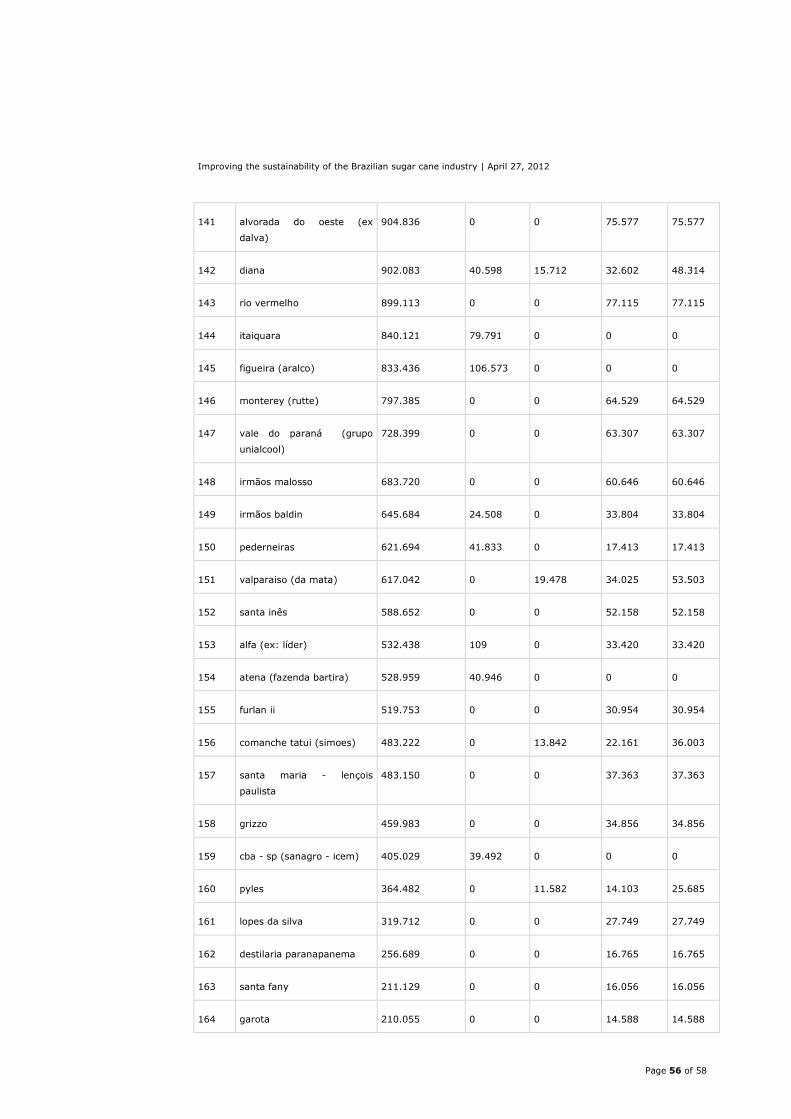
Improving the sustainability of the Brazilian sugar cane industry | April 27, 2012
Page 56 of 58
141 alvorada do oeste (ex
dalva)
904.836 0 0 75.577 75.577
142 diana 902.083 40.598 15.712 32.602 48.314
143 rio vermelho 899.113 0 0 77.115 77.115
144 itaiquara 840.121 79.791 0 0 0
145 figueira (aralco) 833.436 106.573 0 0 0
146 monterey (rutte) 797.385 0 0 64.529 64.529
147 vale do paraná (grupo
unialcool)
728.399 0 0 63.307 63.307
148 irmãos malosso 683.720 0 0 60.646 60.646
149 irmãos baldin 645.684 24.508 0 33.804 33.804
150 pederneiras 621.694 41.833 0 17.413 17.413
151 valparaiso (da mata) 617.042 0 19.478 34.025 53.503
152 santa inês 588.652 0 0 52.158 52.158
153 alfa (ex: líder) 532.438 109 0 33.420 33.420
154 atena (fazenda bartira) 528.959 40.946 0 0 0
155 furlan ii 519.753 0 0 30.954 30.954
156 comanche tatui (simoes) 483.222 0 13.842 22.161 36.003
157 santa maria - lençois
paulista
483.150 0 0 37.363 37.363
158 grizzo 459.983 0 0 34.856 34.856
159 cba - sp (sanagro - icem) 405.029 39.492 0 0 0
160 pyles 364.482 0 11.582 14.103 25.685
161 lopes da silva 319.712 0 0 27.749 27.749
162 destilaria paranapanema 256.689 0 0 16.765 16.765
163 santa fany 211.129 0 0 16.056 16.056
164 garota 210.055 0 0 14.588 14.588

Improving the sustainability of the Brazilian sugar cane industry | April 27, 2012
Page 57 of 58
165 bernadino de campos 157.556 0 0 11.304 11.304
166 jose granelli 122.144 0 0 2.879 2.879
167 foltran 114.237 0 0 3.486 3.486
168 comanche canitar - (clean
energy)
87.539 0 0 7.330 7.330
169 paranapanema ii (bioful
group)
61.807 0 0 4.046 4.046
170 bellão 0 0 0 0 0
171 biosauro 0 0 0 0 0
172 camilo ferrari 0 0 0 0 0
173 central paulista 0 0 0 0 0
174 cespt (ex: archangelo) 0 0 0 0 0
175 citrosuco 0 0 0 0 0
176 coraci 0 0 0 0 0
177 córrego azul 0 0 0 0 0
178 destilaria rosa (boituva) 0 0 0 0 0
179 dulcini 0 0 0 0 0
180 iracema - itaí 0 0 0 0 0
181 santa maria (manduri) 0 0 0 0 0
182 usina renascença 0 0 0 0 0

Improving the sustainability of the Brazilian sugar cane industry | April 27, 2012
Page 58 of 58