improving the international student experienceknowledge.wes.org/rs/317-ctm-316/images/08 - improving...
TRANSCRIPT

Megha Roy Research Associate
Zhengrong Lu Research Associate
Bryce Loo Research Associate
October 2016
08repOrt
IMpRovIng the InteRnatIonaL Student expeRIence:Implications for recruitment and Support

Recommended Citation: Roy, M., Lu, Z., and Loo, B.(2016, October) Improving the international student experience: Implications for recruitment and support
World Education Services, New York. Retrieved from wes.org/RAS

Improving the International Student Experience | © 2016 World Education Services. All rights reserved.
i
taBLe of contentSIntroduction ........................................................................................................................................................................1Key Findings ........................................................................................................................................................................4
Pre-Arrival Expectations ......................................................................................................................................... 4Overall Satisfaction with the U.S. Higher Education Experience ................................................................... 9Satisfaction with Academic Quality ................................................................................................................... 12Value for Money and Likelihood to Recommend ............................................................................................ 14Satisfaction with Career Services ....................................................................................................................... 16Building Social Capital: Challenges and Issues ............................................................................................... 18Other Services: Housing & Financial Support ................................................................................................. 23
Regional and Country Snapshots ................................................................................................................................ 26China ....................................................................................................................................................................... 26India ......................................................................................................................................................................... 27Europe ..................................................................................................................................................................... 28Latin America and the Caribbean ....................................................................................................................... 29Middle East and North Africa (MENA) ................................................................................................................ 30Sub-Saharan Africa ................................................................................................................................................ 31
Implications and Recommendations ......................................................................................................................... 32Implications for Recruitment .............................................................................................................................. 32Implications for Retention .................................................................................................................................. 33Final Thoughts........................................................................................................................................................ 34
Methodology .................................................................................................................................................................... 34Appendix ........................................................................................................................................................................... 35Endnotes ........................................................................................................................................................................... 41References ........................................................................................................................................................................ 42WES Research Reports ................................................................................................................................................... 46

Improving the International Student Experience | © 2016 World Education Services. All rights reserved.
ii
fIguReS and taBLeSFigure 1: Respondents Profile ........................................................................................................................................2Table 1: Institutional Attributes Examined .................................................................................................................3Figure 2: Motivations to Study Abroad for Students Enrolling in the U.S. .............................................................6Table 2: Top 3 Factors that Influenced Student’s Decision to Enroll at a U.S. Institution .................................8Figure 3: Overall Satisfaction with the U.S. Higher Education Experience ......................................................... 10Figure 4: Level of Satisfaction with the Institution’s Academic Quality .............................................................. 13Figure 5: Likelihood to Recommend the Institution ............................................................................................... 15Figure 6: Level of Satisfaction with the Institution’s Career Services .................................................................. 17Figure 7: Level of Satisfaction with the Institution’s Support Services ............................................................... 19Figure 8: The Three Most Significant Challenges You Faced with
Your Experience in Studying in the U.S. ................................................................................................... 22Figure 9: Level of Satisfaction with the Institution’s Campus Facilities .............................................................. 25
acRonyMS
CAO Chief Academic Officer
CPT Curriculur Practical Training
ESL English as a Second Language
HEI Higher Education Institution
IEP Intensive English Program
IIE Institute of International Education
ISB International Student Barometer
MENA Middle East and North Africa
NAFSA Association of International Educators [formerly National Association of Foreign Student Advisors]
OPT Optional Practical Training
ROI Return on Investment
UK United Kingdom
WES World Education Services
Improving the International Student Experience | © 2016 World Education Services. All rights reserved.
iii
executIve SuMMaRy
For higher education personnel who serve international students, understanding the student experience – and doing so holistically – is critical. The experiences and satisfaction levels of international students play crucial roles in the recruitment and enrollment process, not only during students’ tenure on campus, but well into their careers. This is especially true in a highly competitive global education market, where qualified international students from around the globe have their pick of institutions not just in the U.S., but anywhere in the world. In this environment, word-of-mouth recommendations can be a critical part of tipping the balance. The institutions that remain internationally competitive will be those that take the time to 1) understand what international students need to thrive across all aspects of campus and academic life, and 2) implement cross-functional approaches to meeting those needs.
In order to help institutions begin this work, the research team at World Education Services (WES) conducted a study of international students’ experiences at U.S. institutions. In May 2016, we surveyed some 4,683 WES former applicants for foreign credential evaluation. The vast majority are either current students at U.S. institutions, or graduates from as far back as 2010. A small percentage of respondents applied to U.S. institutions but opted to study elsewhere; these respondents were a much smaller focus of our research. Our key findings and top recommendations for action are outlined below.
The most significant and meaningful differences in experience and satisfaction were by world region or major country of origin. Thus, our results are reported mostly in overall numbers and by region or country. We found few meaningful differences by academic level (e.g., undergraduate, graduate), institution type, or institution location.
Key Findings
International Students Are Seeking High Quality Programs That Can Help Them Kickstart Their Careers
• The biggest overall motivator to study abroad is the belief that the education systems in destination countries (in this case, the U.S.) are comparatively better than those in their home countries. This perception was especially prevalent among Sub-Saharan African and Chinese respondents.
• The factor that most often leads students to enroll in a specific U.S. institution is the availability of desired programs, particularly among Indians and Sub-Saharan Africans. (Chinese students look heavily at institutional reputation when deciding upon a U.S. institution.)
• Career and work prospects are huge motivators among almost all groups of students from all over the world.
Not All International Student Groups Have the Same Experience of U.S. Education
Student satisfaction varies depending on where students come from.
• European and Indian students expressed the highest overall satisfaction rates (i.e., indicating that they are “satisfied” or “very satisfied”), followed by Sub-Saharan African and Chinese students.

Improving the International Student Experience | © 2016 World Education Services. All rights reserved.
iv
• Sub-Saharan African respondents indicated that they were “very satisfied” with their experiences more than any other group.
• Students from Latin America & the Caribbean, and Middle East & North Africa (MENA) expressed higher dissatisfaction rates (i.e., indicating “dissatisfied” or “very dissatisfied”) with their educational experiences in the U.S. than did students from other parts of the world.
International Students Are Satisfied With Some Aspects of Their Academic Experience, but Research Opportunities Are Lacking
• Respondents, overall, indicated satisfaction with learning support services (e.g., libraries, computer labs), faculty, and course offerings.
• The greatest degree of dissatisfaction was with the availability of research opportunities.
International Students Who Are Satisfied and View Their Education as a Good Investment Are Often Willing Brand Ambassadors
• A large majority of respondents believe that their U.S. education was a worthwhile investment.
• Graduates who are employed are much more satisfied with their education and more likely to recommend their institutions.
• There is a strong link between overall satisfaction and the likelihood to recommend.
International Students Face Challenges in Building Strong Social Networks
• Students from China, Latin America & the Caribbean, and MENA often indicated trouble with English language proficiency.
• Chinese students in particular noted struggles with developing social and professional connections.
• Sub-Saharan African and MENA students cited discrimination as a major challenge.
• Indian students struggle most with loneliness and homesickness.
Key Services and Supports for International Students Can Be Improved
A thoughtful approach to key student services can significantly improve important aspects of international student experience.
• Of all institutional services, respondents are least satisfied with career services, particularly with the ability of the institution to assist in employment and career advancement.
• Housing and accommodations are another notable source of dissatisfaction for many international students.
• Respondents also expressed a relatively high degree of dissatisfaction with the availability of institutional financial aid and scholarships. The costs of attending a U.S. institution and of living in the U.S. represent the most frequently noted and most substantial challenges for almost all student groups. Sub-Saharan Africans are especially hard pressed on the financial front.

Improving the International Student Experience | © 2016 World Education Services. All rights reserved.
v
Recommendations
Recruitment, retention, and international student satisfaction and success are not exclusive of each other. Each has a tremendous impact on the others. Likewise the work of multiple departments – international enrollment; international student services; academic departments; financial aid; career services; student life, housing, and other student services. All should be involved in efforts to improve the international student experience. In terms of recommendations, our takeaways from the survey are thus both straightforward and demanding.
For enrollment and recruitment managers, the important thing to keep in mind before students even enroll is what happens to them once they arrive on campus. What services and resources are available to them? Are faculty, student services personnel, and facilities management prepared to help international students integrate and experience success? Will the presence of a substantial number of international students from a single country impede cultural acclimatization? When you recruit international students:
• Think beyond student matriculation to the on-campus experiences of students throughout their education and even beyond graduation.
• Match recruitment efforts with available student support services. Students from certain countries and regions will need different (and, in some cases, more robust) services than some others.
• Diversify recruitment sources to avoid having students from one (or two) countries dominating the international student body on campus.
• Enforce transparent communications about the costs of attending the institution, including the cost of living in the local area.
For those in student support services, including the International Student Services Office:
• Assess the international student experience on your campus, and develop a plan to improve services (housing, financial advising, ESL) accordingly.
• Focus particularly on improving career services to students, both through the Career Services Office itself and through other auxiliary services that may be relevant.
• Involve faculty as much as possible, as international students value them highly. Faculty should be aware of and sensitive to international student issues, and training may be a good way to accomplish this.
• Implement programs to help reduce some of the sociocultural challenges – reduced feelings of social connectedness, loneliness, and weak English language skills – that international students face.
Improving the International Student Experience | © 2016 World Education Services. All rights reserved.
1
IntRoductIon
A NOTE ON OUR ANALYSIS
Survey results are broken down by student origin. We compare results for students from the top two countries of origin – China and India – as well as from several major world regions: Europe, Latin America & the Caribbean, the Middle East & North Africa (hereafter referred to as MENA), and Sub-Saharan Africa. In some cases, we also provide results for Canada and Oceania (i.e., Australia and New Zealand), though the number of responses from these regions was low. At the end, there are snapshots featuring key takeaways for each country and region.
Interestingly, we found few differences in findings by academic level (e.g., undergraduate versus graduate). For master’s students, gaining work experience in the U.S. (43 percent) and enhancing career prospects in their home countries (39 percent) are the key drivers. However, although undergraduate students value the experiential aspects of studying in another country and improving English language skills more than do graduate students, undergraduate and graduate students are roughly equally satisfied overall. We found few meaningful differences in satisfaction levels by academic level on various aspects of their U.S. experience throughout the survey.
1. Responses from East, Southeast, South, and Central Asian countries were very low outside of China and India. Thus, separate Asian regions are not included in the results.
For now, the U.S. dominates the worldwide market for international students by a wide margin. However, U.S. higher education institutions (HEIs) face intense and increasing competition. Consider: The global share of international students who chose the U.S. as a destination dropped from 28 percent in 2001 to 22 percent in 2014 (Institute of International Education [IIE], 2015b). Competition for international enrollments within the U.S. is likewise intense: There are more than 4,000 higher education institutions in the U.S.; however, fully half of all international students in the U.S. are enrolled in only 100 universities (IIE, 2015a).
That said, U.S. HEIs of every stripe have ample opportunity to build their international enrollments. One key to doing so is ensuring that international students who enroll at U.S. institutions have a good experience once on campus. International students and alumni who are satisfied can help to grow an institution’s brand worldwide.
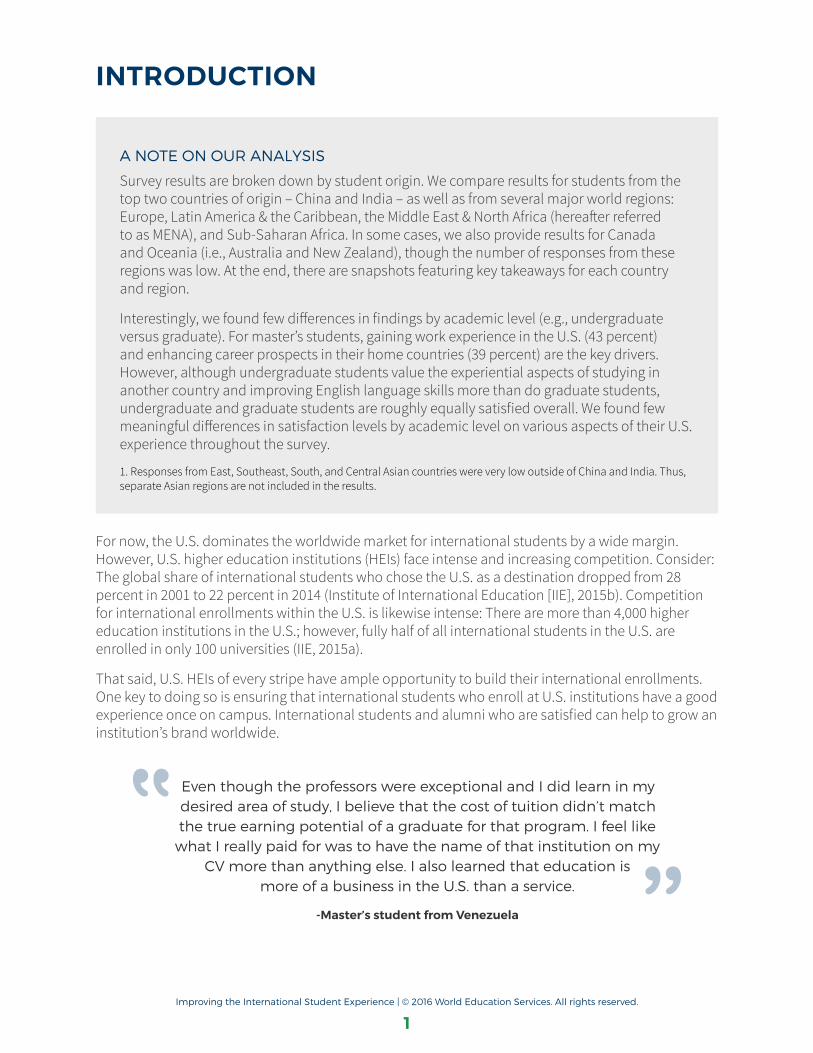
Even though the professors were exceptional and I did learn in my desired area of study, I believe that the cost of tuition didn’t match the true earning potential of a graduate for that program. I feel like
what I really paid for was to have the name of that institution on my CV more than anything else. I also learned that education is
more of a business in the U.S. than a service.
-Master’s student from venezuela
Improving the International Student Experience | © 2016 World Education Services. All rights reserved.
2
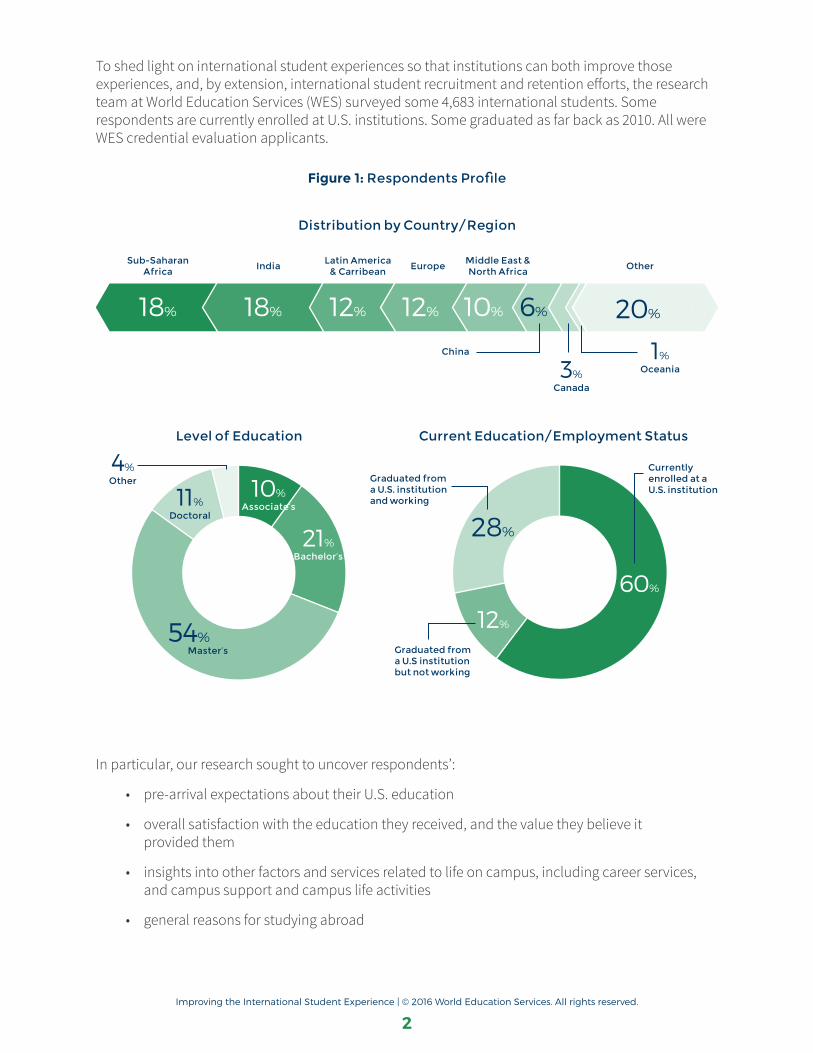
To shed light on international student experiences so that institutions can both improve those experiences, and, by extension, international student recruitment and retention efforts, the research team at World Education Services (WES) surveyed some 4,683 international students. Some respondents are currently enrolled at U.S. institutions. Some graduated as far back as 2010. All were WES credential evaluation applicants.
Figure 1: Respondents Profile
60+12+28+A10+21+54+11+4+A180+180+120+120+100+60+30+10+200=
Distribution by Country/region
Level of education Current education/employment Status
Sub-Saharan Africa
Master’s
Currently enrolled at a U.S. institution
Graduated from a U.S institution but not working
Graduated from a U.S. institution and working
India Latin America & Carribean europe Other
China
Middle east & North Africa
18% 18% 12% 12% 10% 6%
28%
20%
3% Canada
10% Associate’s
60%
12%
11% Doctoral
21% Bachelor’s
4% Other
1% Oceania
54%
In particular, our research sought to uncover respondents’:
• pre-arrival expectations about their U.S. education
• overall satisfaction with the education they received, and the value they believe it provided them
• insights into other factors and services related to life on campus, including career services, and campus support and campus life activities
• general reasons for studying abroad

Improving the International Student Experience | © 2016 World Education Services. All rights reserved.
3
table 1: Institutional Attributes examined
academic Quality campus facilities Support Services career Services
Courses offered in my program
International student orientation programs
Overall support for international students
Help finding on-campus part-time jobs
expertise of facultyOffice of International Student and Scholar Services (ISSS)
Opportunities to participate in social activities within the institution (e.g., travel, sports, cultural events, etc.)
Help finding work or internships during coursework (e.g., Cpt*)
Learning support services (such as library, labs, computer facilities, etc.)
Availability of financial aid and/or scholarships
Opportunities to participate in learning and development activities through campus services such as student clubs/organizations, societies, etc.
Help finding post-graduation jobs or internships (e.g., job fairs, job boards, website, portals, etc.)
Your institution's evaluation of your academic performance (e.g., grading)
english language coursesOpportunities to interact with and learn from students of other cultures
Knowledge among relevant staff of visa regulations related to work and internships (e.g., Opt*, Cpt)
research opportunities
Housing and accommodations
Opportunities to develop professional connections with faculty outside of class
Institutional programs designed to help prepare students for careers (e.g., resume services, mock interviews, mentoring programs, etc.)
Academic advising
Student counseling services
*NOte: Cpt (curricular practical training) and Opt (optional practical training) are two forms of practical job training available to U.S.-based international students holding F-1 visas. See U.S. Immigration & Customs enforcement, 2016 for additional details.
The survey, which was conducted online in May 2016, also asked respondents about the likelihood that they would recommend their institutions, as well as the belief in the value of their U.S. education. This report provides an overview of our findings, and includes a discussion of the main challenges and issues that international students face. It also addresses overall implications for institutions, and provides recommendations for improved student support and more successful international recruitment and retention efforts.

Improving the International Student Experience | © 2016 World Education Services. All rights reserved.
4
Key fIndIngS
PRe-aRRival exPectations
International students come to the U.S. for a variety of reasons: high quality of education, hopes of immigration, return on investment (ROI) in the form of career and job prospects, and more. Understanding these students’ motivations and expectations – especially how they differ by country of origin – is important for institutions seeking to both build international enrollments and better serve students. More formally, this means understanding the push and pull factors that drive students, on the one hand, to leave their home countries and seek opportunities for study in other countries, and on the other, to study in a specific country and enroll in a specific institution.
There are financial reasons for studying in the U.S. You are better placed after study in a Western country, whether within your own country, in the country of study, or elsewhere. Studying in the U.S.
provided wider options for careers, and it was also a stepping stone in pursuit of a global career.
- Master’s student from Zimbabwe
We asked international students who came to the U.S. about both their reasons for seeking education abroad and their reasons for selecting the schools they did. (We asked the first question also of those who did not enroll in the U.S., the results of which are reported after this section.) The main push factors they reported were:
• The belief that they could receive a better quality higher education abroad. Higher quality education is the number one cited reason international students in the U.S. from all countries and regions except Europe and Canada opt to study abroad. The perception that institutions in some other countries are of higher quality than home-country options is especially prevalent among students from Sub-Saharan Africa (70 percent) and China (63 percent). The U.S. is well positioned to receive international students for that reason, as many believe U.S. institutions to be of top quality.
A US degree is valued more than those from any other country.
- doctoral student from pakistan
• The belief that work and career prospects would be improved by studying abroad. Most students value work and career-related issues no matter their country of origin. The ability to gain overseas work experience and enhance career prospects back home are the second (40 percent) and third (37 percent) most common reasons international students cite for considering study outside of their home countries. However, depending on country or region of origin, students tend, by notable margins, to prioritize either gaining work experience outside of the home country or improving career prospects in the home country.

Improving the International Student Experience | © 2016 World Education Services. All rights reserved.
5
Students from India, for instance, value gaining working experience outside the home country over improving career prospects at home (52 percent versus 40 percent). Likewise, students from Europe value the opportunity for professional experience abroad over potential impact on career prospects at home by a margin of 12 percent (38 percent versus 26 percent). By contrast, improving career prospects at home is more important for students from Canada (49 percent versus 34 percent) and MENA (40 percent versus 28 percent), indicating that students from these countries and regions often intend to return to their home countries in time.
An international education could allow me to work anywhere in the world and then return home.
- Master’s student from India
• Better opportunities to improve language skills, particularly English. Just over one-fourth of students from MENA and Europe (26 percent each) who enrolled in the U.S. said “improv[ing] my English or other language skills” is one of the top reasons that they chose to study abroad. Similarly, 23 percent of students from Latin America & the Caribbean cited linguistic skills as a top rationale. These findings track with existing research. According to the World Economic Forum (Torkington, 2016), about 1.5 billion students worldwide are learning English as a second language, compared to 126 million learning Chinese, French, or Spanish. The U.S., as the largest predominantly English-speaking country in the world, is an important destination for English language learning, including through intensive English programs (IEPs). In 2014, Saudis were the largest international student segment in IEPs by a wide margin at 32,557, followed by China (18,525) and Brazil (14,070) (IIE, 2015a). Other European, Latin American, and MENA countries supply large numbers to IEP programs as well, landing in the top 15. In order, these countries are: Mexico, Kuwait, Colombia, Venezuela, Turkey, Spain, and France.
• The possible pathway for immigration to another country (or staying long-term or permanently) following studies. In comparison to all student groups, European students show a high desire to emigrate in the future compared to overall students (16 percent versus 9 percent). European students’ comparatively high interest in emigration may be due in part to high youth unemployment rates in some countries (Statista, 2016a, 2016b) and to the relative strength, by contrast, of the U.S. economy and job market, in the case of these students. That being said, the reasons behind the finding are not entirely clear, especially given that China, India, and Sub-Saharan Africa experience far greater emigration more generally speaking. However, in the case of international students in the U.S., this finding seems to be corroborated by previous research (Hazen & Alberts, 2006). Hazen and Alberts speculate that the reason for the apparent discrepancy has to do with the mix of students and the needs and opportunities of elites of African and Asian countries who are more likely to come to the U.S. than elites from Europe, and these elite students are more likely to return home to good opportunities. The motivations for international students to return to China may be somewhat different. Much of the growth in Chinese enrollments in U.S. institutions has been driven by students from China’s growing middle class. Many of these students may hope to leverage their U.S. educational credentials to increase their chances of getting a good job

Improving the International Student Experience | © 2016 World Education Services. All rights reserved.
6
back home in China. Non-European students may also perceive barriers to immigration or to securing long-term employment in the U.S. (e.g., through H1-B visas) that European students do not (Hazen & Alberts, 2006). We saw some evidence of this in our research. Some Indian respondents to the WES survey, for example, cited the lack of ability to work in the U.S. after graduation as a challenge. One, for example, described this challenge as “reduced employment opportunities for international students because of work visa [restrictions].”
Figure 2: Motivations to Study Abroad for Students enrolling in the U.S.
57+43+F37+63+F14+86+F7+93+F
40+60+F29+71+F9+91+F
57%Overall
37%Overall
14%Overall
7%Overall
40%Overall
29%Overall
9%Overall
Better education outside my home country
Opportunity to improve my career prospects in my home country
Improve my english or other language skills
Financial aid provided by government and/or employer
most valued in:
most valued in:
most valued in:
most valued in:
most valued in:
most valued in:
most valued in:
Sub-Saharan Africa 70%
China 63%
India 60%
Canada 49%
Oceania 47%
Sub-Saharan Africa 45%
Middle East & North Africa
26%
Europe 26%
Latin America & Caribbean
23%
Middle East & North Africa
15%
Canada 10%
Oceania 8%
India 52%
Sub-Saharan Africa 45%
China 39%
Oceania 42%
Europe 38%
China 36%
Europe 16%
Oceania 13%
Latin America & Caribbean
12%
Opportunity to gain work experience outside home country
Opportunity to experience living in a foreign country
pathways to immigration in the future
Q: please select the two most important reasons that led you to seek opportunities to study abroad.
A: top 3 countries/regions which selected each reason the most .

Improving the International Student Experience | © 2016 World Education Services. All rights reserved.
7
We asked students to name their top three reasons for selecting a particular U.S. institution. The pull factors we discovered were as follows:
• The top pull factor for respondents from all regions was the availability of a desired program. Fifty-nine percent of all international students selected this factor. In particular, Indian (64 percent) and Sub-Saharan African (63 percent) students look at specific programs when deciding. The variety of types of degrees and programs is likely one of the most attractive aspects of U.S. higher education.
• Chinese students focus very heavily on institutional reputation. Sixty-one percent cited it as a top factor. This finding corresponds with anecdotal reports and with previous WES research (see Chang, Schulmann, & Lu, 2014; Lu & Schulmann, 2015). Overall, it was the second most important factor for all international students, with 43 percent citing it.
• For Sub-Saharan students (45 percent) and European students (43 percent) in particular, “earning potential after graduation” is one of the most influential factors when students decide where to enroll. At 42 percent, it also the third most cited pull factor overall. Career goals are a strong driver for international students.
We also discovered some important nuances in terms of the relative importance of location and cost in students’ decision-making processes.
• The location of an institution is a relatively less important factor for most international students (27 percent). However, among students who value the experience of studying abroad, location is much more important than for students from other regions. Forty percent of Chinese students, 38 percent of European students, and 33 percent of Latin American & Caribbean students – the regions and countries for which the experiential aspects of study abroad are important – indicated that location was one of their top three factors. In addition, 45 percent of the Canadian students also found location important. Location can encompass many different factors, including the size of the municipal or metropolitan area, proximity to a major city, amenities in the area (i.e., fun things to do), nearby family, and opportunities for internships and jobs, among others.
• Perhaps surprisingly, “cost of study” and “availability of financial aid/scholarships” were of relatively low importance to most international students. Overall, only 17 percent and 29 percent of respondents respectively selected these as one of their top factors. It is likely that most international students coming to the U.S. are aware of the costs of attending and of the limitations of receiving aid. However, as we will show later, these are still major areas of dissatisfaction among current and former international students. As a result, institutions should pay attention to these issues.

Improving the International Student Experience | © 2016 World Education Services. All rights reserved.
8
table 2: Top 3 Factors that Influenced Student’s Decision to Enroll at a U.S. Institution
china India europe Latin america & caribbean
Middle east & north africa
Sub-Saharan africa
161% 64% 56% 58% 58% 63%
Institution’s reputation
Availability of a desired
program
Availability of a desired
program
Availability of a desired
program
Availability of a desired
program
Availability of a desired
program
248% 49% 43% 43% 42% 45%Availability of a desired
program
Institution’s reputation
earning potential after
graduation
Institution’s reputation
Institution’s reputation
earning potential after
graduation
340% 41% 38% 41% 38% 39%Institution’s
locationAvailability of research
opportunities
Institution’s location
earning potential after
graduation
earning potential after
graduation
Availability of financial aid/ scholarships
Q: Please select the three most important factors that influenced your decision to enroll at a U.S. Institution.
MOTIVATIONS FOR STUDYING ABROAD: LIVING IN A FOREIGN COUNTRY
In addition to those who enrolled in U.S. institutions, we surveyed respondents who enrolled in institutions outside of their home countries and outside of the U.S.. Of these individuals, 18 percent enrolled in institutions in the U.K., 17 percent in Canada, six percent in Australia, and four percent in Germany.
The top motivation for studying abroad among this subset of students was the experience of living in a foreign country (50 percent). By contrast, only 29 percent of those enrolled in the U.S. cited the experience of living in another country as a top motivation. There are several possible explanations for this difference. One is simply that the U.S. is more valued for its educational system and the career opportunities that emerge from U.S. study, rather than the experience of living there. The top motivation for those who study in the U.S. is that they can receive a better quality education than at home, at 57 percent. Another explanation is that some international students may already feel familiar with U.S. culture through media (i.e., Hollywood movies, television shows, music, news programs), food (e.g., McDonalds), or other American cultural exports. Thus, some may feel that living in the U.S. would be less of an interesting cultural experience than living in a less familiar country.
Aside from the experience of living in another country, most of the other top motivations among this subset of students were the same – the relatively better quality of the education systems in some other countries and the chance to better career prospects.

Improving the International Student Experience | © 2016 World Education Services. All rights reserved.
9
WHY NOT THE U.S.?
We asked respondents who chose not to enroll in a U.S. institution to explain their reasoning. The number one reason among written responses was the expense of studying in the U.S., explained by about 28 percent of respondents. The next most common response had to do with location of residence at the time of application; many students simply chose to stay where they were, whether in their home country or in another country. The third most common answer was denial of admission to either the students’ top school choices or all of the schools to which they applied. Other common responses were better offers of admission and/or financial aid in other countries, the desire to study in a country other than the U.S. (e.g., due to the desire to become immersed in a particular culture), and difficulties in obtaining a U.S. student visa. Among students who wanted to go to other countries, some had previous experience with the U.S. already, such as previous education or work experience.
oveRall satisFaction with the U.s. higheR edUcation exPeRience
I had a good experience, and it was worth the time and money.”
- Master’s student from Brazil
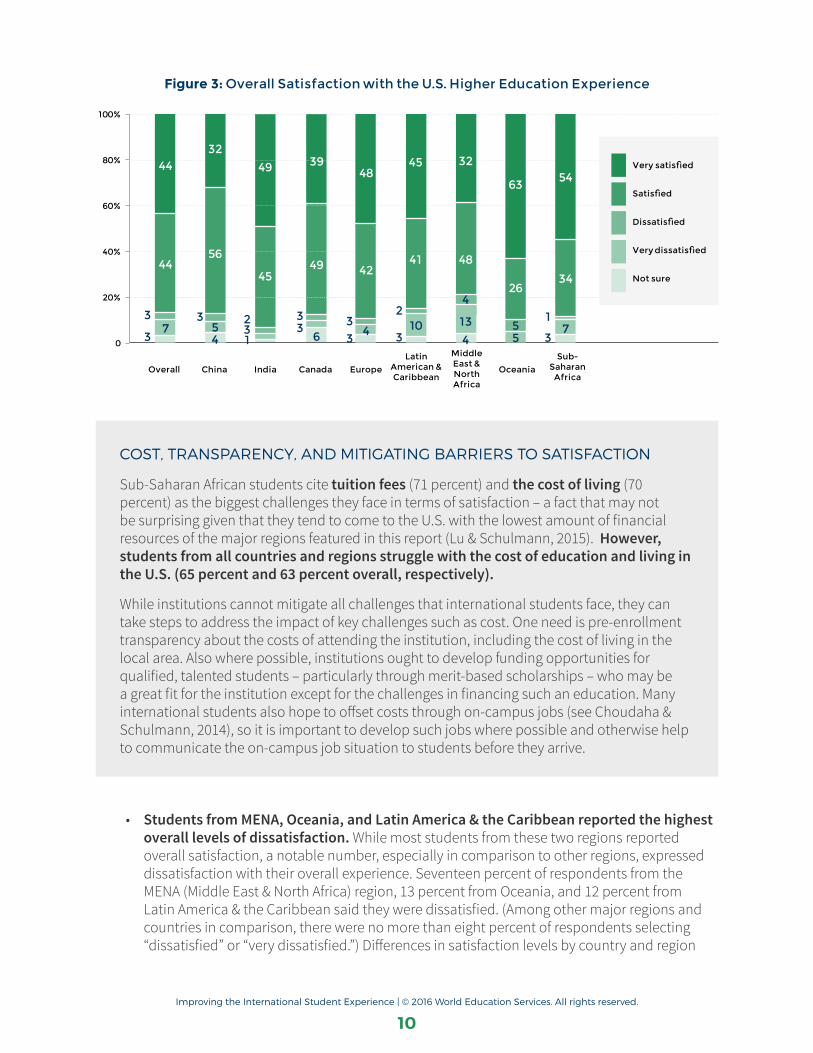
International student alumni can be an institution’s biggest brand ambassadors overseas, particularly if they have a good overall experience. Overall, the vast majority of international students we surveyed are satisfied with their U.S. educations. However, several notable differences in satisfaction levels emerged:
• By country or region of origin, the most satisfied students overall are from India and Europe, with sub-Saharan Africans and Chinese students close behind. Ninety-four percent of Indian respondents said they were “satisfied” or “very satisfied” with their U.S. educations overall, the highest satisfaction rating from any country or region. Similarly, 90 percent of Europeans indicated the same. These results largely correspond to results from the International Student Barometer (ISB) – a large-scale survey of international students at selected universities in the U.S., U.K., and Australia – in 2014, which shows that European students tend to be most satisfied in these destinations (Garrett, 2014), and that Indians are among the most satisfied from non-Western countries. Garrett notes that likely reasons for the general high levels of satisfaction among these students are strong knowledge of the English language and, in the case of Europeans, familiarity with fellow Western cultures. Sub-Saharan African and Chinese students also report high levels of satisfaction, at 88 percent overall each.1
• Out of all regions and countries, Sub-Saharan Africans were most likely to indicate that they were “very satisfied” [emphasis added]. Some 54 percent of respondents from Sub-Saharan Africa reported high satisfaction rates, versus 49 percent for the next highest, Indian students. While the exact reasons for this are unclear, it’s easy to speculate that a quality gap may be at play: Perhaps out of any world region, Sub-Saharan Africa has the biggest issues with both access to and quality of domestic higher education institutions, and it is one of the most rapidly growing regions of the world (UNFPA, 2014). As a result, U.S. education may be even more rewarding for Sub-Saharan Africans than for students from other regions and countries.
Improving the International Student Experience | © 2016 World Education Services. All rights reserved.
10
Figure 3: Overall Satisfaction with the U.S. Higher education experience
Canada
33
6
39
49
India
32
1
49
45
100%
80%
60%
40%
20%
0
OverallLatin
American & Caribbean
Middle east & North Africa
OceaniaSub-
Saharan Africa
Very satisfied
Satisfied
Dissatisfied
Very dissatisfied
Not sure
44
44
73
3 310 13
2 15 75
4
43
China
354
32
56
europe
33
4
48
4241
45 32
48
63
26
54
34
COST, TRANSPARENCY, AND MITIGATING BARRIERS TO SATISFACTION
Sub-Saharan African students cite tuition fees (71 percent) and the cost of living (70 percent) as the biggest challenges they face in terms of satisfaction – a fact that may not be surprising given that they tend to come to the U.S. with the lowest amount of financial resources of the major regions featured in this report (Lu & Schulmann, 2015). However, students from all countries and regions struggle with the cost of education and living in the U.S. (65 percent and 63 percent overall, respectively).
While institutions cannot mitigate all challenges that international students face, they can take steps to address the impact of key challenges such as cost. One need is pre-enrollment transparency about the costs of attending the institution, including the cost of living in the local area. Also where possible, institutions ought to develop funding opportunities for qualified, talented students – particularly through merit-based scholarships – who may be a great fit for the institution except for the challenges in financing such an education. Many international students also hope to offset costs through on-campus jobs (see Choudaha & Schulmann, 2014), so it is important to develop such jobs where possible and otherwise help to communicate the on-campus job situation to students before they arrive.
• Students from MENA, Oceania, and Latin America & the Caribbean reported the highest overall levels of dissatisfaction. While most students from these two regions reported overall satisfaction, a notable number, especially in comparison to other regions, expressed dissatisfaction with their overall experience. Seventeen percent of respondents from the MENA (Middle East & North Africa) region, 13 percent from Oceania, and 12 percent from Latin America & the Caribbean said they were dissatisfied. (Among other major regions and countries in comparison, there were no more than eight percent of respondents selecting “dissatisfied” or “very dissatisfied.”) Differences in satisfaction levels by country and region
Improving the International Student Experience | © 2016 World Education Services. All rights reserved.
11
are likely driven by a range of factors, including real and perceived treatment by local faculty, staff, fellow students, and community members; cultural barriers; linguistic challenges; and financial struggles fueled in part by currency fluctuations and other issues outside students’ control. Understanding these differences and the possible underlying factors, both at a general macro level and at one’s specific institution, is vital for targeting programming for international students.
The quality of education was abysmal, and that university was all about the money.
- Master’s student from Iran
• The location of an institution had a significant impact on student satisfaction. As mentioned earlier, 27 percent of all respondents say that location was an important factor in deciding where to study in the U.S. Students at rural institutions are the least satisfied with their overall experience in terms of institution location. Fourteen percent of rural college students expressed “strong dissatisfaction” with their overall U.S. education experience, compared with six percent for all other location types (i.e., urban, suburban, town). This may likely be related to the relative lack of opportunities, particularly in terms of jobs, internships, and general career development, in the area. Rural institutions may need to invest more in developing opportunities for students outside of the local area, such as cultivating relationships with employers in nearby larger towns and cities, in order to provide internship and job pathways.
• .
A NOTE ON LANGUAGE
Nearly 14 percent of the students from MENA are dissatisfied with the English language courses provided by the institution. This is despite the fact that one of the most important reasons mentioned by students from MENA who come to study in the U.S. is to improve their English skills. Students from other regions are largely satisfied with ESL offerings, though 31 percent of European students cited “unsure” about their satisfaction levels regarding English language courses, suggesting that many do not use such services. This may be due to native or strong English language abilities upon matriculation among many European students.
The institution prepares students for academic life in the U.S. However, it has some drawbacks. For example, there is a lack of
speaking skills preparation while concentrated on writing skills and focus on homework and assignments rather than practicing the
English language in real life.
- Master’s student from Saudi arabia

Improving the International Student Experience | © 2016 World Education Services. All rights reserved.
12
satisFaction with academic QUality
Survey respondents rated academic offerings and the academic quality of their U.S. educational experiences more highly than any other aspect. However, we still saw room for improvement. In particular, many institutions can do more to connect international students with research opportunities – an experience many international students may see as an important step in career development.
My university provided a wide variety of courses within my field which gave me the chance to experience even more
aspects related to my career.”
- Master’s student from Saudi arabia
Survey respondents reported satisfaction levels for various aspects of their academic experiences:
• Learning support services – such as libraries, laboratories, and computer facilities – are rated the highest among academic aspects of institutions. Such services are the highest rated aspect of academics across countries and regions, with 57 percent expressing strong satisfaction. This appears to be one area in which U.S. institutions are doing a good job. In a 2016 Inside Higher Ed survey, chief academic officers (CAOs) of U.S. colleges and universities also rated their academic support services highly, with 57 percent rating library services as “very effective” (Jaschik & Lederman, 2016). This likely reflects prioritized spending on such facilities.
• Faculty expertise is also highly rated. Over half of respondents (52 percent) cited that they were “very satisfied” with faculty expertise at their respective institutions. Faculty, of course, are central to the academic experience for students at any institution. The perceptions of the high quality of U.S. institutions may be related to perceptions of the high quality of faculty themselves.
• Most students were also satisfied with the course offerings. Forty-seven percent were “very satisfied,” and 45 percent were “satisfied.” Consistent with other areas of academic quality, Sub-Saharan African (95 percent overall satisfaction) and Indian (94 percent) students are the most satisfied.
• While there was high satisfaction with course offerings overall, students from MENA and Oceania expressed a higher level of dissatisfaction. More than 10 percent of students from Oceania and MENA each were “dissatisfied” or “strongly dissatisfied” with the courses offered in the program. On this front, it’s of note that meeting academic demands is a significant challenge for students from the MENA region (26 percent), relative to students from other regions (18 percent). This is likely related strongly to English language challenges (discussed below), as well as differences in academic culture between MENA countries and the U.S. Previous research has shown that, for example, almost 40 percent of Saudi students come with relatively low academic preparation for U.S. higher education, particularly in requisite language skills (Choudaha, Chang, & Schulmann, 2013; see also Loo, 2015). Recruiters should make sure that strong academic support services, including intensive English programs (IEPs) and general English language support, are in place before recruiting heavily from MENA countries.

Improving the International Student Experience | © 2016 World Education Services. All rights reserved.
13
• The availability of research opportunities is the lowest rated, but it is still a high rating. The availability of research opportunities received the lowest rating among all the aspects of academic quality. It had an 83 percent overall satisfaction rate, compared to the next lowest – courses offered within the respondent’s program – with a 92 percent overall satisfaction rate. Likewise, there were higher overall dissatisfaction rates with this relative to other academic factors, with MENA (16 percent) and Canadian (14 percent) students expressing the most dissatisfaction. Also, a larger number of respondents cited that they were “unsure,” compared with other related factors, suggesting that for some students, research opportunities are not a high priority.
One of my biggest challenges is the unavailability of campus or graduate research work opportunities.”
- doctoral student from the united Kingdom
Figure 4: Level of Satisfaction with the Institution’s Academic Quality
93+7+F84+16+F
92+8+F 93%Overall
84%Overall
92%Overall
Your Institution’s evaluation of Your Academic performance (e.g., Grading)
research Opportunities
Courses Offered in My program
Most satisfied in: India - 95%
Least satisfied in: Middle East & North Africa - 88%
Most satisfied in: Sub-Saharan Africa - 90%
Least satisfied in: Middle East & North Africa - 78%
Most satisfied in: Sub-Saharan Africa - 95%
Least satisfied in: Middle East & North Africa - 86%
Q1: please indicate the degree of satisfaction with your institution’s academic quality?
A1: percent of overall students for whom each category is “very satisfied” and “satisfied”
Q2: please indicate the degree of satisfaction with your institution’s academic quality?
A2: top country/region and lowest country/region for whom each category is “very satisfied” and “satisfied”
Oceania & Canada have been excluded.
94+6+F94%Overall
expertise of Faculty
Most satisfied in: Sub-Saharan Africa - 97%
Least satisfied in: Middle East & North Africa - 87% 93+7+F93%
Overall
Learning Support Services (such as Library, Labs, Computer Facilities, etc.)
Most satisfied in: Sub-Saharan Africa - 96%
Least satisfied in: Middle East & North Africa - 89%

Improving the International Student Experience | © 2016 World Education Services. All rights reserved.
14
valUe FoR money and liKelihood to Recommend
Word-of-mouth referrals from international graduates are tied to the belief that their U.S. educational experiences were worthwhile, particularly in regards to their current or future careers. From this perspective, it’s thus critical to understand how students assess the value of their U.S. studies; the likelihood that they will recommend their institutions to others, particularly family, friends, and other compatriots; and how those factors intersect.
What we learned was:
• The vast majority of students believe that their U.S. education is a good investment. On average, 94 percent of our respondents said that they “agree” or “strongly agree” with the statement, “Overall, I believe studying in the U.S. was a good investment for my future.” (Students from Canada, MENA, and Oceania are twice as likely as students from other regions to “disagree” or “strongly disagree” with this statement.) There appear to be no differences based on the amount of time since students completed their degrees.
I would like to share my experience with my friends in my home country and encourage them to apply to the same institution.
- Master’s student from Jordan
• The vast majority of respondents, 93 percent, feel confident about their career prospects after studying in the U.S. Satisfaction levels were particularly high among Sub-Saharan African students, 70 percent of whom “strongly agree” with the statement, “I feel positive about my career prospects and employability.” This may also indicate the prestige associated with a U.S. degree among African students and employers alike.
• Students are more likely to recommend an institution if they are more satisfied with their overall education experience. Overall, 52 percent are “very likely” to recommend their institutions. However, out of the students who are “very satisfied” with their overall U.S. education experience, 79 percent are “very likely” to recommend their institutions. The key takeaway: Satisfied students are much more likely to be strong brand ambassadors.
• Among graduates, perception of the value of a U.S. education is contingent on employment status. This finding is perhaps unsurprising, but, given the prevalence of international students’ tendency to view their study in the U.S. as an investment that will generate career and financial dividends, it’s worth an analysis. Students expect a strong return on investment (ROI) in the form of career placement and advancement, and those who have graduated and are not employed are more likely to be frustrated by the time, financial resources, and energy that went into a U.S. education that has not yet paid off. Students who have graduated and are not employed are generally less satisfied with their U.S. education, compared with those who are employed. There was a 50 percent overall strong satisfaction rate among working graduates versus 39 percent among non-working graduates. Additionally, those employed in the U.S. are more satisfied overall (91 percent overall satisfaction rate) than those employed in their home countries (86 percent) and in third countries (79 percent). The more an institution can help students with job placement and career advancement, regardless of where the student lives, the more it can make a positive impact (see Loo, 2016).

Improving the International Student Experience | © 2016 World Education Services. All rights reserved.
15
Figure 5: Likelihood to recommend the Institution
Very likely
likely
Unlikely
Very unlikely
Not sure
52%
37%
4%
4%
3%
79%
16%
1%
3%
1%
Overall respondents Respondents selecting “very satisfied” for overall educational experience in the U.S.
520+480370+63040+96040+96030+970
790+210
10+990
10+99030+970
160+840
WORD OF MOUTH RECOMMENDATIONS: VARIATIONS BY PLACE OF ORIGIN
Students from certain countries or regions are more likely to recommend their institutions than others. Students from developing regions such as Sub-Saharan Africa (93 percent), India (93 percent), Latin America & the Caribbean (90 percent), and China (88 percent) are more likely to recommend U.S. institutions, while students from more developed regions such as Europe (84 percent), Canada (79 percent), and Oceania (74 percent) are slightly less likely to recommend. This may be partly due to the comparable quality of higher education in other developed countries, such as Australia, Canada, and Western European countries (and which, in many cases, may be less expensive than a U.S. education) (see Maslen, 2014; Stanek, 2014). These students may have much higher expectations about the experiences at a U.S. college or university, particularly considering the expense that many of them face when coming to the United States. In contrast, and as mentioned before, students from developing regions appear more likely to believe that the U.S. higher education system is of comparatively better quality than the systems in their home countries.
Great program! And cost of education for the caliber of the school is pretty great.
- Bachelor’s student from India
The same degree is stronger back home. And here, it is too expensive.
- Bachelor’s student from the united Kingdom
Improving the International Student Experience | © 2016 World Education Services. All rights reserved.
16
satisFaction with caReeR seRvices
Out of all the areas for which students were surveyed, career services could perhaps use the most improvement. In particular, offices should invest more time and resources in helping students land jobs and advance careers, whether in the U.S. or abroad.
Given the relative importance of students’ career expectations to their overall satisfaction rates and willingness to make recommendations, a deeper understanding of international students’ experience of career services is important for both retention and recruitment efforts.
I personally felt that my school offered exceptional components but fell short in tying them all in an overall experience. For example, the program featured some phenomenal
professors and academic support, but the university’s career services department left much to be desired.
- Master’s student from Israel
• Students rated internal support programs and services – i.e., the Career Services Office and the services it provides – highly. Institutional programs designed to help prepare students for careers (e.g., resume services, mock interviews, mentoring programs) (76 percent overall satisfaction rate) and staff knowledge of work authorization regulations (70 percent) received higher ratings than other career services aspects.
• Overall, Career Services received more ratings of dissatisfaction than other campus services, though still relatively small. This may reflect the expectations that students have about the conversion of their American degree into meaningful work and career opportunities. This point matches previous WES research (conducted jointly with NAFSA: Association of International Educators), which shows that Career Services is a top area of dissatisfaction among undergraduate international students (Choudaha & Schulmann, 2014). Similar challenges were found among international students studying in universities in Australia (Australian Government Department of Education and Training, 2015) and the U.K. (Cappuccini et al., 2005). It appears that for international students in multiple countries, career services are crucial because one of the largest incentives for studying abroad is improving career prospects and opportunities.
• Students need additional support with actual job placement. Assistance in finding actual jobs (or internships) during study or after graduation received relatively low ratings (61 percent and 64 percent overall satisfaction rates respectively), especially among students from Canada and MENA. This corresponds with perceptions among institutional officers who work on career services for international students, who say that students often have unrealistic expectations about how enrollment in U.S. institutions will affect their access to jobs and internships (Loo, 2016). The disconnect and the dissatisfaction it causes tends to be amplified by employers, who may be reticent about hiring international students because of complexities around work authorization.

Improving the International Student Experience | © 2016 World Education Services. All rights reserved.
17
Figure 6: Level of Satisfaction with the Institution’s Career Services
76+24+F64+36+F60+40+F
70+30+F61+39+F
76%Overall
64%Overall
60%Overall
70%Overall
61%Overall
Institutional programs designed to help prepare students for careers (e.g., resume services, mock interviews, mentoring programs, etc.)
Help finding post-graduation jobs or internships (e.g., job fairs, job boards, website, portals, etc.)
Help finding on-campus part-time jobs
Knowledge among relevant staff of visa regulations related to work and internships (e.g., Opt, Cpt)
Help finding work or internships during coursework (e.g., Cpt)
Most satisfied in: India - 85%
Least satisfied in: Middle East & North Africa - 68%
Most satisfied in: India - 72%
Least satisfied in: Europe - 53%
Most satisfied in: India - 69%
Least satisfied in: Middle East & North Africa - 51%
Most satisfied in: India - 87%
Least satisfied in: Europe - 61%
Most satisfied in: India - 72%
Least satisfied in: Europe - 53%
Q1: please indicate your degree of satisfaction with the following institutional career preparation services to help you achieve career and employment goals
A1: Percent of overall students for whom each category is “very satisfied” and “satisfied”
Q2: please indicate your degree of satisfaction with the following institutional career preparation services to help you achieve career and employment goals
A2: Top country/region and lowest country/region for whom each category is “very satisfied” and “satisfied”
Oceania & Canada have been excluded.

Improving the International Student Experience | © 2016 World Education Services. All rights reserved.
18
BUilding social caPital: challenges and issUes
We also investigated international students’ experience with other collegiate experiences related to ability to build “social capital” and integrate into campus life. Social capital refers to robust local relationships from which students can draw support and has been shown to be crucial for international students to experience success in their new host country (Neri & Ville, 2008; Hess, 2016; see also Andrade, 2006).
• The majority of students from all the countries and regions are highly satisfied with the opportunities for them to learn from students of different cultures. In other words, most international students like the ability to interact with both American students and other international students of various backgrounds. There is only about a seven percent overall dissatisfaction rate with this factor. One notable exception is students from MENA, who while overall are satisfied, are more likely to express dissatisfaction (14 percent overall dissatisfaction rate).
It was a great experience studying with people from multicultural backgrounds; it certainly adds to the stock of learning experience, and for that reason, I would likely recommend to others from my country if
they have the chance to take advantage of the opportunity.
- Master’s student from ghana
• There is a relatively high rate of dissatisfaction with the opportunities to network with faculty outside of class. Overall, 12 percent of students are “dissatisfied” or “very dissatisfied” with such available opportunities, especially for Chinese students (18 percent). It appears that while classroom interactions with faculty may be seen positively, some international students do not feel that they have adequate access to professors during office hours or other times outside of class. Others may not know how to approach faculty members in such a context, perhaps because of the academic or cultural environment from which some students, such as Chinese students, come.

Improving the International Student Experience | © 2016 World Education Services. All rights reserved.
19
Figure 7: Level of Satisfaction with the Institution’s Support Services
86+14+F86%Overall
Opportunities to interact with and learn from students of other cultures
Most satisfied in: Sub-Saharan Africa - 91%
Least satisfied in: Middle East & North Africa - 81%
Q1: please indicate the degree of satisfaction with the following aspects of your institution’s support services for international students.
A1: Percent of overall students for whom each category is “very satisfied” and “satisfied”
Q2: please indicate the degree of satisfaction with the following aspects of your institution’s support services for international students.
A2: Top country/region and lowest country/region for whom each category is “very satisfied” and “satisfied”
Oceania & Canada have been excluded.
79+21+F79%Overall
Opportunities to develop professional connections with faculty outside of class
Most satisfied in: Sub-Saharan Africa - 85%
Least satisfied in: Latin America & Caribbean - 74%
82+18+F82%Overall
Opportunities to participate in learning and development activities through campus services such as student clubs/organization, societies, etc.
Most satisfied in: India - 90%
Least satisfied in: Middle East & North Africa - 74%
81+19+F81%Overall
Overall support for international students
Most satisfied in: India - 92%
Least satisfied in: Latin America & Caribbean - 77% 80+20+F80%
Overall
Opportunities to participate in social activities within the institution (e.g., travel, sports, cultural events, etc.)
Most satisfied in: India - 87%
Least satisfied in: Europe - 75%
I have experienced difficulty in developing a professional network.
- Master’s student from china
• English language proficiency is the biggest challenge for students from China (48 percent), the MENA region (38 percent), and Latin America & the Caribbean (32 percent), compared to the overall level at 24 percent. These countries and regions are dominated by widely-spoken languages: Chinese (predominantly Mandarin), Arabic, and Spanish and Portuguese,

Improving the International Student Experience | © 2016 World Education Services. All rights reserved.
20
respectively (see Torkington, 2016). English is much less often an official language or lingua franca in these regions than in other areas of the world, such as Europe, India, and Sub-Saharan Africa. It likely also reflects the quality of English language teaching within many of these countries. Strong English skills, particularly spoken English, are critical for developing relationships with local students and the community, networking with potential employers, and building social capital.
• Discrimination based on nationality, ethnicity, or similar factors is a particular challenge for students from Sub-Saharan Africa (24 percent) and the MENA region (21 percent), compared to the average (16 percent). This is perhaps unsurprising for these two groups, considering the racial history of (and contemporary events in) the U.S. (for Sub-Saharan Africans, in particular) and geopolitical realities following the September 11th attacks of 2001 (for MENA students). Discrimination of course can be real or perceived, and many of these students may enter the U.S. with perceptions about how Americans view individuals from Africa or the Middle East (or the Islamic world more broadly). While there is little that an institution can do to mitigate acts of prejudice or discrimination on a day-to-day basis off-campus, there is much that it can do to educate its campus community about and provide opportunities for dialog on inclusion for racial, ethnic, and religious minorities and for international students.
• Chinese students have the biggest difficulty in developing social connections in the U.S. (60 percent), by a much wider margin than do students from other countries and regions (33 percent overall). This may be partly the result of important cultural differences, particularly between the more individualistic American culture and the more collectivist Chinese culture (see Hofstede, Hofstede, & Minkov, 2010). However, another important contribution to this factor may simply be the sheer number of Chinese students that have appeared on many American campuses (see Redden, 2015; Belkin & Jordan, 2016). A significant number of Chinese students on one campus can create a bubble effect, in which Chinese students are often surrounded by – incidentally or intentionally – other Chinese students and never make friends with American students or students from other countries in general. Some research (e.g., Zhao, Kuh, & Carini, 2005) even suggests that Asian students, including Chinese, favor spending time with co-nationals over students from other cultures, including Americans, more so than do other international student groups. All of this points to the importance of diversifying the campus and not relying on students from one major source country, particularly China. It also shows the need for campus support services to encourage and provide opportunities for Chinese (and other international) students to meet and interact with American students. Likewise, American students should be encouraged and incentivized to interact with international students on campus.
• Indian students seem to struggle more than others with loneliness and homesickness (42 percent), second only to financial issues. A possible explanation is that, for Indian students, it is much more normative to live at home during or after college, often until marriage, than it is in the U.S. (see Dedhia, Dedhia, & Raoji, 2015). While living with parents and family into early adulthood is common in many countries worldwide, in India, family interdependence is particularly strongly emphasized (Asia Society, 2016). Moving out of the parents’ house and to a new country all at once, particularly if doing so alone (without a spouse, partner, or friends), may cause particularly strong feelings of homesickness and loneliness. However, research indicates that international students in general face loneliness and homesickness at a higher rate during their first year than do their American counterparts(Andrade, 2006).

Improving the International Student Experience | © 2016 World Education Services. All rights reserved.
21
International students are sometimes not given enough time to ‘blend in’ or settle in.
- Master’s student from nigeria
Integration between international and domestic students is particularly key, and not only to meet internationalization goals. It can also help reduce some of the sociocultural challenges that international students face, such as reduced feelings of social connectedness, loneliness, and hampered English language skills. Some institutions have found novel ways of promoting such integration. Iowa State University’s International Student Mentoring Program, for example, matches a more experienced domestic student with a new international student in a mentor/mentee relationship (Young, 2014). The mentor receives training on cultural and immigration issues that international students face and then is required to meet with his or her mentee four times per semester. There are additional, optional events for the mentors and mentees to attend together. A paid student worker helps coordinate the program. The mentor can help the mentee adjust culturally, practice his or her English, become acclimated to U.S. academic culture, and so forth.

Improving the International Student Experience | © 2016 World Education Services. All rights reserved.
22
Figure 8: The Three Most Significant Challenges You Faced with Your experience in Studying in the U.S.
Q: Please select the three most significant challenges you faced with your experience in studying in the U.S.
A: top 3 countries/regions which selected each factor the most.
65+35+F33+67+F24+76+F18+82+F16+84+F
63+37+F32+68+F21+79+F18+82+F
65%Overall
33%Overall
24%Overall
18%Overall
16%Overall
63%Overall
32%Overall
21%Overall
18%Overall
Cost of tuition fees
Difficulty in developing social connections (e.g., making friends or developing close working relationships with domestic students)
Proficiency in English language
Meeting academic demands
Discrimination based on nationality, ethnicity, or other similar characteristic
most cited in:
most cited in:
most cited in:
most cited in:
most cited in:
most cited in:
most cited in:
most cited in:
most cited in:
Canada 89%
Latin America & Caribbean
72%
Europe 72%
China 60%
Middle East & North Africa
36%
India 34%
China 48%
Middle East & North Africa
38%
Latin America & Caribbean
32%
Middle East & North Africa
26%
Canada 24%
India 22%
Sub-Saharan Africa 24%
Middle East & North Africa
21%
China 19%
Sub-Saharan Africa 71%
India 67%
Latin America & Caribbean
63%
India 42%
Sub-Saharan Africa 36%
Europe 34%
Europe 26%
Oceania 24%
Latin America & Caribbean
23%
Europe 23%
India 23%
Canada 22%
Cost of living expenses
Loneliness/ homesickness
Difficulty in adapting to U.S. academic culture
Issues related to my visa and/or inadequate knowledge about visa regulations

Improving the International Student Experience | © 2016 World Education Services. All rights reserved.
23
otheR seRvices: hoUsing & Financial sUPPoRt
Many institutions can improve a range of services that have a significant impact on international students’ experience of campus life, but that are not typically designed with their needs in mind. Of particular note are financial supports and housing. We asked respondents to rate some of the most relevant services and supports, such as housing and academic advising.
The International Office is not aware of what international students go through in their first year in the U.S.
- Master’s student from nigeria
• Among campus facilities, students expressed the most dissatisfaction with housing and accommodations. Less than two-thirds (63 percent) of respondents rated housing favorably. Satisfaction levels are particularly low for Latin American & Caribbean (57 percent), MENA (55 percent), European (51 percent), and Canadian (41 percent) students. Indian students were most satisfied overall at 76 percent. Much of this may have to do with expectations among students from these regions. However, some notable differences in satisfaction emerged based on the setting of the institution. While most were “satisfied” (41 percent) or “very satisfied” (22 percent), students at institutions in cities were most likely to express some degree of dissatisfaction (16 percent overall dissatisfaction rate) about housing. Some of this dissatisfaction may be attributed to the sheer cost of housing – and living, in general – in many U.S. cities. The cost of housing and living in cities becomes more acute when it is added to the cost of tuition. Among major study destination cities, Boston, New York, and San Francisco are the most expensive cities on average for international study when factoring in tuition, housing, and cost of living (though this is more often due to the cost of education, than to living) (Savills, 2015; see also Anderson, 20152). They beat out other notoriously expensive cities outside of the U.S., such as Sydney and London. The process of finding housing may also be difficult for many international students, particularly at institutions where campus housing is limited and difficult to secure, often the case at urban campuses. Additionally, students in expensive cities such as New York must often make hard choices in balancing the cost of housing with certain quality-of-life indicators, such as the size of and space in the housing unit; the quality of the unit itself (e.g., the age of appliances and amount of storage); the distance from campus; safety; proximity to amenities (e.g., shopping, fun activities); and so forth. Respondents from rural campuses had the lowest overall satisfaction levels (60 percent), though not by much and still high overall, and the second-highest overall dissatisfaction rates (15 percent). Rural students may face very different challenges, likely often in availability and variety of housing. The most satisfied overall (72 percent, with a 10 percent overall dissatisfaction rate) are students in towns. The high satisfaction rate may be due to a good balance of relative low cost with more access and variety of housing types and units. Related quality-of-life factors, such as the perceived friendliness of local people and safety, may also play a role.
• A large number of students from almost all the countries and regions expressed dissatisfaction with their institution’s availability of financial aid and scholarships. This is especially true of students from China (31 percent overall dissatisfaction rate), India

Improving the International Student Experience | © 2016 World Education Services. All rights reserved.
24
(27 percent), Canada (27 percent), and Latin America/Caribbean (26 percent). The expenses associated with studying in the U.S. are no secret. However, it is notable that this is one area in which MENA students showed the least amount of dissatisfaction (20 percent) relative to others.3 This may be in large part due to the generous government and corporate scholarship programs that many students from the region receive to study in the U.S., particularly students from Saudi Arabia and Kuwait. However, the high dissatisfaction rate among Chinese students is somewhat surprising considering that Chinese students and their families are often financially well-resourced, are willing to pay large sums for a U.S. education, and look much less at the cost of an institution relative to other factors – especially ranking or reputation – when deciding where to study (Chang, Schulmann, & Lu, 2014; Lu & Schulmann, 2015). One driving factor may be that these students are becoming increasingly aware – and resentful – of the fact that they are a large source of revenue for U.S. institutions (McDonald, 2012; Koo, 2015).

Improving the International Student Experience | © 2016 World Education Services. All rights reserved.
25
Figure 9: Level of Satisfaction with the Institution’s Campus Facilities
87+13+F78+22+F73+27+F63+37+F
66+34+F
87%Overall
78%Overall
73%Overall
63%Overall
66%Overall
Academic Advising
International Student Orientation programs
english Language Courses
Housing and Accommodations
Availability of Financial Aidand/or Scholarships
Q1: please indicate the degree of satisfaction with your institution’s campus facilities and services for international students.
A1: Percent of overall students for whom each category is “very satisfied” and “satisfied”
Q2: please indicate the degree of satisfaction with your institution’s campus facilities and services for international students.
A2: Top country/region and lowest country/region for whom each category is “very satisfied” and “satisfied”
Oceania & Canada have been excluded.
Most satisfied in: India - 91%
Least satisfied in: Middle East & North Africa - 82%
Most satisfied in: India - 91%
Least satisfied in: Europe - 65%
Most satisfied in: Sub-Saharan Africa - 84%
Least satisfied in: Europe - 63%
Most satisfied in: India - 76%
Least satisfied in: Europe - 51%
Most satisfied in: Sub-Saharan Africa - 72%
Least satisfied in: Latin America & Caribbean - 63%
76+24+F76%Overall
Office of International Studentand Scholar Services (ISSS)
Most satisfied in: India - 88%
Least satisfied in: Europe - 68%
79+21+F79%Overall
Student Counseling Services
Most satisfied in: India - 87%
Least satisfied in: Latin America & Caribbean - 72%
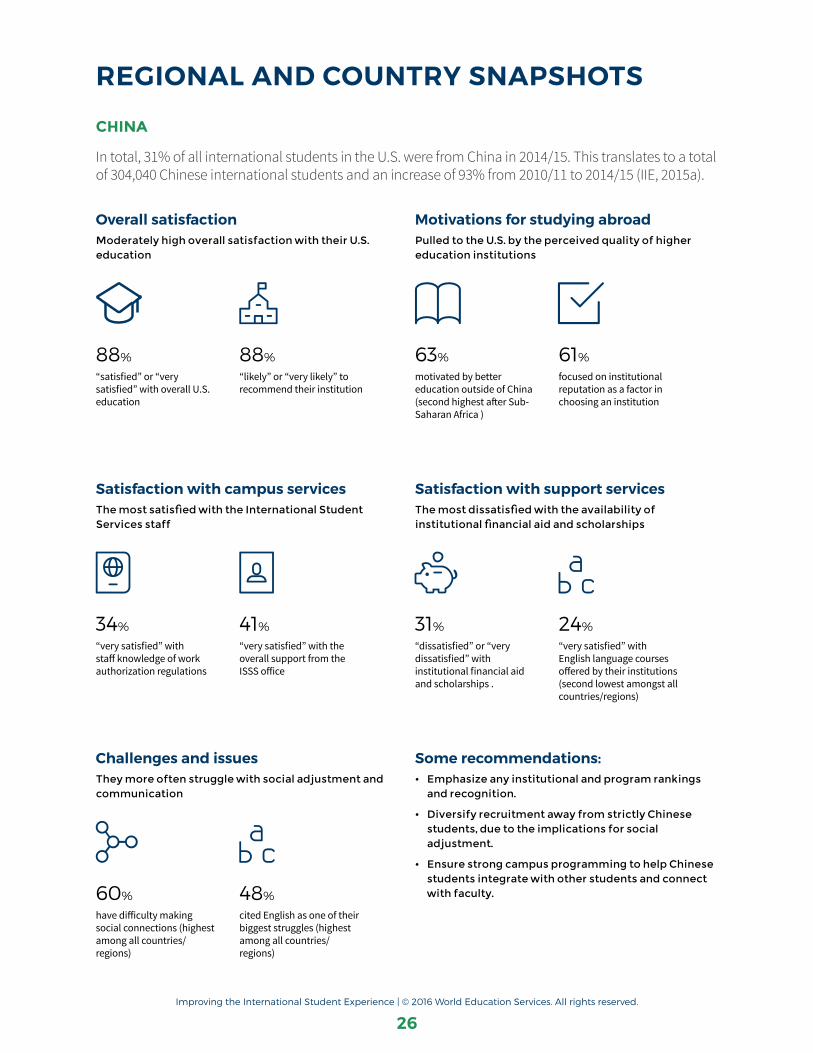
Improving the International Student Experience | © 2016 World Education Services. All rights reserved.
26
RegIonaL and countRy SnapShotS
china
In total, 31% of all international students in the U.S. were from China in 2014/15. This translates to a total of 304,040 Chinese international students and an increase of 93% from 2010/11 to 2014/15 (IIE, 2015a).
Motivations for studying abroadpulled to the U.S. by the perceived quality of higher education institutions
Satisfaction with support servicesThe most dissatisfied with the availability of institutional financial aid and scholarships
Some recommendations:• emphasize any institutional and program rankings
and recognition.
• Diversify recruitment away from strictly Chinese students, due to the implications for social adjustment.
• ensure strong campus programming to help Chinese students integrate with other students and connect with faculty.
overall satisfactionModerately high overall satisfaction with their U.S. education
Satisfaction with campus servicesThe most satisfied with the International Student Services staff
challenges and issuesthey more often struggle with social adjustment and communication
88%
“satisfied” or “very satisfied” with overall U.S. education
34%
“very satisfied” with staff knowledge of work authorization regulations
60%
have difficulty making social connections (highest among all countries/regions)
63%
motivated by better education outside of China (second highest after Sub-Saharan Africa )
31%
“dissatisfied” or “very dissatisfied” with institutional financial aid and scholarships .
88% “likely” or “very likely” to recommend their institution
41% “very satisfied” with the overall support from the ISSS office
48% cited English as one of their biggest struggles (highest among all countries/regions)
61%
focused on institutional reputation as a factor in choosing an institution
24% “very satisfied” with English language courses offered by their institutions (second lowest amongst all countries/regions)

Improving the International Student Experience | © 2016 World Education Services. All rights reserved.
27
india
In total, 14% of all international students in the U.S. were from India in 2014/15. This translates to a total of 132,888 Indian international students and an increase of 28% from 2010/11 to 2014/15 (IIE, 2015a).
Motivations for studying abroadDriven heavily by career prospects
Satisfaction with campus and support servicesThe most consistently satisfied with campus facilities and support services
overall satisfactionThe most satisfied with their U.S. education
Satisfaction with career servicesAmong the most satisfied, particularly in finding jobs
challenges and issuesLoneliness or homesickness is a challenge
94%
“satisfied” or “very satisfied” with overall U.S. education
27%
“very satisfied” with the help provided in finding jobs after graduation (second highest among all countries/regions )
42%
cited loneliness or homesickness as a predominant issue
67%
cited cost of living as a big challenge (second highest among all countries/regions)
52%
looking to gain work experience outside of India
92%
“satisfied” or “very satisfied” with overall support to international students (highest among all countries/regions)
93% “likely” or “very likely” to recommend their institution
29% “very satisfied” with the help provided in finding jobs or internships during coursework (tied for highest with Sub-Saharan Africa)
64%
focused on specific programs as a factor in choosing an institution
91% “satisfied” or “very satisfied” with academic advising services (highest among all countries/regions)
Some recommendations:• Highlight realistic job, internship, and research
opportunities.
• target at least partial scholarships and other forms of aid where possible.
• Help Indian students develop connections with American students and with any local Indian diaspora communities.
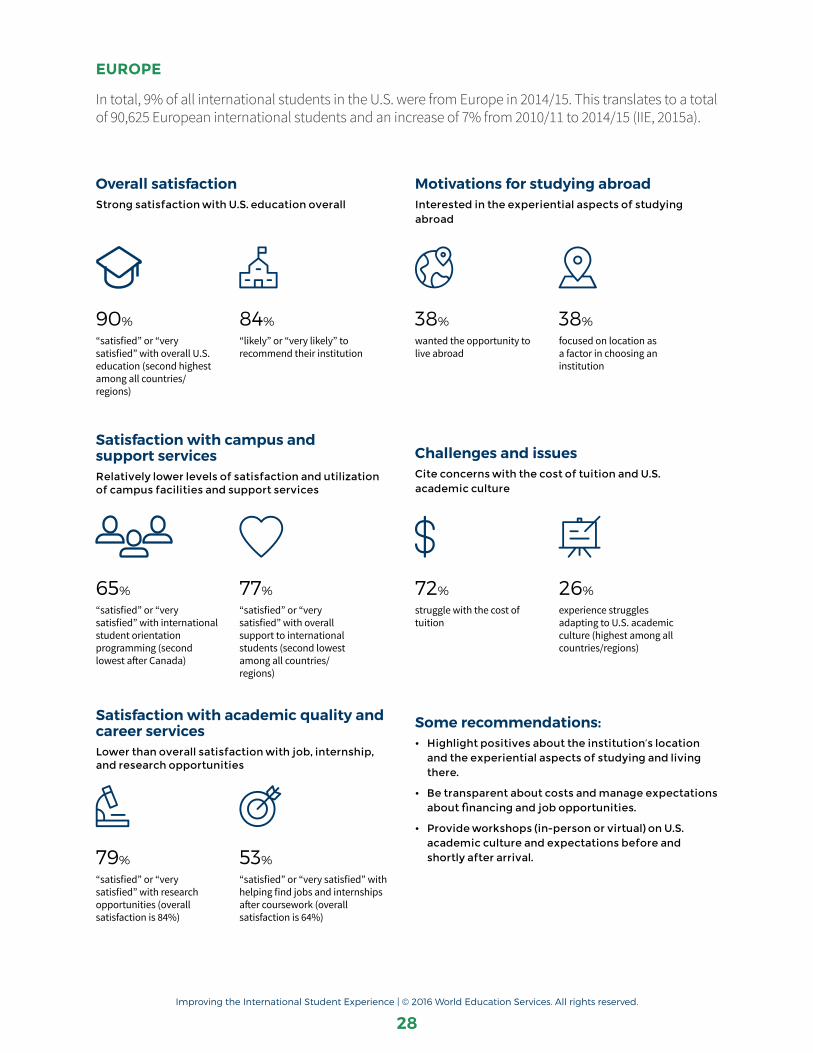
Improving the International Student Experience | © 2016 World Education Services. All rights reserved.
28
eURoPe
In total, 9% of all international students in the U.S. were from Europe in 2014/15. This translates to a total of 90,625 European international students and an increase of 7% from 2010/11 to 2014/15 (IIE, 2015a).
Motivations for studying abroadInterested in the experiential aspects of studying abroad
challenges and issuesCite concerns with the cost of tuition and U.S. academic culture
overall satisfactionStrong satisfaction with U.S. education overall
Satisfaction with campus and support services relatively lower levels of satisfaction and utilization of campus facilities and support services
Satisfaction with academic quality and career servicesLower than overall satisfaction with job, internship, and research opportunities
90%
“satisfied” or “very satisfied” with overall U.S. education (second highest among all countries/regions)
65%
“satisfied” or “very satisfied” with international student orientation programming (second lowest after Canada)
79%
“satisfied” or “very satisfied” with research opportunities (overall satisfaction is 84%)
38%
wanted the opportunity to live abroad
72%
struggle with the cost of tuition
84% “likely” or “very likely” to recommend their institution
77% “satisfied” or “very satisfied” with overall support to international students (second lowest among all countries/regions)
53% “satisfied” or “very satisfied” with helping find jobs and internships after coursework (overall satisfaction is 64%)
38%
focused on location as a factor in choosing an institution
26% experience struggles adapting to U.S. academic culture (highest among all countries/regions)
Some recommendations:• Highlight positives about the institution’s location
and the experiential aspects of studying and living there.
• Be transparent about costs and manage expectations about financing and job opportunities.
• provide workshops (in-person or virtual) on U.S. academic culture and expectations before and shortly after arrival.

Improving the International Student Experience | © 2016 World Education Services. All rights reserved.
29
latin ameRica and the caRiBBean
In total, 9% of all international students in the U.S. were from Latin America & the Caribbean in 2014/15. This translates to a total of 86,378 international students and an increase of 35% from 2010/11 to 2014/15 (IIE, 2015a).
Motivations for studying abroadDiverse motivations but some motivated to improve their english language skills
Satisfaction with support servicesVery positive about the social aspects of their education
overall satisfactionGenerally satisfied with U.S. education
the value of u.S. educationStrong belief in the value of their U.S. education
challenges and issuesStruggle with the overall cost of attendance
86%
“satisfied” or “very satisfied” with overall U.S. education
62%
“strongly agree” that U.S. education was a worthwhile investment (second highest among all countries/regions)
72%
struggle with the cost of tuition
23%
desire to improve their English language skills
26%
likely to take advice from family & friends in selecting a U.S. institution (second highest among all countries/regions)
46%
“very satisfied” with the ability to learn from students of other cultures
91% “likely” or “very likely” to recommend their institution
55% “strongly agree” that their career prospects are positive
63% struggle with the cost of living expenses
38% “very satisfied” with social activities on campus
Some recommendations:• Identify satisfied current students and alumni to be
part of a student or alumni ambassador program.
• Develop and target scholarships and on-campus job opportunities to qualified students in need.
• Develop more research opportunities for students on or off campus.
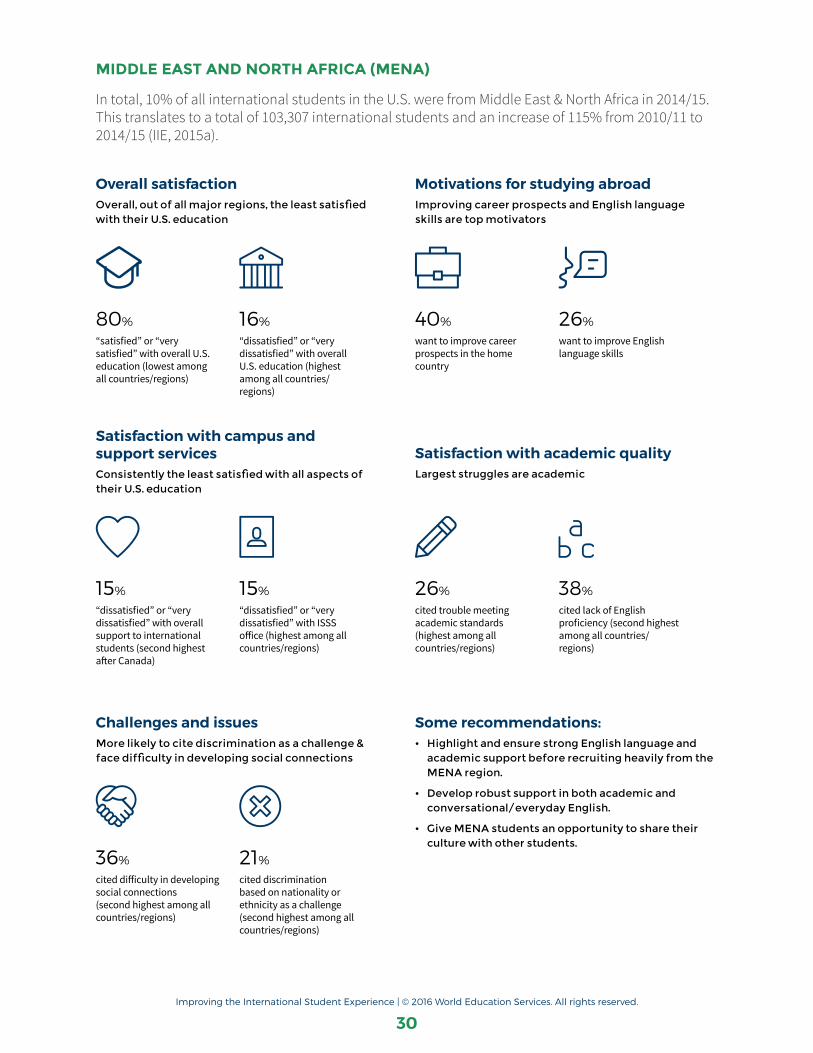
Improving the International Student Experience | © 2016 World Education Services. All rights reserved.
30
middle east and noRth aFRica (mena)
In total, 10% of all international students in the U.S. were from Middle East & North Africa in 2014/15. This translates to a total of 103,307 international students and an increase of 115% from 2010/11 to 2014/15 (IIE, 2015a).
Motivations for studying abroadImproving career prospects and english language skills are top motivators
Satisfaction with academic qualityLargest struggles are academic
overall satisfactionOverall, out of all major regions, the least satisfied with their U.S. education
Satisfaction with campus and support services Consistently the least satisfied with all aspects of their U.S. education
challenges and issuesMore likely to cite discrimination as a challenge & face difficulty in developing social connections
80%
“satisfied” or “very satisfied” with overall U.S. education (lowest among all countries/regions)
15%
“dissatisfied” or “very dissatisfied” with overall support to international students (second highest after Canada)
36%
cited difficulty in developing social connections (second highest among all countries/regions)
40%
want to improve career prospects in the home country
26%
cited trouble meeting academic standards (highest among all countries/regions)
16% “dissatisfied” or “very dissatisfied” with overall U.S. education (highest among all countries/regions)
15% “dissatisfied” or “very dissatisfied” with ISSS office (highest among all countries/regions)
21% cited discrimination based on nationality or ethnicity as a challenge (second highest among all countries/regions)
26%
want to improve English language skills
38% cited lack of English proficiency (second highest among all countries/regions)
Some recommendations:• Highlight and ensure strong english language and
academic support before recruiting heavily from the MeNA region.
• Develop robust support in both academic and conversational/everyday english.
• Give MeNA students an opportunity to share their culture with other students.

Improving the International Student Experience | © 2016 World Education Services. All rights reserved.
31
sUB-sahaRan aFRica
In total, 3% of all international students in the U.S. were from Sub-Saharan Africa in 2014/15. This translates to a total of 33,595 international students and an increase of 7% from 2010/11 to 2014/15 (IIE, 2015a).
Motivations for studying abroadDriven overwhelmingly by educational quality, as well as career prospects
Satisfaction with academic quality and campus supportThe most highly satisfied with campus support and programming overall
overall satisfactionHighly satisfied with their U.S. education overall
the value of u.S. educationStrong belief in good return on investment (rOI)
challenges and issuesHighest financial need
88%
“satisfied” or “very satisfied” with overall U.S. education
70%
“strongly agree” that U.S. education was a worthwhile investment (highest among all countries/regions)
71%
struggle with the cost of tuition
70%
motivated by better education outside of their home countries (highest among all countries/regions)
59%
average of “very satisfied” responses on all measures of academic quality (e.g., learning support services, course offerings)
93% “likely” or “very likely” to recommend their institution
70% “strongly agree” that their career prospects are positive (highest among all countries/regions)
71% struggle with the cost of living expenses
63%
focused on specific programs as a factor in choosing an institution
44% average of “very satisfied” responses on all forms of campus support (e.g., social activities, student organizations)
Some recommendations:• Highlight multiple indicators of academic quality at
the institution and among target programs.
• Target any forms of financial aid to qualified students in need and assist with finding funding from external sources if necessary.
• Improve processes for helping students find and secure internships and jobs during or after coursework.

Improving the International Student Experience | © 2016 World Education Services. All rights reserved.
32
IMpLIcatIonS and RecoMMendatIonS
Ultimately, many stakeholders need to be at the table when discussing international students on campus. Not only do International Enrollment Management and International Student Services personnel need to work together, but other aspects of student engagement and support play important parts, too.
My institution was unprepared to deal with international students.
- Master’s student from canada
As much as possible, recruitment efforts and the services and resources available to students once enrolled should match. For example, while Middle Eastern students often come in with generous funding, usually from government or corporate scholarship programs, they often require robust student services, including English language support. Institutions that are ill-equipped to handle such demands for services should invest in improving services before heavily recruiting from the MENA region. As a result, the enrollment management team may need to work more with academic departments and student support services. Advising, financial aid, career services, student life, housing, and other student services need to be part of the conversation, too. Even the Institutional Research Department and the Alumni Office have roles to play in international student engagement. Of course, efforts to bring all of these players to the table require engaged leadership from senior management.
imPlications FoR RecRUitment
In particular, findings around the integration challenges that students on campus face point to one realization: To ensure that students walk away with the levels of satisfaction that lead to good word-of-mouth exposure, it is crucial to consider the size and diversity of the international student body being brought onto campus. Numbers alone should not drive recruitment. Some research (Zhao, Kuh, & Carini, 2005) suggests that the density of international student enrollment – i.e., the number of international students as a percentage of the campus population – can be a mixed blessing. While having more international students on campus correlates with greater experiences with diversity among both international and American students, there is a greater chance that satisfaction levels among international students drop as density increases – unless different aspects of the experience are monitored and managed.
I‘ve really enjoyed my experience studying abroad. I fully recommend it.
- associate’s student from chile
The diversity of the international student body is also critical, not only to avoid possible challenges associated with financial dependence on one or two major source countries, but for reasons of student support. As mentioned previously, too many students from one country, most notably China, can create a bubble effect on campus, insulating these students from getting to know American students and culture. While having a few other co-nationals on campus can be beneficial, particularly for initial support and overcoming loneliness and homesickness, research (e.g., Zhao, Kuh, & Carini,

Improving the International Student Experience | © 2016 World Education Services. All rights reserved.
33
2005; Hendrickson, Rosen, & Aune, 2011) consistently shows that the optimal international student experience is to develop meaningful friendships with host country nationals.
Additionally, international students are more likely to improve their English skills more quickly and ably through regular communication with American students, faculty, and staff. Mastery of English is a key ingredient to both academic and social success. For recruiters and admissions personnel, this means one thing: Diversify your source countries. Not only can this insulate against the ups and downs associated with international recruitment, but it can aid word-of-mouth recruitment through increased student satisfaction, as well as help meet campus internationalization goals.
imPlications FoR Retention
Institutions need to invest money, resources, and human talent in improving services for international students across the board, particularly as international student enrollment grows or diversifies. All campus support services, from academic services to student life to career services to faculty, should be prepared to fully support international students and handle their unique needs and challenges.
It was an incredible program. It changed and deepened the way I think and work and enabled me to come back to my home
country and seek opportunities to apply what I’d learned.
- Master’s student from Israel
Strong career services for international students are a particular area where most institutions could improve. Working graduates are much more likely to view their experience at a U.S. institution positively and to recommend the institution. This suggests the importance of assisting students in preparing for the working world, whether in the U.S. or abroad, and to assist in securing employment. These are, of course, the primary domain of the Career Services Office. International students expect that their U.S. education will pay off in terms of a future career. International students indicated more dissatisfaction with career services overall, and access to jobs and internships in particular, than any other campus service.
Previous WES research on career services for international students (Loo, 2016), conducted through a survey of and interviews with institutional officers, has generated many good practices for institutions to try. Among them are the need to engage employers on hiring international students, address the unique needs of international students through targeted programming where necessary, and assist students returning home (or going elsewhere abroad) from the U.S. in developing employment pathways and managing their career trajectories.
Faculty are also a critical part of the international student experience. They are one of the most important sources of satisfaction among students, as respondents to our survey noted that faculty expertise and teaching were important factors for academic satisfaction. However, two areas of relatively high dissatisfaction were access to research opportunities and opportunities to network with faculty outside of class, both of which require faculty to address at least in part.
It may be the case that faculty need additional training in working with international students, including intercultural training. Previous research has shown that faculty members often misinterpret international student behaviors (Andrade, 2006). For example, they may believe students’ trouble with written analysis has a cultural basis, rather than simply indicating trouble with their English skills. They often underestimate the adjustment challenges that international students face, or they misattribute international student challenges.

Improving the International Student Experience | © 2016 World Education Services. All rights reserved.
34
More institutions are developing and facilitating training for both faculty and staff on international student issues, including intercultural competency and communication. The University of Montana’s iTEAM: Teach, Empower, Assist, and Mentor International Students training session, provided by the Office of Human Resources, is designed for those who teach or advise international students to help overcome communication and cultural barriers (University of Montana, 2016).4 The session is facilitated by representatives from various offices, including Foreign Student Scholar Services, as well as an expert in cross-cultural communication.
Additionally, institutions should take stock of their housing practices for international students, whether providing on-campus or campus-affiliated housing or referring students to various forms of off-campus housing. Different factors such as cost, quality, proximity, and so forth may influence a student’s assessment of housing and enrollment decisions.
Final thoUghts
This survey provides key insights into international student experiences as they vary by students’ region or country of origin. But how each unique institution applies those insights will be different. It is important for each institution to assess itself and determine what is working well in terms of international student experience and what needs improvement. Student surveys, focus groups, and other forms of direct research, of course, can supply such feedback, but other data collected on a regular basis can also provide insights. Such data sources could be anything from aggregated course evaluations to career placement statistics to graduation surveys. Data analysis should, where relevant, be designed to segment international student results from the overall student population. Additionally, engaging with alumni and gathering data on satisfaction with their education post-graduation, as well as information about their careers and work lives, can provide even more insights.
MethodoLogy
The findings of this report are based on an online survey to applicants for foreign credential evaluation at World Education Services (www.wes.org) administered from May 10th to 31st, 2016.
In total, 4,683 questionnaires were completed for a response rate of seven percent. Of these responses, 4,256 respondents enrolled at a U.S. institution and 427 enrolled in an institution in a foreign country other than the U.S. For motivations for studying in another country, we analyzed the respondents who enrolled in a U.S. or other foreign institution. For all other questions, we only analyzed respondents who enrolled in the U.S. An incentive of a $200 Amazon.com gift card prize drawing was offered. The respondents’ quotes are revised for maximum understandability, and spelling and grammatical errors were amended. See table in the Appendix where findings with “-” indicate those failing the significance test; otherwise, findings are statistically significant with a p-value under 0.05, which means there is only a 5 percent probability of these findings occurring by chance alone. Percentages may not sum up to 100 percent due to rounding.
limitations
The survey sample is restricted to individuals that applied for a WES credential evaluation with the intention of pursuing higher education in the U.S. This may result in self-selection and sample biases.

Improving the International Student Experience | © 2016 World Education Services. All rights reserved.
35
overall Bache-lor's Master's china India canada europe
Latin america & carib-
bean
Middle east & north africa
oceaniaSub
Saharan africa
total Responses 4256 880 2300 268 747 116 490 526 440 38 765
please select the tWo most important reasons that lead you to seek opportunities to study abroad.
Opportunity to improve my career prospects in my home country
37% 32% 39% 37% 40% 49% 26% 30% 40% 47% 45%
Opportunity to gain work experience outside home country
40% 34% 43% 39% 52% 34% 38% 33% 28% 24% 45%
Better education outside of my home country
57% 54% 58% 63% 60% 33% 37% 55% 54% 34% 70%
Opportunity to experience living in a foreign country
29% 35% 28% 36% 30% 35% 38% 34% 25% 42% 22%
pathways to immigration in the future 9% 9% 9% 9% 8% 8% 16% 12% 8% 13% 6%
Improve my english or other language skills
14% 21% 11% 15% 5% 3% 26% 23% 26% 8% 4%
Financial aid provided by government and/or employer
7% 7% 6% 1% 3% 10% 7% 8% 15% 8% 5%
Other 6% 9% 5% 1% 2% 30% 14% 6% 4% 24% 4%
please select the thRee most important factors that influenced your decision to enroll at a u.S. Institution.
Institution's reputation 43% 38% 48% 61% 49% 34% 38% 43% 42% 45% 39%
Institution's location 27% 29% 27% 40% 19% 45% 38% 33% 21% 47% 18%
Availability of a desired program 59% 54% 61% 48% 64% 76% 56% 58% 58% 68% 63%
Cost of study 17% 19% 17% 24% 18% 24% 18% 20% 11% 29% 13%
Availability of financial aid/ scholarships
29% 34% 24% 20% 20% 16% 30% 30% 31% 18% 39%
earning potential after graduation 42% 45% 41% 39% 40% 26% 43% 41% 38% 26% 45%
Availability of research opportunities 29% 22% 30% 19% 41% 9% 19% 22% 32% 8% 38%
Online reviews 7% 7% 8% 6% 7% 8% 6% 7% 8% 5% 7%
Suggestions and/or advice from friends or family
24% 29% 21% 19% 20% 23% 25% 26% 28% 16% 21%
recommendation by a recruiting agent 5% 6% 4% 6% 2% 7% 7% 4% 11% 13% 2%
Suggestion and/or advice from current students or alumni
14% 13% 16% 19% 18% 17% 14% 9% 18% 16% 12%
Other 4% 5% 4% 2% 1% 16% 7% 7% 3% 8% 3%
please indicate the degree of satisfaction with your overall educational experience in the u.S.
Very dissatisfied 7% 6%- 6%- 5% 3% 3% 4% 10% 13% 5% 7%
Dissatisfied 3% 3%- 2%- 3% 2% 3% 3% 2% 4% 5% 1%
Satisfied 44% 44%- 44%- 56% 45% 49% 42% 41% 48% 26% 34%
Very satisfied 44% 44%- 45%- 32% 49% 39% 48% 45% 32% 63% 54%
Not sure 3% 3%- 3%- 4% 1% 6% 3% 3% 4% 0% 3%
how likely are you to recommend your institution to others in your home country?
Very unlikely 4% 3% 4% 5%- 3%- 5% 4% 4% 5% 8% 4%
Unlikely 4% 3% 4% 3%- 3%- 7% 8% 2% 5% 13% 1%
Likely 37% 38% 38% 43%- 42%- 42% 37% 31% 43% 29% 26%
Very likely 52% 52% 51% 45%- 51%- 37% 47% 59% 43% 45% 67%
Not sure 3% 4% 3% 4%- 1%- 9% 3% 3% 4% 5% 2%
please indicate the degree of satisfaction with your institution’s academic quality: - courses offered in my program
Very dissatisfied 2% 2%- 2%- 1%- 1%- 1% 2% 2% 3% 5% 2%
Dissatisfied 4% 3%- 4%- 7%- 4%- 3% 6% 4% 8% 8% 2%
Satisfied 45% 48%- 45%- 52%- 47%- 48% 45% 41% 53% 39% 36%
Very satisfied 47% 45%- 48%- 39%- 47%- 45% 44% 52% 33% 45% 59%
Not sure 1% 2%- 1%- 1%- 1%- 3% 2% 2% 2% 3% 2%
appendIx

Improving the International Student Experience | © 2016 World Education Services. All rights reserved.
36
please indicate the degree of satisfaction with your institution’s academic quality: - expertise of faculty
Very dissatisfied 2% 2%- 1%- 1%- 1%- 3% 1% 2% 6% 0% 1%
Dissatisfied 3% 2%- 3%- 3%- 4%- 4% 3% 3% 5% 0% 1%
Satisfied 42% 45%- 42%- 50%- 41%- 37% 42% 35% 50% 50% 36%
Very satisfied 52% 49%- 52%- 45%- 54%- 51% 53% 56% 37% 47% 61%
Not sure 1% 2%- 1%- 0%- 0%- 4% 1% 3% 2% 3% 1%
please indicate the degree of satisfaction with your institution’s academic quality: - Learning support services (such as library, labs, computer facilities, etc.)
Very dissatisfied 2% 1%- 2%- 1%- 1%- 1% 2% 3% 4% 0% 2%
Dissatisfied 3% 3%- 3%- 4%- 3%- 8% 3% 2% 5% 8% 1%
Satisfied 36% 39%- 36%- 41%- 35%- 43% 35% 31% 44% 47% 29%
Very satisfied 57% 55%- 58%- 53%- 60%- 44% 58% 61% 45% 42% 67%
Not sure 2% 2%- 2%- 1%- 1%- 4% 2% 2% 1% 3% 1%
please indicate the degree of satisfaction with your institution’s academic quality: - your institution’s evaluation of your academic performance (e.g., grading)
Very dissatisfied 2% 2% 2% 1%- 1%- 1% 2% 3% 3% 0% 2%
Dissatisfied 3% 5% 2% 3%- 2%- 3% 4% 3% 6% 3% 2%
Satisfied 43% 44% 43% 51%- 46%- 40% 38% 39% 50% 42% 36%
Very satisfied 50% 48% 51% 43%- 49%- 53% 54% 53% 38% 53% 58%
Not sure 2% 2% 2% 1%- 1%- 4% 2% 2% 2% 3% 2%
please indicate the degree of satisfaction with your institution’s academic quality: - Research opportunities
Very dissatisfied 2% 2% 2% 1%- 1%- 3% 2% 3% 5% 0% 2%
Dissatisfied 7% 8% 7% 10%- 8%- 11% 7% 7% 11% 8% 5%
Satisfied 46% 49% 47% 50%- 48%- 38% 46% 40% 52% 42% 40%
Very satisfied 37% 34% 37% 34%- 37%- 26% 34% 41% 25% 34% 49%
Not sure 7% 8% 7% 5%- 5%- 22% 12% 10% 7% 16% 4%
please indicate the degree of satisfaction with your institution’s campus facilities and services for international students: - International student orientation programs
Very dissatisfied 3% 3% 2% 1% 2% 7% 3% 4% 4% 3% 2%
Dissatisfied 7% 9% 6% 9% 4% 8% 9% 8% 10% 13% 5%
Satisfied 43% 43% 44% 50% 45% 41% 36% 40% 46% 42% 39%
Very satisfied 35% 32% 37% 34% 46% 22% 29% 33% 28% 26% 45%
Not sure 12% 13% 10% 6% 3% 22% 23% 16% 12% 16% 10%
please indicate the degree of satisfaction with your institution’s campus facilities and services for international students: - office of International Student and Scholar Services (ISSS)
Very dissatisfied 3% 3% 2% 1%- 2%- 4% 2% 4% 5% 3% 2%
Dissatisfied 7% 8% 6% 8%- 5%- 9% 6% 7% 10% 8% 5%
Satisfied 41% 42% 42% 44%- 43%- 33% 36% 36% 39% 32% 38%
Very satisfied 36% 32% 38% 41%- 45%- 25% 32% 36% 30% 24% 42%
Not sure 14% 16% 12% 6%- 5%- 28% 24% 17% 15% 34% 12%
please indicate the degree of satisfaction with your institution’s campus facilities and services for international students: - availability of financial aid and/or scholarships
Very dissatisfied 7% 7% 7% 6%- 7%- 6% 7% 10% 8% 3% 6%
Dissatisfied 17% 16% 18% 25%- 20%- 21% 16% 16% 12% 16% 15%
Satisfied 37% 39% 37% 40%- 38%- 33% 37% 30% 39% 45% 33%
Very satisfied 29% 30% 26% 22%- 29%- 21% 26% 32% 23% 18% 39%
Not sure 10% 7% 12% 7%- 6%- 20% 15% 11% 19% 18% 7%
please indicate the degree of satisfaction with your institution’s campus facilities and services for international students: - english language courses
Very dissatisfied 2% 2% 1% 1% 1% 1% 1% 2% 5% 0% 1%
Dissatisfied 4% 5% 4% 7% 3% 2% 5% 5% 8% 0% 2%
Satisfied 40% 44% 40% 44% 46% 33% 35% 35% 40% 29% 39%
Very satisfied 33% 36% 31% 24% 34% 20% 28% 35% 29% 26% 45%
Not sure 21% 13% 24% 25% 16% 45% 31% 23% 17% 45% 14%
overall Bache-lor's Master's china India canada europe
Latin america & carib-
bean
Middle east & north africa
oceaniaSub
Saharan africa
total Responses 4256 880 2300 268 747 116 490 526 440 38 765

Improving the International Student Experience | © 2016 World Education Services. All rights reserved.
37
overall Bache-lor's Master's china India canada europe
Latin america & carib-
bean
Middle east & north africa
oceaniaSub
Saharan africa
total Responses 4256 880 2300 268 747 116 490 526 440 38 765
please indicate the degree of satisfaction with your institution’s campus facilities and services for international students: - housing and accommodations
Very dissatisfied 3% 3% 3% 1% 3% 3% 4% 3% 6% 3% 2%
Dissatisfied 11% 10% 12% 16% 11% 8% 11% 9% 12% 5% 9%
Satisfied 41% 42% 41% 48% 49% 25% 35% 36% 39% 37% 41%
Very satisfied 22% 24% 22% 22% 28% 16% 16% 21% 16% 29% 28%
Not sure 23% 22% 22% 13% 10% 49% 33% 31% 27% 26% 21%
please indicate the degree of satisfaction with your institution’s campus facilities and services for international students: - academic advising
Very dissatisfied 2% 3%- 2%- 2%- 2%- 3% 3% 3% 4% 3% 1%
Dissatisfied 7% 8%- 7%- 7%- 6%- 6% 7% 9% 9% 8% 4%
Satisfied 47% 46%- 47%- 53%- 48%- 52% 45% 40% 52% 37% 41%
Very satisfied 40% 40%- 40%- 36%- 43%- 33% 39% 43% 30% 37% 49%
Not sure 4% 3%- 5%- 1%- 1%- 6% 7% 6% 5% 16% 4%
please indicate the degree of satisfaction with your institution’s campus facilities and services for international students: - Student counseling services
Very dissatisfied 2% 3% 2% 1%- 1%- 3% 1% 2% 4% 3% 1%
Dissatisfied 7% 7% 7% 7%- 6%- 2% 7% 10% 10% 3% 4%
Satisfied 45% 45% 45% 50%- 47%- 45% 44% 37% 47% 47% 40%
Very satisfied 34% 35% 34% 32%- 40%- 20% 29% 36% 25% 24% 44%
Not sure 12% 11% 13% 10%- 6%- 31% 18% 16% 13% 24% 11%
please indicate the degree of satisfaction with the following aspects of your institution’s support services for international students: - overall support for international students
Very dissatisfied 3% 3% 2% 1% 2% 4% 3% 3% 5% 5% 2%
Dissatisfied 8% 10% 7% 11% 4% 11% 8% 10% 10% 8% 7%
Satisfied 47% 47% 47% 57% 50% 42% 44% 41% 51% 50% 43%
Very satisfied 34% 32% 37% 29% 42% 27% 33% 36% 27% 24% 40%
Not sure 8% 9% 7% 2% 2% 16% 12% 11% 7% 13% 8%
please indicate the degree of satisfaction with the following aspects of your institution’s support services for international students: - opportunities to participate in social activities within the institution (e.g., travel, sports, cultural events, etc.)
Very dissatisfied 1% 2%- 1%- 1%- 1%- 3% 1% 2% 3% 3% 1%
Dissatisfied 8% 7%- 7%- 9%- 7%- 7% 9% 8% 9% 5% 5%
Satisfied 46% 45%- 46%- 56%- 50%- 30% 39% 41% 51% 32% 42%
Very satisfied 34% 36%- 35%- 29%- 37%- 28% 36% 38% 24% 42% 42%
Not sure 11% 11%- 10%- 5%- 5%- 32% 15% 12% 12% 18% 11%
please indicate the degree of satisfaction with the following aspects of your institution’s support services for international students: - opportunities to participate in learning and development activities through campus services such as student clubs/organization, societies, etc.
Very dissatisfied 2% 2%- 2%- 1% 1% 1% 2% 2% 3% 0% 1%
Dissatisfied 6% 5%- 5%- 7% 5% 4% 6% 6% 10% 3% 2%
Satisfied 48% 49%- 47%- 56% 52% 38% 42% 43% 50% 42% 44%
Very satisfied 34% 34%- 35%- 29% 38% 27% 35% 37% 24% 39% 43%
Not sure 11% 10%- 11%- 7% 4% 30% 14% 13% 13% 16% 10%
please indicate the degree of satisfaction with the following aspects of your institution’s support services for international students: - opportunities to interact with and learn from students of other cultures
Very dissatisfied 1% 2%- 1%- 1%- 2%- 1% 1% 2% 3% 3% 1%
Dissatisfied 7% 7%- 7%- 8%- 7%- 3% 7% 6% 11% 8% 4%
Satisfied 45% 45%- 45%- 56%- 49%- 39% 40% 38% 53% 29% 41%
Very satisfied 40% 41%- 41%- 33%- 40%- 35% 43% 46% 28% 53% 50%
Not sure 6% 6%- 6%- 2%- 2%- 22% 9% 8% 6% 8% 4%
please indicate the degree of satisfaction with the following aspects of your institution’s support services for international students: - opportunities to develop professional connections with faculty outside of class
Very dissatisfied 2% 2% 2% 1% 2% 3% 2% 3% 5% 0% 1%
Dissatisfied 10% 10% 10% 16% 10% 7% 10% 12% 13% 3% 7%
Satisfied 45% 46% 44% 49% 48% 40% 43% 36% 50% 53% 42%
Very satisfied 34% 33% 36% 29% 37% 31% 35% 37% 24% 37% 43%
Not sure 8% 9% 8% 4% 5% 20% 11% 11% 9% 8% 7%

Improving the International Student Experience | © 2016 World Education Services. All rights reserved.
38
please indicate your degree of satisfaction with the following institutional career preparation services to help you achieve career and employment goals: - help finding on-campus part-time jobs
Very dissatisfied 5% 5% 6% 5% 5% 6% 5% 7% 7% 3% 3%
Dissatisfied 15% 13% 16% 15% 19% 11% 12% 14% 17% 16% 15%
Satisfied 37% 38% 37% 47% 41% 26% 32% 32% 36% 32% 37%
Very satisfied 22% 23% 23% 22% 28% 14% 22% 24% 15% 24% 27%
Not sure 20% 20% 19% 12% 7% 43% 29% 23% 25% 26% 17%
please indicate your degree of satisfaction with the following institutional career preparation services to help you achieve career and employment goals: - help finding work or internships during coursework (e.g., cpt)
Very dissatisfied 5% 4% 6% 4% 5% 3% 5% 6% 7% 3% 4%
Dissatisfied 16% 15% 16% 18% 16% 17% 15% 15% 17% 13% 16%
Satisfied 37% 39% 37% 42% 43% 28% 33% 33% 36% 34% 36%
Very satisfied 24% 24% 25% 24% 29% 18% 20% 25% 18% 13% 29%
Not sure 18% 17% 17% 13% 8% 34% 27% 21% 22% 37% 16%
please indicate your degree of satisfaction with the following institutional career preparation services to help you achieve career and employment goals: - help finding post-graduation jobs or internships (e.g., job fairs, job boards, website, portals, etc.)
Very dissatisfied 4% 4% 5% 4%- 5%- 2% 5% 5% 7% 3% 4%
Dissatisfied 14% 12% 15% 16%- 16%- 18% 15% 12% 16% 5% 12%
Satisfied 40% 42% 41% 45%- 46%- 30% 34% 36% 38% 50% 39%
Very satisfied 24% 24% 24% 26%- 27%- 18% 20% 25% 18% 16% 30%
Not sure 18% 18% 15% 9%- 6%- 32% 27% 22% 22% 26% 16%
please indicate your degree of satisfaction with the following institutional career preparation services to help you achieve career and employment goals: - Knowledge among relevant staff of visa regulations related to work and internships (e.g., opt, cpt)
Very dissatisfied 3% 3% 2% 2%- 2%- 6% 3% 3% 3% 0% 2%
Dissatisfied 8% 9% 8% 9%- 7%- 13% 9% 8% 12% 8% 7%
Satisfied 42% 43% 43% 47%- 49%- 30% 37% 37% 44% 42% 39%
Very satisfied 28% 25% 30% 34%- 38%- 22% 24% 28% 20% 29% 29%
Not sure 19% 21% 17% 8%- 4%- 29% 27% 24% 21% 21% 22%
please indicate your degree of satisfaction with the following institutional career preparation services to help you achieve career and employment goals: - Institutional programs designed to help prepare students for careers (e.g., resume services, mock interviews, mentoring programs, etc.)
Very dissatisfied 3% 3% 3% 2%- 3%- 3% 3% 3% 5% 5% 1%
Dissatisfied 9% 8% 9% 10%- 9%- 10% 11% 10% 11% 8% 6%
Satisfied 45% 48% 45% 51%- 49%- 38% 42% 39% 46% 50% 41%
Very satisfied 31% 30% 32% 30%- 36%- 21% 27% 33% 22% 21% 40%
Not sure 12% 11% 11% 7%- 4%- 28% 18% 16% 16% 16% 11%
please indicate the degree to which you agree or disagree with the following statements: - overall, I believe studying in the u.S. was a good investment for my future.
Strongly dissagree 1% 1%- 1%- 1%- 1%- 2% 2% 1% 2% 3% 0%
Disagree 2% 1%- 2%- 0%- 2%- 3% 1% 1% 3% 3% 1%
Agree 36% 34%- 38%- 46%- 42%- 45% 33% 33% 43% 32% 28%
Strongly agree 58% 61%- 57%- 50%- 54%- 44% 61% 62% 50% 61% 70%
Not sure 3% 2%- 3%- 3%- 2%- 6% 3% 3% 2% 3% 1%
please indicate the degree to which you agree or disagree with the following statements: - I feel positive about my career prospects and employability.
Strongly dissagree 1% 1%- 1%- 1%- 1%- 1% 1% 1% 3% 3% 1%
Disagree 3% 3%- 3%- 4%- 3%- 4% 4% 3% 4% 5% 1%
Agree 39% 36%- 40%- 46%- 43%- 44% 39% 36% 44% 32% 27%
Strongly agree 54% 55%- 52%- 45%- 51%- 44% 52% 55% 44% 58% 70%
Not sure 4% 4%- 4%- 4%- 2%- 7% 5% 5% 6% 3% 2%
please select the thRee most significant challenges you faced with your experience in studying in the u.S.
Issues related to my visa and/or inadequate knowledge about visa regulations
18% 15% 19% 17% 23% 22% 23% 17% 16% 18% 14%
Cost of living expenses 63% 63% 63% 48% 67% 62% 59% 63% 60% 53% 71%
Cost of tuition fees 65% 69% 65% 49% 63% 89% 72% 72% 46% 68% 71%
Proficiency in English language 24% 27% 22% 48% 11% 4% 27% 32% 38% 8% 11%
Meeting academic demands 18% 16% 19% 14% 22% 24% 10% 15% 26% 21% 16%
overall Bache-lor's Master's china India canada europe
Latin america & carib-
bean
Middle east & north africa
oceaniaSub
Saharan africa
total Responses 4256 880 2300 268 747 116 490 526 440 38 765

Improving the International Student Experience | © 2016 World Education Services. All rights reserved.
39
please select the thRee most significant challenges you faced with your experience in studying in the u.S., cont.
Difficulty in adapting to U.S. academic culture
21% 25% 21% 21% 21% 13% 26% 23% 20% 24% 22%
Difficulty in developing social connections (e.g., making friends or developing close working relationships with domestic students)
33% 31% 35% 60% 34% 25% 31% 26% 36% 29% 29%
Loneliness/ homesickness 32% 32% 32% 23% 42% 28% 28% 28% 34% 34% 36%
Discrimination based on nationality, ethnicity, or other similar characteristics
16% 15% 15% 19% 12% 6% 8% 15% 21% 5% 24%
Other 9% 8% 8% 3% 6% 27% 16% 8% 4% 39% 7%
did you ever attend another educational institution in the u.S before being accepted by your most current educational institution?
Yes 32% 40% 25% 25% 17% 22% 34% 35% 42% 24% 32%
No 68% 60% 75% 75% 83% 78% 66% 65% 58% 76% 68%
In which academic level did you enroll in your current or most recent degree program in the u.S.?
Associate's degree 10% 0% 0% 1% 2% 9% 15% 16% 6% 8% 14%
Bachelor's degree 21% 100% 0% 15% 6% 34% 30% 30% 21% 29% 25%
Master's degree 54% 0% 100% 69% 82% 34% 41% 40% 53% 47% 48%
Doctoral degree 11% 0% 0% 14% 9% 20% 10% 7% 16% 8% 10%
Other 4% 0% 0% 1% 1% 3% 5% 7% 3% 8% 3%
In which field of study did you enroll at your most current degree program in the u.S.?
Business/Management 20% 23% 24% 33% 16% 12% 27% 23% 21% 16% 19%
education 8% 4% 10% 11% 1% 11% 9% 14% 10% 16% 5%
engineering 11% 10% 13% 7% 24% 3% 7% 7% 15% 8% 8%
Fine/Applied Arts 4% 6% 3% 5% 2% 8% 6% 8% 4% 11% 1%
Health professions 27% 27% 20% 16% 20% 35% 16% 19% 27% 21% 39%
Humanities 4% 4% 4% 1% 1% 4% 8% 6% 2% 8% 5%
Intensive english 1% 1% 0% 0% 0% 0% 1% 3% 3% 0% 0%
Math/Computer Science 10% 8% 13% 12% 26% 3% 4% 4% 8% 0% 7%
physical/Life Sciences 6% 6% 5% 5% 6% 7% 8% 4% 4% 0% 7%
Social Sciences 7% 8% 7% 9% 2% 12% 14% 9% 4% 11% 6%
Other 2% 3% 2% 1% 1% 3% 2% 2% 2% 11% 2%
did you change or intend to change your field of study after enrolling at your u.S. institution?
Yes 15% 22% 12% 16% 9% 10% 16% 14% 16% 16% 19%
No 79% 70% 82% 73% 87% 89% 79% 78% 77% 76% 76%
Not sure 6% 7% 6% 11% 3% 2% 5% 8% 7% 8% 6%
how influential was your family in helping you choose your field of study?
Not at all influential 31% 28% 31% 21% 17% 35% 45% 40% 27% 30% 38%
Slightly influential 19% 18% 19% 26% 19% 27% 18% 17% 20% 27% 17%
Somewhat influential 24% 28% 24% 32% 25% 23% 22% 21% 24% 27% 21%
Very influential 24% 24% 24% 19% 36% 12% 12% 20% 24% 16% 22%
Not sure 3% 2% 3% 2% 3% 3% 3% 2% 5% 0% 2%
What is your current education or employment status?
Currently enrolled at a U.S. institution 60% 66% 52% 58%- 54%- 62% 56% 62% 62% 55% 65%
Graduated from a U.S institution but not working
12% 12% 14% 16%- 13%- 6% 12% 11% 18% 11% 10%
Graduated from a U.S. institution and working
28% 22% 34% 26%- 33%- 32% 32% 27% 21% 34% 25%
overall Bache-lor's Master's china India canada europe
Latin america & carib-
bean
Middle east & north africa
oceaniaSub
Saharan africa
total Responses 4256 880 2300 268 747 116 490 526 440 38 765

Improving the International Student Experience | © 2016 World Education Services. All rights reserved.
40
how many years have you been enrolled in your current program?
Less than 1 27% 20% 33% 23%- 28%- 22%- 25%- 27%- 25%- 5%- 31%-
1 27% 23% 32% 35%- 28%- 24%- 29%- 26%- 25%- 38%- 28%-
2 29% 32% 28% 30%- 35%- 31%- 30%- 29%- 30%- 43%- 27%-
3 11% 18% 5% 8%- 6%- 13%- 14%- 14%- 12%- 14%- 8%-
4 4% 6% 2% 3%- 2%- 10%- 3%- 3%- 6%- 0% 5%-
5 1% 0% 0% 1%- 0% 0% 0% 1%- 1%- 0% 0%
6 0% 0% 0% 0% 0% 1%- 0% 0% 0% 0% 0%
7 0% 0% 0% 0% 0% 0% 0% 0% 0% 0% 0%
8 0% 0% 0% 0% 0% 0% 0% 0% 0% 0% 0%
9 0% 0% 0% 0% 0% 0% 0% 0% 0% 0% 0%
10 0% 0% 0% 1%- 0% 0% 0% 1%- 0% 0% 0%
What is your current country of employment?
U.S. 78% 80%- 76%- 86%- 93%- 41% 70% 70% 43% 62% 82%
Home country 18% 18%- 19%- 11%- 5%- 43% 21% 26% 52% 31% 12%
Other 4% 2%- 5%- 3%- 1%- 16% 8% 4% 4% 8% 6%
In which year did you graduate?
2010 8% 8% 6% 2%- 4%- 7%- 9%- 9%- 6%- 0% 9%-
2011 2% 3% 2% 1%- 1%- 2%- 2%- 2%- 4%- 0% 3%-
2012 6% 4% 5% 2%- 3%- 5%- 8%- 7%- 4%- 6%- 8%-
2013 11% 9% 11% 7%- 9%- 9%- 15%- 14%- 14%- 0% 11%-
2014 18% 18% 19% 19%- 17%- 20%- 16%- 20%- 18%- 24%- 18%-
2015 30% 30% 33% 33%- 37%- 32%- 29%- 32%- 30%- 18%- 31%-
2016 25% 27% 25% 37%- 29%- 25%- 21%- 18%- 25%- 53%- 21%-
NOTE:1. Percentage may not sum up to 100% due to rounding.2. Data with “-” indicate p-value above 0.05. 3. 4,683 responses were analyzed for this question “Please select the TWO most important reasons that lead you to seek opportunities to study abroad” of which 4,256 respondents
enrolled at a U.S. institution and 427 enrolled in an institution in a foreign country other than the U.S.
overall Bache-lor's Master's china India canada europe
Latin america & carib-
bean
Middle east & north africa
oceaniaSub
Saharan africa
total Responses 4256 880 2300 268 747 116 490 526 440 38 765

Improving the International Student Experience | © 2016 World Education Services. All rights reserved.
41
endnoteS
1. “Overall satisfaction rate” refers to two responses on a five point scale: “satisfied” or “very satisfied.” Likewise, “overall dissatisfaction rate” refers to two responses: “dissatisfied” and “very dissatisfied.” These two measures are used throughout the report. It’s important to note that for any given overall measure, adding the response figures presented in the appendix may not result in the precise overall satisfaction or dissatisfaction rate cited elsewhere in the report. This is because response rates in the appendix are rounded to whole numbers. We have not presented estimates to the nearest hundredth. However, in calculating comparative numbers, we used the more nuanced figures. Finally, it’s also important to note that percentages of overall satisfaction and dissatisfaction rates do not add up to 100 percent. This is because respondents were given the option to respond “Not sure.” In some cases, the number of respondents who answered “Not sure” was fairly high.
2. There is surprisingly little research on the topic of housing for international students.
3. A large number of MENA students - 19 percent - cited “Unsure,” more than respondents from most other regions and countries.
4. For further description of this program, see the WES webinar Good Practices for Retaining International Students (Schulmann, Cahill, & Espinoza, 2016), available at http://knowledge.wes.org/RAS-Archive-Good-Practices-for-Retaining-International-Undergraduate-Students.html.

Improving the International Student Experience | © 2016 World Education Services. All rights reserved.
42
RefeRenceS
1. Anderson, B. (2015, November 2). International students are a major source of demand for student housing. National Real Estate Investor. Retrieved from http://nreionline.com/student-housing/international-students-are-major-source-demand-student-housing.
2. Andrade, M. S. (2006). International students in English-speaking universities: adjustment factors. Journal of Research in International Education, 5(2), 131-154.
3. Asia Society. (2016). Indian society and ways of living. Retrieved from http://asiasociety.org/education/indian-society-and-ways-living.
4. Australian Government Department of Education and Training. (2015). International student survey 2014: an overview report. Canberra: Australian Government Department of Education and Training. Retrieved from https://internationaleducation.gov.au/research/research-papers/pages/research%20papers.aspx.
5. Belkin, D., & Jordan, M. (2016, March 17). How recruitment of Chinese students sows discord on U.S. campuses. Wall Street Journal. Retrieved from http://www.wsj.com/articles/heavy-recruitment-of-chinese-students-sows-discord-on-u-s-campuses-1458224413.
6. Cappuccini, G., Harvey, L., Williams, J., Bowers-Brown, T., McCaig, C., Sagu, S., & MacDonald, M. (2005). Careers advisory services and international students. Manchester, UK: Higher Education Careers Services Unit (HECSU). Retrieved from http://www.hecsu.ac.uk/assets/assets/documents/CASIS_full_report.pdf.
7. Chang, L., Schulmann, P., and Lu, Z. (2014, October). Bridging the digital divide: segmenting and recruiting international millennial students. New York: World Education Services. Retrieved from http://www.wes.org/ras.
8. Choudaha, R., Chang, L., & Schulmann, P. (2013). Student segmentation for an effective international enrollment strategy. New York: World Education Services. Retrieved from http://www.wes.org/ras.
9. Choudaha, R., & Schulmann, P. (2014). Bridging the gap: recruitment and retention to improve international student experiences. Washington, DC: NAFSA: Association of International Educators. Retrieved from https://www.nafsa.org/wcm/Cust/Custom_Cart/Product_Detail.aspx?WebsiteKey=e3842661-cf4e-4241-ba1e-62ba837f37e3&prodid=401&catId=7.
10. Dedhia, D. V., Dedhia, S. V., & Raoji., N. V. (2015, January 7.) Here’s why it’s not weird for Indian men to live at home with Mom and Dad. The Huffington Post. Retrieved from http://www.huffingtonpost.com/dipti-vaid-dedhia/why-its-not-weird-for-indian-men-to-live-at-home-with-mom-and-dad_b_6118022.html.
11. Garrett, R. (2014). Explaining international student satisfaction: initial analysis of data from the International Student Barometer. London: i-Graduate. Retrieved from http://igraduate.dev.ingelby.com/assets/Explaining-Satisfaction-ISB-2014.pdf.
12. Hazen, H. D., & Alberts, H. C. (2006). Visitors or immigrants? International students in the United States. Population, Space and Place, 12(3), 201-216.
13. Hendrickson, B., Rosen, D., & Aune, R. K. (2011). An analysis of friendship networks, social connectedness, homesickness, and satisfaction levels of international students. International

Improving the International Student Experience | © 2016 World Education Services. All rights reserved.
43
Journal of Intercultural Relations, 35(3), 281-295.
14. Hess, W. D. (2016). Social capital and the academic experience in college residential learning communities (Doctoral dissertation). Retrieved from eScholarship, the University of California, https://escholarship.org/uc/item/7056b0mg.
15. Hofstede, G., Hofstede, G. J., & Minkov, M. (2010). Cultures and organizations: software of the mind: intercultural cooperation and its importance for survival. New York: McGraw-Hill.
16. Institute of International Education (IIE). (2015a). Open Doors report on international education exchange 2015. New York: Institute of International Education. Retrieved from http://www.iie.org/opendoors.
17. Institute of International Education (IIE). (2015b). Project Atlas. New York: Institute of International Education. Retrieved from http://www.iie.org/projectatlas.
18. Jaschik, S., & Lederman, D. (2016). The 2016 Inside Higher Ed survey of college and university chief academic officers: a study by Gallup and Inside Higher Ed. Washington, DC: Inside Higher Ed. Retrieved from https://www.insidehighered.com/surveys.
19. Koo, S. (2015, December 22). Why must international students pick up the tab for U.S. higher education? Diverse: Issues in Higher Education. Retrieved from http://diverseeducation.com/article/79689/.
20. Loo, B. (2015, October 5). Saudi students flock to a diverse set of U.S. institutions. WENR: World Education News & Review. Retrieved from http://wenr.wes.org/2015/10/saudi-students-flock-to-a-diverse-set-of-us-institutions/.
21. Loo, B. (2016). Career services for international students: fulfilling high expectations. New York: World Education Services. Retrieved from http://www.wes.org/ras.
22. Lu, Z. and Schulmann, P. (2015). How master’s students choose institutions: research on international student segmentation. New York: World Education Services. Retrieved from http://www.wes.org/ras.
23. McDonald, M. (2012, February 7). Chinese students paying US tuitions – How? And why? New York Times. Retrieved from http://rendezvous.blogs.nytimes.com/2012/02/07/how-chinese-students-pay-u-s-tuitions/.
24. Maslen, G. (2014, October 24). Tuition fees differ markedly between nations. University World News. Retrieved from http://www.universityworldnews.com/article.php?story=20141023 143034110.
25. Neri, F. V. & Ville, S. (2008). Social capital renewal and the academic performance of international students in Australia. Journal of Socio-Economics, 37(4), 1515-1538.
26. Redden, E. (2015, January 7). The University of China at Illinois. Inside Higher Ed. Retrieved from https://www.insidehighered.com/news/2015/01/07/u-illinois-growth-number-chinese-students-has-been-dramatic.
27. Savills. (2015). Spotlight: world student housing 2015/16. London: Savills. Retrieved from http://classof2020.nl/wp-content/uploads/2016/06/Spotlight-World-Student-Housing-201516-Savills1.pdf.
28. Schulmann, P., Cahill, J., & Espinoza, C. (2016, June 24). Good practices for retaining international

Improving the International Student Experience | © 2016 World Education Services. All rights reserved.
44
undergraduate students (Webinar recording). New York: World Education Services. Retrieved from http://knowledge.wes.org/RAS-Archive-Good-Practices-for-Retaining-International-Undergraduate-Students.html.
29. Stanek, B. (2014, December 19). The average cost of U.S. tuition is $29,408 per year. In these 9 countries, it’s free. News.Mic. Retrieved from https://mic.com/articles/106866/the-average-cost-of-u-s-tuition-is-33-788-per-year-in-these-7-countries-it-s-free#.wYJ6IV7Kn.
30. Statista. (2016a). Youth unemployment rate in Europe (EU member states) as of May 2016 (seasonally adjusted) (data table). Retrieved from http://www.statista.com/statistics/266228/youth-unemployment-rate-in-eu-countries/.
31. Statista. (2016b). Youth unemployment rate (under 25 years) in the European Union and the Euro area from May 2015 to May 2016 (seasonally adjusted) (data table). Retrieved from http://www.statista.com/statistics/276424/youth-unemployment-rate-in-the-eu-and-euro-area/.
32. Torkington, S. (2016, August 8). Which languages do people most want to learn? World Economic Forum. Retrieved from https://www.weforum.org/agenda/2016/08/languages-most-people-speak-and-learn/.
33. UNFPA (United Nations Population Fund). (2014). The power of 1.8 billion: adolescents, youth, and the transformation of the future of Sub-Saharan Africa. Retrieved from https://www.unfpa.org/sites/default/files/resource-pdf/SWOP%202014%20fact%20sheet%20-%20Youth%20in%20SUB-SAHARAN%20AFRICA.pdf.
34. University of Montana. (2016). Featured training. Retrieved from http://www.umt.edu/hrs/Personnel%20Resources/Training%20and%20Development/Featured%20Training.php.
35. U.S. Customs & Immigration Enforcement (ICE). (2016). Student and Visitor Exchange Program: practical training. Retrieved from https://www.ice.gov/sevis/practical-training.
36. Young, N. E. (2014). Seeking best practices for integrating international and domestic students. Minneapolis: University of Minnesota - International Student & Scholar Services (ISSS). Retrieved from https://global.umn.edu/icc/documents/14_integration_best_practices_overall.pdf.
37. Zhao, C. M., Kuh, G. D., & Carini, R. M. (2005). A comparison of international student and American student engagement in effective educational practices. Bloomington, IN: Indiana University Bloomington. Retrieved from http://nsse.indiana.edu/pdf/research_papers/international.pdf.

Improving the International Student Experience | © 2016 World Education Services. All rights reserved.
45
aBoUt the aUthoRs
Megha Roy, Research Associate
Megha earned a master’s degree in marketing intelligence from Graduate School of Business Administration at Fordham University, New York, and a bachelor’s degree in physics honors from Delhi University, India.
Contact: [email protected]
Zhengrong Lu, Research Associate
Zhengrong earned a master’s degree in applied statistics from Teachers College, Columbia University, and a bachelor’s degree in public health administration from Fudan University, China.
Contact: [email protected]
Bryce Loo, Research Associate
Bryce earned a master’s degree in international education development from Teachers College, Columbia University, and a bachelor’s degree in history from California State University, Bakersfield.
Contact: [email protected]
aBoUt wes ReseaRch
WES Research helps institutions maximize the impact of international enrollment efforts with future-ready strategies that align with campus needs and priorities. Our approach is research-based, data-driven, collaborative, and grounded in global best practices. To discuss engagement opportunities, please contact: [email protected]
For more information on WES Research, please download our information flyer.
aBoUt woRld edUcation seRvices
For over 40 years, WES has set the standard for excellence in the field of international mobility. We understand the complexities of internationalization and provide knowledge, research, and expert advice so academic institutions can make the best admissions and enrollment decisions. We provided more than 1.5 million credential evaluations to international students and skilled immigrants and deliver credential evaluation reports to more than 2,500 institutions worldwide.
Improving the International Student Experience | © 2016 World Education Services. All rights reserved.
46
WeS ReSeaRch RepoRtS
Visit wes.org/RAS to download our free reports. To stay on top of these trends, please subscribe to our newsletter.
hoW MaSteR’SStudentS chooSeInStItutIonS
ReseaRch
07
How Master’s Students Choose Institutions: Research on International Student SegmentationExamines the characteristics and attributes different segments of international master’s students value when applying to U.S. colleges and universities. The report provides recommendations for how institutions can build their value proposition and attract best-fit international students.
InteRnatIonaLStudentMoBILItytRendS 2014
ReseaRch
06Bridging the Digital Divide: Segmenting and Recruiting International Millennial StudentsAnalyzes nearly five thousand 17-to-36-year-old international Millennials’ use of technology and the psychographic characteristics that influence their information-seeking behavior.
InteRnatIonaLStudentSegMentatIon
ReseaRch
05
Student Segmentation for an Effective International Enrollment StrategyExamines how different international student segments inform enrollment strategies. The report is based on a survey of nearly 3,000 U.S.-bound international students and highlights how students’ information-seeking behavior varies by education level and country.
RecognIZIng Refugee QuaLIfIcatIonS
ReseaRchRecognizing Refugee Qualifications: Practical Tips For Credential AssessmentThis report is an overview of WES’s research on worldwide practices in the assessment of credentials and qualifications of refugees. It provides institutions, licensing bodies, and employers with an understanding of practices for recognizing the qualifications and credentials of refugees.
caReeR SeRvIceS foR InteRnatIonaLStudentS
ReseaRch Career Services for International Students: Fulfilling High ExpectationsResearch has shown that career prospects are a key consideration for international students as they decide where to apply. To provide institutions with recommendations on career services, WES conducted a survey and interviews with key personnel at higher education institutions in the U.S.
Mobility MonitorWES Research & Advisory Services’ monthly Mobility Monitor analyzes international student mobility patterns to help institutions inform their market-specific strategies.
our expertise. your Success.
wes.org
Find us on Facebook, LinkedIn, and Twitter.
Tweet us with any questions and comments online by using #WESresearch.
Click here to subscribe to our newsletter.
World education Services is a non-profit organization whose mission is to foster the integration of internationally educated persons into academic and professional settings.