improvement proposal for a software requirements
TRANSCRIPT

IMPROVEMENT PROPOSAL FOR A SOFTWARE REQUIREMENTS MANAGEMENT PROCESS
A THESIS SUBMITTED TO
THE GRADUATE SCHOOL OF INFORMATICS
OF
THE MIDDLE EAST TECHNICAL UNIVERSITY
BY
PINAR IŞIL YAMAÇ
IN PARTIAL FULFILLMENT OF THE REQUIREMENTS FOR THE DEGREE OF
MASTER OF SCIENCE
IN
THE DEPARTMENT OF INFORMATION SYSTEMS
APRIL 2006

Approval of the Graduate School of Informatics ___________________
Assoc. Prof. Dr. Nazife BAYKAL Director
I certify that this thesis satisfies all the requirements as a thesis for the degree of Master of Science. ___________________
Assist. Prof. Dr. Yasemin YARDIMCI Head of Department
This is to certify that we have read this thesis and that in our opinion it is fully adequate, in scope and quality, as a thesis for the degree of Master of Science. ___________________
Prof. Dr. Semih BİLGEN Supervisor
Examining Committee Members Assoc. Prof. Dr. Onur DEMİRÖRS (METU, II) _____________________ Prof.Dr. Semih BİLGEN (METU, EE) _____________________ Dr. Altan KOÇYİĞİT (METU, II) _____________________ Dr. Çiğdem GENCEL (METU, II) _____________________ Bekan ÇELİK (MS.) (HAVELSAN A.Ş) _____________________

iii
I hereby declare that all information in this document has been obtained and
presented in accordance with academic rules and ethical conduct. I also declare
that, as required by these rules and conduct, I have fully cited and referenced
all material and results that are not original to this work.
Name, Last name : Pınar Işıl, Yamaç
Signature :

iv
ABSTRACT
IMPROVEMENT PROPOSAL FOR A SOFTWARE REQUIREMENTS MANAGEMENT PROCESS
Yamaç, Pınar Işıl
M.S., Department of Information Systems
Supervisor: Prof. Dr. Semih Bilgen
April 2006, 71 pages
This thesis focuses on measurement based software process improvement, especially
improvement of requirements change management process. The literature on
software measurement is investigated, software process improvement methodologies
are studied and requirements change management metrics are examined.
Requirements change management process at a private company working in the
defense industry is observed and metrics obtained from various tools have been
aggregated. Moreover, an improvement proposal, which also simplifies collecting
metrics, is presented for the requirements change management process. A tool is
developed for evaluating the performance of the improvement proposal using event
driven simulation method.
Keywords: Software Measurement, Software Process Improvement, Event Driven
Simulation, Requirements Management

v
ÖZ
YAZILIM GEREKSİNİM YÖNETİMİ SÜRECİ İÇİN İYİLEŞTİRME ÖNERİSİ
Yamaç, Pınar Işıl
Yüksek Lisans, Bilişim Sistemleri Bölümü
Tez Yöneticisi: Prof. Dr. Semih Bilgen
Nisan 2006, 71 sayfa
Bu tez ölçüm tabanlı yazılım süreç iyileştirmeyi, özelikle gereksinim değişiklik
yönetimi sürecini iyileştirmeyi hedeflemektedir. Yazılım ölçümü ile ilgili literatür ve
yazılım süreç iyileştirme metodolojileri araştırılmış ve gereksinim değişiklik
yönetimi metrikleri incelenmiştir.
Savunma sanayi sektöründe faaliyet gösteren özel bir şirketin gereksinim değişiklik
yönetimi aktiviteleri gözlemlenmiş ve çeşitli araçlardan elde edilen ölçüm verileri
birleştirilmiştir. Ayrıca, gereksinim değişiklik yönetimi süreci için metrik toplamayı
kolaylaştıracak bir iyileştirme önerisi sunulmuştur. İyileştirme önerisinin
performansını değerlendirebilmek için de olaya dayalı benzetim metodu kullanılarak
bir yazılım aracı geliştirilmiştir.
Anahtar Kelimeler: Yazılım Ölçüm, Yazılım Süreci İyileştirme, Olaya Dayalı
Benzetim, Gereksinim Yönetimi

vi
To my grandparents…

vii
ACKNOWLEDGEMENTS
I first thank to my thesis supervisor Prof. Dr. Semih Bilgen for providing guidance,
encouragement and insight throughout the research. This thesis would not have been
completed without his endless support.
I offer sincere thanks to my husband, Onur, for his support, endless patience and
precious suggestions and comments about this thesis.
Finally, I would like to thank to my family for their love and morale support.

viii
TABLE OF CONTENTS
PLAGIARISM ............................................................................................................ iii
ABSTRACT................................................................................................................ iv
ÖZ ................................................................................................................................ v
ACKNOWLEDGEMENTS .......................................................................................vii
TABLE OF CONTENTS..........................................................................................viii
LIST OF TABLES ....................................................................................................... x
LIST OF FIGURES .................................................................................................... xi
LIST OF ABBREVIATIONS AND ACRONYMS...................................................xii
CHAPTER
1. INTRODUCTION.................................................................................................... 1
1.1. The Purpose and Scope of the Study................................................................. 2
1.2. The Approach.................................................................................................... 2
1.3. Thesis Structure................................................................................................. 3
2. RELATED RESEARCH.......................................................................................... 4
2.1. CMMI®.............................................................................................................. 5
2.2. Differences between CMMI® and SW-CMM®................................................. 8
2.3. Goal/Question/Metric Approach..................................................................... 10
2.4. Implementations of GQM in Industry............................................................. 14
2.5. Relation between CMMI® and GQM.............................................................. 15
2.6. Requirements Management Metrics ............................................................... 16
2.7. Summary ......................................................................................................... 19
3. THE CASE STUDY .............................................................................................. 20
3.1. Research Method............................................................................................. 20
3.2. Description of the Case Study......................................................................... 20
3.3. Current Approach............................................................................................ 21
3.4. Current Collection Method for Requirements Management Metrics ............. 27

ix
4. IMPROVEMENT PROPOSAL FOR REQUIREMENTS CHANGE
MANAGEMENT....................................................................................................... 30
4.1. Metrics To Be Collected Automatically ......................................................... 30
4.2. Proposed Model for Requirement Change Procedure..................................... 33
4.3. Comparison of the Current Method and Proposed Method ............................ 38
5. METRIC COLLECTION TOOL........................................................................... 40
5.1. Purpose............................................................................................................ 40
5.2. Scope ............................................................................................................... 40
5.3. System Architecture ........................................................................................ 41
5.4. User Interfaces ................................................................................................ 42
5.5. Evaluation of the Metric Collection Tool ....................................................... 43
6. SIMULATION-BASED EVALUATION OF THE PROPOSED
IMPROVEMENTS .................................................................................................... 45
6.1. Why Simulation?............................................................................................. 45
6.2. Variables of Simulation................................................................................... 46
6.3. Simulation Logic............................................................................................. 48
6.4. Details of Simulation....................................................................................... 50
6.5. Simulation Results and Discussion ................................................................. 55
6.5.1. Response to Change in ProbCR and ProbAQCD .................................... 57
6.5.2. Response to Change in AvQ and AvQDayOpen ..................................... 57
7. CONCLUSION...................................................................................................... 62
7.1. Summary ......................................................................................................... 62
7.2. Limitations and Future Work .......................................................................... 66
REFERENCES........................................................................................................... 68
APPENDICES
A. SCREENSHOTS OF METRIC COLLECTION TOOL....................................... 71

x
LIST OF TABLES
TABLE 1: Advantages of using each model representation of CMMI® .................................. 7
2. Questions and metrics for Requirements Management PA ................................... 17
3. Activities in the original process............................................................................ 23
4. Attributes and descriptions for requirements ......................................................... 26
5. Activities in the proposed process.......................................................................... 34
6. Independent variables of simulation tool ............................................................... 47
7. Dependent variables of simulation tool.................................................................. 48
8. Constant values determined for the selected independent variables...................... 56
9. Values used in the simulation tool ......................................................................... 56

xi
LIST OF FIGURES
FIGURE
1. CMM Model structure for staged and continuous representations .......................... 6
2. Hierarchical structure of GQM model ................................................................... 12
3. Relationship between CMMI® and GQM.............................................................. 15
4. Organization chart of Project X ............................................................................. 21
5. Current Activities for Requirements Change Management Process...................... 22
6. Modified Activities for Requirements Change Management Process ................... 37
7. Inputs and outputs of MCT .................................................................................... 42
8. Flowchart of the simulation tool ............................................................................ 49
9. Flow diagram of the events of the simulation........................................................ 53
10. Class diagram of entities used in simulation........................................................ 54
11. Response to change in ProbCR and ProbAQCD in current approach ................. 58
12. Response to change in ProbCR and ProbAQCD in proposed method................. 59
13. Response to change in AvQ and AvQDayOpen in current approach .................. 60
14. Response to change in AvQ and AvQDayOpen in proposed method ................. 61

xii
LIST OF ABBREVIATIONS AND ACRONYMS
AMI Application of Metrics in Industry
CMM Capability Maturity Model
CMMI® Capability Maturity Model Integration
GQM Goal/Question/Metric
KPA Key Process Area
NASA National Aeronautics and Space Administration
LOC Lines of Code
PA Process Area
PSM Practical Software Measurement
QIP Quality Improvement Paradigm
RE Requirements Engineering
SCR Software Change Request
SEI Software Engineering Institute
SPI Software Process Improvement
SPICE Software Process Improvement Capability dEtermination
SRS Software Requirements Specification
SW-CMM Software Capability Maturity Model
WIW Was-Is-Why

1
CHAPTER 1
INTRODUCTION
Software process is seen as a set of activities, methods and practices used in
the production and evolution of software [1]. Software process improvement (SPI),
then, is the mechanism through which the quality of software processes is improved.
There are many ways in the literature to improve software processes. Top-
down and bottom-up approaches are the most well-known approaches in SPI. In top-
down approach, software processes are tried to be improved by eliminating the
differences between an existing project and a standard one. CMM, SPICE and ISO
9000 family are the examples of top-down approaches. Bottom-up approaches use
software metrics for improvement of the software processes. In the scope of this
thesis, Capability Maturity Model (CMM) and Goal Question Metric (GQM) are
investigated from a measurement based point of view.
Requirements engineering (RE) in a software development process is focused
in this study. RE is the practice used to first identify and then translate stakeholder
needs to system requirements [2]. Good quality RE can be achieved by continuously
measuring an RE process, and if found to be deficient, improve it by eliminating the
process problems or gaps (defined as the difference between the desired and existing
states in a process), that cause poor quality. Good quality RE processes will ensure
that the quality of requirements that are developed is good [3].
Often, research effort in this direction is aligned against:
• Standard-based approaches, such as CMM or ISO [4]
• Technique-based approaches, like defect prevention techniques [5]
• Examining specific process improvement program outcomes in industry [6].

2
Although CMM is used for RE in the literature, merging organization’s goals
with the goals of CMM and applying two streams in SPI at the same time seems to
be a viable approach.
1.1. The Purpose and Scope of the Study
This study aims to propose measurement based software process
improvement in a particular project. A software development project carried out at a
company working in the defense industry is selected as case study and the
measurement processes with a focus on requirements change management process
applied in the project are examined. Software process improvement is not applied
organization-wide; it is only applied within the scope of a project, hereafter called
Project X, and on the requirements change management process at that project.
It is observed that main problem of the project is lack of visibility of
requirements volatility and uncontrolled requirements change management process.
Problems encountered in the requirements change management process at software
development project are tried to be solved by measurement based software process
improvement. Main aim of the study is to enhance the visibility of requirements
volatility and propose improvements to the requirements change management
process so that the detrimental effects of this volatility on project duration and
product quality are reduced.
1.2. The Approach
Measurement is used as a key factor in this study. First of all, previous studies
about SPI are investigated. Then requirements change management metrics in the
literature are examined and CMMI® and GQM techniques are used to select metrics
to be collected. The study intends to use requirements change management metrics
effectively.
Since there are many sources from where metrics can be collected throughout
the process being studied, a tool is developed for automating metric collection
activities about requirements change management process and aggregating those
metrics. Afterwards, an improvement proposal is developed for the requirements
change management process of the chosen project and evaluated with a tool that
simulates both the current approach and the improvement proposal. Finally, results

3
obtained from simulation are compared with the current system with the aim of
assessing whether the proposed system does realize the expected improvements.
1.3. Thesis Structure
Chapter 2 provides detailed information about top-down and bottom-up
approaches of SPI methods. Examples from both CMM and GQM are considered
from a measurement view point and the relationship between these two methods is
reviewed.
Chapter 3 presents the current approach of the requirements change
management process in the Project X. Problems encountered in the project are shown
and collected metrics are listed.
Chapter 4 presents an improvement proposal for the requirements change
management process of a software development project. In addition, requirements of
the tool developed for collecting metrics easily are presented.
Chapter 5 describes the scope and purpose of the metric collection tool
developed. In addition, system architecture and user interfaces of the tool are
presented.
Chapter 6 presents the simulation based evaluation of the improvement
proposal for the requirements change management process of Project X. The effects
of the proposed improvements under various settings of number of requirements,
number of programmers working for the project, average source lines of code that
implement each requirement, probability of changing a requirement, average
duration of open time of a change request, average number of questions asked,
average duration of open time of a question, probability of getting an answer that
change design and probability of getting an answer that changes requirement of
software development process performance as size of re-work and duration of the
project are investigated in this chapter.
Finally, Chapter 7 presents the conclusion to the study with suggestions for
possible future work.
4
CHAPTER 2
RELATED RESEARCH
The improvement of software processes has become one of the main aims of
companies dedicated to the development and maintenance of computing systems.
The need to improve processes arises from the fact that the quality of a process is
closely related to the quality of the product, which means that in order to get better
products one need to have better processes. There are two main streams within
Software Process Improvement (SPI) [7]. One of them is based on assessments of
organization’s capability, e.g. Capability Maturity Model Integration (CMMI®) [8],
Software Process Improvement Capability dEtermination (SPICE) [9] and ISO9000
family. This top-down approach compares an organization process with some
generally accepted standard processes and tries to improve the process by eliminating
the differences between an existing project and a standard one. The other is based on
measurements of software practices within an organization, e.g. Experience Factory
[10], Quality Improvement Paradigm (QIP) [11] and the Application of Metrics in
Industry (AMI) [12]. Goal/Question/Metric (GQM) is also considered as a bottom up
approach according to [13]. These two approaches complement each other because
software measurement is inherent to the concept of improvement. Although there has
been a significant correlation between the measurement and software process
improvement, they are seldom applied together.
This chapter summarizes the literature on software process improvement
methods and analyzes the most well-known methods used for SPI: CMMI® and
GQM. Section 2.1 surveys research about CMMI and gives a general idea about
CMMI and how to use it. Section 2.2 surveys differences between CMMI® and
Software Capability Maturity Model (SW-CMM®), the older method of Software

5
Engineering Institute (SEI). Section 2.3 surveys Goal/Question/Metric Method and
section 2.4 surveys implementations of GQM in industry with or without CMMI®.
Relations between GQM and CMMI® are discussed in section 2.5 to present the
application of GQM paradigm to CMMI® in later chapters. Finally, requirements
management metrics found out using GQM methodology in literature are searched in
section 2.6.
2.1. CMMI®
Demonstrable benefits from using the SW-CMM® v1.1 for process
improvement since its release in 1993 have spawned the development of a number of
capability models. These models, developed by a number of different organizations,
have overlapping scopes and lack consistency in architecture, terminology, and
assessment methodology. This situation of multiple models, assessment methods,
and training deployed in a single organization, at significant cost, was a catalyst for
CMMI®.
A CMMI® design goal is to integrate disciplines, starting with existing
capability models and eliminating inconsistencies and duplication to streamline and
reduce the cost of model-based process improvement, and increase the return on
investment. [14] It provides a single, integrated model for systems and software
engineering process improvement.
The CMMI® explicitly requires both a staged representation and a continuous
representation, which is the main difference from SW-CMM®. In a staged
representation, each maturity level contains a specific set of process areas that must
be achieved before moving to a higher maturity level. The continuous representation
has only a recommended sequence of process areas that should be achieved. In fact,
process areas are the basic building blocks in every CMMI® model. A process area
does not describe how an effective process is executed (e.g., entrance and exit
criteria, roles of participants, resources). It describes what those using an effective
process do (practices) and why they do those things (goals).
To accommodate this variation of source models, the CMMI® product suite
offers staged and continuous representations of each CMMI® model as shown in
Figure 1. Apart from process areas, there are generic and specific goals as well as
generic and specific practices. Common features organize general practices [8].

6
Figure 1. CMM Model structure for staged and continuous representations [8]
In CMMI® models with a staged representation, there are 5 maturity levels
consisting of a predefined set of process areas.
1. Initial: Processes are usually ad hoc and chaotic. Organization usually
doesn’t provide a stable environment and success depends on heroics of
the people in the organization.
2. Managed: Organization has achieved all the generic and specific goals of
maturity level 2. Projects of the organization have ensured that
requirements are managed and the processes are planned, performed,
measured and controlled.
3. Defined: Processes are well characterized and understood, and are
described in standards, procedures, tools and methods. Processes are
managed more proactively.
4. Quantitatively Managed: Quantitative objectives for quality and process
performance are established and used as criteria in managing processes.
Performance of processes is controlled using statistical and other
quantitative techniques and is quantitatively predictable.
5. Optimizing: Level 5 focuses on continually improving process
performance through both incremental and innovative technological
improvements. Quantitative objectives are established, continually
revised to reflect changing business objectives and used as criteria in
managing process improvement. [8]
The maturity levels are measured by the achievement of specific and generic
goals that apply to these process areas. With the exception of Level 1, each maturity

7
level is associated with a set of process areas and each process area has generic and
specific goals. Specific goals have specific practices and generic goals that are
supposed to provide evidence that the process area is effective, repeatable and long-
lasting. Practices are organized into 5 sections called common features:
1. Commitment to perform includes practices that ensure that the process is
established and will endure.
2. Ability to perform includes practices that establish the necessary conditions
for implementing the process completely.
3. Activities performed includes practices that directly implement a process.
These practices distinguish a process area from others.
4. Directing implementation includes practices that monitor and control the
performance of the process.
5. Verifying implementation includes practices that ensure compliance with
the requirements of the process area. These typically involve reviews and audits.
In the continuous representation of a CMMI® model, the summary
components are process areas. Within each process area there are specific goals that
are implemented by specific practices. Also contained in the continuous
representation of a CMMI® model are generic goals that are implemented by generic
practices. Specific goals and practices are unique to individual process areas,
whereas generic goals and practices apply to multiple process areas. Each practice
belongs to only one capability level. To satisfy capability Level 2 for a process area,
an organization must satisfy the specific goals and Level 2 practices for that process
area as well as the Level 2 generic goals for that same process area. [14]
Table 1: Advantages of using each model representation of CMMI® [14]
Continuous Representation Staged Representation Grants explicit freedom to select the
order of improvement that best meets the organization’s business objectives and mitigates the organization’s areas of risk.
Introduces a sequence of improvements, beginning with basic management practices and progressing through a predefined and proven path of successive levels.
Enables increased visibility into the capability achieved within each individual process area
Visibility is primarily at the maturity level with limited visibility at the process level
Allows the generic practices from higher capability levels to be more evenly and completely applied to all of the process areas
Generic practices are grouped as institutionalization common features that are applied to all process areas at all maturity levels
8
When making the decision about which architectural representation to use for
process improvement, organizations would consider the comparative advantages of
each approach as represented in Table 1.
2.2. Differences between CMMI® and SW-CMM®
Actually CMMI® is evolved from what has become the de facto standard for
assessing and improving software engineering processes, the SW-CMM®. However
it differs from SW-CMM® from many ways:
Additional process areas.
Additional practices.
Staged and continuous representations.
Capability level goals, mapped to institutionalization practices, in the
staged representation.
One of the main differences is the change in the names in CMMI® Maturity
Level “Repeatable” and “Key Process Area” (KPA) which are now “Managed” and
“Process Area” (PA) respectively. In general some Process Area's are different in the
CMMI as it modified some of the existing SW-CMM Key Process Area's and added
one additional Process Area, to bring the total to seven defining CMM Level 2 in the
SW-CMM®.
The five Common Features now include a new key practice, “Directing
Implementation”, which replaces the SW-CMM® key practice of Measurement and
Analysis.
When process areas are analyzed in detail, following differences are
determined [15]:
SW-CMM® KPA "Software Quality Assurance" is combined into
"Product and Process Quality Assurance". The purpose of “Process
and Product Quality Assurance” is to objectively review activities and
work products for their adherence to applicable requirements, process
descriptions, standards, and procedures, and communicate the results
to staff and management. It will have a slightly different role of
visibility through objective reviews of the way products are
developed.

9
Name of SW-CMM® KPA "Software Project Tracking and Oversight"
is changed to "Project Monitoring and Control". It better describes the
PA's purpose- to provide adequate visibility into the progress of the
project so that appropriate corrective actions can be taken when the
project's performance deviates significantly from the plan.
Name from SW-CMM KPA "Software Project Subcontract
Management" is changed to “Supplier Agreement Management". It is
just a name change. The purpose of “Supplier Agreement
Management” is to manage the acquisition of products and services
from sources external to the project to provide adequate visibility into
a project's progress.
The "Measurement and Analysis" PA is new. Its purpose is to develop
and sustain a measurement capability in support of management
information. This PA was derived from the Measurement and
Analysis common feature to a PA as a definite lesson learned. It
centralizes organizations to implement measurement easier than if the
equivalent practices spread across multiple PAs, as was done in the
SW-CMM.
Project Planning's purpose is to establish and maintain plans that
define project activities. While the KPA of Software Configuration
Management in the SW-CMM specifically identified a Software
Configuration Management Plan, the CMMI® relaxed this to cover the
practices for performing Configuration Management functions.
However, it better standardized what content is needed for
establishing and maintaining plans to control the project.
The CMMI® uses "Directing Implementation," a new key practice
based on the SW-CMM "Measurement and Analysis." Significantly,
this key practice now implements management and analysis rather
than saying they need to be done in the SW-CMM®. This change
enhances the key practice with action on what to do.

10
2.3. Goal/Question/Metric Approach
Everybody in software community agrees that software development requires
a measurement mechanism for feedback and evaluation. According to Tom De
Marco, “You can not control what you can not measure” [16]. Measurement is
usually performed for SPI and when there exists a lot of metrics; measurement
program will probably end up with many unnecessary and confusing data.
Measurement can even make the goal unattainable.
Taking this situation into account, Basili et al. declares how a measurement
program becomes effective [17]. According to authors, in order to be effective
measurement must be:
1. Focused on specific goals
2. Applied to all life-cycle products, processes and resources;
3. Interpreted based on characterization and understanding of the
organizational context, environment and goals.
GQM approach is based upon the assumption that for an organization to
measure in a purposeful way it must first specify the goals for itself and its projects,
then it must trace those goals to the data that are intended to define those goals
operationally, and finally provide a framework for interpreting the data with respect
to the stated goals. Thus it is important to make clear, at least in general terms, what
informational needs the organization has, so that these needs for information can be
quantified whenever possible, and the quantified information can be analyzed in
order to observe whether or not the goals are achieved.
GQM method was first developed in the 1980s as a way to focus on the kind
of data that were necessary to address certain perceived defects in the NASA
software development process [10]. In 1996, SEI published a well-structured
guidebook on GQM [18].
The GQM measurement model has three levels [10]:
1. Conceptual level (GOAL): A goal is defined for an object, for a variety of
reasons, with respect to various models of quality, from various points of view,
relative to a particular environment. Objects of measurement are:
• Products: Artifacts, deliverables and documents that are produced during the
system life cycle; E.g., specifications, designs, programs, test suites.
11
• Processes: Software related activities normally associated with time; E.g.,
specifying, designing, testing, interviewing.
• Resources: Items used by processes in order to produce their outputs; E.g.,
personnel, hardware, software, office space.
2. Operational level (QUESTION): A set of questions is used to characterize
the way the assessment/achievement of a specific goal is going to be performed
based on some characterizing model. Questions try to characterize the object of
measurement (product, process, resource) with respect to a selected quality issue and
to determine its quality from the selected viewpoint.
3. Quantitative level (METRIC): A set of data is associated with every
question in order to answer it in a quantitative way. The data can be
• Objective: If they depend only on the object that is being measured and not
on the viewpoint from which they are taken; e.g., number of versions of a document,
staff hours spent on a task, size of a program.
• Subjective: If they depend on both the object that is being measured and the
viewpoint from which they are taken; e.g., readability of a text, level of user
satisfaction.
A GQM model is a hierarchical structure, as presented in Figure 2, starting
with a goal (specifying purpose of measurement, object to be measured, issue to be
measured, and viewpoint from which the measure is taken). The goal is refined into
several questions, such as the one in the example, that usually break down the issue
into its major components. Each question is then refined into metrics, some of them
objective such as the one in the example, some of them subjective. The same metric
can be used in order to answer different questions under the same goal. Several GQM
models can also have questions and metrics in common, making sure that, when the
measure is actually taken, the different viewpoints are taken into account correctly
(i.e., the metric might have different values when taken from different viewpoints).
[19]
The process of setting goals is critical to the successful application of the
GQM approach and it is supported by specific methodological steps. A goal has three
coordinates [10]:
1. Issue
2. Object (process)

12
3. Viewpoint
and a Purpose
Figure 2. Hierarchical structure of GQM model [19]
Basili also provides a guideline for goal definition. He says that a goal should
have 3 elements:
1. Purpose: To (characterize, evaluate, predict, motivate, etc.) the (process,
product, model, metric, etc.) in order to (understand, assess, manage, engineer, learn,
improve, etc.) it.
2. Perspective: Examine the (cost, effectiveness, correctness, defects,
changes, product metrics, reliability, etc.) from the point of view of the (developer,
manager, customer, corporate perspective, etc.)
3. Environment: The environment consists of the following: process factors,
people factors, problem factors, methods, tools, constraints, etc.
Taking his approach, if the goal of organization is “Improve the timeliness of
change request processing from the project manager's viewpoint”, coordinates of this
goal will be as follows:
[issue] timeliness
[object] change request processing
[viewpoint] project manager
[purpose] improve
Therefore, the development of a goal is based on three basic sources of
information. The first source is the policy and the strategy of the organization that
applies the GQM approach. From this source both the issue and the purpose of the
Goal is derived. The second source of information is the description of the process
and products of the organization. From this source the object coordinate of the Goal
by specifying process and product models is derived. The third source of information
13
is the model of the organization, which provides the viewpoint coordinate of the
Goal.
After setting the goal, questions that characterize that goal in a quantifiable
way should be developed. According to [10], questions should characterize the object
(product, process, or resource) with respect to the overall goal of the specific GQM
model, characterize the attributes of the object that are relevant with respect to the
issue of the specific GQM model and also evaluate the characteristics of the object
that are relevant with respect to the issue of the specific GQM model. Perkins et al.
suggests that questions should have the following characteristics: [20]
Questions only elicit information that indicates progress toward or
completion of a specific goal.
Questions can be answered by providing specific information. (They
are unambiguous.)
Questions ask all the information needed to determine progress or
completion of the goal.
Once the questions have been developed, associating the question with
appropriate metrics is needed. Each question can be answered by one or more
metrics. These metrics are defined and associated with their appropriate questions
and goals. While choosing metrics, it should never be forgotten that GQM models
need always refinement and adaptation, therefore the measures defined must help in
evaluating not only the object of measurement but also the reliability of the model
used to evaluate it.
Deriving which metrics are needed for the goal to attain is the last step of the
GQM approach. But as Zubrow said [21] software measurement activities are like
potential and kinetic energy. Gathering the data creates a potential, but it takes
analysis and action to make it kinetic. After deriving metrics, Zubrow recommends
identifying the actions to implement the measures and preparing a plan to implement
the measures. He also mentions that the goal-driven software measurement process
directs attention toward measures of importance rather than measures that are merely
convenient [21].

14
2.4. Implementations of GQM in Industry
Although software engineers generally agree that software measurement must
be goal oriented, little has been published on the results of shifting to goal-
orientation. In their article, authors summarize industrial experiences with the GQM
approach to software engineering measurement [22]. They give both a summary of
their experiences and a brief description of how the GQM approach has improved
their measurement programs. They describe the activities in their measurement
programs and try to help more organizations shift to goal-oriented measurement.
According to them GQM approach is characterized by two processes: a top-down
refinement of measurement goals into questions and then into metrics, and a bottom-
up analysis and interpretation of the collected data [22].
For SPI, Birk et. al, integrated the GQM approach into the Quality
Improvement Paradigm (QIP) [11]. First they established a GQM team which is
embedded in the quality assurance group and includes the quality assurance manager,
a GQM coach, and a quality engineer. The team’s main activities were to:
initiate measurement programs within development projects,
carry out interviews and develop GQM deliverables,
check data collection from the project team and handle available data,
prepare feedback sessions by creating analysis slides,
moderate feedback sessions,
report progress to the project team and management, and
disseminate results.
Authors argue that, abstract sheet consisting of quality focus, baseline
hypothesis; variation factors and impacts on baseline hypothesis quadrants can be
used as a guide when interviewing with the project personnel about the measurement
program. Authors also state that abstract sheets, regular and well-prepared feedback
sessions have been a key to the success of their measurement programs. According to
them, the feedback sessions must reflect the main principles of goal-oriented
measurement. That is, the measurement program must address the interests of those
providing the data and must be based on the project team’s knowledge because they
are the ones who best understand the measurement goals and the only ones who can
accurately interpret the collected data. [22]
15
Another usage of GQM is described in [23]. In their approach, authors begin
with the listing problems at the organization and then state business goals. After that
they worked backwards what improvement actions are necessary to achieve those
goals. According to them, the key difference between their approach and addressing
the KPAs of CMM in parallel is that the problems and goals tell which pieces of each
KPA to address first. Regardless of the model or standard used, the problem-goal
approach tells how to scope and sequence improvement program. [23] They offer a
simple solution to overcome the difficulty of scoping an improvement program when
adopted wholesale.
2.5. Relation between CMMI® and GQM
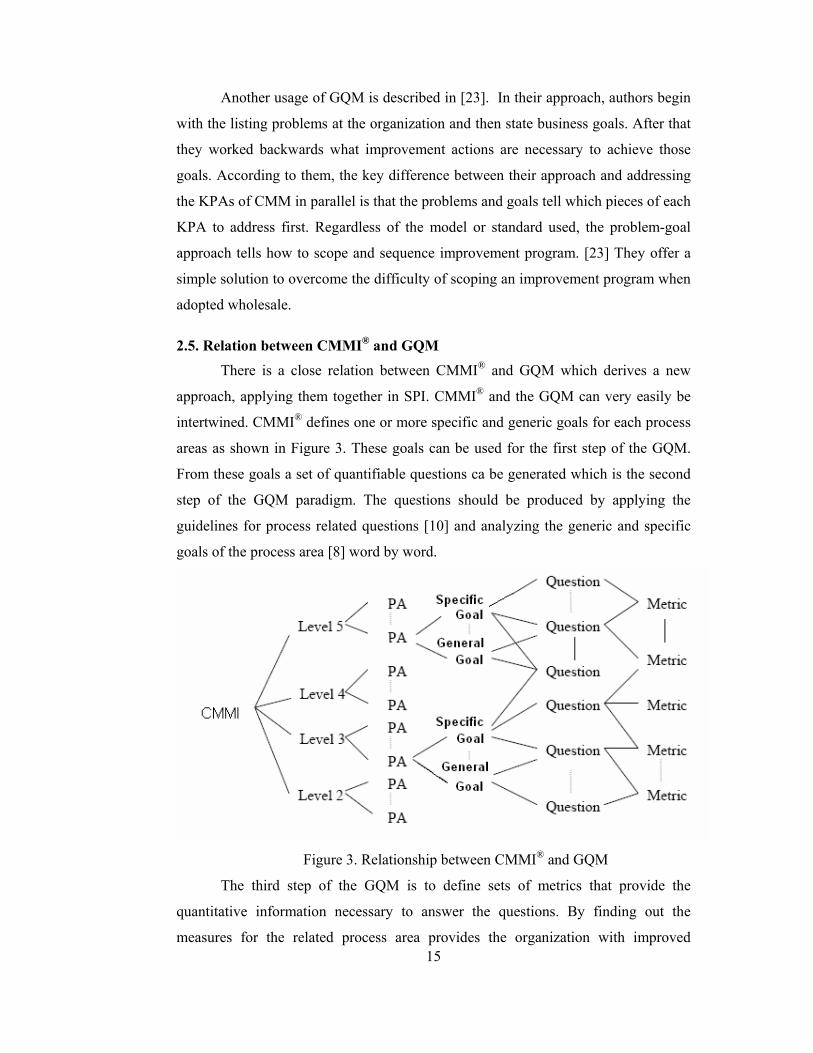
There is a close relation between CMMI® and GQM which derives a new
approach, applying them together in SPI. CMMI® and the GQM can very easily be
intertwined. CMMI® defines one or more specific and generic goals for each process
areas as shown in Figure 3. These goals can be used for the first step of the GQM.
From these goals a set of quantifiable questions ca be generated which is the second
step of the GQM paradigm. The questions should be produced by applying the
guidelines for process related questions [10] and analyzing the generic and specific
goals of the process area [8] word by word.
Figure 3. Relationship between CMMI® and GQM
The third step of the GQM is to define sets of metrics that provide the
quantitative information necessary to answer the questions. By finding out the
measures for the related process area provides the organization with improved

16
visibility and better insight into the process area activities, improving the software
process a small step towards the goal of being a mature organization. With this work
the assessment and measurement based methodologies mentioned above will be
joined.
2.6. Requirements Management Metrics
Since there has been a close relation between CMMI® and GQM, metrics
associated with goals of PAs of CMMI® can be obtained. Requirements Management
PA is chosen since the requirements change management process is focused as the
subject of this thesis. It is important to control the continuing definition of
requirements as they change throughout the software life cycle. Such control over the
requirements helps in anticipating and responding to requests of change [25]. “The
purpose of Requirements Management is to establish a common understanding
between the customer and the software project of the customer's requirements that
will be addressed by the software project.” As defined in [8]. The activity of
"Requirements Management" is focused on the control of the requirements gathering,
establishing an agreement between the customer and the software team on the
requirements, checking, reviewing and managing the changes on requirements. This
activity is the process of ensuring that a software product, produced from a set of
requirements, will meet those requirements. As shown in previous chapter, goals of
CMMI® can be used as the first step of GQM. Requirements Management PA has
one specific goal which states the following:
“Requirements are managed and inconsistencies with project plans and work
products are identified.”[26]
It focuses on the control of requirements to set up a baseline. If the
requirements are not controlled, there will be no clear picture of the final product.
Also it focuses on the consistency between the requirements and any software
product created from those requirements.
The second step in the GQM paradigm is to generate a set of quantifiable
questions. By analyzing the goal, questions arisen can be: How can the requirements
be controlled? And why should we control them? Neither specifying everything
exactly what the customer wants in the beginning nor dictating the frequency or
desirability of changes is possible. The changes can come at the worst moment and
17
impede a project with the available resources. The only possibility is to control the
continuing definition of requirements as they change throughout the life cycle. [25]
Any information on requirements can help to establish control. Especially
important is to know the starting set and final set of requirements. To increase the
control of the requirements, their status as well as their stability could be investigated
(see questions 1 and 2 in Table 2). The possible status of a requirement could be:
new, analysed, approved, documented, rejected, incorporated into the baseline,
designed, implemented, tested, etc. Requirements stability is concerned with the
changes made in requirements, therefore a set of questions (see questions 3-8 in
Table 2) about requirements changes can be defined to refine the question 2. The
level of requirements stability can be measured also by having information about the
size of the requirements and by identifying problematic requirements (see questions
9-10 in Table 2). Once there is control over the requirements, a baseline must be
established. Therefore some questions about how the requirements are documented,
and how many of them are included in the baseline, are defined (see questions 12 and
17 in Table 2).
The purpose of the second part of the specific goal is mainly to keep
consistency between the requirements and the software project; therefore it is
suggested to keep traceability among the software documents. Traceability between
requirements and the software project facilitates the analysis of the effects of a
software change and reduces the effort to locate the causes of a product failure.
Tracking the requirements and changes made to requirements can help to maintain
traceability (questions 13-16 in Table 2) among the requirement documents.
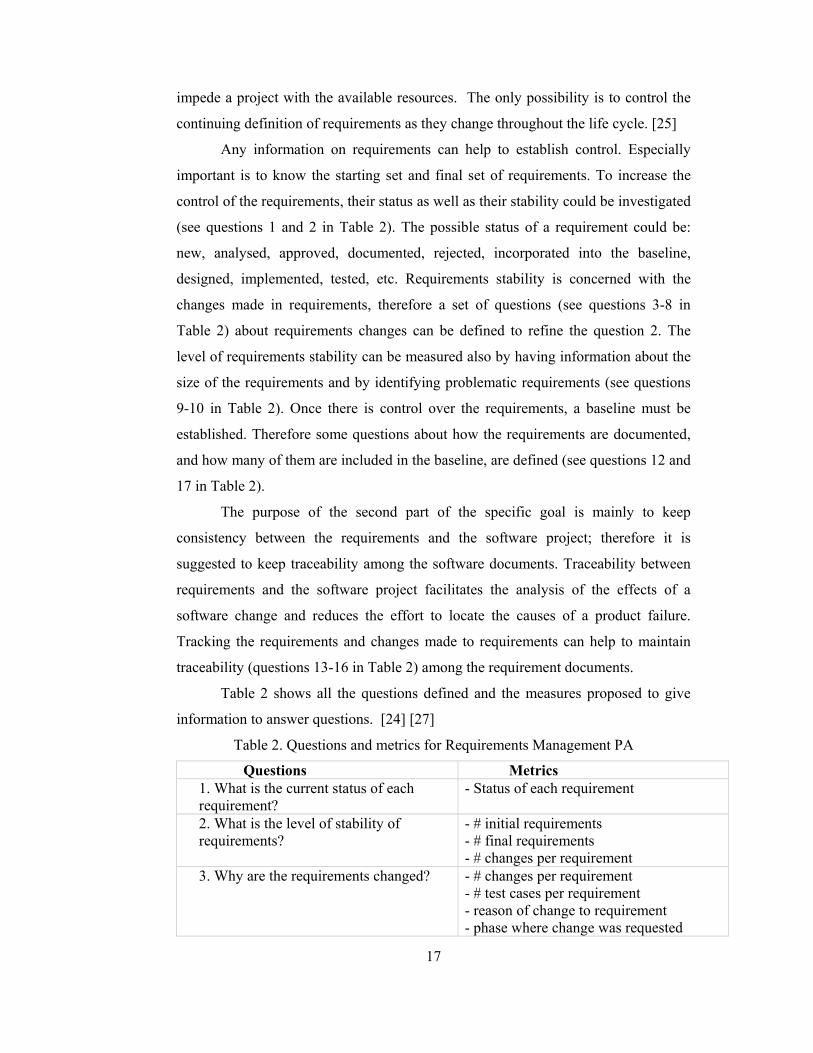
Table 2 shows all the questions defined and the measures proposed to give
information to answer questions. [24] [27]
Table 2. Questions and metrics for Requirements Management PA
Questions Metrics 1. What is the current status of each requirement?
- Status of each requirement
2. What is the level of stability of requirements?
- # initial requirements - # final requirements - # changes per requirement
3. Why are the requirements changed? - # changes per requirement - # test cases per requirement - reason of change to requirement - phase where change was requested

18
Table 2. Questions and metrics for Requirements Management PA (cont’d)
4. What is the cost of change to requirements?
- Cost of change to requirements - Size of a change to requirements
5. Is the number of changes to requirements manageable?
- Total # requirements - # changes to requirements proposed - # changes to requirements open - # changes to requirements approved - # changes to requirements incorporated into base line - # changes to requirements rejected - The computer software configuration item(s) (CSCI) affected by a change to requirements - Major source of request for a change to requirements - # requirements affected by a change
6. Does the number of changes to requirements decrease with time?
- # changes to requirements per unit of time
7. How many other requirements are affected by a requirement change?
- # requirements affected by a change
8. In what way are the other requirements affected by a requirement change?
- Type of change to requirements - Reason of change to requirements - Phase where change was requested
9. Is the size of the requirements manageable?
- Size of requirements
10. How many incomplete, inconsistent and missing allocated requirements are identified?
- # incomplete requirements - # inconsistent requirements - # missing requirements
11. Are the requirements scheduled for implementation into a particular release actually addressed as planned?
# requirements scheduled for each software build or release
12. How many requirements are included in the baseline?
- # baselined requirements
13. Does the software product satisfy the requirements?
- # initial requirements - # final requirements - # test cases per requirement - Type of change to requirements
14. What is the impact of the changes to requirements on the software project?
- Effort expended on Requirements Management activity - Time spent in upgrading
15. What is the status of the changes to software plans, work products, and activities?
- Status of software plans, work products, and activities
16. Are the requirements scheduled for implementation into a particular release actually addressed as planned?
- # requirements scheduled for each software build or release
17. How are the requirements defined and documented?
- Kind of documentation

19
The third step of the GQM is to define sets of metrics that provide the
quantitative information necessary to answer the questions. In this section, only a set
of measures is presented, which is shown in Table 2. The same measure can be used
to give information to answer different questions. Other possible measures are the
number of test cases assigned to each requirement, by which it is possible to check
how many requirements are verifiable; the size and the cost of a change request
which could make it possible to predict the project cost and the schedule. Collecting
the metric about status of each requirement, where status is one of the following, is
also suggested [27]:
proposed (suggested) ,
approved (it was allocated to a baseline) ,
implemented (code was designed, written, and tested) ,
verified (requirement passed its tests after integration into the
product) ,
deleted (is decided not to include after all) ,
rejected (idea was never approved)
2.7. Summary
In this chapter, software process improvement methods from top-down and
bottom-up approaches are investigated. Namely CMMI® and GQM are searched and
relation between these two methods is revealed. Using GQM, metrics for
Requirements Management PA for CMMI® are listed. Measurement based
requirements management is not a new concept, but it is not widely used. In
following chapters possibilities of implementation of measurement-based control and
improvement for requirements management area will be investigated in a multi-sided
project having high requirements volatility.

20
CHAPTER 3
THE CASE STUDY
In this study, measurement-based requirements change management will be
proposed for a project which is developed in a multi-sided setting and which has high
requirements volatility. In order to control the requirements change management
process, the current approach is investigated and an improvement is proposed.
Currently collected metrics and collection mechanism of requirements change
management metrics are provided in the subsequent sections of this chapter.
3.1. Research Method
In this study, the main technique applied for fact-finding was interviewing the
responsible staff. Personnel in charge of various software development activities
were interviewed, once or more, depending on the need. Aside from interviews,
observation of process activities, particularly as the author herself has been a member
of the software development team, and also investigation of pertinent documentation
were performed with the aim of uncovering the information outlined in this chapter.
3.2. Description of the Case Study
Project X is the subject of this case study. Project X is a very large military
related real-time project. It is developed in a multi-sided arrangement, one main
contractor and one sub-contractor, and it will be examined from the sub-contractor
point of view. Main contractor has SW-CMM Level 5 and sub-contractor has SW-
CMM Level 3.There exists a core product that should be implemented mostly by the
main contractor and modifications and/or additions will be done to the core product
by the sub-contractor.

21
Project X is being implemented in four iterations and iterations are defined as
Ti where “i” is between 1 and 4. Currently iteration T3 is being developed. Project X
consists of many large-sized projects. Actually, it has two main sub projects and
more than one component of average size under each sub project. Development
duration of the project is estimated as five years and size of the project is estimated
to be nearly 150 KLOC. There are nearly 280 engineers working at Project X. There
are at least 8 engineers in each subgroup. Organization schema of the project is
depicted in Figure 4.
Figure 4. Organization chart of Project X
3.3. Current Approach
Project X is a large project and has extremely many specifications, therefore
tool assistance is needed for requirements management process. At project X,
Telelogic DOORS [28] is used for keeping and retrieving requirements.
Figure 4 presents the detailed process flow for the current requirements
change management process.
Project X
Subproject 1 Subproject 2
Group1 Group2
Subgroup1 Subgroup2
Subgroup3 Subgroup4
Group 1
Group2
Group3

22
Figure 5. Current Activities for Requirements Change Management Process

23
Figure 5. Current Activities for Requirements Change Management Process (cont’d)
Both sub-contractor and main contractor can make changes on requirements.
The activities currently employed in the requirements change procedure applied by
the sub-contractor are given in Table 3.
Table 3. Activities in the original process
Activity
Name
Activity Definition People
Involved
1
Preparing
changes to
requirements
Project team examines requirements, interviews
with the customer as much as possible, inspects
related documents and standard and determines
necessary changes.
Project team
2
Asking
questions
about
requirements
If there is need, project team asks questions about
requirements to the main contractor for unresolved
problems. Questions are asked via “question
database” which is an Excel document send to
main contractor. Question database is kept and
maintained by metric team members.
Project team
Metric team

24
Table 3. Activities in the original process (cont’d)
3
Preparing
Was-Is-Why
document
Project team doesn’t wait for the answers of the
questions in order to save time. They prepare WIW
document with the decided changes.
Project team
4
Reviewing
Was-Is-Why
document
Project team and project leaders review WIW
document. In this review some modification may
be done to the requirements.
Project team
Project
leaders
5
Preparing
Software
Change
Request
form
An SCR form is written by one the project team
members using Rational Clearquest application.
Problem description and analysis is defined in the
SCR form. SCR form indicates the phase WIW
document is prepared for. WIW document is
attached in the SCR form.
Project team
member
6
Sending
Software
Change
Request form
SCR form is taken to implement state meaning that
it is ready for sending. Details of the SCR record
are sent to the main contractor via e-mail. Sent date
is the date when SCR form is taken to “implement”
state.
Configuration
manager
7
Design and
coding of
requirements
begin
After taken SCR form to implement state, project
team begin design and coding of the project
accepting new set of requirements. Requirements
are implemented at sub-contractor side as if all
changes are approved by main contractor.
Project team
8
Getting
answers of
questions
about
requirements
Main contractor sends answers of questions to the
sub contractor again via email through Question
Database document. If answer of the question is
insufficient for the team members, questions
remain open. If answer of the question is
satisfactory, state of question is “Closed”.
Project team
Metric team

25
Table 3. Activities in the original process (cont’d)
9
Change
needed in
requirements
Some of the answers to the questions may yield to
a new question and some answers yield to changes
to requirements meaning beginning WIW sub-
process again. Previously opened SCR form is
cancelled.
Project team
10
Change
needed in
design
According to the answers of the questions design
of the project may change which means re-work in
coding phase. Design may totally change and may
be done again.
Project team
11
Getting new
set of
requirements
New set of requirements are sent from main
contractor after inspecting all changes made by
sub-contractor. Main contractor may approve or
reject changes. They can even make new changes.
Configuration
manager
Main
contractor
12
Importing
new set of
requirements
Configuration manager imports new set of
requirements to the DOORS database. Since there
is not a relation between old set of requirements
and new set of requirements, project team inspects
new set of requirements
Configuration
manager
Project team
13
Closing SCR
form
Since new set of requirements is taken from main
contractor, configuration manager changes state of
the SCR form to “Closed”.
Configuration
manager
At the sub-contractor side, DOORS database is used for viewing the current
state of requirements. All requirements have some attributes which give information
about the current state of the requirements, but already existing attributes are not
enough for getting information about modified requirements. Attributes and
description of attributes are presented in Table 4.

26
Table 4. Attributes and descriptions for requirements
Attribute Name Attribute Description
Abs num Absolute number of the requirement
Change auth history Number of SCR form
Change authorization Not Used
Created by Name of the person created the requirement
Created on Date of creation time of requirement
Demo Not Used
Last modified by Name of the person modified the requirement
Last modified on Date of modification time of requirement
Link to SSS # Software Subsystem Specification
Object heading, text Headline and text of the requirement
Object number Paragraph number within whole SRS document
Paragraph number Indicates paragraph number and letter of requirement within a paragraph
Product line Indicates whether requirement is as part of core product or modification
Requirement Type Not Used
Requirement PUID Unique value indicating the requirement
SW Build Indicates at which phase requirement should be implemented
Supplier Indicates who is responsible from the requirement
Test Not Used
Verification method Indicates verification method for requirement
Verification type Indicates verification phase for requirement
Measurement is not considered as important for requirements change
management process in Project X. Data is not counted frequently and counted data
do not satisfy all the needs of the project according to project managers. Only the
following metrics about requirements are collected:
- # current requirements
- # requirements that should be completed at each phase
- # requirements that should be supplied by sub-contractor

27
- # requirements that should be supplied by main contractor
- # requirements that should be implemented at core product
- # requirements that should be implemented as modification to core product
Many metrics related with requirements change management process are
either not collected or collected indirectly within Project X. Requirement volatility
metrics, type of change on requirements and number of changes per a limited time is
not available for Project X. These data can be obtained from WIW document, but
this requires extra work for each sub-project. Data about change requests is
inadequate. It is accepted by project leaders that the status of change requests for
each requirement can not be tracked after sending request to the main contractor. As
a result, there exists discrepancy between the main contractor and the sub-contractor
from a requirements point of view.
Another problem is that there is not much correlation between test cases and
requirements. Test cases are prepared in Word documents and requirement number is
specified in each test case. How many requirements will be tested at which phase is
also counted indirectly. Effort is needed for deriving number of requirements related
with each test case. Counting number of verified requirements after tests are
conducted is still difficult. Because after running tests on the working software, at
software test team an Excel document is prepared for each sub-component. How
many tests are failed and how many of them are passed in total can not be
determined at a glance, either.
3.4. Current Collection Method for Requirements Management Metrics
Since a tool is used for keeping and retrieving requirements, metrics related
with requirements change management process are mostly taken from the tool.
Metrics related with requirements volatility are taken from Excel sheets prepared for
each sub project. So it is very difficult to see the whole picture at any time.
Metrics explained in previous chapter are taken from DOORS database by
preparing queries for each metric. After running the query, DOORS lists the
requirements that match the criteria. However, number of requirements matching
with criteria can not be calculated from this list. One should count requirements one
by one or should export the data to an Excel sheet to count the numbers. Another

28
problem is query should be written every time metrics are taken. Metric data and
time of the metrics taken should be stored externally.
Tracking changes in requirements is an important issue in requirements
management. This is rarely performed by taking metric from WIW documents.
These indirectly taken metrics about requirements is also troublesome for Project X.
All WIW documents for all sub-projects are collected. According to the format of
this document, more than one attribute of a requirement can be changed at the same
time and type of change is marked as “Mod” for modification. So there is no method
to count requirements that are postponed to the next phase. Type of change is
indicated as: “New” for addition, “Mod” for modification and “Del” for deletion.
Since separate documents are prepared for every sub-project, total number of added,
modified and deleted documents can not be known at a glance.
Because so much of requirements management is change management, it is
advised to track the status of change requests. [27] In the system currently used in
Project X, a new SCR form is sent to the main contractor for every component under
the sub-projects. A mechanism for tracking SCR exists, but change in every
requirement can not be tracked. Requirement changes are examined in small sets, not
one by one. Furthermore, after examination, a new set of requirement are sent back.
Again there is no way to understand which change requests are accepted and which
of them are rejected. How many of them are open and how many closed? How many
requests were approved and how many rejected? How much effort is spent for
implementing each approved change? How long have the requests been open? These
questions can not be answered effectively in Project X.
It is widely accepted that change requests that remain unresolved for a long
time shows that change management process is not working effectively. [27] It is
also advised to convert some open requests to “deferred,” and convert long-term
deferred requests to “rejected,” in order to focus on most important and most urgent
items in the change backlog. But in Project X, there is no way to identify this issue
with real data.
Again how many changes are incorporated throughout development after the
requirements are baselined can not be known without tracing both DOORS database
and all WIW documents. Number of requirements changes for a period of time is

29
also calculated from WIW documents. For each phase, number of changes is counted
and then these numbers are compared. Display of data is done manually. Projects
should become more resistant to making changes as development progresses, so this
trend should approach zero as release date approaches. However it is not known
whether changes are increasing or decreasing.
As it can be seen, the main problem is change request about requirements and
requirements themselves are stored in different sources and this causes major
difficulties in tracking requirements changes.

30
CHAPTER 4
IMPROVEMENT PROPOSAL FOR REQUIREMENTS CHANGE MANAGEMENT
After investigating current approach on the requirements change management
process and collected requirements change management metrics, it is decided to
automate metric collection operation. Requirements change management process is
also modified to speed up the process and gather more metrics easily and fast.
Metrics that are to be collected automatically and details of improvement proposal
are explained in following sections.
4.1. Metrics To Be Collected Automatically
Collecting essential requirements change management metrics needs effort in
Project X. Approximately four man-hours is needed for combining metrics coming
from different sources. A tool support for collecting metrics is necessary. After
meetings with project leaders, implementation of a tool is proposed. Inputs of the
tool can come from two distinct sources. Some of the metrics can be easily derived
from the requirements database and some of them can be derived from the WIW
documents prepared at each phase.
In those meetings, which metrics should be collected according to project
needs is investigated. Organization’s goals are examined and compared with the
goals of Requirements Management PA of CMMI. It is realized that they intersect
with each other. Therefore, the metrics explained in the previous section were
selected to be collected. Besides them, the following metrics were selected to be
collected:
1. # requirements before and after iteration Ti
2. # test cases per requirement

31
3. # type of change for each sub component
4. # type of change for whole project
5. # requirements whose implementation iteration changed
6. # requirements whose supplier changed
7. # added requirements at iteration Ti
8. # modified requirements at iteration Ti
9. # deleted requirements at iteration Ti
10. # changes open
11. # changes approved
12. # changes incorporated into the baseline
13. # changes rejected
In addition to the metrics above, metrics that can be taken from requirements
database are decided to be displayed on the tool in order to help decisions about
requirements change management.
First metric can be derived from both examining DOORS database and
prepared WIW documents. Assuming all change requests will be accepted by main
contractor, number of requirements before and after each phase can be calculated.
Since requirement change procedure is usually done at the beginning of each phase,
this metric also shows the number of change per a limited time.
Test cases are also stored at DOORS database, but in current system number
of test cases per requirement is not counted. By collecting this metric, any
requirement which is not assigned a test case and therefore will not be tested can be
captured easily.
Metrics numbered 3 and 4 can be collected after investigating all WIW
documents prepared by each sub component. Metrics numbered 7, 8 and 9 can be
derived from WIW documents prepared at each phase. Again metrics numbered 5
and 6 can be derived from examining modified requirements. Since it is time
consuming to collect these metrics in the current system, tool support will simplify
the operation.

32
Metrics numbered 10, 11, 12 and 13 can be derived from WIW documents
and DOORS database again. Since one SCR form is submitted for a bundle of
requirement change requests as explained in previous section, project team can only
keep track of SCR form. These metrics can only be calculated after importing new
set of requirements sent by main contractor.
Some of the recommended metrics displayed in Table 2 are decided not to be
collected. Those metrics are not collected in the current system, either. The following
metrics will not be collected:
1.Cost of change to requirements
2.Size of change to requirements
3.Number of changes proposed
4.Number of components affected by change
Size of change to requirements can only be calculated after design phase of
the sub-components. One function can correspond to one requirement or one
function can handle more than one requirement. Since this value can not be correctly
calculated, it is decided not to count size of change to requirements.
Cost of change to requirements can only be calculated in terms of man-hours.
This value is predicted at the beginning of each phase when project plan is prepared,
but predicted value sometimes differs from the real value. So, value may not be
correct in current system either.
Metric numbered 3 is decided not to be collected, since number of changes
proposed is equal to number of changes open in the current system. Number of
components affected by change will not be collected, because of the fact that every
sub-component can only change requirements that are related to it.
Tool support is needed in the current process because there are different
sources for requirements related metrics. A tool which takes all these sources as
input and will report needed metrics as output will be useful in decision support and
risk assessment. Another option may be altering the current requirements change
management process.

33
4.2. Proposed Model for Requirement Change Procedure
In the current procedure, a WAS-IS-WHY document is prepared for
requirement changes and storing requirements and storing change requests are
separated from each other. This is the main source of the problem. In the proposed
model, change requests are also performed through the same interface, in case of
Project X through DOORS database.
As mentioned before, there are attributes of requirement. New attributes can
also be added and existing attributes can be modified. History of a requirement can
also be kept in DOORS database. In the current system, when a requirement is
modified more than one time, it is very hard to find the original version of the
requirement. But when change requests are kept in DOORS database, it will be easy
to remember why the change was requested and when it was requested. Keeping
history of requirements and change requests at DOORS database is proposed as an
improvement to current procedure.
In the current system another problem is to prepare WIW document which
has a format specified by main contractor. Although all change request are decided, it
takes 8 man-hour to prepare the WIW document because of its complicated format.
By altering the procedure, WIW document is removed and it saves 8 man-hours.
Another problem of the current system is not to keep track of change request
per requirement. A field is added to keep track of change request in the proposed
model. Values of the field are:
1. Open: Indicates that change request is being investigated.
2. Approved: Indicates that change request is being approved.
3. Rejected: Indicates that change request is being rejected.
Time of requirement changes is kept as it is in the proposed model, because
these time intervals are planned as requirement analysis phase at the beginning of
project. It means that at the beginning of each phase requirements will be analyzed,
and change requests will directly be inserted into DOORS database indicating type of
change and with the status of open. After than change request about requirement will
be sent to main contractor. Main contractor will investigate the change request and
approve or reject them. Status of change request will change and date of approval or
reject will be stored in the database. This date will be used to understand how long a
change request remains open. Finally main contractor will sent back the modified

34
requirement to the sub contractor. In proposed model, both the history and change
requests of requirements can be monitored.
Another improvement to the current process is to send the change request to
the main contractor per requirement basis. In this case, change requests will not
remain open too long and risk of implementing a change which is rejected by main
contractor can be handled. In the current system, an added requirement may be
implemented by the sub-contractor assuming that it will be approved by main
contractor. When main contractor rejects changes, sub-contractor will waste many
man-hours according to its project plan. But in the proposed plan, since response to a
change request to a requirement is taken immediately, time will not be wasted.
Major problems in the current system are aimed to be solved by the proposed
system. Aims of the proposed system are:
1. To keep track of change requests per requirement
2. To keep history of requirements
3. To shorten the response time to change requests
4. To get rid of preparing WIW document
All four of the aims are expected to be realized with the proposed system.
Using this system, project leaders will be able to both save man-hours and handle
risks earlier. They can also accomplish effective requirements management by
getting metrics from one source and at the earlier phases of the project.
The activities in the proposed requirements change procedure for the sub-
contractor are given in the following table and modified process model is shown in
Figure 5. Activities that are different from the original process are shown in bold.
Descriptions of the activities are presented in Table 5.
Table 5. Activities in the proposed process
Activity Name Activity Definition People
Involved
1
Asking
questions about
requirements
If there is need, project team asks questions about
requirements to the main contractor for
unresolved problems. Questions are asked via
“question database” which is an Excel document
send to main contractor.
Project team
Metric team

35
Table 5. Activities in the proposed process (cont’d)
2
Inserting req.
change into
DOORS
database
In the proposed process change is directly entered
DOORS database to keep all changes per
requirement.
Project team
members
3
Creating change
request record
System automatically creates a new change
request record for the requirement with the date
change request is issued. State of the change
request is “Open”.
4
Creating
Software
Change Request
form
An SCR form is automatically created by the
system. Problem description and analysis is
defined in the SCR form. SCR form indicates the
phase change is done for. Details of the
modifications to the requirement are attached in
the SCR form.
5
Sending
Software
Change Request
form
SCR form is taken to implement state meaning
that it is ready for sending. Details of the SCR
record are sent to the main contractor via e-mail.
Sent date is the date when SCR form is taken to
“implement” state.
Configuration
manager
6
Design and
coding of
requirements
begin
After taken SCR form to implement state, project
team begin design and coding of the project
accepting new set of requirements. Requirements
are implemented at sub-contractor side as if all
changes are approved by main contractor.
Project team
7
Getting answers
of questions
about
requirements
Main contractor sends answers of questions to the
sub contractor again via email through Question
Database document. If answer of the question is
insufficient for the team members, questions
remain open. If answer of the question is
satisfactory, state of question is “Closed”.
Project team
Metric team

36
Table 5. Activities in the proposed process (cont’d)
8
Change needed
in requirements
Some of the answers to the questions may yield to
a new question and some answers yield to
changes to requirements meaning beginning
WIW sub-process again. Previously opened SCR
form is cancelled.
Project team
9
Change needed
in design
According to the answers of the questions design
of the project may change which means re-work
in coding phase. Design may totally change and
may be done again.
Project team
10
Getting updated
version of the
requirements
Updated version of the requirements is sent from
main contractor after inspecting the changes
issued by sub-contractor. Main contractor may
approve or reject change. They can even make a
new change.
Configuration
manager
Main
contractor
11
Updating
requirement in
DOORS
database
Configuration manager imports updated version
of requirement to the DOORS database. Old
version of the requirement is also kept. Project
team can see all changes that is made to a
requirement from the beginning of the project.
Configuration
manager
12
Updating state
of change
request
After inspecting both old and new requirement,
state of change request is changed by the project
team member as “Approved” or “Rejected”
indicating the date.
Project team
member
13
Closing SCR
form
Since new set of requirements is taken from main
contractor, configuration manager changes state
of the SCR form to “Closed”.
Configuration
manager

37
Figure 6. Modified Activities for Requirements Change Management Process

38
Figure 6. Modified Activities for Requirements Change Management Process
(cont’d)
4.3. Comparison of the Current Method and Proposed Method
As mentioned in previous section proposed method aims to solve the major
problems of the current method. When two methods are compared, differences can
be seen clearly.
In the current process, all requirements about a subcomponent are
investigated as a whole. A WIW document is prepared for the whole set of
requirements and sent to main contractor as an attachment of a software change
request (SCR). In the proposed method, requirements are investigated one by one
and a SCR is prepared for every requirement change which makes keeping track of
change requests per requirement easy.

39
All change requests are in “open” state until a response comes back from the
main contractor, and after the response it is hard to understand which requests are
approved and which are not. In the proposed method, there is a strong relationship
between change requests and the requirements. It is easy to understand whether a
change request about a requirement is approved or not. If a requirement is changed
more than once, history of both the requirement and the change requests can be kept.
Status of change request per requirement basis can also be kept in the
proposed method which is impossible in the current process. In the current process,
since there exists one SCR form for the whole set of requirements SCR form remains
“open” as long as a response comes back for the whole requirements. It can take a
long time to investigate all the change requests, so sending different SCR forms for
every requirement also speeds up the process.
Another improvement is also to remove preparation of WIW document which
is a time consuming process. In the proposed method, changes to requirements are
made in DOORS database directly. With this method previous changes to the
requirements can also be seen. By removing preparation of WIW document, 8 man-
hours can be saved. If time to develop rejected change requests to the requirements is
also considered and historical data is used, total difference with the current approach
and proposed method is approximately 130 man-hours.

40
CHAPTER 5
METRIC COLLECTION TOOL
To simplify activities applied in requirements change management process, a
metric collection tool is developed during this study. With the help of this tool, all
metric related with requirements management can be seen at a glance. Metric
collection tool analyzes different sources and list the results in a tabular format.
Details of metric collection tool and its architecture are described in this chapter.
5.1. Purpose
In Project X, different resources are used for requirements management.
Telelogic DOORS [28] database is used for keeping requirements and WIW
documents are used for keeping change request about requirements. All subgroups in
the project prepare different WIW documents and it is hard to manage them. Since
there are many resources, collected metrics about requirements are deficient and
collecting them needs much effort. Therefore, to develop a metric collection tool that
will analyze resources, collect metrics from different resources and display final
results is decided. Metric Collection Tool (MCT) is designed and developed in the
scope of this study.
5.2. Scope
As mentioned in previous chapter, only the following metrics are decided to
be collected in Project X:
1. # requirements before and after phase Ti
2. # test cases per requirement
3. # type of change for each sub component
4. # type of change for whole project

41
5. # requirements whose implementation phase changed
6. # requirements whose supplier changed
7. # added requirements at phase X
8. # modified requirements at phase X
9. # deleted requirements at phase X
10. # changes open
11. # changes approved
12. # changes incorporated into the baseline
13. # changes rejected
Mainly WIW documents prepared by each subgroup will be used as source
for metric collection tool. In WIW documents, both original requirement and
requirement after change can be found. Actually, “WAS” part of WIW document is
just a copy of the DOORS database. Comparing changed requirements with the
original one kept in DOORS database is not needed. All metrics between 1 and 9,
except for 2, can be derived from WIW documents and only WIW documents will be
analyzed for those metrics.
After meetings about metric collection tool, metrics between 10 and 13 were
decided not to be collected with metric collection tool. History of WIW preparation
activity is investigated and it is seen that all change requests are approved by main
contractor. It is also understood that number of change request open is equal to
number of changes made by sub-contractor until next release of requirements set. In
the next release all change requests are usually approved and incorporated into the
baseline by the main contractor and none of them are rejected. Therefore, project
managers decided not to collect metrics related with the lifetime of change requests.
5.3. System Architecture
MCT is developed with Java on Windows 2000 platform. As well as
providing platform independency, Java is object-oriented which speeds up
development process.
Inputs of metric collection tool are WIW documents and text coverage
document. As an output, it generates reports for collected metrics.

42
WIW documents prepared by subgroups are treated like any tables stored in a
database. In this way, values in Excel sheets became rows of the tables. Therefore,
analyzing documents is just running different queries for each metric.
A text document storing results of the queries is also created by the tool
internally. These results are stored in order to retrieve them when requested as a
report. For each phase a new text documents is created and if document already
exists it is overridden.
The same WIW document can also be processed more than once. If a
document is analyzed before, then results of analysis is overridden in the document,
if not analyzed then a new row is inserted in the document. Inputs and outputs of the
tool are shown in Figure 6.
Figure 7. Inputs and outputs of MCT
5.4. User Interfaces
Metric collection tool has 3 main functionalities:
a. To analyze WIW documents
b. To analyze test coverage document
c. To generate reports from analyzed data
Since there are 2 main groups and many subgroups in Project X, group and
subgroup names are asked to the user when supplying WIW document. Also phase of
the project should be selected by the user since there are many phases of the project
and phases play an important role at the project. After user selects appropriate WIW
document, MCT starts analyzing document. When analyzing the document, MCT
tries to find out the number of changed requirements and the type of change to the
requirement. MCT also looks for the details of the change. Results of analysis are
kept in a text document in order to generate a detailed report when requested. In the
text document, information about all subgroups is stored in order to generate a report

43
about the project in total. User can also select text coverage document and choose to
view results about test cases.
Another option of MCT is to generate reports about collected metrics. User
can select the report type. Report can be generated for whole project as well as each
sub group. Reports are prepared in PDF format and include graphical display of
metrics.
If user selects to generate a report about a sub group, a report including
number of requirements in each phase before and after WIW process, number of type
of changes at the selected phase for the sub group, number of requirements whose
implementation phase changed and number of requirements whose supplier changed
in the selected phase will be prepared. If user selects to generate a report about the
whole projects same results for the whole project will be prepared.
Screenshots of metric collection tool and reports generated by it are shown in
Appendix A.
5.5. Evaluation of the Metric Collection Tool
Metric collection tool is used and evaluated by one of the project leaders.
Evaluation is performed at the end of requirements analysis phase T3 of Project X.
Since requirements analysis phase was ended, requirements change management
process had been performed and each subgroup had prepared their own WIW
documents.
In the current process, after preparing WIW documents metrics are collected
by the project leader and sent to another team for the analysis of the metrics. This
team combines the last metrics with the previous ones and sends all metrics related
with requirements analysis phase to the main contractor.
Project leader declared that since metrics are calculated with the metric
collection tool, there is no need to calculate and send metrics to the team any more.
Members of the team can use the tool and collect all metrics. He also mentioned that
it would be better if there was an option to select the type of the output. He suggested
another option like preparing Excel documents as well as PDF documents. He thinks
that Excel format is a good solution for analyzing results in different ways.
For some of the sub projects, more than one WIW document is prepared in
one phase. Project leader requested the see not only the results of last prepared WIW

44
document, but also the metric results of all WIW documents. He stated that it is
important to keep the results of the all document since this also gives a history about
the activities in requirement change management process. A slight modification is
performed in order to fulfill this request.
As a result, metric collection tool simplifies and speeds up the current flow in
requirements change management process.

45
CHAPTER 6
SIMULATION-BASED EVALUATION OF THE PROPOSED IMPROVEMENTS
In this chapter, simulation based evaluation of the proposed improvement to
the requirements change management process at Project X will be discussed.
Specifications and details of simulation logic will be explained. Finally, results of
simulation will be depicted in the last section.
6.1. Why Simulation?
Although applying the proposed improvement in one of the sub projects of
Project X at the company would be the best way for evaluating its performance, this
method could not be used for evaluation due to some reasons. During this study, it
was planned to apply the proposed method for the later phases of the project.
However, after some discussions with the project manager, we gave up this decision.
Since company is only a sub-contractor in Project X, it would be hard to persuade
main-contractor for a process change. Therefore, we only have simulation alternative
for evaluation.
Despite the fact that applying the proposed method in real world is better than
simulation, simulation has some advantages, too. Simulation allows estimating
performance of an existing system under some projected set of conditions. More than
one condition can be tested with a simulation and be compared with each other in
order to see which best meets the organization’s needs. [24] In addition to that,
simulation of a proposed system has low cost and risk when compared to real world
applications.

46
6.2. Variables of Simulation
Since the requirements change management process at Project X is examined,
only this phase of the development process is simulated. Whether or not the proposed
improvement is really effective on the whole software development process is
examined under different conditions. To determine the dependent and independent
variables of the simulation tool, the current requirements change management
process is taken as a base, and items that affect current activity are listed first.
First of all, a project should exist. With the simulation tool, it is possible to
create one or more projects having different number of requirements (NoReq). The
average source lines of code that implement each requirement (LOCperReq) is also
given as an independent variable, currently known to be of the order of 350 LOC per
requirement. User can also define the average share of effort (AvCMEf), in person-
days per person-day devoted to requirements change management process at the
project. Number of requirements of the project, number of programmers working in
it and average source line of code are independent variables of the simulation. They
constitute the size of the project and they are among the inputs of the simulation tool.
Workload of the programmers working in the project can be changed with the
simulation tool as it happens in real world. In reality, workload of the programmers
may change from time to time. In simulation tool, workload will be controlled by
average share of effort of the programmers. Increase in workload of programmers
means decrease in average share of effort devoted to requirements change
management process and vice versa. Therefore workload will not be used as an
independent variable of the simulation tool. Average productivity value of a
programmer (AvProdValue) is an independent variable of the simulation tool.
Productivity of programmers affects both duration and occurrence time of events. If
the productivity of a programmer is high, s/he analyzes requirements, asks questions
about requirements quickly. Unit of this variable will be KLOC per person-day. In
the simulation, this value will be used as KLOC per person-day for implementation
phase and number of question per person-day for asking questions about
requirements after a transformation between these two units.
Another independent variable is the probability of changing a requirement.
(ProbCR). Changes to requirements can be defined and changed along with time.
Some requirements may be modified, some of them may be deleted and some new
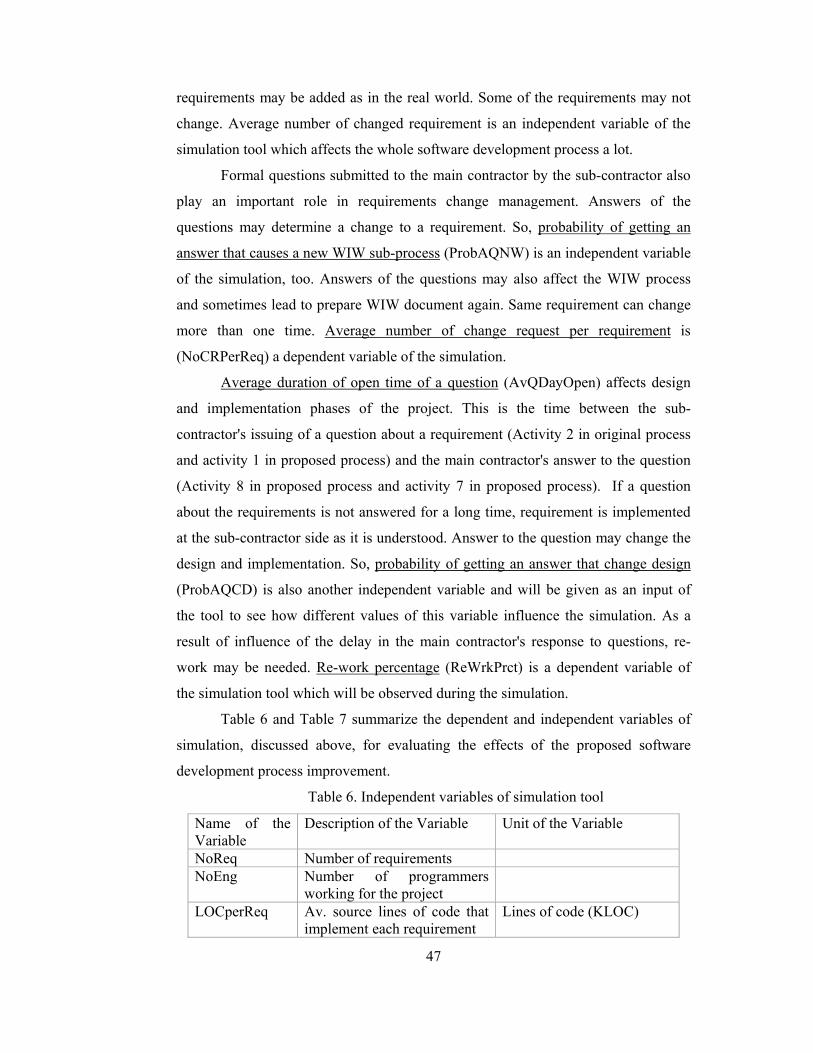
47
requirements may be added as in the real world. Some of the requirements may not
change. Average number of changed requirement is an independent variable of the
simulation tool which affects the whole software development process a lot.
Formal questions submitted to the main contractor by the sub-contractor also
play an important role in requirements change management. Answers of the
questions may determine a change to a requirement. So, probability of getting an
answer that causes a new WIW sub-process (ProbAQNW) is an independent variable
of the simulation, too. Answers of the questions may also affect the WIW process
and sometimes lead to prepare WIW document again. Same requirement can change
more than one time. Average number of change request per requirement is
(NoCRPerReq) a dependent variable of the simulation.
Average duration of open time of a question (AvQDayOpen) affects design
and implementation phases of the project. This is the time between the sub-
contractor's issuing of a question about a requirement (Activity 2 in original process
and activity 1 in proposed process) and the main contractor's answer to the question
(Activity 8 in proposed process and activity 7 in proposed process). If a question
about the requirements is not answered for a long time, requirement is implemented
at the sub-contractor side as it is understood. Answer to the question may change the
design and implementation. So, probability of getting an answer that change design
(ProbAQCD) is also another independent variable and will be given as an input of
the tool to see how different values of this variable influence the simulation. As a
result of influence of the delay in the main contractor's response to questions, re-
work may be needed. Re-work percentage (ReWrkPrct) is a dependent variable of
the simulation tool which will be observed during the simulation.
Table 6 and Table 7 summarize the dependent and independent variables of
simulation, discussed above, for evaluating the effects of the proposed software
development process improvement.
Table 6. Independent variables of simulation tool
Name of the Variable
Description of the Variable Unit of the Variable
NoReq Number of requirements NoEng Number of programmers
working for the project
LOCperReq Av. source lines of code that implement each requirement
Lines of code (KLOC)

48
Table 6. Independent variables of simulation tool (cont’d)
AvProdValue Average productivity value of a programmer
KLOC per person-day
AvCMEf Average share of effort devoted to requirements change management process
Person-days per person-day
AvQDayOpen Average duration of open time of a question
In days (Activity 7 – Activity 1 for proposed method)
AvCRDayOpen Average duration of open time of a change request
In days (Activity 12 – Activity 3 for proposed method)
AvQ Average number of questions asked about a requirement
0 <= AvQ
ProbCR Probability of changing a requirement
0 <= ProbCR <= 1
AvIntervalQ Average interval between asking two subsequent questions
In days
ProbAQCD Probability of getting an answer that change design
0 <= ProbAQCD <= 1
ProbAQNW Probability of getting an answer that causes a new WIW sub-process
0 <= ProbAQNW <= 1
Table 7. Dependent variables of simulation tool
Name of the Variable
Description of the Variable Unit of the Variable
ReWrkPrct Re-work percentage (Real size of project in KLOC at the end of the project/Expected size of project in KLOC ) * 100
NoCRPerReq Average number of change requests per requirement
Duration Duration of project In days (End of project – Beginning of project)
6.3. Simulation Logic
While implementing the simulation, how dependent and independent
variables are interrelated is examined. All variables are used either as an input or
output during the simulation process. Not only the interrelationships described in the
preceding chapter, but also how the requirements change management process flow
influences those variables have to be implemented in the simulation.

49
With the simulation tool, user may create several projects having a suitable
number of requirements, size of project in KLOC and programmers working for it
with this tool. User can modify and delete existing projects, as well. After creating
projects and supplying additional parameters, user can simulate the current and
proposed processes as if they are implemented at the company. Additional
parameters are the number of changes to requirements and duration of open time of
questions asked to the main contractor.
Figure 8. Flowchart of the simulation tool
After running the simulation, simulation tool generates some XML files
storing details of projects, number of programmers and results of the simulation of
current and proposed methods. Results include duration of the project, number of
changed requirements, average number of days that questions stay open, total
number of questions asked and number of total changes to requirements for current
and proposed methods. Size of re-work needed is included in current method and

50
number of issued change requests and average number of days that change requests
stay open are included in proposed method. By comparing the results of both
methods, user will be able to observe how proposed method speeds up the
requirement change management process and how it reduces the size of re-work.
Flowchart of the simulation tool is depicted in Figure 8.
6.4. Details of Simulation
Two methods can be used when simulating dynamic stochastic simulation
models. The structure of a simulation program may be either time-driven or event-
driven. In time-driven models, each time through the basic loop, simulated time is
advanced by some ‘‘small’’ fixed amount, and then each possible event type is
checked to see which, if any, events have occurred at that point in simulated time. In
event-driven models, events of various types are scheduled at future points in
simulated time. The basic program loop determines when the next scheduled event
should occur, as the minimum of the scheduled times of each possible event.
Simulated time is then advanced to exactly that event time, and the corresponding
event handling routine is executed to reflect the change of state that occurs as a result
of that event.
The choice of whether a time-driven or event-driven program structure should
be used depends on the nature of the model. If intervals between events are longer
than the fixed amount used in time-driven approach, time-driven approach will be a
wrong choice, since most of time simulator will be doing nothing useful, merely
advancing the clock. Comparison between two methods shows that event-driven
model appears to be more efficient in terms of run time and precision. Therefore
event-driven method is adopted in this work.
Events determined in our case are as follows:
1. Start analyzing a requirement (START_REQ)
2. Finish analyzing a requirement (FINISH_REQ)
3. Change the requirement (CHANGE_REQ)
4. Asking a question about a requirement (ASK_QUESTION)
5. Getting answer of the question asked (GET_ANSWER)
6. Opening a change request (OPEN_CR)
7. Closing change request (CLOSE_CR)
8. Start implementing the requirement (START_IMPL_REQ)

51
9. Finish implementing the requirement (FINISH_IMPL_REQ)
Events are usually ordered in time in event-driven approach, in other words,
which event comes after which event is known. In our case, this situation is not
completely true. GET_ANSWER event should always happen after
ASK_QUESTION event and CLOSE_CR event should always happen after
OPEN_CR event. But ASK_QUESTION and OPEN_CR events may or may not
happen. In simulation, probability of events is also calculated and events are
generated with probability values known at initialization.
Details of the events are as follows:
START_REQ: This is the time when programmers begin analyzing a requirement.
This is the first event to be scheduled to start a simulation run. Subsequent
START_REQ events are scheduled according to an exponential distribution with
mean inter-arrival time of two hours according to the observations in the company.
After analyzing a requirement, a programmer may ask one or more questions about
the requirement, which schedules ASK_QUESTION event according to “AvQ” as
described above in section 6.2. Number of questions asked is determined according
to an exponential distribution with average value of “AvQ”. If determined value is
greater than one subsequent ASK_QUESTION events are scheduled according to an
exponential distribution with mean inter-arrival time of “AvIntervalQ”. Another
option may be that the programmer directly decides changing requirement
scheduling CHANGE_REQ event, with probability “ProbCR” as described in
previous section. Or s/he directly schedules FINISH_REQ event with probability (1
– (ProbCR)) if no question is asked about the requirement. The three events,
ASK_QUESTION, CHANGE_REQ and FINISH_REQ are all scheduled with delays
whose mean values vary in inverse proportion with the average programmer
productivity, “AvProdValue” and in directly proportion with average share of effort,
“AvCMEf”.
FINISH_REQ: After finishing analyzing requirement, programmer directly starts
implementing the requirement which schedules START_IMPL_REQ event.
CHANGE_REQ: This is the event when programmer changes requirement. In
proposed model this event is same as OPEN_CR event and not used, but in the

52
original model OPEN_CR event is scheduled after all requirements are analyzed and
if there are any changed requirements. This event also schedules a FINISH_REQ
event, with a delay whose mean value vary in inverse proportion with the average
programmer productivity and direct proportion with average share of effort.
ASK_QUESTION: This is the event when programmer asks question about a
requirement. This event schedules a GET_ANSWER event at a time with
exponential distribution and utilizing “AvQDayOpen” mentioned in previous section.
GET_ANSWER: This is the event when programmer gets answer to a previously
asked question. Answer of the question may affect design phase or trigger a change
in the requirement with probabilities “ProbAQCD” and “ProbAQNW” respectively.
In addition to these, an answer may lead to both of the events. Requirements that
didn’t change previously may change after getting answer to a question, too. If
answer affects design and requirement is being implemented, FINISH_IMPL_REQ
event associated with the requirement is re-scheduled according to an exponential
distribution with average “AvCMEf” and to be adjusted in proportion with average
programmer productivity “AvProdValue”. Number of days between the beginning of
START_IMPL_REQ and GET_ANSWER event are also considered. If answer
triggers a change in the requirement, CHANGE_REQ event is scheduled. If
“ProbAQCD” is higher than 0.75, feedback effect of the requirement is also taken
into account. This means a change in the design can also lead to new requirements.
In the simulation, this is reflected when scheduling FINISH_IMPL_REQ event.
OPEN_CR: This event is only useful in proposed model to keep track of how long a
change request stays open. It is scheduled when all of the requirements are analyzed
in current method and when a requirement is changed in proposed method. It
schedules CLOSE_CR event at time with an exponential distribution with an average
of “AvCRDaysOpen” days.
CLOSE_CR: When this event happens, duration between OPEN_CR and
CLOSE_CR events are calculated for statistics in proposed method.

53
START_IMPL_REQ: When programmers begin designing and implementing a
requirement, this event happens. This event schedules a FINISH_IMPL_REQ event
with a delay of determined according to an exponential distribution with average
“AvCMEf” days, to be adjusted in proportion with average programmer productivity
“AvProdValue” and also in proportion to the requirement size, LocPerREQ. If a
requirement is being implemented and an answer about design is received, this event
is removed from queue.
FINISH_IMPL_REQ: This is the last event about a requirement. In this event,
statistics about the requirement like total number of changes, total number of days of
implementation are collected. As mentioned previously, this event may be re-
scheduled, thereby increasing the time needed for completing an implementation,
when GET_ANSWER event is occurred with an answer which changes design.
Figure 9 presents the flow diagram of these events. Independent values used
when scheduling events are also presented in Figure 9.
ASK_QUESTION
GET_ANSWER
CHANGE_REQ
FINISH_REQ
OPEN_CR CLOSE_CR
START_IMPL_REQ
START_REQ
FINISH_IMPL_REQ
AvQAvProdValue
AvCMEfProbCR
(1-ProbCR)AvQDayOpen
After 2 hours
ProbAQNW
LOCPerReqAvCMEf
Directly schedules
AvCRDaysOpen
AvCMEfAvProdValue
Only in proposed method
Only in current method
Figure 9. Flow diagram of the events of the simulation
Object-oriented methodology is used in developing the simulation. After
deciding on the events, objects which are the entities of the simulation are

54
determined. There are three main entities in the simulation. They are “Requirement”,
“Question” and “ChangeRequest” as shown in Figure 10.
EventeventKind : EventKindeventTim ereqID
Event()
EventKindSTART_REQFINISH_REQASK_QUESTIONGET_ANSWEROPEN_CRCLOSE_CRCHANGE_REQSTART_IMPL_REQFINISH_IMPL_REQ
QuestionisDes ignCriticisWIWCriticquestionNo
getDesignCritic()getWIWCritic()setQuestionNo()getQuestionNo()Question()
Requirementquestions[] : QuestionchangeRequests [] : ChangeRequests tate : intANALYSIS : int = 1IMPLEMENT : int = 2s tartOfIm plTimefinishOfImplTimeklocWritten
getQuestions()getChangeRequests()getState()setState()addQuestion()getImplDuration()getKLOCWritten()setKLOCWritten()
ChangeRequestopenTimecloseTime
setOpenTime()setCloseTime()getDurationOfOpen()
Figure 10. Class diagram of entities used in simulation
In “ChangeRequest” entity, “openTime” and “closeTime” of change requests
are kept to get statistics about how long average open duration of a change request. A
requirement may be changed zero or more times during a period, depending on the
value of “ProbCR”. For each requirement if value determined with exponential
distribution using “ProbCR” is greater than “ProbCR”, a change request for that
requirement is scheduled, otherwise requirement is not changed.
In “Question” entity, “openTime” and “closeTime” of the question are also
kept. Therefore “Question” is derived from “ChangeRequest” entity. It also has same
members and functions. “questionNo” attribute is kept to get a relationship between
answer and the question. GET_ANSWER event is scheduled with the number of the
question. “isOpen” attribute is set to false when GET_ANSWER event about that
question occurs. Besides them “isDesignCritic” and “isWIWCritic” attributes are
hold in “Question” entity to calculate total number of questions that changed design
and that start WIW process again. Zero or more questions may be asked about a
requirement.
“Requirement” entity is one of the main entities. It holds attributes that keeps
state of the requirement. If any question is asked about requirement, it can also be
reached from requirement entity. Change requests are also kept in order to see how
much a requirement changes during a period. KLOC implemented per requirement is

55
also kept in the “Requirement” entity. KLOC implemented is set when
FINISH_IMPL_REQ event is occurred by using duration of implementation time of
the requirement and “LOCperReq”. Since FINISH_IMPL_REQ is re-scheduled
according to the answers received, KLOC implemented but never used is also taken
into consideration.
Main entity is the “Event” class. It keeps time and kind of the event. It also
has requirement ID in order to understand which requirement is related with this
event.
6.5. Simulation Results and Discussion
Simulation program is evaluated with different values of the independent
variables defining projects under different conditions. After running the simulation a
number of times, results of dependent variables like re-work percentage and duration
of requirements change management process and duration of total project are
compared. Besides, metric that can be collected only in proposed method are
presented.
To be able to analyze the response of the simulation tool under various
conditions, effects of changes in the following independent variables are
investigated:
Probability of changing a requirement (ProbCR)
Average duration of open time of a question (AvQDayOpen)
Probability of getting an answer that changes design (ProbAQCD)
Average number of questions (AvQ)
Consequently response of the simulation tool to the changes in number of
changed requirements, number of questions, number of answers that change design
and duration of open time of a question can be seen. To increase the level of
confidence on dependent variables for each value of the variables listed above, the
simulation tool is run 10 times for each combination of the listed variables and the
results are averaged.
Three constant values are determined for each of the variable in order to use
in the simulation tool as shown in Table 11. These constant values are based on the
historical data and observations of the author herself. Instead of simulating all
possible combinations (34 = 81 cases), the effect of the change on two of the selected

56
variables is observed while keeping the other variables constant. Other combinations
of the selected independent variables could be investigated as a future work.
Table 8. Constant values determined for the selected independent variables
Name of the Variable Value #1 Value #2 Value #3
ProbCR 0 0.5 1 AvQDayOpen 15 30 60
ProbAQCD 0 0.5 1 AvQ 2 4 6
After gathering results, simulation tool is verified by comparing the results of
the simulation of current approach with the actual data. Since Project X is still being
developed, only size of re-work for one the sub-projects is known. Sub project is
developed by 6 programmers and has 196 requirements. Calculated rework of the sub
project in the real application is nearly 1200 LOC. This number indicates the
developed but modified or deleted source code after getting answers from the main
contractor. Simulation program is run with the independent variables having values
shown in Table 9.
Table 9. Values used in the simulation tool
Name of the Variable Value of the Variable NoReq 196 requirements NoEng 6 engineers LOCperReq 17 LOC AvProdValue 50 KLOC AvCMEf 0.3 person-days AvQDayOpen 15 days AvCRDayOpen 25 days AvQ 2 questions ProbCR 0.5 AvIntervalQ 2 days ProbAQCD 0.5 ProbAQNW 0.2
Value obtained by simulation is 1315 LOC for the project at that size. The
10% error is considered acceptable and hence it is safe to assume that the simulation
tool does closely simulate the requirements change management process applied at
Project X.

57
6.5.1. Response to Change in ProbCR and ProbAQCD
Effect of change in probability of change requests is different in current
approach and proposed method. More requirements change during the project, more
re-work is performed in the current approach. However, in the proposed approach re-
work percentage is less compared to current approach because of the fact that
duration of open time per requirement is shortened in the improvement proposal.
State of change requests can be realized earlier.
Keeping other values constant, change in probability of answers that change
design and implementation affects the current approach and proposed method in the
same manner. An increase in probability of answers that affect design means an
increase in re-work percentage. Because design and implementation should be
performed again according to the new answer. This in turn extends the duration of
the project both in current approach and the improvement proposal.
For the different values of average number of questions and average duration
of open interval of asked question, simulation results depicting the current approach
and the proposed improvement can be seen in Figure 11 and Figure 12.
6.5.2. Response to Change in AvQ and AvQDayOpen
Effect of change in number of questions asked about requirements is same in
both current approach and proposed method. If there is much information missing in
the sub-contractor side and duration of open time of question remains same, sub-
contractor begins implementation with deficient knowledge to save time. After
answers are delivered from main contractor, some of the requirements are re-
implemented. So, increase in number of questions increases re-work and duration of
the project in both methods. This result is consistent as improvement proposal only
modifies requirements change management process; it doesn’t affect asking
questions mechanism to the main contractor.
Inspection of simulation results indicates that a change in duration of open
time of questions asked to the main contractor directly affects the re-work percentage
and duration of the project. When communication between the main contractor and
the sub contractor decreases meaning an increase in average duration of open time of
questions, re-work percentage and duration of project increase in both current
approach and proposed method. Again, both methods are affected at the same ratio
since nothing is changed in the proposed method related with duration of open time

58
of questions. For the different values of the probability of a change request and
probability of an answer that changes design, response of the simulation tool to
current approach and proposed method can be seen in Figure 13 and Figure 14.
1.31.9
2.4
4.5
5.2
6.5
5.7
6.4
7.1
0
1
2
3
4
5
6
7
8
0 0.5 1 1.5
ProbCR
Rew
ork
Perc
enta
ge (%
)
ProbAQCD = 0
ProbAQCD = 0.5
ProbAQCD = 1
914
932
954949955
967
10121022
1065
900
920
940
960
980
1000
1020
1040
1060
1080
0 0.5 1 1.5
ProbCR
Dur
atio
n (d
ays)
ProbAQCD = 0
ProbAQCD = 0.5
ProbAQCD = 1
Figure 11. Response to change in ProbCR and ProbAQCD in current approach
NoReq = 500 AvQ = 4 AvQDayOpen = 15

59
1.1 1.31.6
4.75
5.75.65.9
6.5
0
1
2
3
4
5
6
7
0 0.5 1 1.5
ProbCR
Rew
ork
Perc
enta
ge (%
)
ProbAQCD = 0
ProbAQCD = 0.5
ProbAQCD = 1
909915
945938
947
960
9951006
1041
900
920
940
960
980
1000
1020
1040
1060
0 0.5 1 1.5
ProbCR
Dur
atio
n (d
ays)
ProbAQCD = 0
ProbAQCD = 0.5
ProbAQCD = 1
Figure 12. Response to change in ProbCR and ProbAQCD in proposed method
NoReq = 500 AvQ = 4 AvQDayOpen = 15

60
4.55.2
7.8
5.66.4
8.6
7.68.1
11
0
2
4
6
8
10
12
0 2 4 6 8
AvQ
Rew
ork
Perc
enta
ge (%
)
AvQDayOpen = 15
AvQDayOpen = 30
AvQDayOpen = 45
912
955
979
925
967
989
965
982
1011
900
920
940
960
980
1000
1020
0 2 4 6 8
AvQ
Dur
atio
n (d
ays)
AvQDayOpen = 15
AvQDayOpen = 30
AvQDayOpen = 45
Figure 13. Response to change in AvQ and AvQDayOpen in current approach
NoReq = 500 ProbCR = 0.5 ProbAQCD = 0.5

61
4.6 5
7.7
5.4
6.5
8.4
7.18
9.8
0
2
4
6
8
10
12
0 2 4 6 8
AvQ
Rew
ork
Perc
enta
ge (%
)
AvQDayOpen = 15
AvQDayOpen = 30
AvQDayOpen = 45
905
947
968
927
955
984
959
976
1005
900
920
940
960
980
1000
1020
0 2 4 6 8
AvQ
Dur
atio
n (d
ays)
AvQDayOpen = 15
AvQDayOpen = 30
AvQDayOpen = 45
Figure 14. Response to change in AvQ and AvQDayOpen in proposed method
NoReq = 500 ProbCR = 0.5 ProbAQCD = 0.5
62
CHAPTER 7
CONCLUSION
This chapter concludes the thesis by comparing what is aimed at the
beginning of the study and what has been achieved. What has been done in this study
is summarized in the first section. Limitations of the study and the future directions
of work related to the studies on the measurement based software process
improvement are pointed out in the following section.
In this thesis, three major tasks are accomplished. First, measurement based
software process improvement literature is examined; relation between measurement
and process improvement is inspected and requirements management metrics are
examined. Secondly, requirements change management process of a software
development project carried out at a company is examined with software process
improvement being the primary concern; problematic issues are determined;
currently collected metrics are evaluated and then a new measurement system is
proposed according to the findings in the preceding chapters. Finally, a program is
developed to simulate both the current approach and improvement proposal in order
to evaluate the proposed approach which utilizes measurement when improving the
process.
7.1. Summary
Measurement based software process improvement; especially improvement
of requirements change management process is examined. Top-down and
measurement based approaches for SPI are investigated and relationship between
CMMI® and GQM is investigated. Requirements management metrics are
determined using GQM techniques and goals of Requirements Management PA of
CMMI®.

63
After determining metrics for requirements management process, a case study
is performed. A very large multi-sided project is examined and the study is limited
with only requirements change management process. Measurement based SPI is used
for solving problems encountered at the requirements change management process at
the software development project.
First of all, current approach on the requirements change management process
is investigated. Already collected metrics are determined and their collection
mechanism is examined in detail. Throughout the study it is realized that
requirements change management metrics are formed after aggregating data
collected from more than one source.
Main problem in the current approach is requirements and changes on
requirements are stored in different places and in different formats. This leads to a
difficulty when collecting metrics about requirements change management.
Therefore to simplify activities applied in requirements change management process,
a tool is developed for automating some of the metric collection operations.
Developed tool gathers data from the sources and after that it combines and presents
the results in a user friendly format. Metric collection tool ensures the project
management team to control the requirements change management process and
provides the results whenever needed at a glance.
Afterwards, an improvement proposal is developed for the requirements
change management process of the chosen project. After investigating current
approach and collected requirements change management metrics, it is decided to
change and automate some parts of the requirements change management process.
Problems encountered in the current approach are determined and following goals
are aimed:
1. To keep track of change requests per requirement
2. To keep history of requirements
3. To shorten the response time to change requests
4. To get rid of preparing WIW document
Main change in the proposed approach is combining requirements and
changes on the requirements on the same source. It is proposed that the tool currently
used (DOORS) for keeping requirements should also be used for keeping changes
about requirements. With slight modifications on this tool, changes can also be kept

64
on the same store which simplifies metric collection. By this way, metric collection
would be automated and metric collection tool developed within the scope of this
study would no longer be needed.
By combining requirements and changes on the requirements on the same
source, developers would get rid of preparing WIW document again which means
goal 4 is accomplished. A requirement may be changed more than one time. If all
change requests are kept on the same store, it would be possible to keep the history
of the requirements. Time of change request and information about responsible
person offering change request would also be seen. So, goal 2 would also be
accomplished.
Another improvement is automating change request mechanism. In the
current approach, a change request is formed after all changes about requirements are
decided and only change request is entered for more than many changes on
requirements. In the proposed model, when a developer decides on a change on any
requirement, an automatic SCR form is formed and sent to the main contractor.
Therefore it would be possible to keep track of change requests per requirement
satisfying goal 1. Since one change request is sent per requirement, examining the
change request and making a decision about it would be easy on the main contractor
side. This situation would shorten the response time to a change request satisfying
goal 3. Moreover, status of change request per requirement would also be delivered
and metrics about change requests would be collected which is not collected in
current approach.
The improvement proposal could not be applied on a real project since it
would be hard to persuade main-contractor for a process change. Instead, a tool is
developed for simulating both the current approach and improvement proposal. By
changing values of the independent variables of the simulation, more than one
condition is tested and how proposed method behaves under various conditions is
observed with low cost and risk.
The results obtained from simulation are presented and compared with the
current system with the aim of assessing whether the proposed system does realize
the expected improvements. Instead of analyzing the effect of change on all
independent variables, only four of them are chosen considering common sense.
Effect of change on probability of a change request, probability of getting an answer

65
that changes design, average number of questions about requirements and average
duration of open time of a question is analyzed.
After determining three constant values for each of the selected independent
variables, response of simulation tool to these changes is observed. Rather than
simulating all combinations of these four independent variables, some of them are
simulated. As presented in the preceding chapter, an increase in the probability of a
change request doesn’t affect development duration and re-work size in the proposed
method as much as it affects in the current approach.
For the changes on independent variables related with the questions asked
about requirements, results of both current approach and proposed method are nearly
same. This result is expected since proposed method changes nothing about the
asking question mechanism. Moreover as average duration of open time of a question
increases rework size increases exponentially. Duration of the project also increases
depending on this fact.
Increase on average number of questions also affects the current method and
proposed method in the same manner. When developers know much about the
requirements, they do not need to ask questions about requirements that prevent them
from beginning of design and implementation. And so, size of re-work decreases.
When information about requirements is not enough at the sub-contractor side,
number of questions and duration of the project depending on this value increase.
Therefore, an important point that this study reveals is that lack of
information flow between contractors may impact the development of multi-sided
project very much.
Results of the simulation tool show that proposed method not only shortens
the implementation period but also ends up with a product of better quality because
of less re-work. This study has shown that slight modifications in software
development processes can affect the implementation of the project more than
expected. This point is remarkable as this study does not aim to propose an
improvement to the whole software development process; rather it only proposes
minor modifications to requirements change management process with measurement
based SPI being the primary interest.
66
As a result, it can be declared that aim of the study is successfully fulfilled
through observation of results of the simulation and achievements of the goals aimed
at the beginning of the study.
7.2. Limitations and Future Work
There have been a number of limitations in this study. First of all since there
are many independent variables, only a small subset of the independent variables is
chosen and effect of change on this subset is observed.
Another limitation was only requirements change management process is
examined throughout the study. While applying measurement based SPI, author is
only focused on the requirements change management process. Instead of focusing
only one part, requirements management process beginning from elicitation of
requirements shall be investigated as a whole.
In this study, an average source line of code that implements each
requirement is used in simulation program with an exponential distribution and an
upper limit is defined when calculating the distribution. Weights of requirements
may differ and source line of code that implements each requirement can be very
different. This situation is ignored in the simulation program since there is not any
historical data about the weights of requirements. Moreover, in the simulation
program it is assumed that effect of modification in requirements in source line of
code that implement those requirements is negligible. As a future work, weights of
requirements can be taken into account and be used when calculating source line of
code that implements those requirements instead of exponential distribution.
Moreover, although a relatively large project is chosen as a case study, only
sub-projects developed at the sub-contractor side are examined. Parts of the projects
developed at the main contractor side and requirements change management process
applied by the main contractor are not examined. There are also other projects
developed at the company, requirements change management process at those
projects are not investigated as a part of this study.
This study has resulted in a tool that evaluates the improvement proposal on
requirements change management process at Project X with a simulation using a
small subset of the determined independent variables. As a future work, the

67
simulation tool can be run for different combinations of all the independent variables
analyzing the response of the simulation tool to changes on all independent variables.
Proposed method can be applied in a real project rather than in a simulation
project. The results received from the simulation can be compared with the results of
the real application. A survey can be conducted among developers to see the
advantages and disadvantages of both methods and effects of modifications can be
evaluated.
Another improvement to the study may be realized by considering not only
requirements change management process but also other processes at Project X when
applying measurement based SPI. As seen from the results of the simulation,
communication between main contractor and sub contractor plays an important role
in multi-sided projects. Methods can be developed to improve question mechanism.
Moreover, metrics about other phases of a project can be determined using CMMI
and GQM and by collecting and evaluating metrics software processes may be
improved. As a next step, measurement based SPI techniques can be used in all
projects and processes performed at the company leading the company to a more
mature organization.

68
REFERENCES
[1] Law, A, KElton, D, “Simulation Modelling and Analysis”, McGraw–Hill Book Company, 1982 [2] P. Zave, "Classification of Research Efforts in RE", ACM Computer Surveys, pp. 313, 1997. [3] C. S. Kuehl, "Improving System Requirements Quality Through Application of an Operational Concept Process: An Essential Element In System Sustainment", 4th Annual Systems Engineering Conference, 2001, Retrieved November 20, 2005 from http://www.dtic.mil/ndia/2001systems/ [4] Sawyer, P., Sommerville, I., & Viller, S. (1997). “Requirements process improvement through the phased introduction of good practice” Software Process - Improvement and Practice 3(1), Retrieved November 20, 2005 from http://www.comp.lancs.ac.uk/computing [5] S. Lauesen and O. Vinter, "Preventing Requirement Defects: An Experiment in Process Improvement", Springer, pp. 1-74, 2001. [6] B. Regnell and P. Beremark, "A Market Driven Requirements Engineering Process - Results from Industrial Process Improvement Program", Springer, pp. 121-129, 1998. [7] van Solingen, R. Berghout, E., “The Goal/Question/Metric Method – A Practical Guide for Quality Improvement of Software Development”, McGraw-Hill Companies, London, 1999 [8] CMMI® Product Team, “Capability Maturity Model Integration (CMMI®) for Software Engineering Version 1.1” , Software Engineering Institute, Carnegie Mellon University, 2002.

69
[9] El Eman, K., Drouin, J.N., Melo, W., “SPICE The Theory and Practice of Software Process Improvement and Capability Determination”, IEEE Computer Society Press, Los Alamitos, California, 1997 [10] Basili, V.R., Caldiera , G., Rombach, H.D. , “The Goal Question Metric Approach”, Encyclopedia of Software Engineering, Vol.1., John Wiley & Sons, 1994. [11] Basili, V.R., Caldiera, G., Rombach, H.D. , “Experience Factory”, Encyclopedia of Software Engineering, Vol. 1, pg. 528-532, John Wiley & Sons, 1994 [12] Pulford, K., Shirlaw, S., “The AMI Handbook: A Quantitative Approach to Software Management”, Addison-Wesley, 1996 [13] Loconsole, A., “Measuring the requirements management key process area”, Escom Conference, February, 2001. [14] Shrum, S., “Choosing a CMMI® Model Representation”, Crosstalk, July, 2000. [15] Starbuck, R., “A Configuration Manager's Perspective”, Crosstalk, July, 2000. [16] Birk, A., van Solingen, R., Jarvinen, J., "Business Impact, Benefit, and Cost of Applying GQM in Industry: An In-Depth, Long-Term Investigation at Schlumberger RPS", pg. 93, Fifth International Symposium on Software Metrics (METRICS'98), 1998 [17] DeMarco, T., “Controlling Software Projects”, Yourden Press, New York, 1982. [18] Park, R.E., Goethert, W.B. and Florac, W.A., “Goal-Driven Software Measurement – A Guidebook”, CMU/SEI-96–HB-002, August, 1996. [19] Dybå, T., Skogstad, Ø., “Measurement-Based Software Process Improvement,” Telektronikk, pg. 73-82, 1997. [20] Perkins, T., Peterson R., Smith, L., “Back to the Basics: Measurement and Metrics”, Crosstalk, December, 2003

70
[21] Weszka J., Babel, P., Ferguson, J., “CMMI®: Evolutionary Path to Enterprise Process Improvement”, Crosstalk, July, 2000. [22] Zubrow, D., “Measurement with a Focus–Goal Driven Software Measurement”, Crosstalk, September, 1998. [23] Sakry, M., Potter, N., “Goal-Problem Approach for Scoping an Improving Program”, Crostalk, May, 2000. [24] DeMarco, Tom. “Controlling Software Projects: Management, Measurement, and Estimation.” New York, NY: Yourdon Press, 1982. [25] Reifer, D.J., "Requirements Management: The search for Nirvana", IEEE Software, May/June 2000, pp. 45-47. [26] Paulk, M. C., Weber, C.V., Garcia, S., Chrissis, M.B. and Bush, M., "Key Practices of the Capability Maturity Model Version 1.1", Software Engineering Institute Technical Report, CMU/SEI-93-TR-25 ESC-TR-93-178, Pittsburgh, PA, 1993. [27] Wiegers, K., “Measuring Requirements Management”, Retrieved October 20, 2005 from http://www.stickyminds.com/se/S2511.asp [28] “Telelogic DOORS User Manual”, Retrieved November 18, 2005, from http://www.telelogic.com/corp/Products/doors/doors/index.cfm

71
APPENDIX A
SCREENSHOTS OF METRIC COLLECTION TOOL 1. User interface of the MCT
2. Snapshot of report generated by MCT