improved representation of particle size and solubility in
TRANSCRIPT

Improved representation of particle size and solubility in model simulations of atmospheric dispersion and wet-deposition from Fukushima
Article
Accepted Version
Creative Commons: Attribution-Noncommercial-No Derivative Works 4.0
Dacre, H., Bedwell, P., Hertwig, D., Leadbetter, S., loizou, P. and Webster, H. (2020) Improved representation of particle size and solubility in model simulations of atmospheric dispersion and wet-deposition from Fukushima. Journal of Environmental Radioactivity, 217. 106193. ISSN 0265-931X doi: https://doi.org/10.1016/j.jenvrad.2020.106193 Available at http://centaur.reading.ac.uk/88957/
It is advisable to refer to the publisher’s version if you intend to cite from the work. See Guidance on citing .
To link to this article DOI: http://dx.doi.org/10.1016/j.jenvrad.2020.106193
Publisher: Elsevier

All outputs in CentAUR are protected by Intellectual Property Rights law, including copyright law. Copyright and IPR is retained by the creators or other copyright holders. Terms and conditions for use of this material are defined in the End User Agreement .
www.reading.ac.uk/centaur
CentAUR
Central Archive at the University of Reading
Reading’s research outputs online

Improved representation of particle size and solubility in modelsimulations of atmospheric dispersion and wet-deposition from
Fukushima
H. F. Dacrea,, P. Bedwellb, D. Hertwiga, S. J. Leadbetterc, P. Loizoua, H. N. Websterc,d
aUniversity of Reading, UKbPublic Health England, UK
cMet Office, UKdCollege of Engineering, Mathematics and Physical Sciences, University of Exeter, Exeter, UK
Abstract
Radionuclides released into the atmosphere following the Fukushima Dai-ichi Nuclear PowerPlant (FDNPP) accident were detected by ground-based monitoring stations worldwide. Theinter-continental dispersion of radionuclides provides a unique opportunity to evaluate the abilityof atmospheric dispersion models to represent the processes controlling their transport and depo-sition in the atmosphere. Co-located measurements of radioxenon (133Xe) and caesium (137Cs)concentrations enable individual physical processes (dispersion, dry and wet deposition) to beisolated. In this paper we focus on errors in the prediction of 137Cs attributed to the representationof particle size and solubility, in the process of modelling wet deposition. Simulations of 133Xeand 137Cs concentrations using the UK Met Office NAME (Numerical Atmospheric-dispersionModelling Environment) model are compared with CTBTO (Comprehensive Nuclear-Test-BanTreaty Organisation) surface station measurements. NAME predictions of 137Cs using a bulk wetdeposition parameterisation (which does not account for particle size dependent scavenging orsolubility) significantly underestimate observed 137Cs. When a binned wet deposition parameter-isation is implemented (which accounts for particle size dependent scavenging) the correlationsbetween modelled and observed air concentrations improve at all 9 of the Northern Hemispheresites studied and the respective RMSLE (root-mean-square-log-error) decreases by a factor of7 due to a decrease in the wet-deposition of Aitken and Accumulation mode particles. Finally,NAME simulations were performed in which insoluble submicron particles are represented. Rep-resenting insoluble particles in the NAME simulations improves the RMSLE at all sites furtherby a factor of 7. Thus NAME is able to predict 137Cs with good accuracy (within a factor of10 of observed 137Cs values) at distances greater than 10,000 km from FDNPP only if insolublesubmicron particles are considered in the description of the source. This result provides furtherevidence of the presence of insoluble Cs-rich microparticles in the release following the accidentat FDNPP and suggests that these small particles travelled across the Pacific Ocean to the USand further across the North Atlantic Ocean towards Europe.
Keywords: Fukushima, Wet Deposition, Caesium, Xenon, Particle size, Solubility
Email address: [email protected] ()Preprint submitted to Journal of Environmental Radioactivity February 6, 2020

1. Introduction
A range of radionuclides are produced by nuclear reactors as a by-product of nuclear fis-sion. Were there to be an accident at a nuclear reactor, some of this radioactive material maybe inadvertently released into the environment. Predicting the dispersion and deposition of ra-dionuclides released into the atmosphere following a nuclear accident is of great importance asthey may present a risk to human health and the environment [1, 2]. Lagrangian particle disper-sion models are used as the basis for such emergency response predictions. For example, publichealth agencies (such as Public Health England, Institute for Radiological Protection and Nu-clear Safety and Federal Office for Radiation Protection) use dispersion model output to estimatedose from internal and external exposure to passing radioactive plumes. These dose estimatesform part of the scientific and technical advice provided to support government decision makersduring emergencies. The aim of this paper is to examine the ability of the Met Office’s atmo-spheric dispersion model (NAME) to accurately represent the processes affecting the transportand removal of radionuclides from the atmosphere over inter-continental scales, specifically theparameterisation of wet deposition.
On 11 March 2011 an earthquake off the Pacific coast of Tohoku, Japan, triggered a powerfultsunami. The tsunami resulted in a loss of power and the resultant loss of cooling caused anuclear accident at the Fukushima Dai-ichi Nuclear Power Plant (FDNPP) [3]. Radionuclideswere released into the atmosphere and were detected at a network of measurement sites acrossthe globe. Previous attempts to understand the transport and deposition of 137Cs emitted fromFDNPP have been made in several modelling studies on a Japanese scale [4, 5, 6] and a globalscale [7, 8]. In these studies, simulated 137Cs air concentration and 137Cs deposition to the surfacehave been found to differ substantially from the observed values, and between simulations [5].The processes controlling environmental concentrations of 137Cs include (i) the emission rate,(ii) transport to receptor, (iii) loss due to removal (dry and wet deposition) and (iv) loss due toradioactive decay. Errors in the model representation of these processes are multiplicative whichmeans that disentangling errors due to individual factors is not straightforward [9].
Caesium is a highly reactive isotope which can readily attach to particles in the atmospheresuch as ammonium, sulfate and nitrate [10]. It is typically assumed that 137Cs is subject to thesame dispersion and removal processes as these soluble particles. Thus 137Cs is usually treated assoluble in dispersion modelling forecasts [11, 8, 12]. Since wet deposition is often the predom-inant removal mechanism of particles in the atmosphere [13, 14, 15], several modelling studieshave investigated the sensitivity of their simulations to uncertainty in the empirical scavengingparameters used in their parameterisations [4, 6]. Simulations of 137Cs in the environment arehighly sensitive to these scavenging parameter choices [16], but no single set of scavenging pa-rameters has been found to result in systematically better agreement with observed 137Cs thanthe others. If precipitation fields are assumed to be non-biased (in intensity and distribution), adiscrepancy between modelled and observed deposition footprints may arise as a result of theapplication of a single set of scavenging coefficients (which do not vary as a function of particlediameter) in the parameterization of wet deposition.
Field data shows that particle removal processes strongly depend on particle size distributionthrough non-linear processes. Impaction/below cloud scavenging is much more efficient forparticles with diameters below 0.3 µm or above 1−2 µm than for particles in the range 0.3−1 µm[17]. Since 137Cs was observed attached to particles with diameters spanning the 0.3− 1 µm sizerange [10, 18], we hypothesise that including particle-size dependent scavenging coefficients willresult in better agreement with the observations.
2
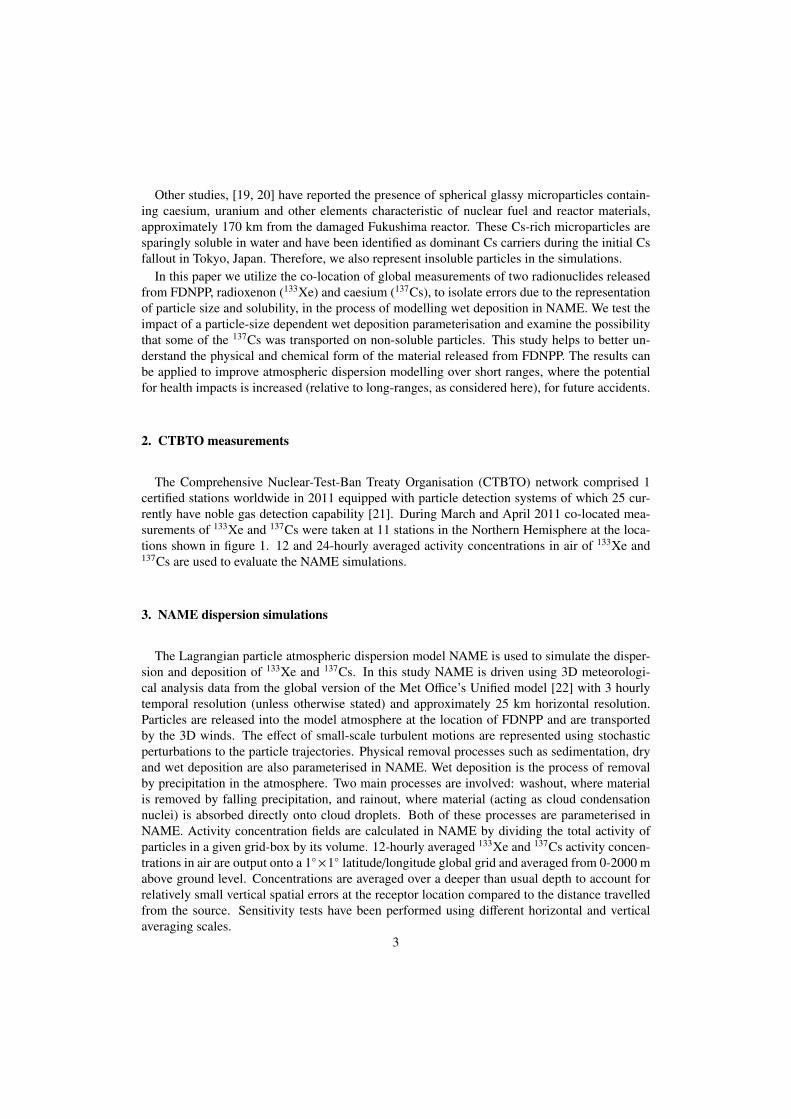
Other studies, [19, 20] have reported the presence of spherical glassy microparticles contain-ing caesium, uranium and other elements characteristic of nuclear fuel and reactor materials,approximately 170 km from the damaged Fukushima reactor. These Cs-rich microparticles aresparingly soluble in water and have been identified as dominant Cs carriers during the initial Csfallout in Tokyo, Japan. Therefore, we also represent insoluble particles in the simulations.
In this paper we utilize the co-location of global measurements of two radionuclides releasedfrom FDNPP, radioxenon (133Xe) and caesium (137Cs), to isolate errors due to the representationof particle size and solubility, in the process of modelling wet deposition in NAME. We test theimpact of a particle-size dependent wet deposition parameterisation and examine the possibilitythat some of the 137Cs was transported on non-soluble particles. This study helps to better un-derstand the physical and chemical form of the material released from FDNPP. The results canbe applied to improve atmospheric dispersion modelling over short ranges, where the potentialfor health impacts is increased (relative to long-ranges, as considered here), for future accidents.
2. CTBTO measurements
The Comprehensive Nuclear-Test-Ban Treaty Organisation (CTBTO) network comprised 1certified stations worldwide in 2011 equipped with particle detection systems of which 25 cur-rently have noble gas detection capability [21]. During March and April 2011 co-located mea-surements of 133Xe and 137Cs were taken at 11 stations in the Northern Hemisphere at the loca-tions shown in figure 1. 12 and 24-hourly averaged activity concentrations in air of 133Xe and137Cs are used to evaluate the NAME simulations.
3. NAME dispersion simulations
The Lagrangian particle atmospheric dispersion model NAME is used to simulate the disper-sion and deposition of 133Xe and 137Cs. In this study NAME is driven using 3D meteorologi-cal analysis data from the global version of the Met Office’s Unified model [22] with 3 hourlytemporal resolution (unless otherwise stated) and approximately 25 km horizontal resolution.Particles are released into the model atmosphere at the location of FDNPP and are transportedby the 3D winds. The effect of small-scale turbulent motions are represented using stochasticperturbations to the particle trajectories. Physical removal processes such as sedimentation, dryand wet deposition are also parameterised in NAME. Wet deposition is the process of removalby precipitation in the atmosphere. Two main processes are involved: washout, where materialis removed by falling precipitation, and rainout, where material (acting as cloud condensationnuclei) is absorbed directly onto cloud droplets. Both of these processes are parameterised inNAME. Activity concentration fields are calculated in NAME by dividing the total activity ofparticles in a given grid-box by its volume. 12-hourly averaged 133Xe and 137Cs activity concen-trations in air are output onto a 1◦×1◦ latitude/longitude global grid and averaged from 0-2000 mabove ground level. Concentrations are averaged over a deeper than usual depth to account forrelatively small vertical spatial errors at the receptor location compared to the distance travelledfrom the source. Sensitivity tests have been performed using different horizontal and verticalaveraging scales.
3

3.1. 133Xe Emission Rate
133Xe is an inert isotope of xenon. It therefore serves as a passive tracer of air mass transport.133Xe is modelled as a gas with a half-life of 5.25 days, no sedimentation, wet or dry-deposition.Figure 2(a) shows the estimated time evolution of 133Xe released from FDNPP between 12 - 19March 2011 [23]. There were 3 main releases occurring on 12, 13 and 15 March 2011 withsmaller releases in between.
3.2. 137Cs Emission Rate and particle size distribution
137Cs is an isotope of caesium. This radionuclide has a relatively long half-life of about 30years. Given the long time-scale for radioactive decay compared to the timescales for transport,emission rate variability, dry and wet deposition, errors in our simulations of 137Cs arising as aresult of uncertainties associated with radioactive decay will be insignificant. 137Cs is modelledas a particle with a radioactive decay half-life of 5.25 days. The density of the particles that 137Csattaches to is assumed to be 335 kg m−3. However, given their small size, sedimentation ratesare negligible and the results are insensitive to this assumed value. A dry deposition velocity of1× 10−3 m s−1 was assumed when modelling 137Cs, consistent with the values used in numericalsimulations by Public Health England, the Japanese Atomic Energy Agency and the Institutefor Radiological Protection and Nuclear Safety [24, 25]. Figure 2(b) shows the estimated timeevolution of 137Cs released from FDNPP [26]. The largest release occured on 12 March 2011 butsignificant releases continued until 21 March 2011.
In the context of radiation protection, activity median aerodynamic diameter (AMAD) is de-fined such that 50% of the radioactivity is associated with particles smaller than the AMAD and50% of the radioactivity is associated with particles larger than the AMAD. [27] provide a sum-mary of measured AMADs of radioactive particles from FDNPP. Based on measurements takenin Japan the 137Cs AMAD was in the range 0.5-11.5 µm depending on the distance from theFDNPP and measurement period [28, 10, 19, 29, 18] and in Europe the measured AMAD wasbetween 0.25-0.7 µm [30, 31]. The size distribution of the particles has been found to be bi-modal in Japan [28] with peaks at 0.5 µm and 6 µm. However, the 6 µm peak is thought to stemfrom the re-suspension of deposited radioactivity on soil particles. Whilst initial assumptionswere that 137Cs attached predominantly to soluble particles, more recently spherical hydropho-bic microparticles with a high 137Cs concentration have been observed in the deposits withinthe vicinity of the FDNPP [32, 20, 33]. For example, [34] showed that low-solubility Caesiumrich microparticles (CsMPs) 0.58 − 2.0 µm in diameter constituted 80% to 89% of the total Csradioactivity in the Tokyo area.
In this paper the impact of different particle size distributions (psd) including both solubleand insoluble particles is investigated. Binned psd 1 (table 1) is based on the measurements of[18]. Given that the samples in their study were obtained 4 months after the major release ofradioactivity, airborne radioactivity was likely to represent re-suspended deposited radioactivity,rather than direct transport from the source. Thus a second simulation (Binned psd 2, table 1) wasperformed in which the Coarse (1−10 µm) and Giant (10−100 µm) mode particles are moved tothe Accumulation mode to represent more closely the European size distribution measurementsof [30, 31]. Finally, to test the potential importance of representing insoluble CsMPs in ourintercontinental simulations of dispersion and deposition a third simulation was performed inwhich insoluble particles are represented (Binned psd 3, table 1).
In summary, 4 experiments were performed.4

Particle Particle Bulk Binnedbin diameter (µm) psd 1 psd 2 psd 3
S S S S IAitken 0.01-0.1 - 0.05 0.05 0.01 0.04
Accumulation 0.1-1.0 1.00 0.45 0.95 0.19 0.76Coarse 1.0-10 - 0.45 0.00 0.00 0.00Giant 10-100 - 0.05 0.00 0.00 0.00
Table 1: Fraction of 137Cs activity carried by particles of different diameters used in Bulk and Binned particle sizesimulations. Activity distribution for soluble (S) and insoluble (I) particles. Bulk particle size diameter is 0.8 µm.
• Bulk: A particle size of 0.8 µm and constant bulk scavenging coefficients are used (as shownin figures 3 and 4). All particles are assumed to be soluble.
• Binned psd 1: Particle size dependent scavenging coefficients are implemented. An equaldistribution of activity in the Accumulation (0.1 − 1 µm diameter) and Coarse (1.0 − 10 µmdiameter) size bins is used. All particles are assumed to be soluble.
• Binned psd 2: As for binned psd 1 experiment but the fraction of the total activity carriedby particles in the Coarse and Giant mode bins are set to zero and the remaining activity isadded to the Accumulation mode particles. All particles are assumed to be soluble.
• Binned psd 3: As for binned psd 2 experiment but the percentage of the total activity carriedby soluble particles is reduced by 80% and the remaining activity is carried by insolubleparticles of the same size.
Note that the results do not change if binned psd 2 and 3 contain small amounts of coarse andgiant mode particles since these larger particles are largely removed from the atmosphere bydry and wet-deposition (including sedimentation) before reaching the CTBTO receptor stations.In psd 3 an insoluble fraction of 80% is used since [34] showed that low-solubility CsMPs ac-counted for between 80-89% of the total Cs radioactivity measured. To test sensitivity to this,the insoluble fraction in psd 3 was varied from 70-90% and the conclusions do not change (notshown).
3.3. Bulk particle size wet deposition parameterisation (default)The default wet deposition parameterisation in NAME is a bulk parameterisation in which the
removal of material from the atmosphere due to wet deposition is particle size independent. Theremoval of material from the atmosphere by wet deposition processes is based on the depletionequation
dCdt
= −ΛC (1)
where C is pollutant concentration, t is time and Λ is a scavenging coefficient. The scavengingcoefficient, Λ, is given by
Λ = arb (2)
where r is precipitation rate in mm h−1 and a and b are scavenging parameters that vary for dif-ferent types of precipitation (e.g. rain or snow) and the process being represented (e.g. washoutor rainout) [35]. The values for a and b are based on observations and detailed cloud modelling[36] and are shown in figures 3 and 4.
5

3.4. Particle size dependent wet deposition parameterisation
The efficiency of below-cloud and in-cloud wet scavenging processes is known to dependon the particle size and the particle properties [17, 37]. Effectual cloud condensation nuclei aresubmicron in size (∼ 0.08−1.0 µm) and hygroscopic (water absorbing). Below-cloud scavengingis efficient for very small particles (<∼ 0.01 µm), due to their Brownian motion, and for Coarseparticles (of the order of a few microns), which are readily collected by impaction due to theirinertia. Below-cloud scavenging is much less efficient for particles in the intermediate size range,which tend to be swept along streamlines and around falling precipitation elements, therebyescaping capture. Improvements over a bulk wet deposition parameterisation are possible ifvariations in the scavenging coefficient with particle size are included.
A particle size dependent wet deposition parameterisation has recently been developed forNAME [37] based on the work of [38, 39] and [40]. Figure 3 shows the variation with parti-cle size of the below-cloud scavenging parameters (a and b), together with, for comparison, thedefault bulk scavenging parameters. In cloud (figure 4), the particle size dependent wet depo-sition parameterisation uses bin-defined scavenging coefficients (Λi) for different particle sizediameter (d) bins (nucleation: d ≤ 0.01 µm, Aitken: 0.01 < d ≤ 0.1 µm, Accummulation:0.1 < d ≤ 1.0 µm and Coarse: d > 1.0 µm). The bin-defined scavenging coefficient takes theform
Λi = airb = aRirb, (3)
where a = 5.2 × 10⁴ s−1 and b = 0.79 are constants which do not vary with particle size. Ri isthe in-cloud scavenging ratio for particle mode i and is defined as the fraction of the in-cloudparticles in mode i that are embedded within the cloud liquid water / cloud ice [40]. The in-cloud scavenging ratio depends on the phase of the cloud and whether the particle is hygroscopic(soluble) or hydrophobic (insoluble). Figure 4 shows the variation of the particle size dependentin-cloud scavenging parameter ai with particle size in liquid, mixed and ice phase clouds, forsoluble and insoluble particles. The bulk in-cloud scavenging parameters (which do not varywith particle size or solubility) are also shown for comparison.
4. Statistical evaluation
There is a wide range in the magnitude of observed and modelled concentrations, due to the useof data with distances from 1000 to 10,000 km from FDNPP. As both the 133Xe and 137Cs activityconcentrations at different receptor locations can vary by up to 2 orders of magnitude, they are logtransformed before the statistics are calculated. Background 133Xe and 137Cs concentrations ateach measurement site are estimated by averaging the lowest 4 concentrations measured at eachsite during the period 11/3/2011 to 11/5/2011. Background concentrations are expected to bepresent due to nuclear testing fall-out and medical isotope production facilities. The backgroundconcentration is added to the NAME estimated concentration before the statistics are calculated.All statistics are calculated for times at which both the observations and NAME simulationsare non-zero. Three statistics are used to compare the NAME simulations with the CTBTOobservations:
1. Root Mean Square Logarithmic Error (RMSLE)The RMSLE gives a measure of the difference between the activity concentrations pre-dicted by NAME and the observed activity concentrations. The advantage of RMSLE is
6

that it doesn’t penalize large differences in the modelled and the observed values when bothmodelled and observed values are large numbers.
log10(RMS LE) =
√√√1N
N∑t=1
[log10(xt) − log10(yt)
]2 (4)
where xt is the observed concentration and yt is the simulated concentration at time t. Thisis calculated using N concentration values, when both xt and yt are non-zero. Subtractingtwo log transformed values is equivalent to the log of the ratio of the values. Therefore,when RMSLE equals 10, this signifies that the predicted value is on average within a factorof 10 of the observed concentration.
2. Geometric Mean Bias (GMB)The GMB gives a measure of model overestimation or underestimation. This logarithmicform of bias is appropriate in this study because it ensures that underpredictions and over-predictions receive equal weight.
log10(GMB) =1N
N∑t=1
log10(xt) −1N
N∑t=1
log10(yt) (5)
As for RMSLE, to compare the GMB at different receptor locations, the ratio of observed toNAME simulated activity concentrations are compared. Thus when GMB equals 0.5, thissignifies that NAME underestimates the observed geometric mean by a factor of 2. WhenGMB equals 2, this signifies that NAME overestimates the observed geometric mean by afactor of 2.
3. CorrelationThe Pearson correlation coefficient is used to measure the linear relationship between theobserved (x) and simulated (y) concentrations. It varies between -1 and +1 with 0 implyingno correlation. Positive correlations imply x increases as y increases and vice versa. Todetermine whether the correlation between variables is significant, the p-value to the sig-nificance level is compared. A p-value < 0.01 is used to indicate that the correlation issignificant at the 99% confidence level.
5. Wet deposition error identification
The methodology used to identify errors due to the representation of wet deposition in thisNAME modelling study involves 3 steps as follows:
Step 1: Identify receptor locations at which the time series of observed and simulated 133Xeare: significantly correlated (p < 0.01); RMSLE is small (6 factor of 10) and GMB is small (6factor of 5). At these receptor locations, errors in the simulation of 137Cs activity concentrationsin air that are due to transport can be assumed to be small since 133Xe is passive and undergoesno sedimentation or dry-deposition.Step 2: At the receptor locations identified in step 1, identify receptor locations at which thesimulated time series of 133Xe and 137Cs (without wet deposition represented) are significantlycorrelated (p < 0.01). There is almost no correlation in the source emissions of 133Xe and 137Cs(figure 2(a) and (b)), and 133Xe is not subject to sedimentation or dry deposition. Therefore, any
7
significant correlations in the activity concentrations at the receptor locations mean that errorsin temporal fluctuations of the source, sedimentation or dry deposition rates of 137Cs do notdominate errors in the simulation of 137Cs activity (systematic errors in the magnitude of thesource can still contribute to the RMSLE and GMB).Step 3: At the receptor locations identified in step 2, compare the time series of observed andsimulated 137Cs using different wet deposition parameterisations including a dependency onparticle size and solubility assumptions. In this comparison errors in the simulation of 137Csactivity concentrations in air that are not due to evolution of the emission magnitude or trans-port have been isolated and the accuracy of different representations of wet deposition can becompared.
6. Results: Transport of 133Xe
Figure 5 shows the evolution of predicted 133Xe activity concentrations in air, between 0 and2000 m above ground level, released from FDNPP. Approximately 4 days after the start of therelease (figure 5(a)) the 133Xe plume has been transported up to 2000 km east of FDNPP acrossthe north Pacific Ocean. Approximately 7 days after the start of the release (figure 5(b)) the133Xe plume has now reached the east coast of the US (approximately 5000 km from FDNPP).The plume now covers large parts of the north Pacific Ocean with evidence of cyclonic transportby extratropical cyclones in both the west and east Pacific. Approximately 10 days after the startof the release (figure 5(c)) a filament of the 133Xe plume has reached Europe (> 10000 km fromFDNPP). The 133Xe is very widely dispersed by this time, covering much of the north Pacificand the north American continent.
In order to evaluate the accuracy of the representation of the meteorological processes respon-sible for this inter-continental transport the time evolution of NAME and observed 133Xe activityconcentrations in air at CTBTO sites in the northern hemisphere (step 1) are compared. To ac-count for the accumulated effect of small errors in the meteorological fields, 0 - 2000 m 133Xeconcentrations from the NAME simulations averaged over 1◦ × 1◦ lat/lon areas (approximately100 km by 100 km) are compared with the surface level concentrations measured at the CTBTOlocations, noting that care should be taken when comparing a point measurement (observation)to an area averaged model simulation as the point measurement may not be representative of thelarger area. Material is assumed to be well-mixed in the boundary layer at the distances inves-tigated in this study. As 133Xe is, to first order, an inert gas (non-reactive and non-depositing) itprovides an excellent tracer to perform this evaluation.
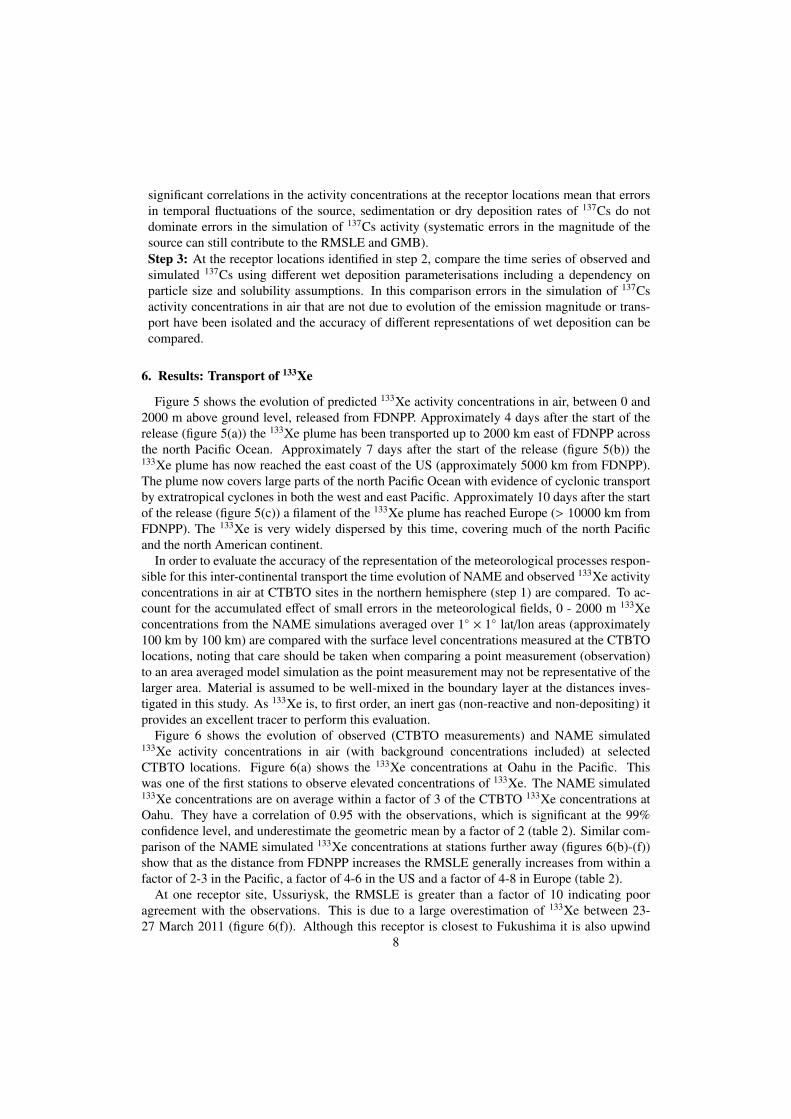
Figure 6 shows the evolution of observed (CTBTO measurements) and NAME simulated133Xe activity concentrations in air (with background concentrations included) at selectedCTBTO locations. Figure 6(a) shows the 133Xe concentrations at Oahu in the Pacific. Thiswas one of the first stations to observe elevated concentrations of 133Xe. The NAME simulated133Xe concentrations are on average within a factor of 3 of the CTBTO 133Xe concentrations atOahu. They have a correlation of 0.95 with the observations, which is significant at the 99%confidence level, and underestimate the geometric mean by a factor of 2 (table 2). Similar com-parison of the NAME simulated 133Xe concentrations at stations further away (figures 6(b)-(f))show that as the distance from FDNPP increases the RMSLE generally increases from within afactor of 2-3 in the Pacific, a factor of 4-6 in the US and a factor of 4-8 in Europe (table 2).
At one receptor site, Ussuriysk, the RMSLE is greater than a factor of 10 indicating pooragreement with the observations. This is due to a large overestimation of 133Xe between 23-27 March 2011 (figure 6(f)). Although this receptor is closest to Fukushima it is also upwind
8

Wak
eIs
land
Oah
u
Yel
low
knif
e
Ash
land
Cha
rlot
tesv
ille
StJo
hns
Scha
uins
land
Stoc
khol
m
Spits
berg
en
Ula
anba
atar
Uss
uriy
sk
Correlation 0.95 0.95 0.77 0.90 0.80 0.84 0.94 0.84 0.94 0.91 0.18
RMSLE 2 3 6 4 4 4 4 5 8 4 13
GMB 1/2 1/2 1/3 1/2 1/2 1/2 1/3 1/3 1/7 1/3 1
Table 2: Statistics are calculated for log10(133Xe). Grey shading indicate receptors at which the correlation is not signif-icant at the 99% confidence level, RMSLE is > 10, GMB > 5 or GMB < 1/5.
and thus in the simulations the radioactive material circumnavigates the Earth before it reachesUssurisk. In addition, the correlation between the observed and simulated 133Xe activity con-centrations in air is not significant at the 99th percentile confidence level at Ussuriysk (table 2).Also, at Spitsbergen the GMB is less than a factor of 1/5 indicating poor agreement with the ob-servations (although the correlation is high). Therefore Ussuriysk and Spitsbergen are removedfrom all further analysis as transport errors cannot be ruled out.
At all other stations the correlation between the NAME 133Xe concentration and the observed133Xe concentrations remains significant at the 99% confidence level showing that the simu-lations of 133Xe are skillful even at inter-continental distances from FDNPP. Thus the NAMEsimulations contain a good representation of the meteorological processes responsible for theinter-continental transport of 133Xe to these receptor locations. It is not the purpose of this paperto examine the cause of the transport errors to Ussuriysk and Spitsbergen.
7. Results: Transport and deposition of 137Cs
In this section the ability to correctly simulate the transport and deposition of 137Cs usingNAME is evaluated.
7.1. Emission rate, sedimentation rate and dry deposition rate
To evaluate the potential impact of errors in factors other than wet-deposition, NAME simula-tions in which the wet deposition of 137Cs is not represented are performed. Comparing the timeseries of simulated 137Cs and simulated 133Xe activity concentrations in air at the CTBTO loca-tions therefore allows us to assess the importance of the emission rate fluctuations, sedimentationand dry deposition rates (step 2). Table 3 shows the correlation between NAME simulated 137Cs(no wet deposition) and simulated 133Xe at the CTBTO locations identified in step 1. The corre-lations between NAME simulated 137Cs (no wet deposition) and simulated 133Xe are significantat the 99% level at all stations. Thus we conclude that the simulated concentrations are not verysensitive to the emission time profile characteristics, the sedimentation or dry deposition rates.Therefore, for the following analysis it is assumed that any discrepancies between the NAMEsimulated 137Cs concentrations and observed 137Cs concentrations are not due to errors in themeteorological transport to these receptor locations or to errors in the emission rate fluctuations,sedimentation or dry deposition rates. This does not however, rule out systematic bias in theemission rate magnitude.
We also compare observed concentrations of 137Cs with NAME simulations of 137Cs in whichthe wet deposition is not represented. Table 4 shows that, for all stations, NAME overestimates
9

Wak
eIs
land
Oah
u
Yel
low
knif
e
Ash
land
Cha
rlot
tesv
ille
StJo
hns
Scha
uins
land
Stoc
khol
m
Ula
anba
atar
Correlation 0.53 0.45 0.72 0.69 0.54 0.38 0.61 0.41 0.61
Table 3: Correlation between NAME log10(137Cs) subject to dry-deposition only, and NAME log10(133Xe). The correla-tions are significant at the 99% confidence level.
137Cs activity by at least two orders of magnitude when wet deposition is not represented. Sincethere is no removal of 137Cs by wet-deposition too much material remains in the atmosphere.Furthermore, when wet deposition is not represented the simulations are only significantly cor-related at 2 out of 9 receptor stations.
7.2. Bulk wet deposition parameterisation
The NAME simulations of 137Cs analysed in section 7.1 did not contain a representation ofwet deposition. In this section simulations in which both dry and wet deposition processes areincluded are performed. The representation of wet deposition of 137Cs is described in section 3.3.Figure 7 shows the evolution of observed CTBTO measurements and NAME simulated 137Cs ac-tivity concentrations in air for the selected receptor locations where it is assumed that errors inthe transport, sedimentation or dry deposition rates or emission rate fluctuations do not contributesignificantly to discrepancies. For NAME simulations using the bulk wet deposition parameter-isation, the highest 137Cs activity concentrations in air occur at Oahu (> 103 µBq m−3). Thereis also a high correlation, a small RMSLE and a GMB that is closer to 1 at this location (ta-ble 4). Particles reaching Oahu experience, on average, the shortest travel time from Fukushima(8.9 days) compared to the other receptor locations and thus the potential for small errors in thewind fields to accumulate along the particle trajectories is smaller than for the other measurementlocations.
For the NAME simulations using the bulk wet deposition parameterisation 137Cs concentra-tions are on average within a factor of 8 of the CTBTO 137Cs concentrations at Ashland (Fig-ure 7(b)). They have a correlation of 0.62 with the observations, which is significant at the 99%confidence level, and they underestimate the geometric mean by a factor of 7. Similar compar-isons of NAME simulated 137Cs concentrations at stations further away (figures 7(c)-(f)) showthat as the distance from FDNPP increases the RMSLE is high, typically greater than a factor of20 at all stations, the correlation is not significant at 5 of the stations (55%) and there remainsa large underestimation of the geometric mean (up to a factor of 38). Thus too much activityis removed from the particles via wet deposition using the bulk wet deposition parameterisation(en-route to the CTBTO stations considered here). Sensitivity to the spatial and vertical aver-aging scales has been performed and the results do not depend on these choices (see Appendixtable A.5).
The large underestimation in simulated 137Cs could be due to errors in the activity removalrates when the particles encounter precipitation. This could be caused by a systematic overes-timation in the numerical weather prediction (NWP) precipitation rates. For example, the wet-deposition scheme assumes that precipitating clouds are stationary between NWP meteorologyinput times (in this case 3 hours), whereas the particle positions evolve every model timestep (inthis case 15 minutes). However, in the atmosphere it is likely that the meteorological cloud and
10
the radioactive cloud would move with a similar velocity (known as Lagrangian persistence).This lack of Lagrangian persistence could result in the application of wet-deposition to a greaternumber of particles than it should or for a longer period of time. Therefore, simulations in which1-hourly, 3-hourly and 6-hourly meteorological input was used were performed. There was nosystematic improvement in the correlation statistics when higher temporal frequency wind andprecipitation data was used. There was however, an order of magnitude reduction in both theRMSLE and GMB when the temporal frequency was increased from 6-hourly to 3-hourly, butno significant improvement when hourly meteorological input data was used (not shown). Since3-hourly NWP is used in the simulations in section 7.2 this suggests that the lack of Lagrangianpersistence is not the dominant reason for low-skill in the 137Cs simulations.
The large underestimation in simulated 137Cs could be due to an overestimation of the scav-enging coefficients used in the bulk parameterisation. In particular, evidence in the literaturesuggests that the wet-deposition of particles depends on the size of the particles [17]. The poten-tial that the scavenging coefficients used in NAME are too large for the range of 137Cs particlesizes modelled here is investigated.
7.3. Particle size dependent wet deposition parametrisation
The NAME simulations of 137Cs analysed in section 7.2 did not represent the dependence ofwet deposition on particle size. In this section NAME simulations using a particle size dependentwet deposition parameterisation (described in section 3.4) are performed.
7.3.1. Soluble particles (psd 1)Figure 7 and table 4 show a comparison of the 137Cs concentrations simulated using the par-
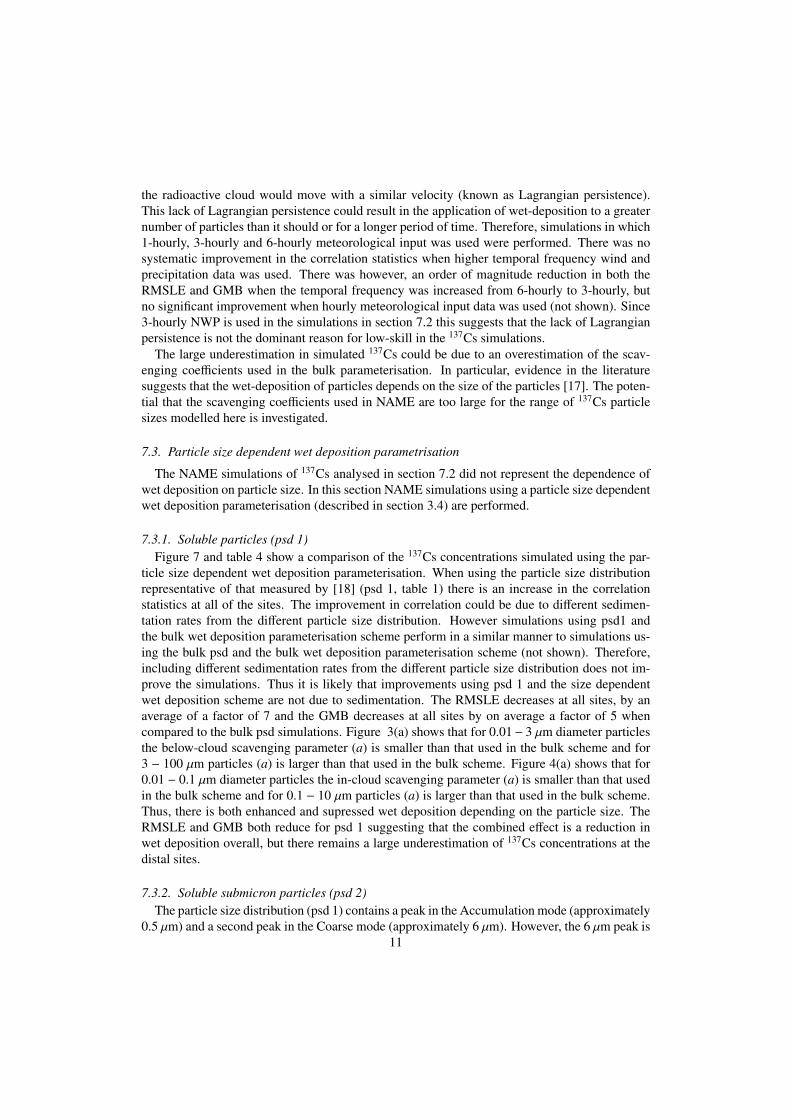
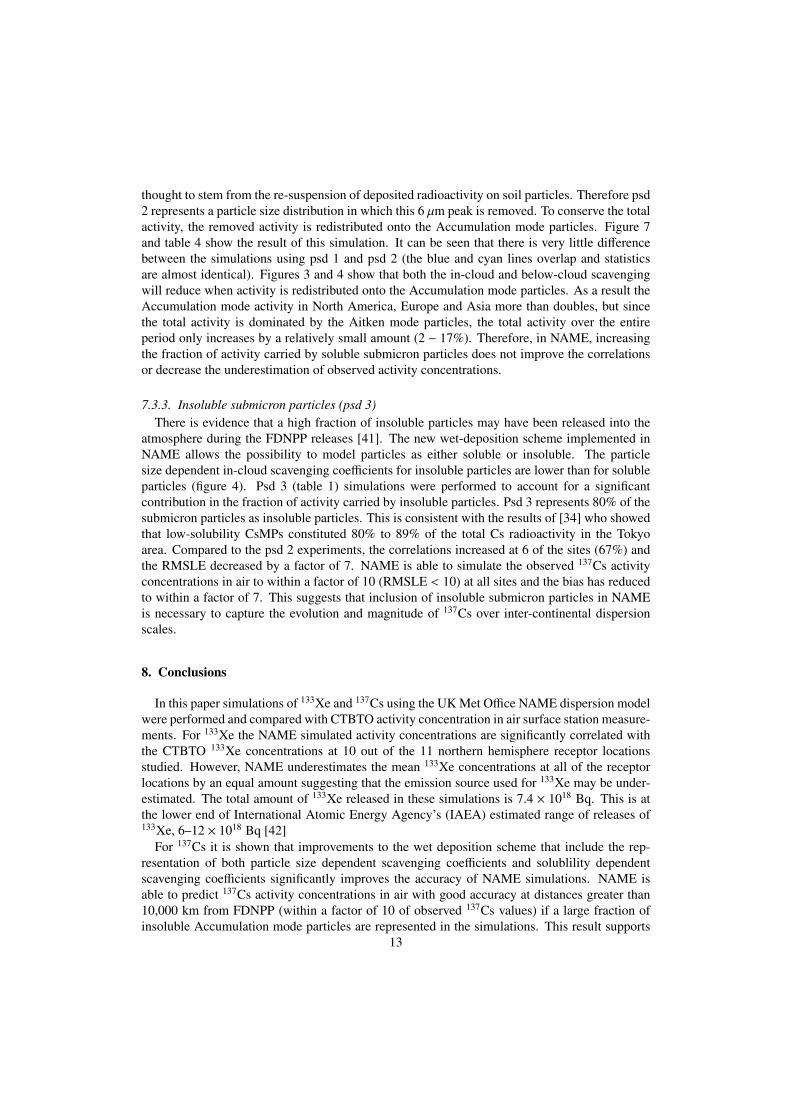
ticle size dependent wet deposition parameterisation. When using the particle size distributionrepresentative of that measured by [18] (psd 1, table 1) there is an increase in the correlationstatistics at all of the sites. The improvement in correlation could be due to different sedimen-tation rates from the different particle size distribution. However simulations using psd1 andthe bulk wet deposition parameterisation scheme perform in a similar manner to simulations us-ing the bulk psd and the bulk wet deposition parameterisation scheme (not shown). Therefore,including different sedimentation rates from the different particle size distribution does not im-prove the simulations. Thus it is likely that improvements using psd 1 and the size dependentwet deposition scheme are not due to sedimentation. The RMSLE decreases at all sites, by anaverage of a factor of 7 and the GMB decreases at all sites by on average a factor of 5 whencompared to the bulk psd simulations. Figure 3(a) shows that for 0.01− 3 µm diameter particlesthe below-cloud scavenging parameter (a) is smaller than that used in the bulk scheme and for3 − 100 µm particles (a) is larger than that used in the bulk scheme. Figure 4(a) shows that for0.01 − 0.1 µm diameter particles the in-cloud scavenging parameter (a) is smaller than that usedin the bulk scheme and for 0.1 − 10 µm particles (a) is larger than that used in the bulk scheme.Thus, there is both enhanced and supressed wet deposition depending on the particle size. TheRMSLE and GMB both reduce for psd 1 suggesting that the combined effect is a reduction inwet deposition overall, but there remains a large underestimation of 137Cs concentrations at thedistal sites.
7.3.2. Soluble submicron particles (psd 2)The particle size distribution (psd 1) contains a peak in the Accumulation mode (approximately
0.5 µm) and a second peak in the Coarse mode (approximately 6 µm). However, the 6 µm peak is11

Wak
eIs
land
Oah
u
Yel
low
knif
e
Ash
land
Cha
rlot
tesv
ille
StJo
hns
Scha
uins
land
Stoc
khol
m
Ula
anba
atar
Correlation
Bulk (no wet dep) 0.37 0.55 0.63 0.00 0.21 0.67 0.26 0.40 0.40Bulk 0.52 0.74 0.08 0.62 0.34 0.25 0.32 0.49 0.31psd 1 0.82 0.82 0.36 0.69 0.52 0.48 0.75 0.58 0.53psd 2 0.82 0.82 0.37 0.68 0.52 0.48 0.75 0.59 0.55psd 3 0.87 0.85 0.48 0.71 0.59 0.46 0.71 0.58 0.76
RMSLE
Bulk (no wet dep) 441 345 50 282 210 159 199 154 223Bulk 14 8 44 8 18 42 8 20 16psd 1 3 5 30 6 11 23 7 14 12psd 2 4 5 30 5 11 23 7 14 12psd 3 4 5 10 4 5 9 4 6 4
GMB
Bulk (no wet dep) 319 252 45 192 166 129 170 133 187Bulk 1/7 1/4 1/38 1/7 1/13 1/26 1/7 1/16 1/11psd 1 1/2 1/2 1/26 1/5 1/8 1/14 1/6 1/11 1/8psd 2 1 1/2 1/26 1/5 1/8 1/14 1/6 1/11 1/8psd 3 2 1 1/7 1/2 1/2 1/3 1/3 1/4 1/3
Table 4: Wet deposition evaluation statistics for the simulations including particle size distributions described in sec-tion 3.2 and Table 1. The bulk (no wet dep) simulation contains no representation of wet deposition. Statistics calculatedfor log10(137Cs). Grey shading indicate receptors at which the correlation is not significant at the 99% confidence level,RMSLE is > 10, GMB > 5 or GMB < 1/5.
12
thought to stem from the re-suspension of deposited radioactivity on soil particles. Therefore psd2 represents a particle size distribution in which this 6 µm peak is removed. To conserve the totalactivity, the removed activity is redistributed onto the Accumulation mode particles. Figure 7and table 4 show the result of this simulation. It can be seen that there is very little differencebetween the simulations using psd 1 and psd 2 (the blue and cyan lines overlap and statisticsare almost identical). Figures 3 and 4 show that both the in-cloud and below-cloud scavengingwill reduce when activity is redistributed onto the Accumulation mode particles. As a result theAccumulation mode activity in North America, Europe and Asia more than doubles, but sincethe total activity is dominated by the Aitken mode particles, the total activity over the entireperiod only increases by a relatively small amount (2 − 17%). Therefore, in NAME, increasingthe fraction of activity carried by soluble submicron particles does not improve the correlationsor decrease the underestimation of observed activity concentrations.
7.3.3. Insoluble submicron particles (psd 3)There is evidence that a high fraction of insoluble particles may have been released into the
atmosphere during the FDNPP releases [41]. The new wet-deposition scheme implemented inNAME allows the possibility to model particles as either soluble or insoluble. The particlesize dependent in-cloud scavenging coefficients for insoluble particles are lower than for solubleparticles (figure 4). Psd 3 (table 1) simulations were performed to account for a significantcontribution in the fraction of activity carried by insoluble particles. Psd 3 represents 80% of thesubmicron particles as insoluble particles. This is consistent with the results of [34] who showedthat low-solubility CsMPs constituted 80% to 89% of the total Cs radioactivity in the Tokyoarea. Compared to the psd 2 experiments, the correlations increased at 6 of the sites (67%) andthe RMSLE decreased by a factor of 7. NAME is able to simulate the observed 137Cs activityconcentrations in air to within a factor of 10 (RMSLE < 10) at all sites and the bias has reducedto within a factor of 7. This suggests that inclusion of insoluble submicron particles in NAMEis necessary to capture the evolution and magnitude of 137Cs over inter-continental dispersionscales.
8. Conclusions
In this paper simulations of 133Xe and 137Cs using the UK Met Office NAME dispersion modelwere performed and compared with CTBTO activity concentration in air surface station measure-ments. For 133Xe the NAME simulated activity concentrations are significantly correlated withthe CTBTO 133Xe concentrations at 10 out of the 11 northern hemisphere receptor locationsstudied. However, NAME underestimates the mean 133Xe concentrations at all of the receptorlocations by an equal amount suggesting that the emission source used for 133Xe may be under-estimated. The total amount of 133Xe released in these simulations is 7.4 × 10¹⁸ Bq. This is atthe lower end of International Atomic Energy Agency’s (IAEA) estimated range of releases of133Xe, 6–12 × 1018 Bq [42]
For 137Cs it is shown that improvements to the wet deposition scheme that include the rep-resentation of both particle size dependent scavenging coefficients and solublility dependentscavenging coefficients significantly improves the accuracy of NAME simulations. NAME isable to predict 137Cs activity concentrations in air with good accuracy at distances greater than10,000 km from FDNPP (within a factor of 10 of observed 137Cs values) if a large fraction ofinsoluble Accumulation mode particles are represented in the simulations. This result supports
13

the recent discovery of Cs-rich microparticles in Japanese soil samples [33, 43] and suggeststhat these small particles travelled across the Pacific Ocean to the US and further across theNorth Atlantic Ocean towards Europe. The results suggest that heavier particles and particlessubject to higher levels of in-cloud and below-cloud scavenging are efficiently removed fromthe radioactive cloud by sedimentation, dry and wet-deposition and so do not travel over theseinter-continental dispersion scales.
The improved use of particle size dependent wet deposition scheme and consideration of sol-ubility are also applicable to predictions of dispersion and deposition of particles released fromother non-nuclear sources such as volcanic eruptions, industrial accidents and forest fires. Futurework could consider if similar modelling improvements (in respect of the release following theaccident at FDNPP) could better describe the atmospheric dispersion and deposition of isotopesof iodine across the different chemical forms (particulate, elemental vapour and organic).
9. Acknowledgements
We would like to acknowledge the work of CTBTO in building up and maintaining its globalradioxenon and caesium measurement network. We thank the UK Met Office for providingaccess to the NAME dispersion model and Peter Clark for producing the high-resolution meteo-rological data and for helpful discussions on this work. This research did not receive any specificgrant from funding agencies in the public, commercial, or not-for-profit sectors.
References
[1] Y. Amano, The Fukushima Daiichi accident, Tech. Rep. Pub1710, International Atomic Energy Agency (2015).URL https://www-pub.iaea.org/MTCD/Publications/PDF/Pub1710-ReportByTheDG-Web.pdf
[2] L. R. Anspaugh, R. J. Catlin, M. Goldman, The global impact of the Chernobyl reactor accident, Science 242 (4885)(1988) 1513–1519.
[3] P. Thakur, S. Ballard, R. Nelson, An overview of Fukushima radionuclides measured in the northern hemisphere,Science of the total environment 458 (2013) 577–613.
[4] Y. Morino, T. Ohara, M. Watanabe, S. Hayashi, M. Nishizawa, Episode analysis of deposition of radiocesium fromthe Fukushima Daiichi nuclear power plant accident, Environmental science & technology 47 (5) (2013) 2314–2322.
[5] T. Nakajima, S. Misawa, Y. Morino, H. Tsuruta, D. Goto, J. Uchida, T. Takemura, T. Ohara, Y. Oura, M. Ebihara,et al., Model depiction of the atmospheric flows of radioactive cesium emitted from the Fukushima Daiichi NuclearPower Station accident, Progress in Earth and Planetary Science 4 (1) (2017) 2.
[6] S. J. Leadbetter, M. C. Hort, A. R. Jones, H. N. Webster, R. R. Draxler, Sensitivity of the modelled deposition ofCaesium-137 from the Fukushima Dai-ichi nuclear power plant to the wet deposition parameterisation in NAME,Journal of environmental radioactivity 139 (2015) 200–211.
[7] A. Stohl, P. Seibert, G. Wotawa, D. Arnold, J. F. Burkhart, S. Eckhardt, C. Tapia, A. Vargas, T. Yasunari, Xenon-133and caesium-137 releases into the atmosphere from the Fukushima Dai-ichi nuclear power plant: determination ofthe source term, atmospheric dispersion, and deposition, Atmospheric Chemistry and Physics 12 (5) (2012) 2313–2343.
[8] T. Chai, R. Draxler, A. Stein, Source term estimation using air concentration measurements and a lagrangian dis-persion model - experiments with pseudo and real cesium-137 observations from the Fukushima nuclear accident,Atmospheric Environment 106 (2015) 241–251.
[9] L. Terzi, M. Kalinowski, World-wide seasonal variation of 7Be related to large-scale atmospheric circulation dy-namics, Journal of environmental radioactivity 178 (179) (2017). doi:doi.org/10.1016/j.jenvrad.2017.06.031.
[10] N. Kaneyasu, H. Ohashi, F. Suzuki, T. Okuda, F. Ikemori, Sulfate aerosol as a potential transport medium ofradiocesium from the Fukushima nuclear accident, Environmental science & technology 46 (11) (2012) 5720–5726.
[11] C. Srinivas, R. Venkatesan, R. Baskaran, V. Rajagopal, B. Venkatraman, Regional scale atmospheric dispersionsimulation of accidental releases of radionuclides from Fukushima Dai-ichi reactor, Atmospheric environment 61(2012) 66–84.
14

[12] R. Draxler, D. Arnold, M. Chino, S. Galmarini, M. Hort, A. Jones, S. Leadbetter, A. Malo, C. Maurer, G. Rolph,et al., World Meteorological Organization’s model simulations of the radionuclide dispersion and deposition fromthe Fukushima Daiichi nuclear power plant accident, Journal of environmental radioactivity 139 (2015) 172–184.
[13] J. H. Seinfeld, S. N. Pandis, Atmospheric chemistry and physics: from air pollution to climate change, John Wiley& Sons, 2016.
[14] B. Sportisse, A review of parameterizations for modelling dry deposition and scavenging of radionuclides, Atmo-spheric Environment 41 (13) (2007) 2683–2698.
[15] C. Textor, M. Schulz, S. Guibert, S. Kinne, Y. Balkanski, S. Bauer, T. Berntsen, T. Berglen, O. Boucher, M. Chin,et al., Analysis and quantification of the diversities of aerosol life cycles within Aerocom, Atmospheric Chemistryand Physics 6 (7) (2006) 1777–1813.
[16] M. Kajino, T. T. Sekiyama, A. Mathieu, I. Korsakissok, R. Perillat, D. Quelo, A. Querel, O. Saunier, K. Adachi,S. Girard, et al., Lessons learned from atmospheric modeling studies after the Fukushima nuclear accident: En-semble simulations, data assimilation, elemental process modeling, and inverse modeling, Geochemical Journal 52(2018). doi:doi.org/10.2343/geochemj.2.0503.
[17] S. Greenfield, Rain scavenging of radioactive particulate matter from the atmosphere, Journal of Meteorology14 (2) (1957) 115–125.
[18] A. Koizumi, K. H. Harada, T. Niisoe, A. Adachi, Y. Fujii, T. Hitomi, H. Kobayashi, Y. Wada, T. Watanabe,H. Ishikawa, Preliminary assessment of ecological exposure of adult residents in Fukushima prefecture to ra-dioactive cesium through ingestion and inhalation, Environmental health and preventive medicine 17 (4) (2012)292.
[19] K. Adachi, M. Kajino, Y. Zaizen, Y. Igarashi, Emission of spherical cesium-bearing particles from an early stageof the Fukushima nuclear accident, Scientific reports 3 (2013) 2554.
[20] Y. Abe, Y. Iizawa, Y. Terada, K. Adachi, Y. Igarashi, I. Nakai, Detection of uranium and chemical state analysisof individual radioactive microparticles emitted from the Fukushima nuclear accident using multiple synchrotronradiation X-ray analyses, Analytical chemistry 86 (17) (2014) 8521–8525.
[21] CTBTO, https://www.ctbto.org/map, accessed: 2019-08-20 (2019).[22] M. Cullen, T. Davies, M. Mawson, J. James, S. Coulter, A. Malcolm, An overview of numerical methods for the
next generation UK NWP and climate model, Atmosphere-Ocean 35 (sup1) (1997) 425–444.[23] UNSCEAR, Developments since the 2013 UNSCEAR Report on the levels and effects of radiation exposure due
to the nuclear accident following the great east Japan earthquake and tsunami. A 2015 white paper to guide thescientific committee’s future programme of work. (2015).URL https://https://www.unscear.org/unscear/en/publications.html
[24] M.-A. Gonze, P. Renaud, I. Korsakissok, H. Kato, T. G. Hinton, C. Mourlon, M. Simon-Cornu, Assessment of dryand wet atmospheric deposits of radioactive aerosols: application to fukushima radiocaesium fallout, Environmen-tal science & technology 48 (19) (2014) 11268–11276.
[25] Atmospheric dispersion modelling liaison committee annual report 1998/99, Tech. Rep. NRPB-R322, NationalRadiological Protection Board (1999).URL https://admlc.files.wordpress.com/2014/09/r302.pdf
[26] G. Katata, M. Chino, T. Kobayashi, H. Terada, M. Ota, H. Nagai, M. Kajino, R. Draxler, M. Hort, A. Malo,et al., Detailed source term estimation of the atmospheric release for the Fukushima Daiichi Nuclear Power Stationaccident by coupling simulations of an atmospheric dispersion model with an improved deposition scheme andoceanic dispersion model, Atmospheric Chemistry & Physics 15 (2) (2015). doi:doi.org/10.5194/acp-15-1029-2015.
[27] A. Mathieu, M. Kajino, I. Korsakissok, R. Perillat, D. Quelo, A. Querel, O. Saunier, T. Sekiyama, Y. Igarashi,D. Didier, Fukushima Daiichi derived radionuclides in the atmosphere, transport and deposition in Japan: A review,Applied geochemistry 91 (2018) 122–139.
[28] T. Doi, K. Masumoto, A. Toyoda, A. Tanaka, Y. Shibata, K. Hirose, Anthropogenic radionuclides in the atmosphereobserved at Tsukuba: characteristics of the radionuclides derived from Fukushima, Journal of environmental ra-dioactivity 122 (2013) 55–62.
[29] Y. Miyamoto, K. Yasuda, M. Magara, Size distribution of radioactive particles collected at Tokai, Japan 6 daysafter the nuclear accident, Journal of environmental radioactivity 132 (2014) 1–7.
[30] O. Masson, W. Ringer, a. Mala, P. Rulik, M. Dlugosz-Lisiecka, K. Eleftheriadis, O. Meisenberg, A. De Vismes-Ott,F. Gensdarmes, Size distributions of airborne radionuclides from the Fukushima nuclear accident at several placesin Europe, Environmental science & technology 47 (19) (2013) 10995–11003.
[31] H. Mala, P. Rulık, V. Beckova, J. Mihalık, M. Slezakova, Particle size distribution of radioactive aerosols after theFukushima and the Chernobyl accidents, Journal of environmental radioactivity 126 (2013) 92–98.
[32] Y. Igarashi, T. Kogure, Y. Kurihara, H. Miura, T. Okumura, Y. Satou, Y. Takahashi, N. Yamaguchi, A review ofCs-bearing microparticles in the environment emitted by the Fukushima Dai-ichi Nuclear Power Plant accident,Journal of environmental radioactivity 205 (2019) 101–118.
15

[33] G. Furuki, J. Imoto, A. Ochiai, S. Yamasaki, K. Nanba, T. Ohnuki, B. Grambow, R. C. Ewing, S. Utsunomiya,Caesium-rich micro-particles: A window into the meltdown events at the Fukushima Daiichi Nuclear Power Plant,Scientific reports 7 (2017) 42731.
[34] S. Utsunomiya, G. Furuki, A. Ochiai, S. Yamasaki, K. Nanba, B. Grambow, R. Ewing, Caesium fallout in Tokyo on15th march, 2011 is dominated by highly radioactive, caesium rich microparticles, arXiv preprint arXiv:1906.00212(2019).
[35] H. Webster, D. Thomson, The NAME wet deposition scheme, Tech. Rep. Forecasting Research Tech. Report NO.584, Met Office (2014).URL https://www.metoffice.gov.uk/research/library-and-archive/publications/science/
weather-science-technical-reports
[36] R. Maryon, D. Ryall, A. Malcolm, The NAME 4 dispersion model: Science documentation, Met Office turbulenceand diffusion note 262 (1999) 45.
[37] H. Webster, D. Thomson, A particle size dependent wet deposition scheme for name., Tech. Rep. ForecastingResearch Tech. Report NO. 624, Met Office (2017).URL https://www.metoffice.gov.uk/research/library-and-archive/publications/science/
weather-science-technical-reports
[38] J. Feng, A 3-mode parameterization of below-cloud scavenging of aerosols for use in atmospheric dispersion mod-els, Atmospheric Environment 41 (32) (2007) 6808–6822.
[39] J. Feng, A size-resolved model for below-cloud scavenging of aerosols by snowfall, Journal of Geophysical Re-search 114 (D8) (2009). doi:doi.org/10.1029/2008JD011012.
[40] P. Stier, J. Feichter, S. Kinne, S. Kloster, E. Vignati, J. Wilson, L. Ganzeveld, I. Tegen, M. Werner, Y. Balkanski,et al., The aerosol climate model ECHAM5 HAM, Atmospheric Chemistry and Physics 5 (4) (2005) 1125–1156.
[41] J. Imoto, A. Ochiai, G. Furuki, M. Suetake, R. Ikehara, K. Horie, M. Takehara, S. Yamasaki, K. Nanba, T. Ohnuki,et al., Isotopic signature and nano-texture of cesium-rich micro-particles: Release of uranium and fission productsfrom the Fukushima Daiichi Nuclear Power Plant, Scientific reports 7 (1) (2017) 5409.
[42] The Fukushima Daiichi Accident, Non-serial Publications, International Atomic Energy Agency, Vienna, 2015.URL https://www.iaea.org/publications/10962/the-fukushima-daiichi-accident
[43] R. Ikehara, M. Suetake, T. Komiya, G. Furuki, A. Ochiai, S. Yamasaki, W. R. Bower, G. T. Law, T. Ohnuki,B. Grambow, et al., Novel method of quantifying radioactive cesium-rich microparticles (csmps) in the environmentfrom the Fukushima Daiichi nuclear power plant, Environmental science & technology 52 (11) (2018) 6390–6398.
Figure 1: Location of CTBTO measurement sites analysed. Ashland (37.17N, 99.77W), Charlottesville (37.99N,78.39W), Oahu (21.52N, 157.99W), Schauinsland (47.92N, 7.91E), Spitsbergen (78.23N, 15.39E), Stockholm (59.41N,17.95E), Ulaanbaatar (47.89N, 106.33E), Ussuriysk (44.15N, 132E), Wake Island (19.29N, 166.61E), Yellowknife(62.48N, 114.47W) and St Johns (47.59N, 52.74W). The location of Fukushima is shown as red star (and denotedby ’F’).
Appendix A. Sensitivity to horizontal and vertical averaging scales
16

Figure 2: Timeseries of (a) 133Xe released at Fukushima [23] and (b) 137Cs released at Fukushima [26]
Figure 3: Variation of below-cloud scavenging parameters, (a) a and (b) b, with particle diameter [37]. For comparison,the default bulk scavenging parameters are shown.
17

Figure 4: Variation of in-cloud scavenging parameter ai with particle diameter in liquid, mixed and ice phase clouds for(a) soluble and (b) insoluble particles. For comparison, the in-cloud bulk scavenging parameters are shown. In-cloudparameter b is constant at 0.79 for all parameterisations.
Lat/lon Depth
Wak
eIs
land
Oah
u
Yel
low
knif
e
Ash
land
Cha
rlot
tesv
ille
StJo
hns
Scha
uins
land
Stoc
khol
m
Ula
anba
atar
Correlation
1◦ × 1◦ 0-2 km 0.52 0.74 0.08 0.62 0.34 0.25 0.32 0.49 0.311◦ × 1◦ BL 0.56 0.78 0.09 0.57 0.49 0.27 0.40 0.40 0.392◦ × 2◦ 0-2 km 0.53 0.74 0.06 0.65 0.36 0.19 0.29 0.54 0.44
RMSLE
1◦ × 1◦ 0-2 km 14 8 44 8 18 42 8 20 161◦ × 1◦ BL 13 7 45 9 18 41 9 20 162◦ × 2◦ 0-2 km 14 8 44 8 17 43 9 20 16
GMB
1◦ × 1◦ 0-2 km 1/7 1/4 1/38 1/7 1/13 1/26 1/7 1/16 1/111◦ × 1◦ BL 1/7 1/4 1/38 1/8 1/13 1/25 1/7 1/16 1/112◦ × 2◦ 0-2 km 1/7 1/4 1/38 1/7 1/12 1/25 1/7 1/16 1/11
Table A.5: Evaluation statistics for the simulations including bulk particle size distribution described in section 3.2 andTable 1. Lat/lon indicates the horizontal spatial area over which concentrations are calculated. Depth indicates the verticaldepth over which concentrations are calculated. 0-2 km simulation concentrations are calculated over the lowest 2 km ofthe atmosphere and the BL simulations concentrations are calculated over the boundary layer depth. Statistics calculatedfor log10(137Cs). Grey shading indicate receptors at which the correlation is not significant at the 99% confidence level,RMSLE is > 10, GMB > 5 or GMB < 1/5.
18
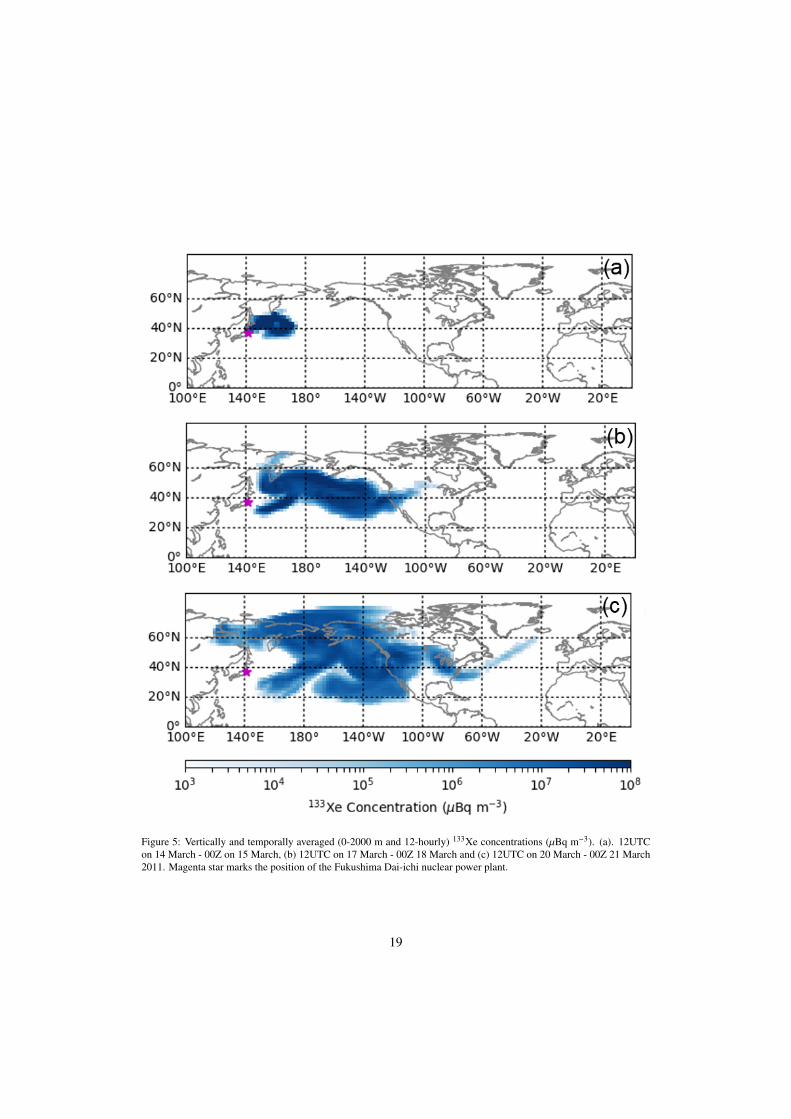
Figure 5: Vertically and temporally averaged (0-2000 m and 12-hourly) 133Xe concentrations (µBq m−3). (a). 12UTCon 14 March - 00Z on 15 March, (b) 12UTC on 17 March - 00Z 18 March and (c) 12UTC on 20 March - 00Z 21 March2011. Magenta star marks the position of the Fukushima Dai-ichi nuclear power plant.
19

Figure 6: Timeseries of 12-hourly averaged vertically averaged (0-2000 m) 133Xe (µBq m−3) at (a) Oahu, (b) Ashland, (c)Charlottesville, (d) St Johns, (e) Stockholm and (f) Ussuriysk. CTBTO meaurements (black circles), NAME simulations(black crosses). Background concentration (black dotted). Values are only shown when both observations and NAMEconcentrations are non-zero. Date labels are day/month.
20

Figure 7: Timeseries of 24-hourly averaged vertically averaged (0-2000 m) 137Cs (µBq m−3) at (a) Oahu, (b) Ashland,(c) Charlottesville, (d) St Johns, (e) Stockholm and (f) Ulaanbaatar. CTBTO measurements (black circles). NAMEsimulations using bulk wet deposition parameterisation (black triangles), psd 1 (cyan), psd 2 (blue) and psd 3 (magenta).Background concentration (black dashed). Values are only shown when both observations and NAME concentrations arenon-zero. Date labels are day/month.
21