improved pedestrian dead reckoning positioning with...
TRANSCRIPT

19th International Conference on Information Fusion Heidelberg, Germany - July 5-8, 2016
Improved Pedestrian Dead Reckoning Positioning With Gait Parameter Learning
Parinaz Kasebzadeh, Carsten Fritsche, Gustaf Hendeby, Fredrik Gunnarsson t, Fredrik Gustafsson Department of Electrical Engineering, Linkoping University, Linkoping, Sweden
Email: {firstname.lastname}@liu.se t Ericsson Research, Linkoping, Sweden, Email: [email protected]
Abstract-We consider personal navigation systems in devices equipped with inertial sensors and Global Positioning System (GPS), where we propose an improved Pedestrian Dead Reckoning (PDR) algorithm that learns gait parameters in time intervals when position estimates are available, for instance from GPS or an indoor positioning system (IPS). A novel filtering approach is proposed that is able to learn internal gait parameters in the PDR algorithm, such as the step length and the step detection threshold. Our approach is based on a multi-rate Kalman filter bank that estimates the gait parameters when position measurements are available, which improves PDR in time intervals when the position is not available, for instance when passing from outdoor to indoor environments where IPS is not available. The effectiveness of the new approach is illustrated on several real world experiments.
I. INTRODUCTION
This paper applies a Dead Reckoning (DR) principle to a Pedestrian Navigation System (PNS) in order to obtain a system to locate the mobile user in both indoor or outdoor environments. These systems are gaining increasing interest as a tool to improve the localization aspects specifically in indoor-based problems. In these cases, either the accuracy of the GPS is degraded significantly or the signal is totally inaccessible, due to blocking line-of-sight (LOS) or strong signal attenuation. The application areas of PNSs are many, where navigation for blind, helping people suffering from Alzheimer's, essential services interruptions, emergency coordination, assets tracking, rescue and tracking in big malls are few examples.
Traditionally, PNSs use micro-electromechanical systems (MEMS) in order to locate the mobile user when GPS signals are blocked. Strap-down inertial navigation system (INS) is one example of PNSs that take advantage of MEMS sensors for the positioning process. However, these systems are no self-contained navigation systems. The reason comes from the positioning error caused by gyroscope and accelerometer resulting in a rapid drift growth in such systems.
Pedestrian Dead Reckoning (PDR), that is used in PNSs integrates embedded Inertial Measurement Units (IMUs) to detect when the user takes footsteps and how the direction changes between footsteps. IMUs nowadays consist of threeaxis accelerometers, gyroscopes, and magnetometers, which are inexpensive and light weight. These small-sized sensors with low power consumption are numerously embedded in most recent generation of mobile devices, such as smart-
978-0-9964527 -4-8©2016 ISIF
phones. These systems use gyroscopes to determine the heading and accelerometers to estimate gait parameters such as the number of steps and step lengths.
For estimating the gait parameters, it is important to detect step occurrences and their length. These gait characteristics depend on individual walking patterns and vary between people. Besides, the same person does not have the same gait in all situations. That is, step length is a time-varying process which depends on the speed and frequency of steps. These are the main challenges of using PDR algorithms.
Various systems and algorithms for PNSs have been introduced in the literature. Comparing them shows that for pedestrian navigation technology, PDR using IMUs has attracted the most interest as it imposes no extra cost and does not rely on additional infrastructure. PNSs can be generally classified based on the location of the installed sensors. The most popular classes are waist-mounted [1], [2], foot-mounted [3], [4] and hand-held [5]-[8] types. Besides the large class of IMU-based systems, there are also other approaches that use other sensors such as e.g. electronic pedometers [9].
Since body-fixed systems, introduced above, require extra devices to be produced and mounted, hand-held devices gain more interest thanks to the rapid development of smartphones. Reference [5] is one example of using a hand-held device for positioning purposes. It uses an empirical model which is based on the accelerometer signal for detecting steps and a back-propagation neural network for step length estimation. In [10], a step determination method based on pattern recognition is proposed.
Another class of methods used in this context are methods that use constant, pre-learned gait parameters. As mentioned before, the step length depends on the user's behavioral and physical characteristics. In order to take this relation into account, a few parameters such as weight and height must be calibrated before starting to measure and performing gait parameter estimation. Different studies on this problem propose constant pre-learned parameters in their models. For example, in [11] a linear relation between the measured frequency of steps and a pre-learned constant parameter is proposed for online step length estimation. In [12], the step frequency and variation of the acceleration is taken into account together with a pre-learned constant parameter.
In this paper, we propose a filtering approach that is able to learn gait parameters of the PDR algorithm, such as the
step detection threshold and step length. Our approach is based on a multi-rate Kalman filter bank that estimates the gait parameters when position measurements are available, which improves PDR in time intervals when the position is unavailable. Moving from outdoor to indoor environments where IPS is not available is one example.
The rest of the paper is organized as follows: In Sec. II, a basic pedestrian odometry model is presented together with an algorithm for step detection. Sec. III then proposes two extended pedestrian odometric models, which are embedded in Sec. IV into a multi-rate KF bank for step detection threshold estimation. Sec. V discusses the dead-reckoning improvements by learning the gait parameters on a couple of real-world experiments, and Sec. VI finally concludes the work.
II. PEDESTRIAN ODOMETRY
In pedestrian navigation systems, the double-integrating strap-down method suffers from an error in the position estimate. This error propagates and increases quadratically with time [13]. Integrating gait parameters could be a solution to this issue. The gait parameters can be utilized in PDR algorithms to improve the performance.
Traditionally, PDR algorithms detect gait parameters, such as number of detected steps and step length, in order to determine the traveled distance. This approach is applied for navigation applications in many studies, e.g. [14], [15]. The basic longitudinal model is given by
(1)
where ds is the total walked distance, s is the step index, L is the step length and ns is noise. Estimating a pedestrian's step length and determining a suitable threshold for step detection from IMU accelerometer measurements is discussed in the rest of this section.
A. Step Detection
The three-axis accelerometer signal contains all the data required to detect the occurrence of a step. The vertical axis, relative to the ground, contains all information corresponding to the step specific peak. However, the orientation of the sensor may cause some disturbances on the vertical signal component. For instance, in the case when the IMU is embedded in hand-held devices such as smartphones. In order to avoid this disturbances, the norm of the total acceleration is used instead of looking only at the vertical acceleration component. Algorithm 1 illustrates the procedure of step detection. In
this algorithm, the variables ax, ay and az denote the tri-axial accelerometer components, respectively. In order to improve the quality of the signal, a Butterworth band-pass filter with a proper cut-off frequency is applied to attenuate all frequencies outside the band-pass.
Defining a suitable threshold h in order to correctly detect steps is one difficulty of PDR algorithms. The threshold needs to be adjusted for different people with different characteristics. In order to make our point clear, we have designed an experiment in which three people with different attributes
Algorithm 1 Step Detection
• Input: Three-axis Accelerometer Signal
1. Compute the norm of the accelerometer signal:
a = J a~ + a~ + a;.
2. Band-pass filter the resulting signal using a fourthorder Butterworth filter with cut-off frequency [0.2,2.75] Hz.
3. If the filtered signal exceeds a defined threshold h, a step is considered detected.
4. Among all sets of accelerations that are larger than the threshold, before the signal again drops below the threshold, the one with the highest value is selected as the step.
• Output: Step detections
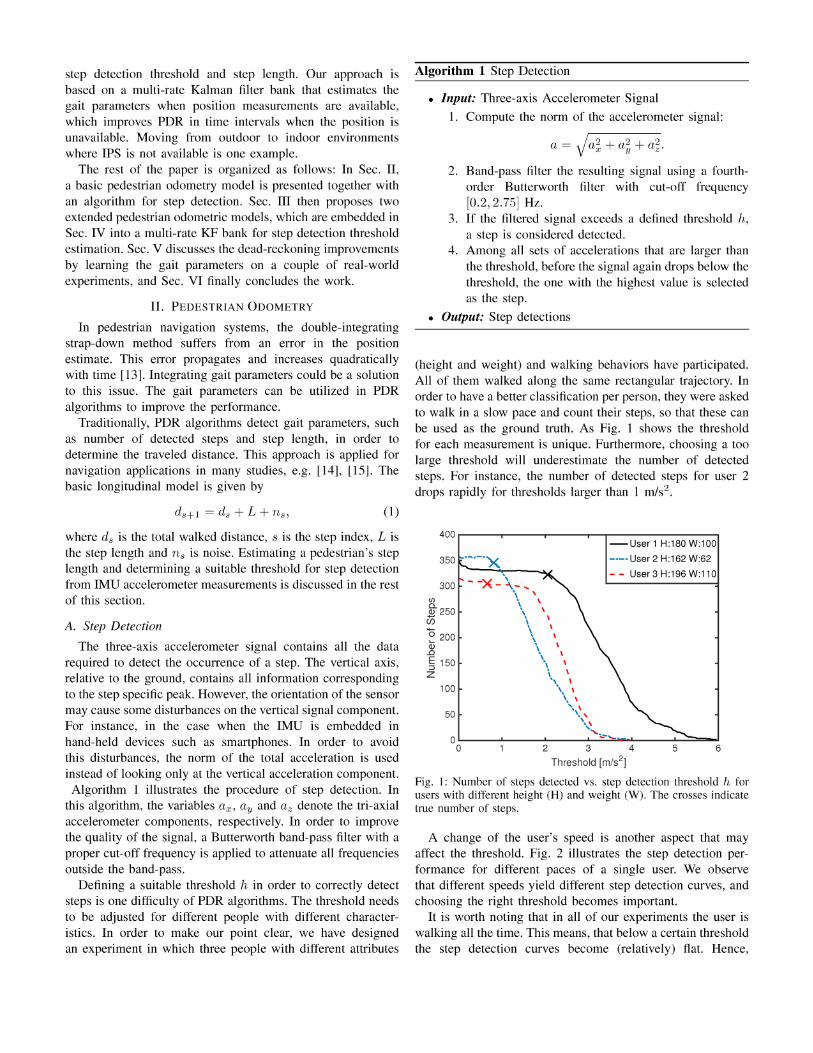
(height and weight) and walking behaviors have participated. All of them walked along the same rectangular trajectory. In order to have a better classification per person, they were asked to walk in a slow pace and count their steps, so that these can be used as the ground truth. As Fig. 1 shows the threshold for each measurement is unique. Furthermore, choosing a too large threshold will underestimate the number of detected steps. For instance, the number of detected steps for user 2 drops rapidly for thresholds larger than 1 m/s2 .
400~----~----~----~-r--------------~
350
300 (j)
g. 250 ii5 '0 200 Q5 .D § 150 Z
100
50
----·x - -X \ - '\ - ...
\ ' \ \ \ \ \ \
\ \ \ \
\\ \
i \ '\ \
'. \
\... \ \\~ ,
-User 1 H :180W:100
---- User 2 H :162 W:62
- - User 3 H:196 W:110
\,' O~----~----~----~'~~~~~~----~-=~-o 234 5 6
Threshold [m/s2 ]
Fig. 1: Number of steps detected vs. step detection threshold h for users with different height (H) and weight (W). The crosses indicate true number of steps.
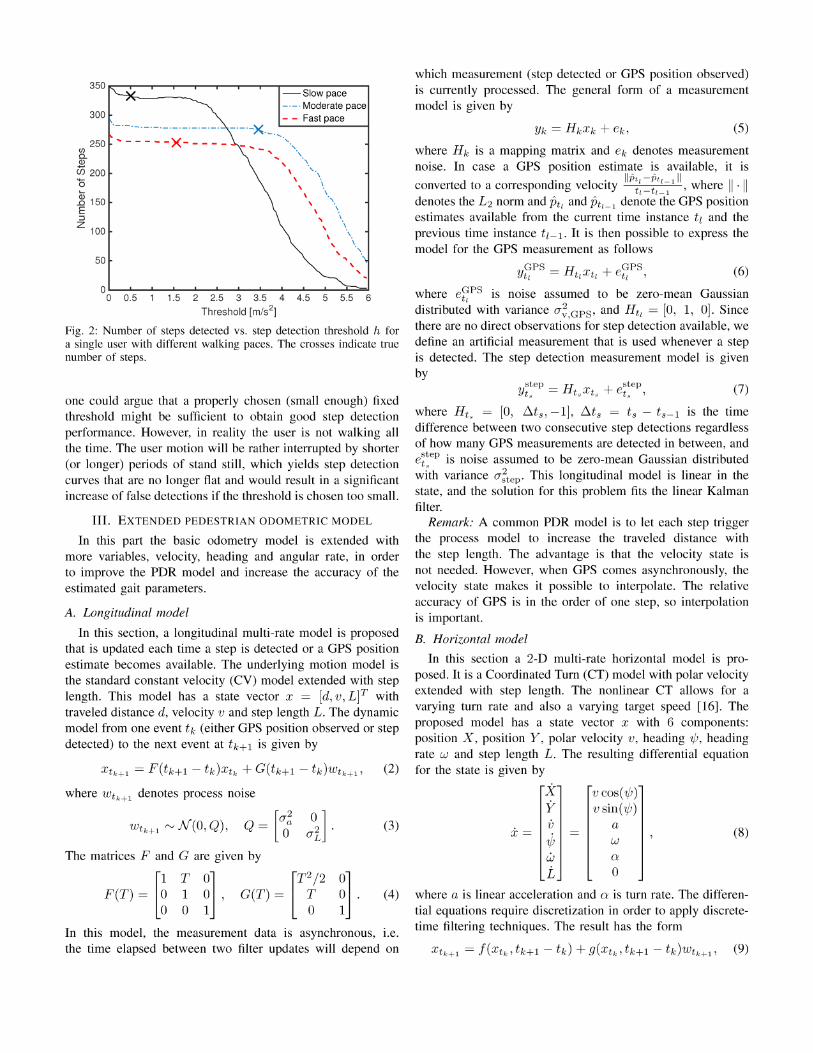
A change of the user's speed is another aspect that may affect the threshold. Fig. 2 illustrates the step detection performance for different paces of a single user. We observe that different speeds yield different step detection curves, and choosing the right threshold becomes important.
It is worth noting that in all of our experiments the user is walking all the time. This means, that below a certain threshold the step detection curves become (relatively) flat. Hence,
300
250 (J) a. Q)
U5 200
11150 E :::l
Z 100
50 ... , , O~~~--~~~--~~~--~~~~ o 0.5 1.5 2 2 .5 3 3.5 4 4.5 5 5 .5 6
Threshold [m/s2]
Fig. 2: Number of steps detected vs. step detection threshold h for a single user with different walking paces. The crosses indicate true number of steps.
one could argue that a properly chosen (small enough) fixed threshold might be sufficient to obtain good step detection performance. However, in reality the user is not walking all the time. The user motion will be rather interrupted by shorter (or longer) periods of stand still, which yields step detection curves that are no longer flat and would result in a significant increase of false detections if the threshold is chosen too small.
III. EXTENDED PEDESTRIAN ODOMETRIC MODEL
In this part the basic odometry model is extended with more variables, velocity, heading and angular rate, in order to improve the PDR model and increase the accuracy of the estimated gait parameters.
A. Longitudinal model
In this section, a longitudinal multi-rate model is proposed that is updated each time a step is detected or a GPS position estimate becomes available. The underlying motion model is the standard constant velocity (CV) model extended with step length. This model has a state vector x = [d, v, LV with traveled distance d, velocity v and step length L. The dynamic model from one event tk (either GPS position observed or step detected) to the next event at tk+ 1 is given by
XtHl = F(tk+1 - tk) Xtk + G(tk+l - tk)Wtk+l' (2)
where Wt H l denotes process noise
Q = [~~ (3)
The matrices F and G are given by
[T2 / 2
G(T) = ~ (4)
In this model, the measurement data is asynchronous, i.e. the time elapsed between two filter updates will depend on
which measurement (step detected or GPS position observed) is currently processed. The general form of a measurement model is given by
(5)
where Hk is a mapping matrix and ek denotes measurement noise. In case a GPS position estimate is available, it is
converted to a corresponding velocity IIP~:=~lt~~ " Il, where 11 · 11
denotes the L2 norm and Ptl and Ptl - l denote the GPS position estimates available from the current time instance tl and the previous time instance tl - I. It is then possible to express the model for the GPS measurement as follows
y~PS = H t/xt/ + e~Ps, (6)
where e~Ps is noise assumed to be zero-mean Gaussian distributed with variance CT~,GPS ' and Htl = [0, I , 0]. Since there are no direct observations for step detection available, we define an artificial measurement that is used whenever a step is detected. The step detection measurement model is given by
(7)
where H t , = [0, /:).t s , - 1], /:).t s = ts - t s-I is the time difference between two consecutive step detections regardless of how many GPS measurements are detected in between, and e~~ep is noise assumed to be zero-mean Gaussian distributed with variance CT;tev This longitudinal model is linear in the state, and the solution for this problem fits the linear Kalman filter.
Remark: A common PDR model is to let each step trigger the process model to increase the traveled distance with the step length. The advantage is that the velocity state is not needed. However, when GPS comes asynchronously, the velocity state makes it possible to interpolate. The relative accuracy of GPS is in the order of one step, so interpolation is important.
B. Horizontal model
In this section a 2-D multi-rate horizontal model is proposed. It is a Coordinated Turn (CT) model with polar velocity extended with step length. The nonlinear CT allows for a varying turn rate and also a varying target speed [16]. The proposed model has a state vector x with 6 components: position X, position Y, polar velocity v, heading 'VJ, heading rate wand step length L. The resulting differential equation for the state is given by
x- v cos( 'VJ ) Y v sin( 'VJ )
x= v a
~ w (8)
W a
t 0
where a is linear acceleration and a is turn rate. The differential equations require discretization in order to apply discretetime filtering techniques. The result has the form
Xt k+l = f( Xt k ' tk+l - tk) + g(Xtk' tk+l - tk)WtH l ' (9)
where Wt k+ l is assumed to be uncorrelated zero-mean Gaussian noise with covariance matrix Q = diag( [a~ , a;, aID. The discretization of (8) yields
f( x, T) =
X + 7;: sin( W2T) cos( 1j; + W2T) Y + 7;: sin( W2T) sin( 1j; + Wi)
v 1j; + wT
w L
(10)
where we have assumed a and a to be zero. The zero-orderhold discretization [17] is applied in order to find g(x, T) which is given by
~2 cos( 1j;) 0 0
~2 sin( 1j;) 0 0
g(x, T) = T 0 0 (11) T 2 0 2 0 0 T 0 0 0 1
For the horizontal model it is assumed that 2-D GPS positions estimates, step detections as well as turn rates from gyroscopes are available as measurements. The model for the GPS position estimates is given by
YGPS = [1 t l 0
o 0 0 0 1 000
0] GPS o Xt l + etl ' (12)
where e~Ps is noise on the GPS position estimates, which is assumed to be zero-mean Gaussian distributed with covariance matrix R G P S = diag( [a;,GPS ' a;,GPsD. The measurement model for the step detections is analogous to the longitudinal model (7) and is given by
step - [0 Yts - o o 0 (13)
The gyroscope measurement model is given by
Ygy ro = w + bgy ro + e gy ro t g z, t g tg t g , (14)
where W z, t g is the yaw rate which is the gyroscope measurement in the horizontal plane, bgyro denotes gyroscope bias, and tg denotes the time instance when gyroscope measurements are available, and e gtyro denotes noise assumed to be
9
zero-mean Gaussian with variance aiyro. The gyroscope bias can be generally compensated for via calibration, yielding a gyroscope measurement model without bias given by
yf: ro = [0 0 0 0 1 O J Xt g + er;ro. (15)
In contrast to the longitudinal model, the horizontal model is nonlinear in the states due to the nonlinear process model. Hence, nonlinear filters have to be used for state estimation, and we will make use of the Extended Kalman filter in our proposed PDR solution which is further detailed in the next section.
IV. PDR WITH GAIT PARAMETER LEARNING
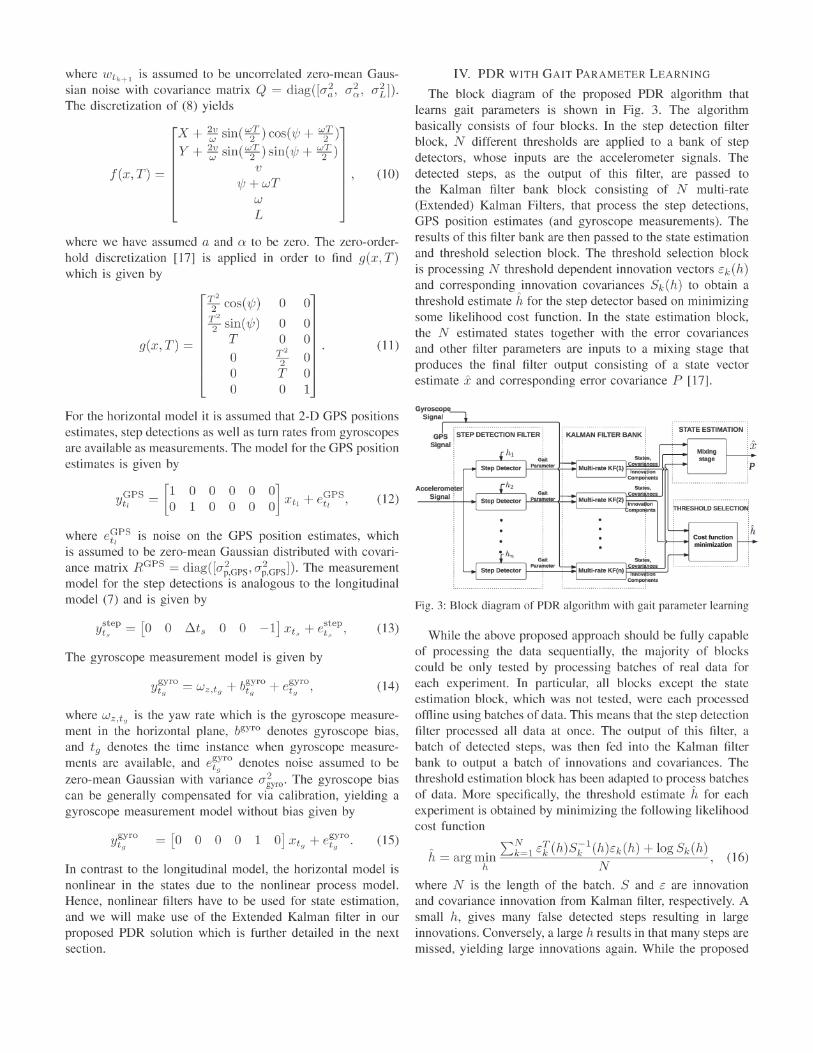
The block diagram of the proposed PDR algorithm that learns gait parameters is shown in Fig. 3. The algorithm basically consists of four blocks. In the step detection filter block, N different thresholds are applied to a bank of step detectors, whose inputs are the accelerometer signals. The detected steps, as the output of this filter, are passed to the Kalman filter bank block consisting of N multi-rate (Extended) Kalman Filters, that process the step detections, GPS position estimates (and gyroscope measurements). The results of this filter bank are then passed to the state estimation and threshold selection block. The threshold selection block is processing N threshold dependent innovation vectors Ek(h) and corresponding innovation covariances Sk(h) to obtain a threshold estimate it for the step detector based on minimizing some likelihood cost function. In the state estimation block, the N estimated states together with the error covariances and other filter parameters are inputs to a mixing stage that produces the final filter output consisting of a state vector estimate x and corresponding error covariance P [17].
Gyroscope
siQnalj-.. _ .... L .... _ .... _ ... _ .... _ .... _ .. .. _ .. .. _ ... _ .... _ .... _ ... --, .......................................... ..
GPS : STEP DETECTION FILTER ~ ~ KALMAN FILTER BANK '
Signal ;
af.tt s~,
f-'P""a<"'~. "''''''+---1 Multi-rate KF(l) ~;:~J:: L--__ --.J Compo~ents
~ L; --r---~I"",""..J ParWnetet" •
SW;S, COVariance!;
I--;-----;-~ Murtl·rate KF{n) nnov: Ion L--__ --.J compo~ents
Fig. 3: Block diagram of PDR algorithm with gait parameter learning
While the above proposed approach should be fully capable of processing the data sequentially, the majority of blocks could be only tested by processing batches of real data for each experiment. In particular, all blocks except the state estimation block, which was not tested, were each processed offline using batches of data. This means that the step detection filter processed all data at once. The output of this filter, a batch of detected steps, was then fed into the Kalman filter bank to output a batch of innovations and covariances. The threshold estimation block has been adapted to process batches of data. More specifically, the threshold estimate it for each experiment is obtained by minimizing the following likelihood cost function
h' . L~=l Er(h)Sk1(h)Ek(h) + log Sk(h) = arg m~n N ' (16)
where N is the length of the batch. Sand E are innovation and covariance innovation from Kalman filter, respectively. A small h, gives many false detected steps resulting in large innovations. Conversely, a large h results in that many steps are missed, yielding large innovations again. While the proposed
0.5.-~-r~--~~~~~~~~--~~-r~-.
0.48
0.46
0.44
-g 0.42 o :§ 0.4 Q)
.0£. :.:J 0.38
0.36
0.34
0.32
---~----------;-;'
i i
i i i
i i i
,~ ; ,,,,,,-
/ /
~ .. -;
;
- Cost function user1
---- Cost function user2
- - Cost function user3 0.3~~-L~--~~~~~~--------------~
o 0.2 0.4 0.6 0.8 1 1.2 1.4 1.6 1.8 2 2.2 2.4 2.6 2.8 3
Threshold [m/s2]
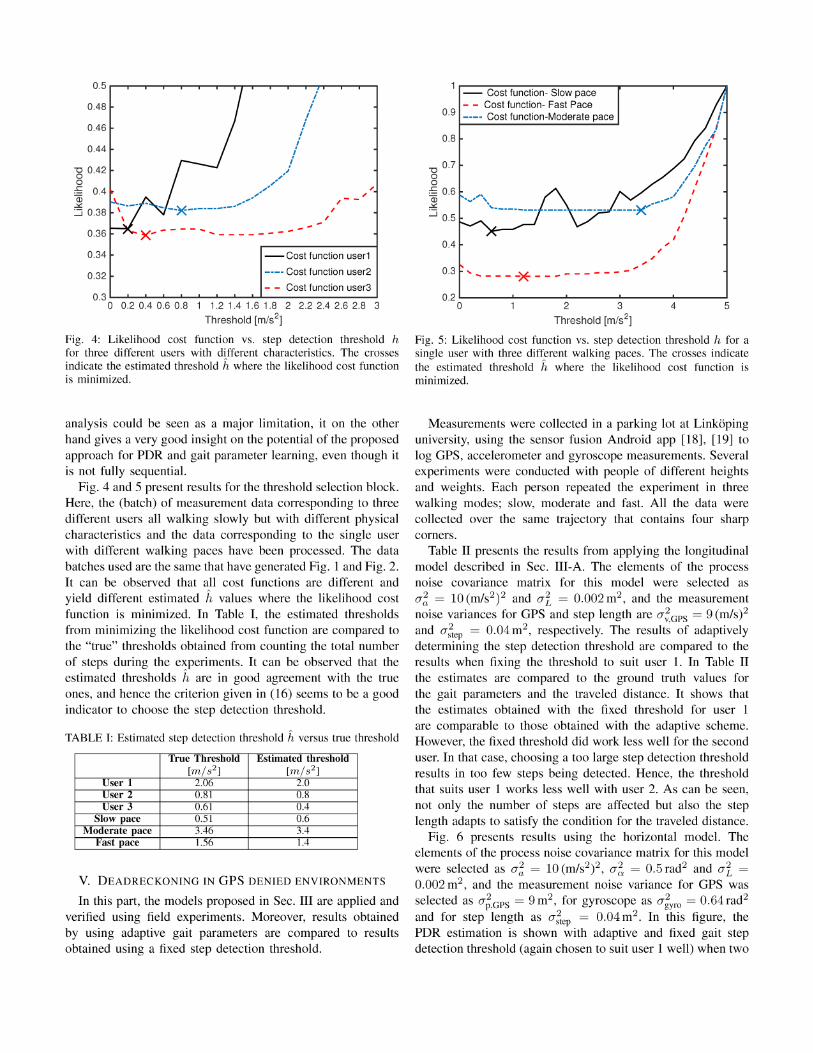
Fig. 4: Likelihood cost function vs. step detection threshold h for three different users with different characteristics. The crosses indicate the estimated threshold h where the likelihood cost function is minimized.
analysis could be seen as a major limitation, it on the other hand gives a very good insight on the potential of the proposed approach for PDR and gait parameter learning, even though it is not fully sequential.
Fig. 4 and 5 present results for the threshold selection block. Here, the (batch) of measurement data corresponding to three different users all walking slowly but with different physical characteristics and the data corresponding to the single user with different walking paces have been processed. The data batches used are the same that have generated Fig. 1 and Fig. 2. It can be observed that all cost functions are different and yield different estimated h values where the likelihood cost function is minimized. In Table I, the estimated thresholds from minimizing the likelihood cost function are compared to the "true" thresholds obtained from counting the total number of steps during the experiments. It can be observed that the estimated thresholds h are in good agreement with the true ones, and hence the criterion given in (16) seems to be a good indicator to choose the step detection threshold.
TABLE I: Estimated step detection threshold h versus true threshold
True Threshold Estimated threshold [m /s2 ] [m /s2 ]
User 1 2.06 2.0 User z 0.81 0.8 User 3 0.61 0.4
Slow pace 0.51 0.6 Moderate pace 3.46 3.4
Fast pace 1.56 1.4
V. DEADRECKONING IN GPS DENIED EN VIRONMENTS
In this part, the models proposed in Sec. III are applied and verified using field experiments. Moreover, results obtained by using adaptive gait parameters are compared to results obtained using a fixed step detection threshold.
- Cost function- Slow pace - - Cost function- Fast Pace
0.9 ____ Cost function-Moderate pace
0.8
"0 0.7 o o :S 0.6
~ :.:J 0.5
0.4
-----X"
0.3 ... _____ ~ ___ .... ___ - -
; i i
./ / 1
/ 1 / 1
/ I / I
/ I _, .. ,-' I
0.2 '---------'-------........ -------''------........ --------' 023
Threshold [m/s2]
Fig. 5: Likelihood cost function vs. step detection threshold h for a single user with three di fferent walking paces. The crosses indicate the estimated threshold h where the likelihood cost function is minimized.
Measurements were collected in a parking lot at Linkoping university, using the sensor fusion Android app [18] , [19] to log GPS, accelerometer and gyroscope measurements. Several experiments were conducted with people of different heights and weights. Each person repeated the experiment in three walking modes; slow, moderate and fast. All the data were collected over the same trajectory that contains four sharp corners.
Table II presents the results from applying the longitudinal model described in Sec. III-A. The elements of the process noise covariance matrix for this model were selected as O'~ = 10 (m/s2)2 and 0'1 = 0.002 m2 , and the measurement noise variances for GPS and step length are O';'GPS = 9 (rn/S)2
and O'~ep = 0.04 m2 , respectively. The results of adaptively determining the step detection threshold are compared to the results when fixing the threshold to suit user l. In Table II the estimates are compared to the ground truth values for the gait parameters and the traveled distance. It shows that the estimates obtained with the fixed threshold for user 1 are comparable to those obtained with the adaptive scheme. However, the fixed threshold did work less well for the second user. In that case, choosing a too large step detection threshold results in too few steps being detected. Hence, the threshold that suits user 1 works less well with user 2. As can be seen, not only the number of steps are affected but also the step length adapts to satisfy the condition for the traveled distance.
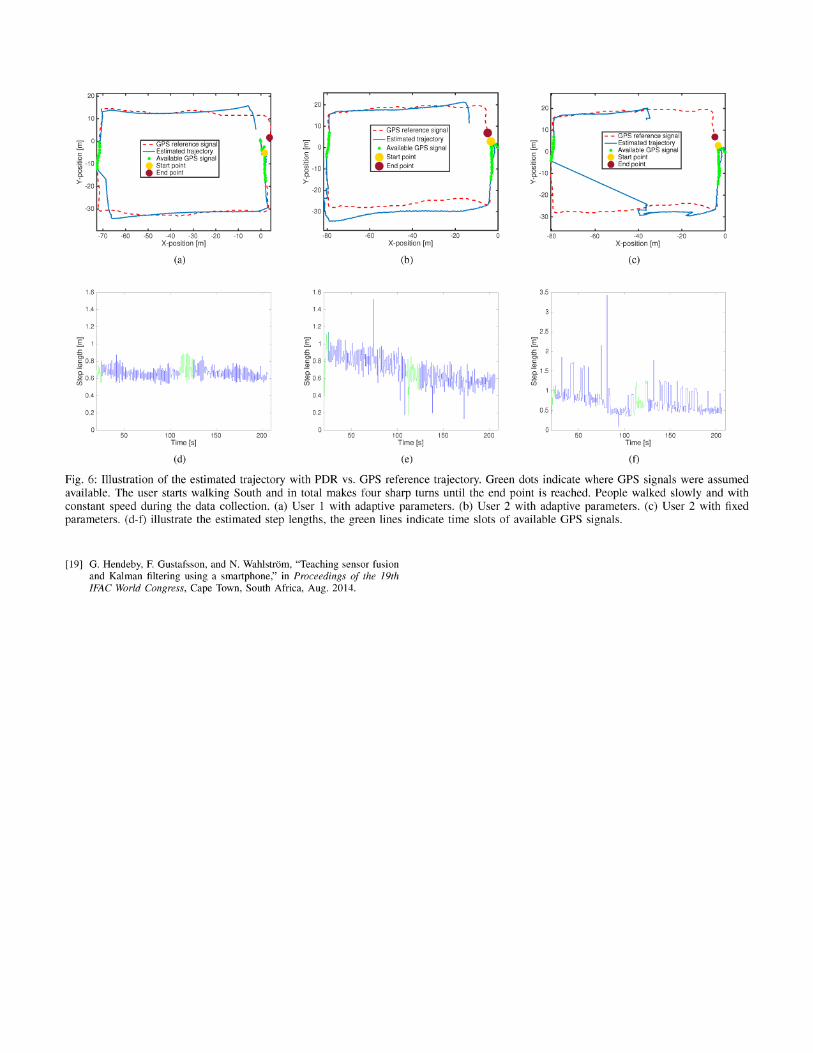
Fig. 6 presents results using the horizontal model. The elements of the process noise covariance matrix for this model were selected as O'~ = 10 (rn/S2)2, 0'; = 0.5 rad2 and 0'1 = 0.002 m2 , and the measurement noise variance for GPS was selected as O'~,GPS = 9 m2 , for gyroscope as O'iyro = 0.64 rad2
and for step length as O'~ep = 0.04 m2 . In this figure, the PDR estimation is shown with adaptive and fixed gait step detection threshold (again chosen to suit user 1 well) when two

TABLE II: Estimated gait parameters and traveled distance versus true one.
Traveled Number Position error at the Threshold
distance Of end point [m/s 2] [m] Steps [m] Ground Truth
248 333 0 2.06 User 1 User 1 with
adaptive 246.1 329 6.9 2 gait parameters
User 1 with fixed 245.2 321 8.6 4
gait parameters Ground Truth
242 346 0 0.81 User 2
User 2 with adaptive 240.1 352 9.8 0.8
gait parameters User 2 with
fixed 227.7 141 32.8 2 gait parameters
users walked slowly. The threshold for step detection has been estimated for Fig. 6a and Fig. 6b. Conversely, in Fig. 6c the fixed threshold is used and applied to the same measurement set as used in Fig. 6b. The GPS signal (green dots) is only assumed available for a few seconds in the beginning and middle of experiments. As can be seen in the figure, using the adaptive step detection threshold provides reasonably good position estimates even during periods without GPS coverage. At the same time, Fig. 6c shows how large influence poorly chosen gait parameters can have on the end result, when compared to adaptively choosing the parameters. It should be noted that in these limited experiments, simply choosing a very low step detection threshold would improve the result. However, we anticipate this not to be the case in more realistic settings with uneven gait and regular stops which motivates the choice of parameters here.
The step lengths estimated with adaptive threshold, Fig. 6e and Fig. 6d, are fairly constant. In this figure green lines indicate availability of the GPS signal, as in the previous case. Fig. 6f shows the negative effect on the step length when the steps are incorrectly detected due to a poor step detection threshold.
VI. CONCLUSION
In this paper we have proposed a filtering approach in order to learn gait parameters in the Pedestrian Dead Reckoning (PDR) algorithm. Our approach is based on a multi-rate Kalman filter bank that estimates the gait parameters, such as step length and step detection threshold. This learning process is performed when GPS measurements are available, which improves the PDR in time intervals when the measurement is unavailable. For instance, indoor position systems are not always available when moving from outdoor to indoor environments.
The proposed method has been evaluated using real experimental IMU measurements with promising results, especially when adaptively choosing the step detection threshold as part
of the algorithm. Additionally, it has been demonstrated that the results deteriorate if a fixed threshold is used that is not appropriately chosen to suit the current user. Given the experimental data provided in this paper a low step detection threshold would probably work satisfactory; however, we anticipate this not to be the case with more variations in the user's walking patterns and with regular stops where a too low threshold would introduce many false step detections. The next step of this study will be to work with more advanced data sets including multi-rate walking and stops.
VII. ACKNOWLEDGMENT
This work is funded by the European Union FP7 Marie Curie training program on Tracking in Complex Sensor Systems (TRAX) with grant number 607400.
R EFERE NCES
[1] J. C. Alvarez, D. Alvarez, A. Lopez, and R. C. Gonzalez, "Pedestrian navigation based on a waist-worn inertial sensor," Sensors, vol. 12, no. 8, pp. 10536-10 549, Jul. 2012.
[2] J. Li , Q. Wang, X. Liu, and M. Zhang, "An autonomous waistmounted pedestrian dead reckoning s ystem by coupling low-cost MEMS inertial sensors and GPS receiver for 3D urban navigation," Journal of Engineering Science and Technology, vol. 7, no. 9, pp. 9- 14, Mar. 2014.
[3] H. J. Luinge and P. Veltink, "Inclination measurement of human movement using a 3-D accelerometer with autocalibration," IEEE Trans. Neural Syst. Rehabil. Eng. , vol. 12, no. 1, pp. 112- 121 , Mar. 2004.
[4] S. Beauregard, "Omnidirectional pedestrian n avigation for first responders." in 4th Workshop on Positioning, Navigation and Communication (WPNC '07), 2007, pp. 33-36.
[5] Y. Liu, Y. Chen, L. Shi, Z. Tian, M. Zhou, and L. Li, "Accelerometer based joint step detection and adaptive step length estimation algorithm using handheld devices," Journal of Communications, vol. 10, no. 7, pp. 520- 525, Jul. 2015.
[6] Z. Tian, Y. Zhang, M. Zhou, and Y. Liu, "Pedestrian dead reckoning for MARG navigation using a s martphone," EURASIP Journal on Advances in Signal Processing, vol. 16, no. 1, pp. 2- 11 , May. 2014.
[7] S. Tomazic and I. Skrjanc, "Fusion of visual odometry and inertial navigation system on a smartphone," ELSEVIER, Computers in Industry, vol. 74, pp. 119- 134, Dec. 2015.
[8] H . Zhang, W. Yuan, Q. Shen, T. Li, and H. Chang, "A h andheld inertial pedestrian navigation system with accurate s tep modes and device poses recognition," IEEE Sensors Journal, vol. 15, no. 3, pp. 1421- 1429, Mar. 2015.
[9] R. Jirawimut, P. Ptasinski , V. Garaj , F. Cecelja, and W. Balachandran, "A method for dead reckoning parameter correction in pedestrian navigation system," IEEE Trans. Instrum. Meas. , vol. 52, pp. 209- 215, Feb. 2003.
[10] J. W. Kim and D. H. Jang, J. J . and Hwang, "A step, stride and heading determination for the pedestrian navigation system," Journal of Global Positioning Systems, vol. 3, no. 1-2, pp. 273- 279, Nov. 2004.
[11] R. Levi and T. Judd, "Dead reckoning navigational system using accelerometer to measure foot impacts," Patent US5 583 776, Dec. 1996.
[12] S. H. Shin, C. G. Park, J. W. Kim, H. S. Hong, and J. M. Lee, "Adaptive step length estimation algorithm using low-cost MEMS inertial sensors." Sensors Applications Symposium (SAS '07). , 2007.
[13] O. Woodman, "An introduction to inertial n avigation," University Of Cambridge, Tech. Rep. 696, Aug. 2007.
[14] V. Renaudin, M. Susi, and G. Lachapelle, "Step length estimation using handheld inertial sensors," IEEE Sensors Journal, vol. 12, pp. 8507-8525, Jun. 2012.
[15] V. Renaudin, V. Demeule, and M. Ortiz, "Adaptative pedestrian displacement estimation with a smartphone." International Conference on Indoor Positioning and Indoor Navigation (!PIN), 2013.
[16] X. Rong Li and V. P. Jilkov, "Survey of maneuvering target tracking. part i. dynamic models," IEEE Trans. Aerosp. Electron. Syst., vol. 39, pp. 1333-1364, Oct. 2003.
[17] F. Gustafsson, Statistical Sensor Fusion. Studentlitteratur, 2010. [18] Linkoping University, Sweden. (2014, Dec.) Sensor fusion app.
[Online]. Available: https://goo.gI/OqNyU
10
I 0
" o ~ -10
8. >- -20
..... _--- - ..
- - GPS reference signal - Estimated trajectory
• Available GPS signal Start point
• End po int
-70 -60 -50 -40 -30 -20 -10 X-position (ml
(a)
1.6 ,----~---~----~---_r_,
1.4
1.2
0.4
0.2
50 100 150 200 Time (sl
(d)
20
10
I 0
" g .~ -10 Q.
>--20 I
- - GPS reference signal - Estimated trajectory
• Available GPS signal Start point
• End poinl
,----------_ ... ---30~
-80 -60 -40 X-position (ml
(b)
-20
1.6 ,----~---~----~---_r_,
1.4
1.2
50 100 150 200 Time (sl
(e)
20
10
~ 0 g .;;; 8. -10
>--20
-30
-80 -60 -40 X-posilion (ml
(c)
-20
I •
3.5 ,----~--,---~----~---_r_,
2.5
I .<= 2 g> ., a. 1.5 2 (/)
50 150 200
(f)
Fig. 6: Illustration of the estimated trajectory with PDR vs_ GPS reference trajectory_ Green dots indicate where GPS signals were assumed available. The user starts walking South and in total makes four sharp turns until the end point is reached. People walked slowly and with constant speed during the data collection. (a) User 1 with adaptive parameters. (b) User 2 with adaptive parameters. (c) User 2 with fixed parameters. (d-f) illustrate the estimated step lengths, the green lines indicate time slots of available GPS signals.
[19] G_ Hendeby, E Gustafsson, and N. Wahlstrom, "Teaching sensor fusion and Kalman filtering using a smartphone," in Proceedings of the 19th IFAC World Congress, Cape Town, South Africa, Aug. 2014.