improved brain mri indices in the acute brain stem infarct sites
TRANSCRIPT

CASE REPORT Open Access
Improved brain MRI indices in the acute brainstem infarct sites treated with hydroxyl radicalscavengers, Edaravone and hydrogen, ascompared to Edaravone alone. A non-controlledstudyHirohisa Ono1*†, Yoji Nishijima1†, Naoto Adachi1†, Shigekuni Tachibana1†, Shiroh Chitoku1†, Shigeo Mukaihara1†,Masaki Sakamoto1†, Yohei Kudo1†, Jun Nakazawa1†, Kumi Kaneko1† and Hiroshi Nawashiro2†
Abstract
Background: In acute stage of cerebral infarction, MRI indices (rDWI & rADC) deteriorate during the first 3-7 daysafter the ictus and then gradually normalize in approximately 10 days (pseudonormalization time), although thetissue is already infarcted. Since effective treatments improve these indices significantly and in less than the naturalpseudonormalization time, a combined analysis of these changes provides an opportunity for objective evaluationon the effectiveness of various treatments for cerebral infarction. Hydroxyl radicals are highly destructive to thetissue and aggravate cerebral infarction. We treated brainstem infarction patients in acute stage with hydroxylradical scavengers (Edaravone and hydrogen) by intravenous administration and evaluated the effects of thetreatment by a serial observation and analysis of these MRI indices. The effects of the treatment were evaluatedand compared in two groups, an Edaravone alone group and a combined group with Edaravone and hydrogen, inorder to assess beneficial effects of addition of hydrogen.
Methods: The patients were divided in Edaravone only group (E group. 26 patients) and combined treatmentgroup with Edaravone and hydrogen enriched saline (EH group. 8 patients). The extent of the initial hump of rDWI,the initial dip of rADC and pseudo-normalization time were determined in each patient serially and averages ofthese data were compared in these two groups and also with the natural course in the literatures.
Results: The initial hump of rDWI reached 2.0 in the E group which was better than 2.5 of the natural course butwas not as good as 1.5 of the EH group. The initial dip of rADC was 0.6 in the E group which was close to thenatural course but worse than 0.8 of the EH group. Pseudonormalization time of rDWI and rADC was 9 days onlyin EH group but longer in other groups. Addition of hydrogen caused no side effects.
Conclusions: Administration of hydroxyl radical scavengers in acute stage of brainstem infarction improved MRIindices against the natural course. The effects were more obvious and significant in the EH group. These findingsmay imply the need for more frequent daily administration of hydroxyl scavenger, or possible additional hydrogeneffects on scavenger mechanisms.
* Correspondence: [email protected]† Contributed equally1Department of Neurosurgery, Nishijima Hospital, Oooka, Numazu City,Sizuoka, 410-0022, JapanFull list of author information is available at the end of the article
Ono et al. Medical Gas Research 2011, 1:12http://www.medicalgasresearch.com/content/1/1/12 MEDICAL GAS
RESEARCH
© 2011 Ono et al; licensee BioMed Central Ltd. This is an Open Access article distributed under the terms of the Creative CommonsAttribution License (http://creativecommons.org/licenses/by/2.0), which permits unrestricted use, distribution, and reproduction inany medium, provided the original work is properly cited.

BackgroundClinical care of cerebral infarction patients begins withvisual evaluation of MRI (magnetic resonance image). Itis well known now that the diffusion based MRIsequences can detect the abnormality within minutesafter the onset of severe ischemia in the brain tissue.However, the differences in the MRI scan machinery,display software and filing methods may make the visualinterpretation of the MRI images sometimes inconsis-tent. The diffusion data are more useful when presentedas a comparison to those in the identical area of theother side of the brain, because in this way, all the hard-ware related inconsistency can be removed. The com-parison utilizes a ratio of the MRI data, particularly thedata capable of determining the degree of water mole-cule diffusion in the tissue such as DWI (DiffusionWeighted Image) and ADC (Apparent Diffusion Coeffi-cient). The ratio is calculated by dividing the data in thepathological side by those in the normal side and desig-nated as rDWI (relative DWI) and rADC (relative ADC).The cells in severely ischemic brain tissue swell due to
accumulation of water and electrolytes in the cells,immediately after the Na pump fails. The swellingreduces the extracellular space where the free motion ofwater molecules was a major source of the tissue diffu-sion. Thus, MRI indices (rADC and rDWI) deterioratewithin minutes after the Na pump failure and continueto get worse for the first 3 to 5 days in the infarctedbrain tissue [1], unless recanalization or restoration ofblood flow occurs [2]. The deterioration of the indices ischaracterized by the initial rDWI increase (initial hump)up to 2.5 or higher and the initial rADC decrease (initialdip) down to 0.6 or below [3], reaching to a lowest valueon Day3 [4]. Then, both indices gradually return toclose to a normal level or 1.0, despite of the fact thatthe tissue is already infarcted (pseudonormalization) in10 to 11 days (pseudo normalization time) after theischemic ictus in the white matter [4]. After the pseudo-normalization, rADC continues to increase (late hike)for many months [5,6]. However, recanalization treat-ment alters this natural course dramatically and thehump and the dip of diffusion related MRI indices maynot appear at all and the pseudonormalization timeshortens significantly down to 24 hrs or less after thetreatment [7,8], only when the recanalization success-fully restores the blood flow in the area. Although reca-nalization treatment such as with tPA (tissueplasminogen activator) is the most potent treatment ofall for acute cerebral infarction, the treatment needs tobe started within 3 hrs after the onset of the symptomsand has to satisfy rigid criteria. Therefore, except forfew lucky tPA treated patients, the majority of the acutecerebral infarct patients are currently treated withdiverse medications, including scavengers of reactive
oxygen species (ROS). The ROS aggravate the ischemictissue by a self-propagating chain reaction of deprivinganother electron from near-by molecules. In Japan,Edaravone (3-methyl-1-phenyl-2-pyrazolin-5-one) [9] isthe only medication approved since 2001 for the use inacute stage of cerebral infarction patients as a scavengerof hydroxyl radicals and a neuroprotectant [10].However, in our preliminary study, the treatment of
acute cerebral infarction with Edaravone improved theinitial hump and the initial dip of the MRI indices onlyslightly and it shortened the pseudo normalization timebut rather mildly. Edaravone is known to have a rathershort t1/2 beta, or elimination half life of the drug level,particularly in elderly patients who occupy a majority ofcerebral infarction population. In addition, Cmax, ormaximum drug concentration in the blood, of the Edar-avone, with currently approved intravenous administra-tion of 30 mg remains at about 1/10 level of a standard1-10 micromole concentration used in many in vitroexperiments. In addition, because of possible side effects,Edaravone may not be given to the patients who havecompromised liver or kidney function and also notmore than twice a day according to the governmentalapproval. On the other hand, molecular hydrogen,which is well known to have potent scavenger actionsagainst hydroxyl radicals and related harmful oxidation[11] had no risk of complications in our preliminarystudy even on the patients who had already establishedkidney or liver disease. Our current study was designedto supplement possible low and short blood level ofEdaravone with hydrogen for the treatment of acute cer-ebral infarction. The effects of the supplementing withhydrogen were evaluated by comparing the results ofthe treatment in a group treated with Edaravone only (Egroup) and in a combined Edaravone and hydrogengroup (EH group) and also against the natural coursepublished in the literatures [1-6]. Since subtle neurologi-cal changes after cerebral infarction during the acutestage are sometimes difficult to substantiate, a totallyobjective method using MRI indices, rADC and rDWI,was adopted for the evaluation. These indices were cal-culated at the infarction sites of the patients serially andaveraged and compared daily in the two groups. In addi-tion, regular neurological evaluation of the patients wasdone mainly with NIHSS (NIH stroke score).
MethodsPatientsConsecutive 34 patients who were diagnosed as havingcerebral infarction of BAD type (branch atheromatousdisease) in the brainstem were enrolled in the study.All of these patients lived in the local area of our hos-pital and were brought in within 4 to 24 hours afterthe onset of the symptoms. The first 26 patients were
Ono et al. Medical Gas Research 2011, 1:12http://www.medicalgasresearch.com/content/1/1/12
Page 2 of 9

treated with Edaravone alone (E group) and the follow-ing 8 patients received hydrogen-rich intravenous fluidin addition to Edaravone (EH group). For the EHgroup of 8 patients, intravenous Edaravone (30 mgEdaravone Kit) was given at 6 AM and 6 PM as a reg-ular schedule and hydrogen-rich intravenous solutionswere added at 10 AM and 4 PM. These treatmentslasted for 7 days. Neurological status was recordedessentially with NIHSS and compared at the time ofadmission and discharge from the hospital. The neuro-logical evaluation was based upon the NIHSS methodand was equally performed in the two groups. Sincethe dramatic and substantial improvements in clinicalconditions and MRI indices after recanalization mayoverwhelm any effects of other medications, only thosepatients who were diagnosed as stroke due to branchatheromatous disease (BAD), which is a non-recanali-zation type cerebral infarction, in the brainstem wererecruited. BAD involves perforating arteries particularlyat lateral striate artery (LSA) region or at parapontineartery (PPA) region and is known as a type of progres-sive stroke [12] also.The informed consent in a form approved by the
Nishijima Hospital Ethics Committee was obtained fromall the patients before the treatment or from their legalguardians when the patients could not sign the consent,by the time of initiation of the treatment.
Production of hydrogen-rich intravenous fluidRegular intravenous fluid bags were immersed, withoutopening the bag and without adding any alteration onthe bag, in a hydrogen water tank which is capable ofproducing hydrogen-rich water up to 1.6 ppm concen-tration (Miz.Co, Fujisawa, Japan, Patent No.4486157,Patent Gazette of Japan 2010). The hydrogen concentra-tion increased in the bag by diffusion through the totallyintact wall of the plastic bag to more than 250 micro-mole/L and to saturation, depending upon the durationof the immersion and temperature. A saline bag of 250ml size (Terumo Co. Tokyo, Japan) and a maltose solu-tion bag of 200 ml size (Airomu Co. Atsugi, Japan) werechosen according to the highest diffusibility of the bagwall we could find.
MRI analysisMRI signal intensities in DWI and ADC of each infarc-tion site were observed first and then, serial changes ofthese images were compared in the E group and the EHgroup. The DWI and ADC signal intensities were alsocompared with those in the exactly same area of theother side of the brain and the ratio was calculated asrDWI (relative DWI) and rADC (relative ADC).Averages of these indices were compared in the twogroups and also with the previous publications by using
the data in the literature [3] for a statistical significance.A special attention was paid for the determination ofabnormal area. Firstly, all of the MRI images of thepatient were reviewed and the largest area of theabnormality was chosen to be the site and size of thelesion for the calculation and the pixel size of the areawere recorded. Then, the area was copied on a transpar-ent film together with surrounding recognizable struc-tures as a template, which was used for calculation ofthe remainder of MRIs. This is to prepare, in case ofsize changes of the abnormality or even disappearanceof the abnormality, to calculate the indices exactly inthe same area and in a same manner. If an ADC mapwas not distinct enough by the naked eye, then theDWI template was used to define the area of abnormal-ity. The MRI scan was taken on the day of admission(Day1) and follow-up MRIs were scheduled to be takenevery other day but this could not be accomplished inevery patient when other tests such as patient’s vascularevaluation or cardiopulmonary function test werethought to be more urgent.The study was approved by Nishijima Hospital Ethics
Committee and the production of hydrogen rich IVfluid as “Hospital Preparation” and its clinical use inNishijima Hospital, were conducted upon the advicefrom Nishijima Hospital Pharmacists Council and Japa-nese Welfare-Labour Administration (Tokai-HokurikuDistrict Bureau) and Sizuoka Prefectural Administration(Pharmaceutical Affair, Regulatory Audit Section).
ResultsMRI images (DWI and ADC) of infarction areas andcomparison of the images in the E group (treated withEdaravone only, Figure 1 upper) and the EH group(treated with a combination of Edaravone and hydrogen,Figure 1 lower)The results were firstly evaluated by MRI images (DWIand ADC) without indices (Figure 1). The DWI imagesgenerally showed increased signal intensity (appearedwith more whiteness) at the infarction sites in bothgroups. The ADC images, on the other hand, showeddecreased signal intensity (appeared with more black-ness) at the lesion sites, which were rather difficult tosee as compared to the lesions in DWI images. Thesesignal intensities of the lesions in the E group and theEH group differed obviously in many cases but in somecases, the differences were rather subtle when comparedby single images and by the naked eye. However, whenthese single images were arranged serially, the differ-ences between the two groups became more apparentand the initial hump, the initial dip and the pseudonor-malization time could be assessed even without theindices, after getting used to the visual evaluation. In theE group, the DWI signal intensities increased from Day3
Ono et al. Medical Gas Research 2011, 1:12http://www.medicalgasresearch.com/content/1/1/12
Page 3 of 9

Figure 1 Serial MRI changes in the upper brain stem lesion slices (1st & 3rd row) and lower brain stem lesion slices (2nd and 4th row)of DWI (1st & 2nd row) and ADC (3rd & 4th row) images. upper. Serial MRI of a representative patient in E group on Day 1, 3, 6 (leftto right). The lesion involved two adjacent slices at the upper (1st row) and lower (2nd row) brain stem. The DWI signal intensity (whiteness) ofthe upper slice increased on Day3 (presence of the initial hump), but remained almost unchanged on Day 1,3& 6 in the lower slice (2nd row) bythe naked eye. The reduced ADC signal intensity (blackness) of the same lesion was seen even on Day6, particularly in the lower lesion slice (4throw). lower. Serial MRI of a representative patient in EH group on Day1, 2, 7, 9 (left to right). The lesions also involved two adjacentslices. The DWI signal intensity of the upper slice (1st row) was seen on Day1 but was invisible on the Day2 &7 (absence of the initial hump).The initial hump was seen only in the anterior part of the lower lesion slice (2nd row) but not in the posterior-lateral extension of the lesiontowards the cerebellum which had disappeared on Day2 & 7(absence of the initial hump). The ADC signal was clearly darker in the lowerbrainstem lesion (4th row) on Day 2 but disappearing on Day7 and became grey colour on Day9 (shortened pseudonormalization time and latehike, 4th row, right end).
Ono et al. Medical Gas Research 2011, 1:12http://www.medicalgasresearch.com/content/1/1/12
Page 4 of 9

to Day7 in most cases (Figure 1 upper, 1st row) and thechange was confirmed to be the initial hump by therDWI. However, in the EH group, the increase was sig-nificantly less and in some cases, no increase was seenat all (absence of the initial hump, Figure 1 lower, 1strow). In addition, in the E group, the increase lastedlonger than 9 days, which was regarded as the lack ofshortening of the pseudonormalization time (Figure 1upper, 2nd row) and this was also confirmed by indices.In the EH group, however, the increase returned to anormal level by Day 9 in many cases (the shortenedpseudonormalization time, Figure 1 lower, 1st and 2ndrow).The ADC images when observed in a serial manner
also showed substantial differences between the E groupand the EH group. The degree of reduction of the ADCsignal intensities at the lesion sites was less in EH group(Figure 1 lower, 3rd and 4th row) and then, increased tothe normal level within Day9, which qualified for theshortening of the pseudonormalization time. On thecontrary, in the E group, the ADC image at the lesionsite was darker and lasted longer without returning to anormal level within 9 days (lack of shortening of thepseudonormalization time, Figure 1 upper, 3rd and 4throw). The dark ADC intensity at the lesion site becamegreyish in colour after 9 days in the EH group and thewhiteness gradually increased further (late hike) after-wards. In many lesions where the differences were notobvious by the naked eye, the evaluation by the indicesstill demonstrated significant differences. For an exam-ple, in the upper brain stem lesion of the E group (Fig-ure 1 upper, 1st row), the initial hump was not tooobvious by the naked eye but the indices (rDWI) wereabove the normal level of 1.20 on Day3 and Day5 (1.54and 1.30, respectively), indicating the presence of theinitial hump. Since ADC images are more difficult toevaluate by the naked eye, the lack of the pseudonorma-lization of the lesions such as in the Figure 1 upper, 3rdand 4th row could only be evaluated by the indices(rADC), which, at these lesions, had changed from 0.48to 0.31 to 065 (3rd row) and 0.79 to 0.39 to 0.82 (4throw) on Day1, Day3 and Day6, respectively. All of theseindices were below the normal level of 0.9 and remaineddepressed longer than Day10 and therefore the changeswere regarded as showing the lack of the pseudonorma-lization (or failure of shortening of the pseudonormali-zation time). On the other hand, the presence ofshortened pseudonormalization time in the EH groupwas shown by the both indices as in Figure 1 lowerlesions. The lesions showed the initial hump of rDWI(2nd row, 2.03) and the initial dip of rADC (4th row,0.54) on Day2 but these data improved to 1.14 (rDWI,as compared to the normal value of less than 1.2) andto 2.50 (rADC, as compared to the normal value of
more than 0.9), by the Day9 (therefore, the shortenedpseudonormalization time and late hike).
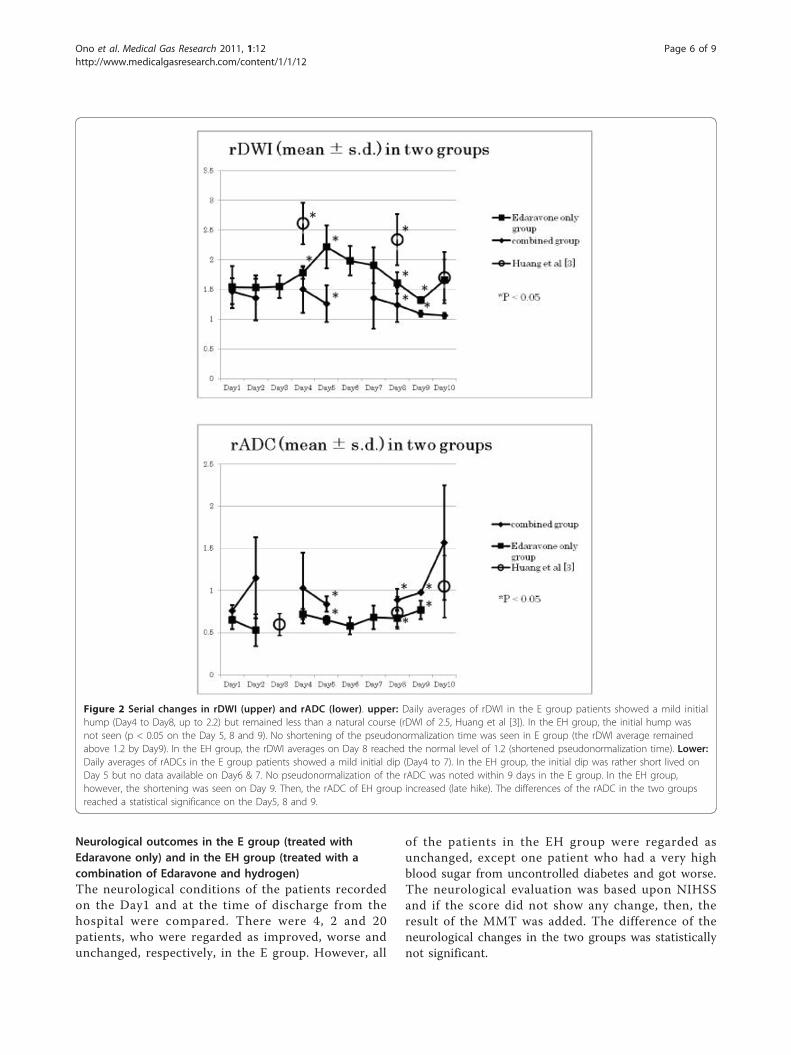
Serial rDWI averages in the E group (treated withEdaravone only) and in the EH group (treated with acombination of Edaravone and hydrogen (Figure 2 upper)Daily averages of rDWI in the E group patients showeda definite initial hump (above 1.2) between Day4 andDay8. However, the highest rDWI averages of the Egroup remained at 2.1 levels and did not deteriorate ashigh as 2.5, as in the natural course [3] and the differ-ence was statistically significant on Day4 (Figure 2upper). On the other hand, the initial hump was notseen in the EH group and the difference was significant(p < 0.05) on the Day5, 8 and 9 (absence of the initialhump). The rDWI averages of the E group did not fallbelow a normal level of 1.2 by Day10 and thus failed toshorten the pseudonormalization time. However, in theEH group, the rDWI averages on Day8 and Day9reached 1.2 or less and thus qualified for the shorteningof the pseudonormalization time. These findings indi-cate that the treatment in the E group did not abolishthe initial hump and did not shorten the pseudonorma-lization. However, both conditions were accomplished inthe EH group and in this sense, although the differencesmay appear rather minuscule, the results of the treat-ment in EH group was superior to those of the E group,when evaluated by the rDWI. The degree of the initialhump of the E group was significantly less and betterthan that of the natural course, however.
Serial rADC averages in the E group (treated withEdaravone only) and in the EH group (treated with acombination of Edaravone and hydrogen) (Figure 2 lower)Daily averages of rADCs in the E group patients showedthe initial dip on the Day4 and Day5. In the EH group,however, the initial dip appeared to be delayed andrather short lived on the Day5 and possibly on the Day6or Day7 but no data available during this period. Thesepatients were usually scheduled for MRA (MRI angio-gram) of the cervical carotid artery on the Day3 andother cardiopulmonary studies on Day6 or Day7 and thelack of the MRI data on these hospital days made it dif-ficult to assert the duration of the short lived initial dip.Definite pseudonormalization of the rADC was notnoted within 10 days in the E group while in the EHgroup, the shortening of the pseudonormalization timewas seen on Day9. The rADC of the EH groupincreased gradually afterwards (late hike). The differenceof the daily averages between the E group and the EHgroup reached a statistical significance on the Day5, 8and 9. The results of the treatment in EH group were,therefore, superior to those of E group when evaluatedby the rADC also.
Ono et al. Medical Gas Research 2011, 1:12http://www.medicalgasresearch.com/content/1/1/12
Page 5 of 9
Neurological outcomes in the E group (treated withEdaravone only) and in the EH group (treated with acombination of Edaravone and hydrogen)The neurological conditions of the patients recordedon the Day1 and at the time of discharge from thehospital were compared. There were 4, 2 and 20patients, who were regarded as improved, worse andunchanged, respectively, in the E group. However, all
of the patients in the EH group were regarded asunchanged, except one patient who had a very highblood sugar from uncontrolled diabetes and got worse.The neurological evaluation was based upon NIHSSand if the score did not show any change, then, theresult of the MMT was added. The difference of theneurological changes in the two groups was statisticallynot significant.
Figure 2 Serial changes in rDWI (upper) and rADC (lower). upper: Daily averages of rDWI in the E group patients showed a mild initialhump (Day4 to Day8, up to 2.2) but remained less than a natural course (rDWI of 2.5, Huang et al [3]). In the EH group, the initial hump wasnot seen (p < 0.05 on the Day 5, 8 and 9). No shortening of the pseudonormalization time was seen in E group (the rDWI average remainedabove 1.2 by Day9). In the EH group, the rDWI averages on Day 8 reached the normal level of 1.2 (shortened pseudonormalization time). Lower:Daily averages of rADCs in the E group patients showed a mild initial dip (Day4 to 7). In the EH group, the initial dip was rather short lived onDay 5 but no data available on Day6 & 7. No pseudonormalization of the rADC was noted within 9 days in the E group. In the EH group,however, the shortening was seen on Day 9. Then, the rADC of EH group increased (late hike). The differences of the rADC in the two groupsreached a statistical significance on the Day5, 8 and 9.
Ono et al. Medical Gas Research 2011, 1:12http://www.medicalgasresearch.com/content/1/1/12
Page 6 of 9

DiscussionMRI analysisSince MRI scan is an essential part of the diagnosis of thecerebral infarction patients, the effects of the infarctiontreatment have frequently been evaluated by the MRI scanalso. Previous publications utilized the area of DWIabnormality as an equivalent to the size of infarction.However, it is now well known that areas of the DWIabnormality are consisted of heterogeneous tissues and allof the area of DWI abnormalities may not progress toinfarction. The increase in the size and density of the DWIabnormality may not reflect worsening and/or expansionof the infarction because the DWI data include T2sequence of the MRI. Therefore, the increase may simplyreflect the increase in water content of the area from vaso-genic edema or from proliferated primitive and leaky neo-vasculature and the phenomena are inclusively called “T2shine through” [13]. Therefore, if the effects of the treat-ment were analyzed only by the increase or decrease ofthe size and density of the DWI abnormality, the analysismay falsely conclude the treatment to be ineffective oreffective, respectively. The ADC is not influenced by theT2 change and more valuable than DWI. However, sincethe ischemic tissue abnormality reduces the ADC data andthis makes the area of the ADC abnormality very difficultto discern from the surrounding tissue. Therefore, theanalysis of the effects of the treatment based upon the sizeof the DWI/ADC abnormality was thought to be inap-propriate and we adopted the current technique. Thetechnique is to calculate the average number of DWI/ADC raw data within the identical area of the brain withinthe recorded pixel size in all the MRI images obtainedduring the hospitalization by using a specific templatemade for each patient. This appeared to have accom-plished the calculation in exactly same area of the samesize in a consistent manner. This technique has been uti-lized in pharmacological evaluation of medications in theischemic brain in the past but mainly in the animal experi-ments, probably due to difficulty in obtaining frequentMRI scans in clinical settings.Our study included only brainstem infarction cases
because of ease of defining the perimeter of the lesionfor the calculation. The brainstem infarctions are usuallyround or oval in shape and small and very discrete fromthe surrounding tissue. In addition, the tissue is mainlyconsisted of white matter and devoid of CSF space. TheMRI indices are influenced by the heterogeneity of thetissue [4] and particularly by the presence of CSF spacein the tissue as in the cerebral cortical lesions.
Neurological evaluation of brainstem infarction patientswith NIHSSAll of the patients in the EH group were regarded asneurologically unchanged except one patient after the
combined treatment with Edaravone and hydrogen,based upon the NIHSS. However, all of these patients inthe EH group except one were satisfied with significantimprovement of their preadmission symptoms by thetime of discharge from the hospital. NIHSS is the mostreliable and most accepted neurological scoring systemfor stroke patients which is calculated and recordedafter performing well described and rather simple neu-rological examinations. However, these examinations areheavily weighted for the evaluation of anterior circula-tion stroke. Major symptoms of our brainstem strokepatients were due to posterior circulation abnormalityand included dizzy sensation, vertigo without nystagmus,vague and subjective paresthesia of one side of the bodywith normal touch sensation, difficulty in walking fromsome swaying and staggering sensation but with normalknee to heel tests, normal diadochokinesis and normalmuscle strength, in addition to some sensation of swal-lowing difficulty with normal gag reflex etc. None ofthese symptoms are calculable by NIHSS and therefore,the patient’s satisfaction in the EH group was notreflected as improvement in the NIHSS.
Effects of hydroxyl radical scavengers, Edaravone andhydrogen on cerebral infarctionThe beneficial effects of Edaravone in the treatment ofcerebral infarction have been well established [14]. Edar-avone is known for its unique property with both waterand lipid solubility and has potent scavenger actionagainst hydroxyl and peroxynitrite radicals and ROS[15]. It acts also in reducing the brain edema of theischemic brain tissue by protecting endothelial cellsfrom ROS and by keeping integrity of the blood brainbarrier and also by reducing the inflammatory responsesin the ischemic area of the brain [16]. Initially, Edara-vone was thought to be a simple quencher of the radi-cals but later many neuroprotective properties werefound [17,18], and effectiveness in many organs andmany disease conditions are added [19,20]. Currently, itis recognized as a most effective scavenger of radicalsand also neuroprotective agents in Japanese neurosurgi-cal community but additional clinical studies were dis-cussed in the U.S.A [21].Hydrogen is also known as a potent scavenger of the
hydroxyl and peroxynitrite radicals and does not affectNO production which is advantageous to the ischemicbrain tissue. The investigational and clinical interestshave been promulgated recently by epochal articles [11]and a review [22]. Direct actions of hydrogen on extra-cellular and intracellular hydroxyl radical provide pro-tection of mitochondria and nuclear DNA but hydrogendoes not harm other cellular elements which relate tosignal transduction. When hydrogen was given duringreperfusion in an animal ischemic brain model, it
Ono et al. Medical Gas Research 2011, 1:12http://www.medicalgasresearch.com/content/1/1/12
Page 7 of 9

protected ischemia-reperfusion injury of the brain,although only when hydrogen was given during thereperfusion but not during the ischemic period. However,these effects were actually better than those of Edaravoneand FK506 combination [11]. Since FK506 alone isknown to decrease the ischemic brain size, it is remark-able that hydrogen superseded the effects of the combi-nation. In addition, hydrogen demonstrated extendedeffectiveness in many other organs and in various situa-tions such as in diabetes[23], intestinal grafts[24], tumorgrowth inhibition [25], allograft nephropathy[26], cardiacischemia/reperfusion[27], sepsis [28], liver injury [29],haemodialysis[30], spinal cord injury[31], an animalmodel of Parkinson’s disease[32] and Alzheimer’s disease[33], in addition to health promotion [34]. Therefore,there is nothing to indicate that hydrogen is inferior toEdaravone for the treatment of cerebral infarction and itis quite possible that a single use of hydrogen is as effec-tive as Edaravone treatment and probably much safer.However, it would be an unethical conduct until largercontrolled clinical studies accumulate more evidences,because of limitations of our study. However, if theadvantages in the EH group of current study were sub-stantiated in the future studies, the advantages may bedue to the increased frequency of administration of theradical scavengers as was in EH group (4 times per dayvs. 2 times per day), and/or direct hydrogen effects onthe inflammatory cells, chemokines and growth and anti-apoptoic factors and/or a direct neutralizing action onthe residual radical substances of intermediate Edaravonemetabolites in ischemic and hypoxic brain tissue. Edara-vone putatively provides electrons and becomes a radicalby itself until it reacts with oxygen and then changes,through Edaravone peroxyl radical, to a non-radicalmaterial, 2-oxo-3-(phenylhydrazono)-butanoic acid(OPB) [35] which may accumulate in the brain even-tually. Hydrogen may have interacted with those inter-mediate radical products favourably and provided betterMRI changes in our study. At the beginning of this study,our concerns included the government approved andrecommended Edaravone dose (60 mg/day for 2 weeks =840 mg) and subsequent blood level dynamics. It is inter-esting that a currently on going Phase 2 study in Europeincreased the Edaravone doses from 840 mg to 1000 mgand 2000 mg [21]. The results of the study may solvesome of our concerns.The limitations of our study include a non-controlled
way of patient selection, inclusion of rather small num-ber of the patients particularly in the combined group,use of current NIHSS for neurological evaluation for thebrainstem infarction, lack of long term follow-up etc.We are organizing a new study to improve these limita-tions currently.
ConclusionsAdministration of hydroxyl radical scavengers in acutestage of brainstem infarction improved MRI indices(rDWI, rADC) against the natural course. The favour-able effects were more obvious and significant in the EHgroup (a combined group of Edaravone and hydrogen)as compared to the E group (Edaravone alone group).These findings may imply the need for more frequentdaily administration of hydroxyl radical scavenger, orpossible presence of additional hydrogen effects on sca-venger mechanisms.
AcknowledgementsThe authors would like to thank Miz Company for technical assistance forsetting up the hydrogen water tank and initial measurement of hydrogenconcentration in the intravenous fluid bag.
Author details1Department of Neurosurgery, Nishijima Hospital, Oooka, Numazu City,Sizuoka, 410-0022, Japan. 2Department of Neurosurgery, National DefenceMedical College, Tokorozawa City, Saitama,359-8513, Japan.
Authors’ contributionsThe authors equally contributed to the production of this article and haveread and approved the final manuscript.
Competing interestsThe authors declare that they have no competing interests and were notcompensated at all by any pharmaceutical and biotechnology company orany other companies to contribute this article to the peer-reviewed scientificliterature.
Received: 16 March 2011 Accepted: 7 June 2011 Published: 7 June 2011
References1. Yang Q, Brian M, Tress BM, Barber PA, Desmond PM, Darby DG, Gerraty RP,
Li T, Davis SM: Study of apparent diffusion coefficient and anisotropy inpatients with Acute Stroke. Stroke 1999, 30:2382-2390.
2. Schwamm LH, Koroshetz WJ, Sorensen GA, Wang B, Copen WA, Rordorf G,Buonanno FS, Schaefer PW, Gonzalez GR: Serial Diffusion-andHemodynamic-Weighted Magnetic Resonance Imaging. Stroke 1998,29:2268-2276.
3. Huang IJ, Chen CY, Chung HW, Chang DC, Lee CC, Chin SC, Liou M: TimeCourse of Cerebral Infarction in the Middle Cerebral Arterial Territory:Deep Watershed versus Territorial Subtypes on Diffusion-weighted MRImages. Radiology 2001, 221:35-42.
4. Fiebach JB, Schellinger JO, Sartor HW: Serial analysis of the apparentdiffusion coefficient time course in human stroke. Neuroradiology 2002,44:294-298.
5. Liu S, Karonen JO, Liu Y, Vanninen Ft, Partanen K, Cinbnen MK, Vainio P,Aronen HJ: Serial Measurements of the Apparent Diffusion Coefficient inHuman Stroke on Five Time Points over Three Months. Proc Intl Sot MagReson Med 2000, 8:1203.
6. Huang L, Wong XH, Li G: The application of DWI and ADC map incerebral infarction. Proc Intl Soc Mag Reson Med 2001, 9:1446.
7. Marks MP, Tong DC, Beaulieu C, Albers GW, deCrespigny A, Moseley MR:Evaluation of early reperfusion and i.v. tPA therapy using diffusion-andperfusion-weighted MRI. Neurology 1999, 52:1792-1798.
8. Schaefer POW, Hassankhani A, Putman C, Sorensen GA, Schwamm L,Koroshez W, Gonzalez GR: Characterization and evolution of diffusionMNRE imaging abnormalities in Stroke patients undergoing intra-arterialthrombolysis. ANJR 2004, 25:951-957.
9. Tanaka M: Pharmacological and clinical profile of the free radicalscavenger edaravone as a neuroprotective agent. Folia Pharmacol Jpn2002, 119:301-308.
Ono et al. Medical Gas Research 2011, 1:12http://www.medicalgasresearch.com/content/1/1/12
Page 8 of 9
10. Kageyama M, Toriyama S, Tsubosita A, Muraki S, Yamada T, Ishibashi A: Apost-marketing drug use survey of a neuroprotecive drug Radicutinjection 30 mg(non-proprietary name: edaravone) for acute ischemicstroke. J New Rem Clin 2009, 58:1212-1226.
11. Ohsawa I, Ishikawa M, Takahashi K, Watanabe M, Nishimaki K, Yamagata K,Katsura K, Katayama Y, Asoh S, Ohta S: Hydrogen acts as a therapeuticantioxidant by selectively reducing cytotoxic oxygen radicals. Nat Med2007, 13:688-694.
12. Takagi M: Concept of branch atheromatous disease. Neurol Med 2008,69:542-549.
13. Burdett JH, Elster AD, Ricci PE: Acute Cerebral Infarction: Quantification ofSpin-Density and T2 Shine-through Phenomena on Diffusion-weightedMR Images. Radiology 1999, 212:333-339.
14. Edaravone Acute Infarction Study Group: Effect of a novel free radicalscavenger, edaravone (MCI-186), on acute brain infarction. Randomized,placebo-controlled, double-blind study at multicenters. Cerebrovasc Dis2003, 15:222-229.
15. Yamamoto Y, Kuwahara T, Watanabe K, Watanabe K: Antioxidant activity of3-methyl-1-phenyl-2-pyrazolin-5-one. Redox Report 1996, 2:333-338.
16. Zhang N, Komine-Kobayashi M, Tanaka R, Liu M, Mizuno Y, Urabe T:Edaravone reduces early accumulation of oxidative products andsequential inflammatory responses after transient focal ischemia in micebrain. Stroke 2005, 36:2220-2225.
17. Kawai H, Nakai H, Suga M, Yuki S, Watanabe T, Saito KI: Effects of a novelfree radical scavenger, MCl-186, on ischemic brain damage in the ratdistal middle cerebral artery occlusion model. J Pharmacol Exp Ther 1997,281:921-927.
18. Yoshida H, Metoki N, Ishikawa A, Imaizumi T, Matsumiya T, Tanji K, Ota K,Ohyama C, Satoh K: Edaravone improves the expression of nerve growthfactor in human astrocytes subjected to hypoxia/reoxygenation. NeurosciRes 2010, 66:284-289.
19. Zhang W, Sato K, Hayashi T, Omori N, Nagano I, Kato S, Horiuchi S, Abe K:Extension of ischemic therapeutic time window by a free radicalscavenger, Edaravone, reperfused with tPA in rat brain. Neurol Res 2004,26:342-348.
20. Watanabe T, Tahara M, Todo S: The Novel Antioxidant Edaravone: FromBench to Bedside. Cardiovascular Therapeutics 2008, 26:101-114.
21. Lapchak PA: A critical assessment of edaravone acute ischemic strokeefficacy trials: is edaravone an effective neuroprotective therapy? ExpertOpinion on Pharmacotherapy 2010, 11:1753-1763.
22. Nakao A, Sugimoto R, Billiar TR, McCurry KR: Therapeutic antioxidantmedical gas. J Clin Biochem Nutr 2009, 44:1-13.
23. Kajiyama S, Hasegawa G, Asano M, Hosoda H, Fukui M, Nsksmura N,Kitawaki J, Imai S, Nakano K, Ohta M, Adachi T, Obayashi H, Yoshikawa T:Supplementation of hydrogen-rich water improves lipid andd glucosemetabolism in patients with type 2 diabetes or impaired glucosetolerance. Nur Res 2008, 28:137-143.
24. Buchholz BM, Kaczorowski DJ, Sugimoto R, Yang R, Wang Y, Billiar TR,McCurry KR, Bauer AJ, Nakao A: Hydrogen inhalation amelioratesoxidative stress in transplantation induced intestinal graft injury. Am Itransplant 2008, 8:2015-2024.
25. Saitoh Y, Okayasu H, Xiao L, Harata Y, Miwa N: Neutral pH hydrogen-enriched electrolyzed water achieves tumor-preferential clonal growthinhibition over normal cells and tumor invasion inhibition concurrentlywith intracellular oxidant repression. Oncol Res 2008, 17:247-255.
26. Cardinal JS, Zhan J, Wang Y, Sugimoto R, Tsung A, McCurry KR, Billar R,Nakao A: Oral administration of hydrogen water prevents chronicallograft nephropathy in rat renal transplantation. Kidney Int 2010,77:101-109.
27. Nakao A, Kaczorowski DJ, Wang Y, Cardinal JS, Buchholz BM, Sugimoto R,Tobita K, Lee S, Toyoda Y, Billar TR, McCurry KR: Amelioration of rat cardiaccold ischemia/reperfusion injury with inhaled hydrogen or carbonmonoxide, or both. J Heart Lung Transplant 2010, 29:544-553.
28. Xie K, Yu Y, Pei Y, Hou L, Chen S, Xiong L, Wang G: Protective effects ofhydrogen gas on murine polymicrobial sepsis via reducing oxidativestress and HMGB1 release. Shock 2010, 34:90-97.
29. Liu Q, Shen WF, Sun HY, Fan DF, Nakao A, Cai JM, Yan G, Zhou WP,Shen RX, Yang JM, Sun XJ: Hydrogen-rich saline protects against liverinjury in rats with obstructive jaundice. Liver Int 2010, 30:958-968.
30. Nakayama M, Nakao H, Hamada H, Itami N, Nakazawa R, Ito S: A novelbioactive hemodialysis system using dissolved dihydrogen(H2) produced
by water electrolysis: a clinical trial. Nephrol Dial Transplant 2010,25:3026-3033.
31. Chen CW, Chen QB, Mao YF, Xu SM, Xia CY, Shi XY, Zang ZH, Yuan HB,Sun XJ: Hydrogen-rich saline protects against spinal cord injury in rats.Neurochem Res 2010, 35:1111-1118.
32. Fujita K, Seike T, Yutsudo N, Ohno M, Yamada H, Yamaguchi H, Sakumi K,Yamakawa Y, Kido M, Takaki A, Katafuchi T, Tanaka Y, Nakabeppu y,Noda M: Hydrogen in drinking water reduces dopaminergic neuronalloss in the 1-methyl-4-phenyl-1,2,3,6-tetrahydropyridine mouse model ofParkinson disease. PloS One 2009, 30:1-10, e7247.
33. Li J, Wang C, Zhang JH, Cai JM, Cao YP, Sun XJ: Hydrogen-rich salineimproves memory function in a rat model of amyloid-beta-inducedAlzheimer’s disease by reduction of oxidative stress. Brain Res 2010,1328:152-161.
34. Nakao A, Toyoda Y, Sharma P, Evans M, Guthrie N: Effectiveness ofHydrogen Rich Water on Antioxidant Status of Subjects with PotentialMetabolic Syndrome–An Open Label Pilot Study. J Clin Biochem Nutr2010, 46:140-149.
35. Higashi Y, Jitsuiki D, Chayama K, Yoshizumi M: Edaravone (3-methyl-1-phenyl-2-pyrazolin-5-one), a novel free radical scavenger, for treatmentof cardiovascular disease. Recent Patents on Cardiovascular Drug Discovery2006, 1:85-93.
doi:10.1186/2045-9912-1-12Cite this article as: Ono et al.: Improved brain MRI indices in the acutebrain stem infarct sites treated with hydroxyl radical scavengers,Edaravone and hydrogen, as compared to Edaravone alone. A non-controlled study. Medical Gas Research 2011 1:12.
Submit your next manuscript to BioMed Centraland take full advantage of:
• Convenient online submission
• Thorough peer review
• No space constraints or color figure charges
• Immediate publication on acceptance
• Inclusion in PubMed, CAS, Scopus and Google Scholar
• Research which is freely available for redistribution
Submit your manuscript at www.biomedcentral.com/submit
Ono et al. Medical Gas Research 2011, 1:12http://www.medicalgasresearch.com/content/1/1/12
Page 9 of 9