important information about this workbook risk map workbook
TRANSCRIPT
README Printed: 10/19/07 11:26 AM
IMPORTANT INFORMATION ABOUT THIS WORKBOOKRisk Map Workbook
Please Select Your Area (e.g. Northeastern Area):
This is file 1 of 1
Worksheets:READMECurvesRisk Rankings Tool for assisting in developing scalesCitationsBase Sheet Empty base sheet
Filling out the Model Worksheets
Risk Agent(s): Common name of the risk agent, e.g. Spruce budworm
Host(s): Host tree species, e.g. Balsam fir
Model Extent:
Max Percent Mortality: Maximum threshold expected (in percent)
Susceptibility/Vulnerability Enter the Rank for each (or one if only one used) and the Weights will calculate.
Criteria
Criteria Rank/Weight Enter the Rank value, the Weight will calculate automatically.
Constraints List any model constraints, if applicable
Comments Area for information not covered in other fields
Citations
Model Certainity Select the model certainity/source from the dropdown list.
There are four general worksheets followed by 15 empty model sheets. Fill out the empty sheets. If you need additional sheets, please start a new file to keep the number of model worksheets to 15 in each file.
California
If more than 1 file is needed, please update this secton with the correct numbers:
Enter the full citation details (publication, communication, model developer, etc) on the Citations worksheet and assign a number. On the model spreadsheet, enter the citation number in this area. Two example citations are shown, replace with your citations.
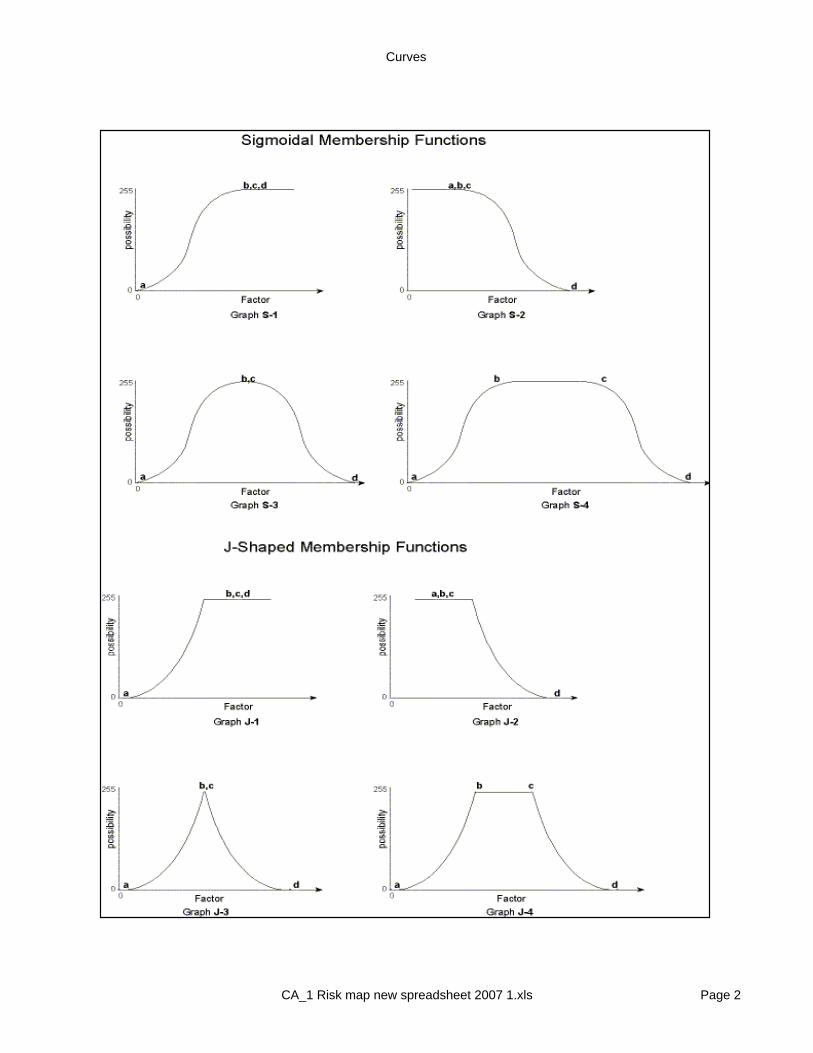
Enter the criteria following the same rules as the previous worksheets. *Note for rare exceptions (such as the inverse S-3 and S-4) where two sets of A,B,C,D risk values are needed for one criteria, delete the "Criteria X" from the cell. You will have to renumber the remaining criteria.
This worksheetCurve graphics
Listing and status of models for interior west
Extent, e.g. Northeastern or list certain ecoregions If the list of ecoregions is too long for this field, enter them in the comments and put a note in the model extent, such as "Certain IW ecoregions - see comments".
The area in blue on the top of the worksheet is for your use and is not printed. The format has changed slightly fromthe previous versions.
CA_1 Risk map new spreadsheet 2007 1.xls Page 1
Curves
CA_1 Risk map new spreadsheet 2007 1.xls Page 2

Risk/Mortality Scaling Tool
Input Value Classes Scaled ValueRisk Begins (0): 0 0 0
10 120 230 340 450 560 670 780 890 9
Risk Peaks (10): 100 100 10
To obtain eleven class values (for risk values, mortality thresholds), enter the risk begins and risk peaks values. Equal interval classes will be calculated.
Citation List - California
No. Citation1 Amman, G.D., McGregor, M.D., Cahill, D.B. and Klein, W.H.. 1977. Guidelines for reducing losses of lodgepole pine to the
mountain pine beetle in unmanaged stands in the Rocky Mountains. USDA Forest Service, General Technical Report INT-36. Intermountain Forest and Range Experimental Station, Ogden, UT. 19 p.
2 Bailey, D.K.. 1987. A study of Pinus subsectinon Cembroides I: The single -needle pinyons of the Californias and Great Basin. Notes RBG Edinb. 44(2):275-310.
3 Burns, R.M. and Honkala, B.H. (Technical Coords). 1990. Silvics of North America. Volume 1, Conifers. USDA Forest Service Agriculture Handbook 654. 675 pp.
4 California Forest Pest Council. 1962 to 2003. Forest pest conditions in California - 1962 to 2003. California Department of Forestry. Sacramento, CA.
5 Dixon, G.E.. 1988. Forest Service White Paper. The Western Sierra Nevada Prognois Variant(WESSIN), WO Timber Management, Fort Collins, Colorado.
6 Eyre, F.H.. 1980. Forest Cover Types of the United States. SAF.7 Fites, J.A., Olson, R.D., Smith, S., Vazquez, A., Bricker, D., Clark, R. and Hanson, L.. 1996. Forest Service White Paper.
Vegetative, Fire, Insect, and Pathogen Conditions, Lassen and Plumas National Forests, and the Sierraville District of the Tahoe National Forest.
8 Fowells, H.A.. 1965. Silvics of forest tress in the United States. Ag. Handbook NO. 271. USDA Forest Service. 762p.9 Funiss, R.L., and Carolin, V.M.. 1977. Western Forest Insects. USDA Forest Service Misc. Pub. No. 1339. 654pp.10 Geils, B., Tovar, J.C., and Moody, B. 2002. Mistletoes of North America. USDA RMRS-GTR-98.11 Griffin, J.R. and Critchfield, W.B.. 1972. The distribution of forest trees in California. USDA Forest Service Res. Paper PSW-82.
114p.12 Hagle, S.K. and Kegley. 2000. 13 Hagle, S.K. and Randall. 2000. 14 Hagle, S.K., Schwandt, J., Johnson, T., Kegley, S., Randall, C.B.,Taylor, J., Lockman, I.B., Sturdevant, N. and Marsden, M..
2000. Successional functions of pathogens and insects: ecoregion sections M332a and M333d in northern Idaho and western Montana. Volume 2: Results. USDA Forest Service, Region 1 FHP Report No. 00-11. State and Private Forestry, Cooperative Forestry and Forest Health Protection, Northern Region, Missoula, MT. 283 p.
15 Hall, R.C. and Davies, G.R. . 1968. Office Report. Mountain Pine Beetle Epidemic at Joseph Creek Basin, Modoc National Forest.16 Harlow, W.M. and Harrar, E.S.. 1958. Textbook of dendrology. McGraw-Hill Book Co. Inc., New Yeark. 561p.17 Hawksworth, F., and Wiens, D.. 1996. Dwarf Mistletoes: Biology, Pathology, and Systematics. USDA Ag HB709.18 Hickman, J.C. (Ed.). 1993. The Jepson Manual. Higher Plants of California. Berkeley: University of California Press. 1400 pp.19 Jensen, G.. 1982. Forest Service White Paper. Desired Growing Stock Levels for Ponderosa Pine on the Modoc National Forest in
Relationship to Activities of the Mountain Pine Beetle.20 Landram, M.. 1996. Forest Health and Commercial Thinning Strategies on National Forests in California. In: Proceedings of the
45th Annual Meeting, California Forest Pest Council. November 12-14, 1996, Sacramento, California.21 Lanner, R.M.. 1999. Conifers of California. Cachuma Press, Los Olivos, CA 274p.22 Meentemeyer, R., Rizzo, D., Mark, W.,and Lotz E.. 2004. Mapping the risk of establishment and spread of sudden oak death in
California. Forest Ecology and Management, 200, pgs 195-214.23 Mika, P.G., Heller, R.C. and Stoszek, K.J. . 1981. Application of Models Developed To Risk Rate Forest Sites and Stands to
Douglas-fir Tussock Moth Defoliations. In Hazard-Rating Systems in Forest Insect Pest Management: Symposium Proceedings, USDA General Technical Report WO-27. Athens, Georgia, July 31 to August 1, 1980, pages 129-135.
24 Mirov, N.T.. 1967. The Genus Pinus. New York: The Ronald Press Company. 602 pp.25 Munson, A.S. and Anhold, J.A.. 1995. Empirical risk-rating method. USDA Forest Service, Forest Health Protection, Ogden, UT.26 Negrón, J.F. and Popp, J.B.. 2004. Probability of ponderosa pine infestation by mountain pine beetle in the Colorado Front Range.
Forest Ecology and Management. 191: 17-27.27 Negrón, J.F. and Wilson, J.L. . 2003. Attributes associated with probability of infestation by the piñon ips, Ips confusus (Coleoptera:
Scolytidae), in piñon pine, Pinus edulis. Western North American Naturalist. 63(4): 440-451.28 Oliver, W.W.. 1997. Twenty-five-year growth and mortality of planted ponderosa pine repeatedly thinned to different stand densities
in northern California. Western journal of applied forestry. West. j. appl. for. Oct 1997. v. 12 (4).29 Oliver, W.W.. 1995. Is Self-Thinning in Ponderosa Pine Ruled by Dendroctonus Bark Beetles? In: Forest Health Through
Siviculture, Proceedings of the 1995 National Silviculture Workshop, Mescalero, NM, May 8-11, 1995. General Technical Report RM-GTR-267, pages 213-218.
30 Olson, R.D., Fites, J.A., Smith, S., Vazquez, Al , Young, L.S., Smith, S., Hanson, L., Randall, C., Henson, C. and Willey, M. . 1995. Forest Service White Paper(unpublished), The X Files, An Assessment of Fuel Conditions and Forest Health, lassen, Plumas, and Tahoe National Forests.
31 Parameter-elevation regressions on Independent Slopes Model(PRISM). 1961-1990. Spatial Climate Analysis Service, Oregon State University. Http://www.ocs.orst.edu/prism/.
32 Pavlik, B.M., Muick, P.C., Johnson, S.G. and Popper, M. . 1991. Oaks of California. Cachuma Press, Los Olivos, CA 184 p.33 Perry, J.P., Jr. 1991. The Pines of Mexico and Central America. Portland, OR: Timber Press. 231 pp.
34 Randall, C.B. and Tensmeyer, G. . 2000. Hazard rating system for mountain pine beetle in lodgepole pine using the Oracle database and the Forest Service IBM platform. Forest Health Protection Report 00-6. USDA Forest Service, Northern Region, Missoula, MT. 5 p.
35 Rantz, S.E.. 1969. Mean annual precipitation in the California region. U.S.G.S. Menlo Park, CA.36 Reineke, L.H.. 1933. Perfecting a stand density index for even-aged forests. J. Agri. Res. 46: 627-638.37 Safranyik, L., Shore, T.L., Linton, D.A. and Rankin, L. . 1999. Effects of induced competitive interactions with secondary bark beetle
species on establishment and survival of mountain pine beetle broods. Natural Resources Canada, Canadian Forest Service, Information Report BC-X-384. Victoria, BC.
38 Sartwell, C. and Dolph, R.E., Jr.. 1976. Silvicultural and Direct Control of Mountain Pine Beetle in Second-Growth Panderosa Pine. Res. Note PNW-268. Pacific Northwest Forest and Range Experiment Station.
39 Sartwell, C. and Stevens, R.. 1975. Mountain Pine Beetle in Ponderosa Pine-Prospects for Silvicultural Control in Second Growth Stands. J. Forestry. 73(3): 136-140.
40 Scharpf, R.F. (Technical Coord). 1993. Diseases of Pacific Coast Conifers. USDA Forest Service Agriculture Handgook 521. 199 pp.
41 Schmid, J.M. and Mata, S.A.. 1992. Stand density and mountain pine beetle-caused tree mortality in ponderosa pine stands. USDAForest Service, Research Note RM-515. Rocky Mountain Forest and Range Experiment Station, Fort Collins, CO.
42 Schultz, D.E.. 1994. Forest Service Biological Evaluation. Evaluation of White Fir Mortality on Big Valley RD (FPM Rept. NE94-2).43 Schumacher, F.X.. 1928. Yield, stand of volume tables for red fir in California. University of California, College of Agriculture,
Agriculture Experiment Station, Berkeley, California. Bulletin 456. 29 p.44 Schumacher, F.X.. 1926. Yield, stand of volume tables for white fir in the California pine region. University of California, College of
Agriculture, Agriculture Experiment Station, Berkeley, California. Bulletin 407. 27 p.45 Shore, T.L. and Safranyik, L. . 1992. Susceptibility and risk rating systems for the mountain pine beetle in lodgepole pine stands.
Natural Resources Canada, Canadian Forest Service, Information Report BC-X-336. Pacific For. Ctr., Victoria, BC. 46 Shultz, D.E.. 1994. Forest Service Biological Evaluation. Evaluation of White Fir Mortality on Big Valley RD(FPM Pept. NE94-2).47 Smith, S. . 1997. Forest Service Biological Evaluation. White Fir Mortality in the MOH Project Area, Hat Creek RD, (FPM Report
#NE97-4).48 Smith, S. and Petersen, R.. 1996. Forest Service Biological Evaluation. Southside Analysis Input - The Use of Mean Annual
Precipitation to Predict True Fir Mortality (Report NE96-5).49 Smith, S. and Petersen, R.. 1996. Forest Service Biological Evaluation. Southside Analysis Input - The Use of Mean Annual
Precipitation to Predict True Fir Mortality (Report NE96-5).50 Spurr, S.H. 1952. Forest Inventory. The Ronald Press Company, New York. 476p.51 Steele, R., Williams, R.E., Weatherby, J.C., Reinhardt, E.D., Hoffman, J.T., and Their, R.W.. 1996. Stand Hazard Rating for Central
Idaho Forests. General Technical Report INT-GTR-332, 29 pp.52 Stevens, R.E., McCambridge, W.F. and Edminster, C.B. . 1980. Risk rating guide for mountain pine beetle in Black Hills ponderosa
pine. USDA Forest Service, Research Note RM-385. Rocky Mountain Forest and Range Experimental Station, Ft. Collins, CO. 2 p.53 USDA Forest Service. 1994. California forest health past and present. USDA Forest Service, Pacific Southwest Region, Forest
Pest Management Publ. R5 - FPM-PR-001. 70 p.54 USDA Forest Service. 1996. California forest health in 1994 and 1995. USDA Forest Service, Pacific Southwest Region, Forest
Pest Management Publ. R5- FPM-PR-002. 63 p.55 USFS. 1965. Silvics of Forest Trees of the United States. Agriculture Handbook No. 271.56 USFS. 1990. Silvics of North America. Volume 1, Conifers. Agriculture Handbook 654 pp.57 Wickman, B.E. . 1963. Mortality and Growth Reduction of White Fir Following Defoliation by the Douglas-fir Tussock Moth. Pacific
Southwest Forest and Range Experiment Station. U.S. Forest Service Research Paper, PSW-7.58 Wickman, B.E. . 1978. Tree Mortality and Top-Kill Related to Defoliation by the Douglas-fir Tussock Moth in the Blue Mountains
Outbreak. USDA Forest Service Research Paper PNW-233, Pacific Northwest Forest and Range Experiment Station.59 Wickman, B.E., Mason, R.R. and Thompson, C.G. . 1973. Major Outbreaks of the Douglas-fir Tussock Moth in Oregon and
California. Pacific Northwest Range and Experiment Station. USDA Forest Service General Technical Report PNW-5.60 Wilson, J.L. and Tkacz, B.M.. 1992. Pinyon ips outbreak in pinyon juniper woodlands in northern Arizona: a case study. Pages 187-
190 in Ecology and management of oak and associated woodlands: perspectives in the southwestern United States and northern Mexico. General Technical Report RM-218. USDA Forest Sevice, Rocky Mountain Forest and Range Experiment Station, Fort Collins, CO.
61 Merrill, L. 2005. Personal communication for the development of Southern California models.62 Smith, S. and Woodruff, W. 2005. Personal communication for the development of northeastern California models.63 Angwin, P., Kliejunas, J., Pronos, J.,and Woodruff, W. 2005. Personal communication for development of root disease and
mistletoe models. 64 Pronos, J. and Smith S. and Bulaon, B. 2005. Personal communication for the development of southern Sierra models.65 Schultz, D. and Angwin, P. 2005. Personal communication for the development of northwestern California models.
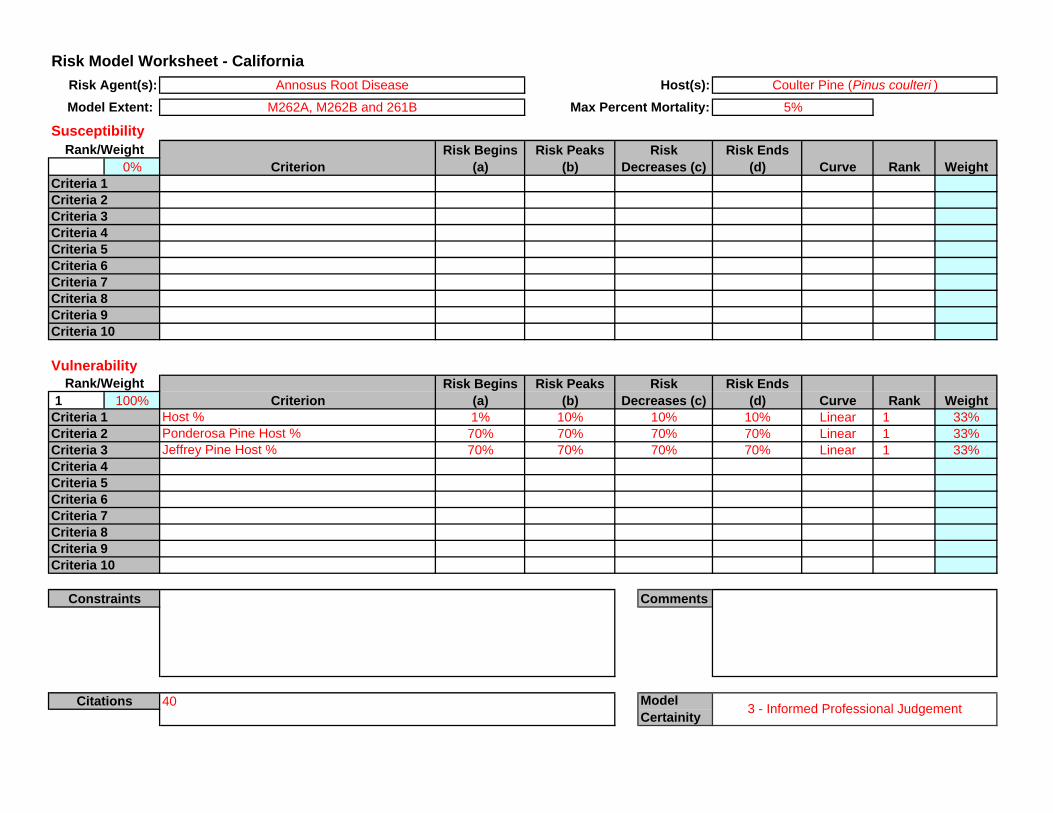
Risk Model Worksheet - CaliforniaHost(s):
Model Extent: Max Percent Mortality:
Susceptibility
0%
Vulnerability
1 100%Host % 1% 10% 10% Linear 1 33%Ponderosa Pine Host % 70% 70% 70% Linear 1 33%Jeffrey Pine Host % 70% 70% 70% Linear 1 33%
CommentsConstraints
Citations
Rank/Weight
Rank/Weight
Criteria 7Criteria 8Criteria 9Criteria 10
Criteria 3Criteria 4
Criteria 7Criteria 8
Criteria 5Criteria 6
Criteria 9Criteria 10
Criteria 1Criteria 2
Criteria 3Criteria 4Criteria 5Criteria 6
Weight
Model Certainity 3 - Informed Professional Judgement
Risk Ends (d) Curve Rank
70%
Curve Rank Weight
5%
Risk Ends (d)
Coulter Pine (Pinus coulteri )
Risk Begins (a)
Risk Peaks (b)Criterion
Risk Decreases (c)
70%
Risk Agent(s): Annosus Root Disease
M262A, M262B and 261B
Criteria 1Criteria 2
40
10%Criterion
Risk Begins (a)
Risk Peaks (b)
Risk Decreases (c)

Risk* of Mortality
LegendLevel of risk for host
0 - 2 Little or no risk
3 - 4 Low risk
5 - 6 Medium risk
7 - 10 High risk
Annosus Root Diseaseon Coulter Pine (CA)
Mortality Ceiling of 5%
*Risk of experiencing mortality at a given threshold over a 15 year period. Printing Date: October 29, 2007
0 100 200 30050Miles

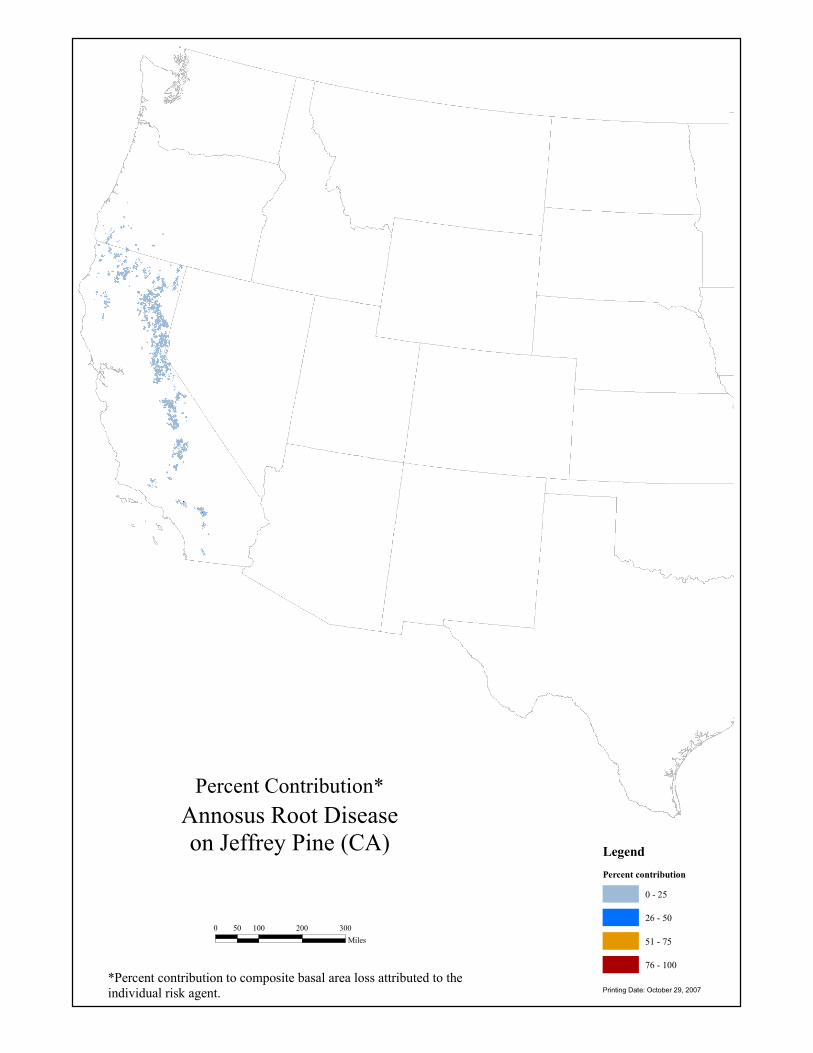
Percent Contribution*
LegendPercent contribution
0 - 25
26 - 50
51 - 75
76 - 100
Annosus Root Diseaseon Coulter Pine (CA)
*Percent contribution to composite basal area loss attributed to the individual risk agent. Printing Date: October 29, 2007
0 100 200 30050Miles

Risk Model Worksheet - CaliforniaHost(s):
Model Extent: Max Percent Mortality:
Susceptibility
0%
Vulnerability
1 100%Annosus present present present Linear 1 100%
CommentsConstraints
Citations
Rank/Weight
Rank/Weight
Criteria 7Criteria 8Criteria 9Criteria 10
Criteria 3Criteria 4
Criteria 7Criteria 8
Criteria 5Criteria 6
Criteria 9Criteria 10
Criteria 1Criteria 2
Criteria 3Criteria 4Criteria 5Criteria 6
Weight
Model Certainity 3 - Informed Professional Judgement
Risk Ends (d) Curve Rank
Curve Rank Weight
100%
Risk Ends (d)
Jeffrey Pine (Pinus jeffreyi )
Risk Begins (a)
Risk Peaks (b)Criterion
Risk Decreases (c)
Risk Agent(s): Annosus Root Disease
M262A and M262B
Criteria 1Criteria 2
40
presentCriterion
Risk Begins (a)
Risk Peaks (b)
Risk Decreases (c)

Risk* of Mortality
LegendLevel of risk for host
0 - 2 Little or no risk
3 - 4 Low risk
5 - 6 Medium risk
7 - 10 High risk
Annosus Root Diseaseon Jeffrey Pine (CA)
Mortality Ceiling of 100%
*Risk of experiencing mortality at a given threshold over a 15 year period. Printing Date: October 29, 2007
0 100 200 30050Miles
Percent Contribution*
LegendPercent contribution
0 - 25
26 - 50
51 - 75
76 - 100
Annosus Root Diseaseon Jeffrey Pine (CA)
*Percent contribution to composite basal area loss attributed to the individual risk agent. Printing Date: October 29, 2007
0 100 200 30050Miles
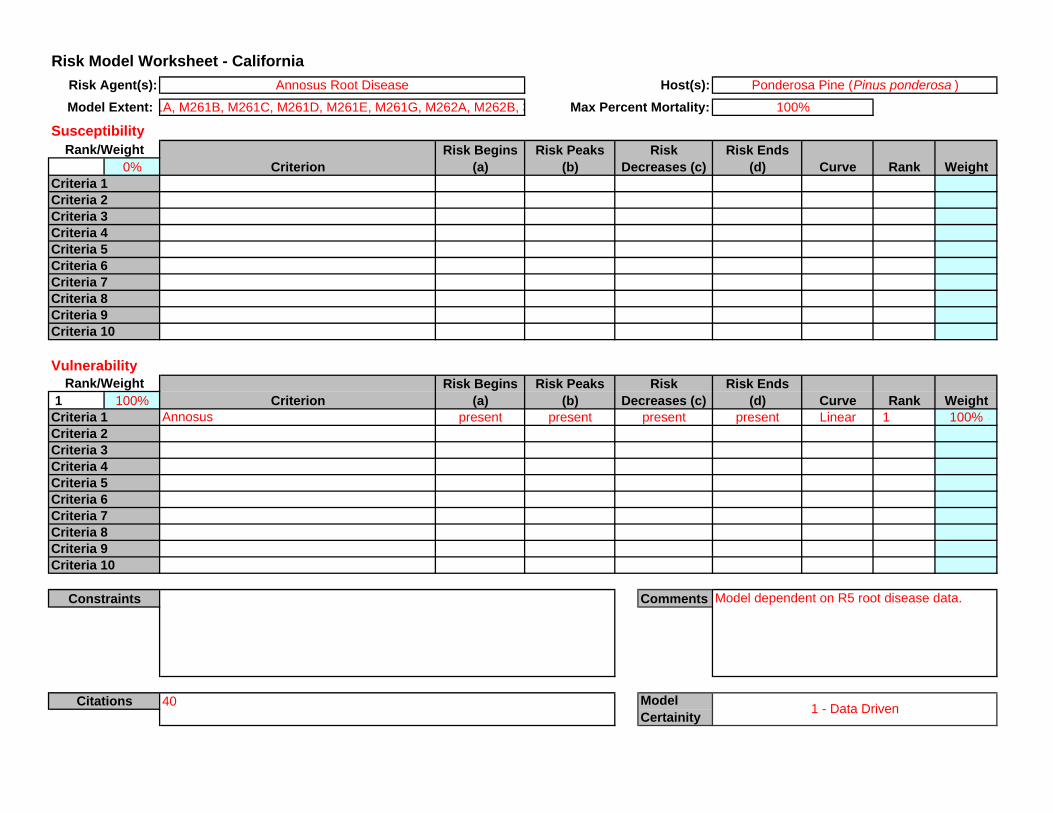
Risk Model Worksheet - CaliforniaHost(s):
Model Extent: Max Percent Mortality:
Susceptibility
0%
Vulnerability
1 100%Annosus present present present Linear 1 100%
CommentsConstraints
Citations
Rank/Weight
Rank/Weight
Criteria 7Criteria 8Criteria 9Criteria 10
Criteria 3Criteria 4
Criteria 7Criteria 8
Criteria 5Criteria 6
Criteria 9Criteria 10
Criteria 1Criteria 2
Criteria 3Criteria 4Criteria 5Criteria 6
Weight
Model Certainity 1 - Data Driven
Risk Ends (d) Curve Rank
Model dependent on R5 root disease data.
Curve Rank Weight
100%
Risk Ends (d)
Ponderosa Pine (Pinus ponderosa )
Risk Begins (a)
Risk Peaks (b)Criterion
Risk Decreases (c)
Risk Agent(s): Annosus Root Disease
1A, M261B, M261C, M261D, M261E, M261G, M262A, M262B, 3
Criteria 1Criteria 2
40
presentCriterion
Risk Begins (a)
Risk Peaks (b)
Risk Decreases (c)
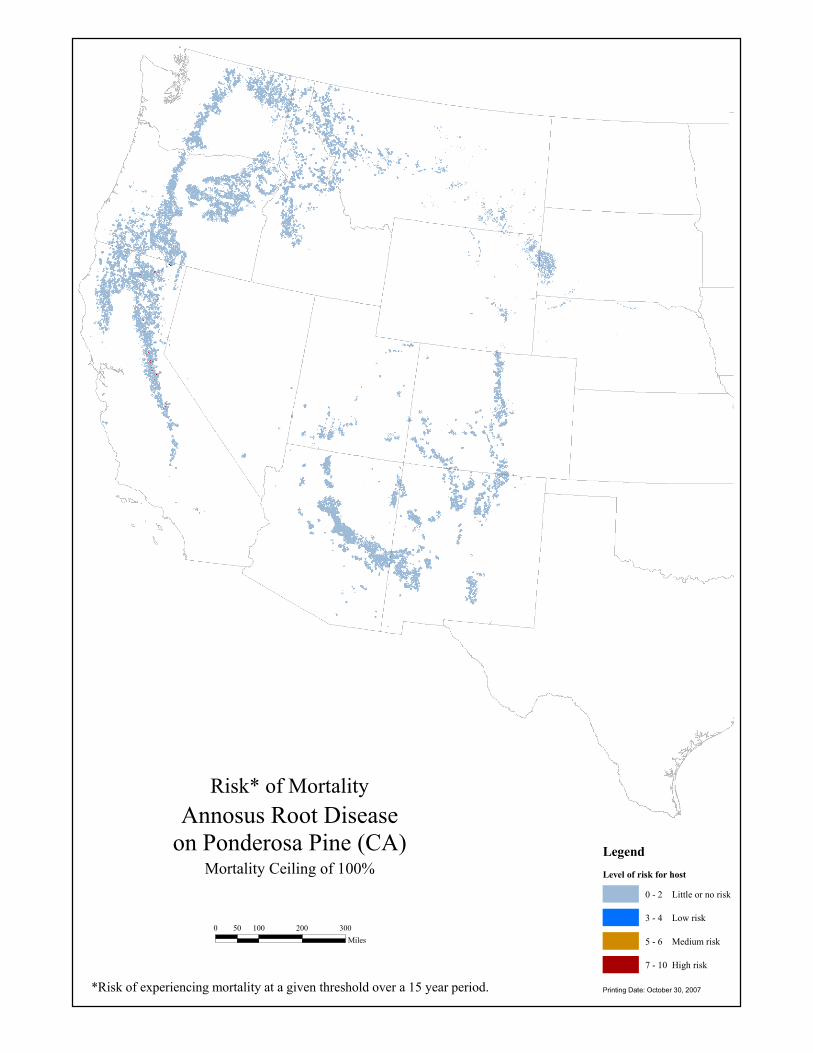
Risk* of Mortality
LegendLevel of risk for host
0 - 2 Little or no risk
3 - 4 Low risk
5 - 6 Medium risk
7 - 10 High risk
Annosus Root Diseaseon Ponderosa Pine (CA)
Mortality Ceiling of 100%
*Risk of experiencing mortality at a given threshold over a 15 year period. Printing Date: October 30, 2007
0 100 200 30050Miles

Percent Contribution*
LegendPercent contribution
0 - 25
26 - 50
51 - 75
76 - 100
Annosus Root Diseaseon Ponderosa Pine (CA)
*Percent contribution to composite basal area loss attributed to the individual risk agent. Printing Date: October 30, 2007
0 100 200 30050Miles
Risk Model Worksheet - CaliforniaHost(s):
Model Extent: Max Percent Mortality:
Susceptibility
0%
Vulnerability
1 100%Annosus present present present Linear 1 100%
Comments
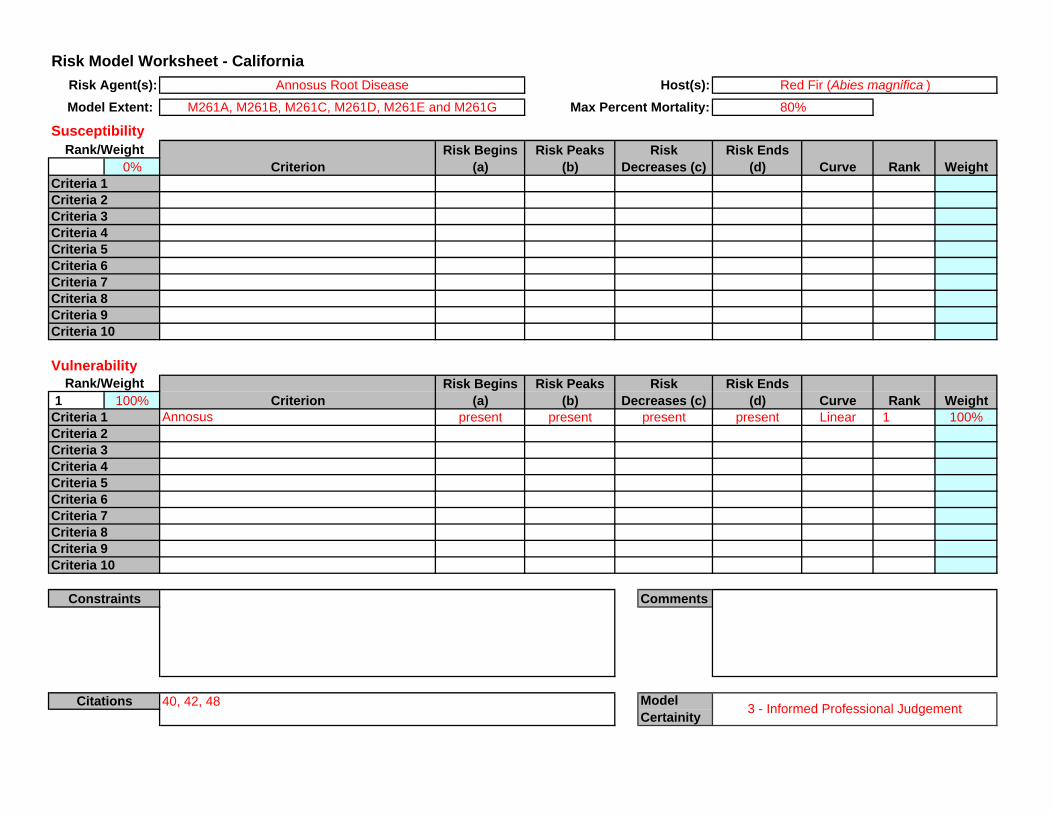
40, 42, 48
presentCriterion
Risk Begins (a)
Risk Peaks (b)
Risk Decreases (c)
Risk Agent(s): Annosus Root Disease
M261A, M261B, M261C, M261D, M261E and M261G
Criteria 1Criteria 2
Risk Begins (a)
Risk Peaks (b)Criterion
Risk Decreases (c) Curve Rank Weight
80%
Risk Ends (d)
Red Fir (Abies magnifica )
Weight
Model Certainity 3 - Informed Professional Judgement
Risk Ends (d) Curve Rank
Criteria 3Criteria 4Criteria 5Criteria 6Criteria 7Criteria 8
Criteria 5Criteria 6
Criteria 9Criteria 10
Criteria 1Criteria 2
Constraints
Citations
Rank/Weight
Rank/Weight
Criteria 7Criteria 8Criteria 9Criteria 10
Criteria 3Criteria 4

Risk* of Mortality
LegendLevel of risk for host
0 - 2 Little or no risk
3 - 4 Low risk
5 - 6 Medium risk
7 - 10 High risk
Annosus Root Diseaseon Red Fir (CA)Mortality Ceiling of 80%
*Risk of experiencing mortality at a given threshold over a 15 year period. Printing Date: October 30, 2007
0 100 200 30050Miles

Percent Contribution*
LegendPercent contribution
0 - 25
26 - 50
51 - 75
76 - 100
Annosus Root Diseaseon Red Fir (CA)
*Percent contribution to composite basal area loss attributed to the individual risk agent. Printing Date: October 30, 2007
0 100 200 30050Miles

Risk Model Worksheet - CaliforniaHost(s):
Model Extent: Max Percent Mortality:
Susceptibility
0%
Vulnerability
1 100%Annosus present present present Linear 1 100%
CommentsConstraints
Citations
Rank/Weight
Rank/Weight
Criteria 7Criteria 8Criteria 9Criteria 10
Criteria 3Criteria 4
Criteria 7Criteria 8
Criteria 5Criteria 6
Criteria 9Criteria 10
Criteria 1Criteria 2
Criteria 3Criteria 4Criteria 5Criteria 6
Weight
Model Certainity 1 - Data Driven
Risk Ends (d) Curve Rank
Model dependent on R5 root disease data.
Curve Rank Weight
100%
Risk Ends (d)
White Fir (Abies concolor )
Risk Begins (a)
Risk Peaks (b)Criterion
Risk Decreases (c)
Risk Agent(s): Annosus Root Disease
M262A and M262B
Criteria 1Criteria 2
40
presentCriterion
Risk Begins (a)
Risk Peaks (b)
Risk Decreases (c)

Risk* of Mortality
LegendLevel of risk for host
0 - 2 Little or no risk
3 - 4 Low risk
5 - 6 Medium risk
7 - 10 High risk
Annosus Root Diseaseon White Fir (CA)
Mortality Ceiling of 100%
*Risk of experiencing mortality at a given threshold over a 15 year period. Printing Date: October 31, 2007
0 100 200 30050Miles
M262A, B
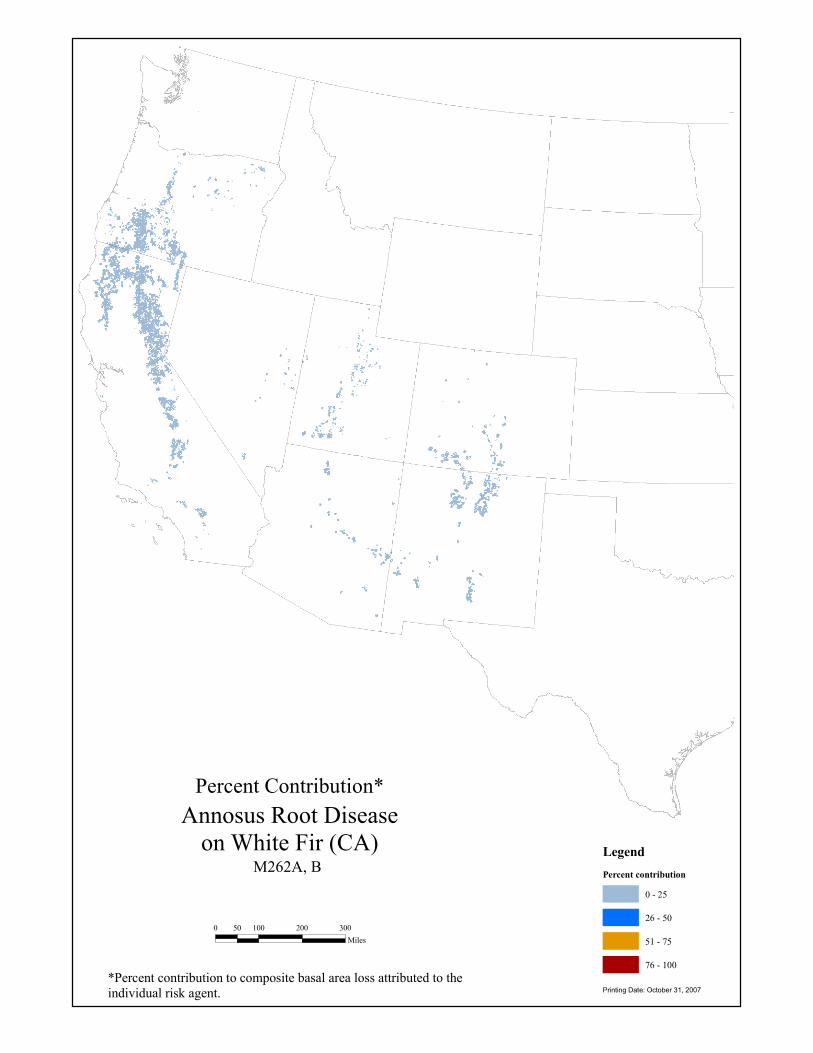
Percent Contribution*
LegendPercent contribution
0 - 25
26 - 50
51 - 75
76 - 100
Annosus Root Diseaseon White Fir (CA)
*Percent contribution to composite basal area loss attributed to the individual risk agent. Printing Date: October 31, 2007
0 100 200 30050Miles
M262A, B

Risk Model Worksheet - CaliforniaHost(s):
Model Extent: Max Percent Mortality:
Susceptibility
0%
Vulnerability
1 100%Annosus present present present Linear 1 100%
Comments
40
presentCriterion
Risk Begins (a)
Risk Peaks (b)
Risk Decreases (c)
Risk Agent(s): Annosus Root Disease
M261A, M261B, M261C, M261D, M261E, and M261G
Criteria 1Criteria 2
Risk Begins (a)
Risk Peaks (b)Criterion
Risk Decreases (c) Curve Rank Weight
80%
Risk Ends (d)
White Fir (Abies concolor )
Weight
Model Certainity 1 - Data Driven
Risk Ends (d) Curve Rank
Model dependent on R5 root disease data.
Criteria 3Criteria 4Criteria 5Criteria 6Criteria 7Criteria 8
Criteria 5Criteria 6
Criteria 9Criteria 10
Criteria 1Criteria 2
Constraints
Citations
Rank/Weight
Rank/Weight
Criteria 7Criteria 8Criteria 9Criteria 10
Criteria 3Criteria 4
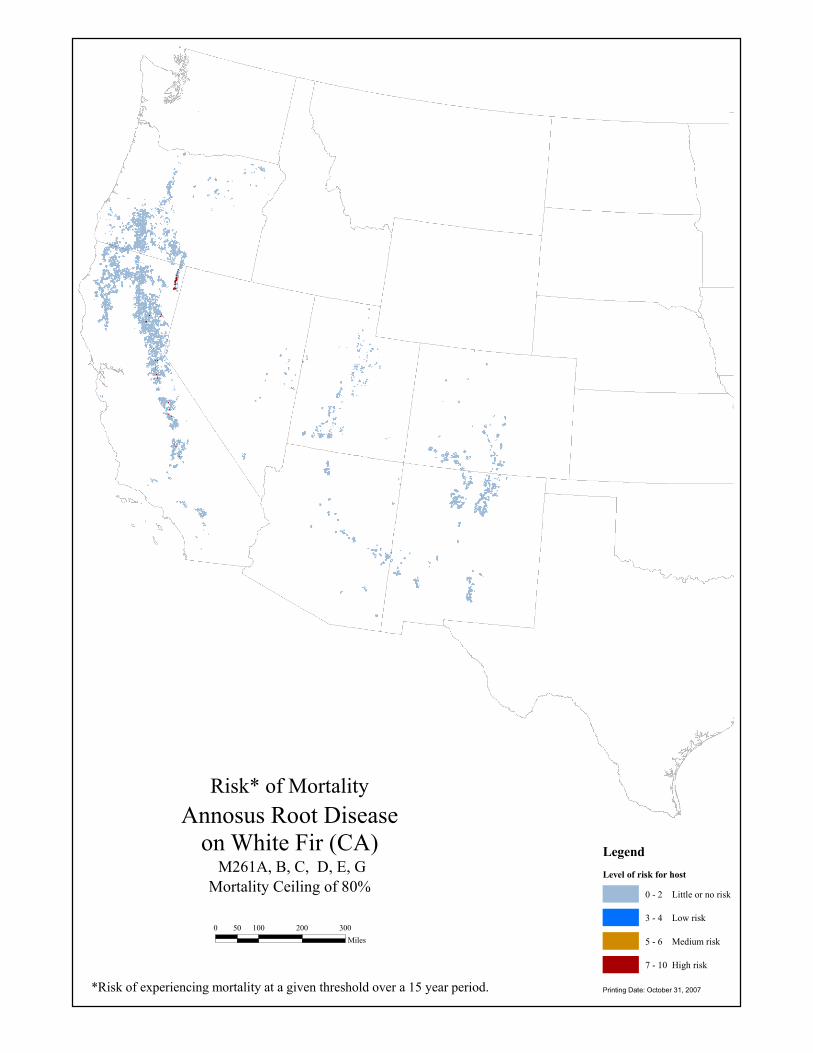
Risk* of Mortality
LegendLevel of risk for host
0 - 2 Little or no risk
3 - 4 Low risk
5 - 6 Medium risk
7 - 10 High risk
Annosus Root Diseaseon White Fir (CA)
Mortality Ceiling of 80%
*Risk of experiencing mortality at a given threshold over a 15 year period. Printing Date: October 31, 2007
0 100 200 30050Miles
M261A, B, C, D, E, G

Percent Contribution*
LegendPercent contribution
0 - 25
26 - 50
51 - 75
76 - 100
Annosus Root Diseaseon White Fir (CA)
*Percent contribution to composite basal area loss attributed to the individual risk agent. Printing Date: October 31, 2007
0 100 200 30050Miles
M261A, B, C, D, E, G
Risk Model Worksheet - CaliforniaHost(s):
Model Extent: Max Percent Mortality:
Susceptibility
0%
Vulnerability
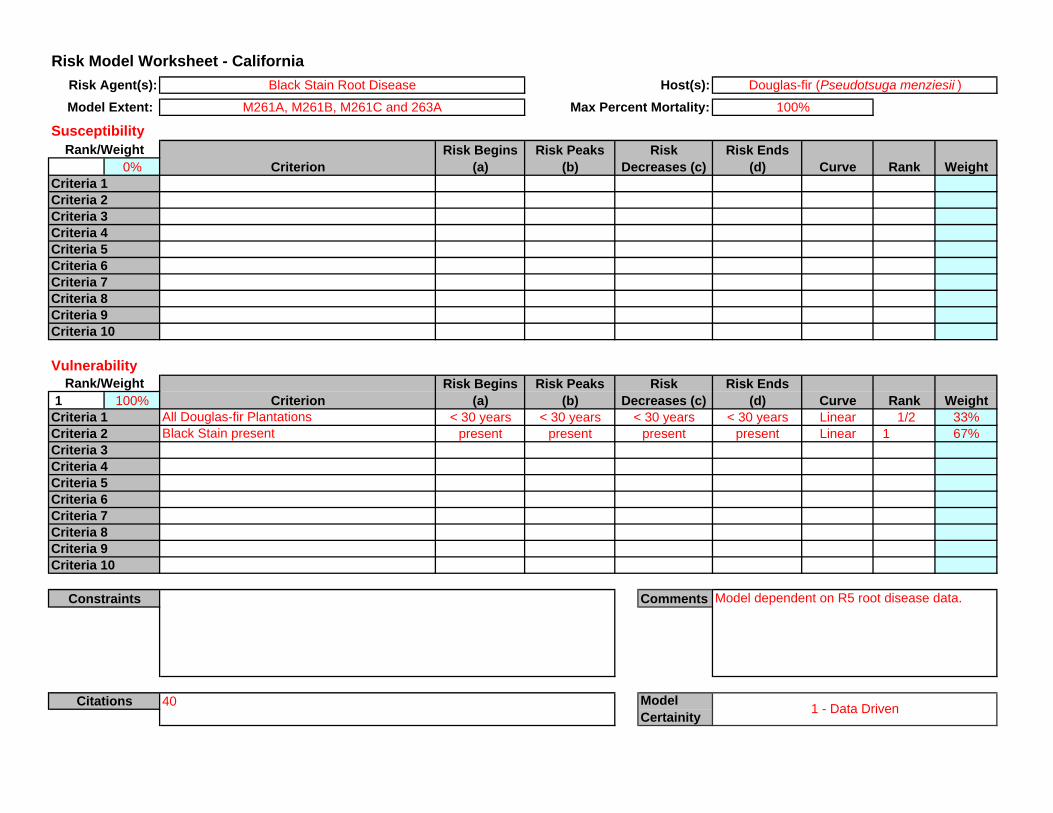
1 100%All Douglas-fir Plantations < 30 years < 30 years < 30 years Linear 1/2 33%Black Stain present present present present Linear 1 67%
Comments
40
< 30 yearsCriterion
Risk Begins (a)
Risk Peaks (b)
Risk Decreases (c)
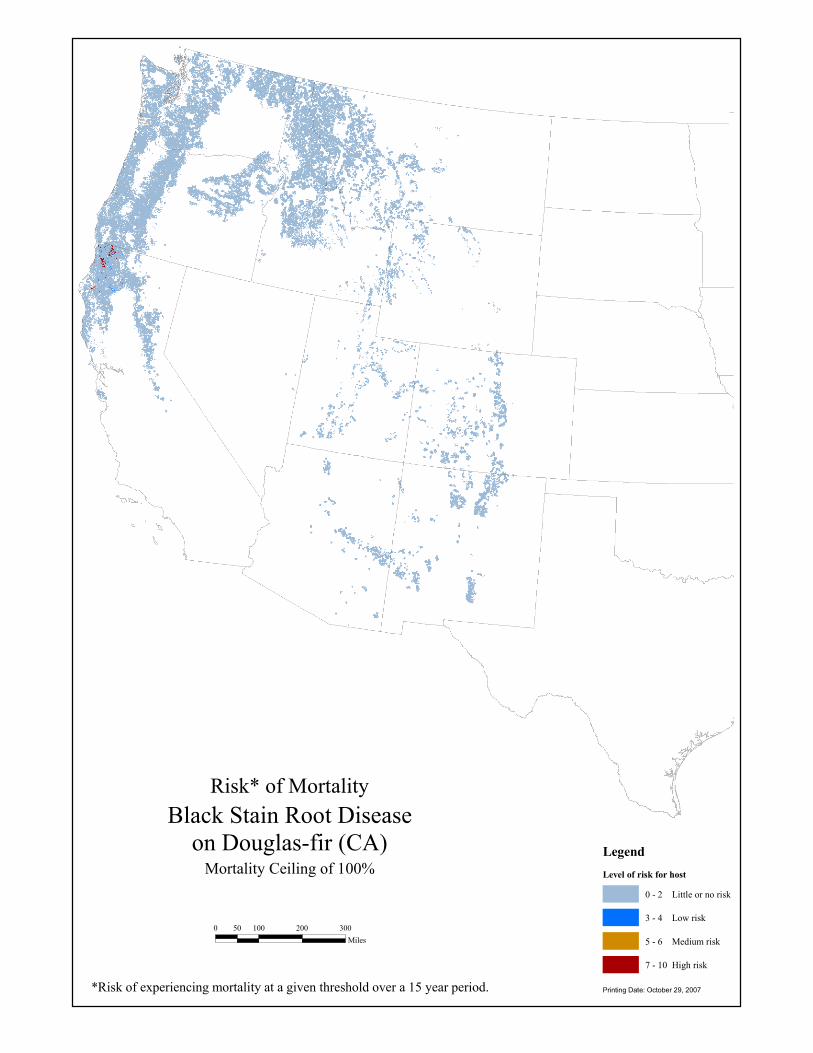
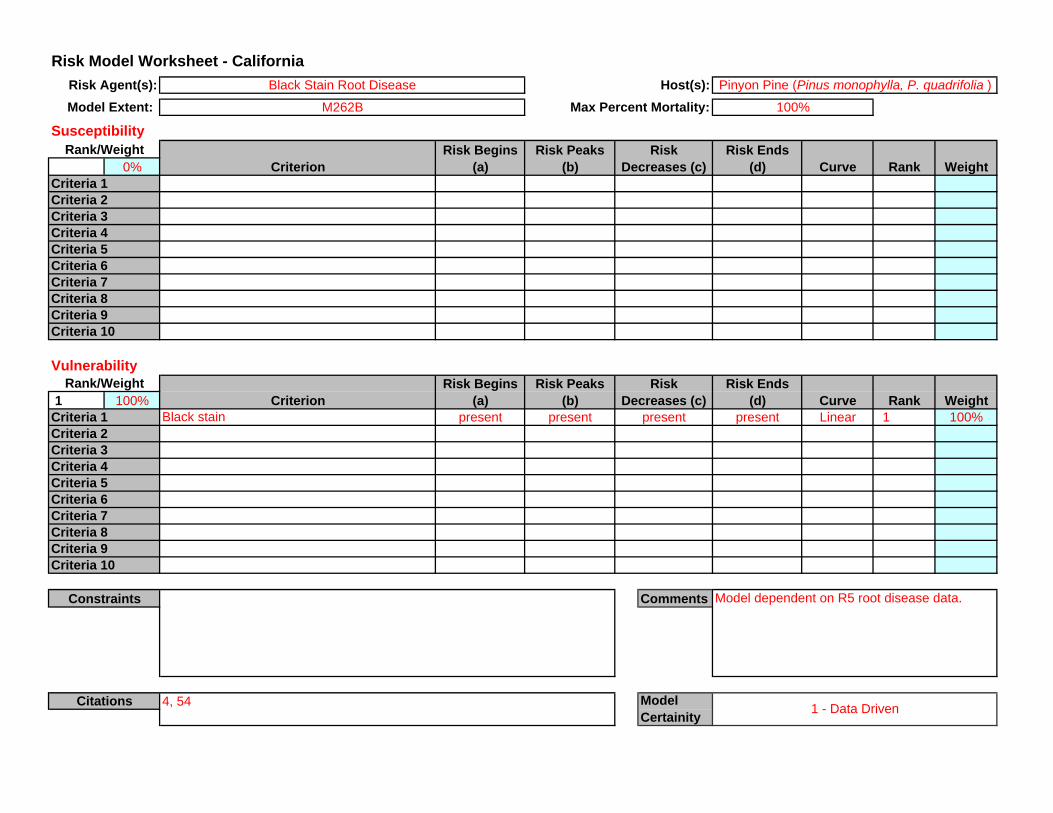
Risk Agent(s): Black Stain Root Disease
M261A, M261B, M261C and 263A
Criteria 1Criteria 2
Risk Begins (a)
Risk Peaks (b)Criterion
Risk Decreases (c) Curve Rank Weight
100%
Risk Ends (d)
Douglas-fir (Pseudotsuga menziesii )
Weight
Model Certainity 1 - Data Driven
Risk Ends (d) Curve Rank
Model dependent on R5 root disease data.
present
Criteria 3Criteria 4Criteria 5Criteria 6Criteria 7Criteria 8
Criteria 5Criteria 6
Criteria 9Criteria 10
Criteria 1Criteria 2
Constraints
Citations
Rank/Weight
Rank/Weight
Criteria 7Criteria 8Criteria 9Criteria 10
Criteria 3Criteria 4
Risk* of Mortality
LegendLevel of risk for host
0 - 2 Little or no risk
3 - 4 Low risk
5 - 6 Medium risk
7 - 10 High risk
Black Stain Root Diseaseon Douglas-fir (CA)
Mortality Ceiling of 100%
*Risk of experiencing mortality at a given threshold over a 15 year period. Printing Date: October 29, 2007
0 100 200 30050Miles

Percent Contribution*
LegendPercent contribution
0 - 25
26 - 50
51 - 75
76 - 100
Black Stain Root Diseaseon Douglas-fir (CA)
*Percent contribution to composite basal area loss attributed to the individual risk agent. Printing Date: October 29, 2007
0 100 200 30050Miles

Risk Model Worksheet - CaliforniaHost(s):
Model Extent: Max Percent Mortality:
Susceptibility
0%
Vulnerability
1 100%Black Stain present present present Linear 1 67%SDI 230 230 230 Linear 1/2 33%
CommentsConstraints
Citations
Rank/Weight
Rank/Weight
Criteria 7Criteria 8Criteria 9Criteria 10
Criteria 3Criteria 4
Criteria 7Criteria 8
Criteria 5Criteria 6
Criteria 9Criteria 10
Criteria 1Criteria 2
Criteria 3Criteria 4Criteria 5Criteria 6
Weight
Model Certainity 3 - Informed Professional Judgement
Risk Ends (d) Curve Rank
230
Curve Rank Weight
80%
Risk Ends (d)
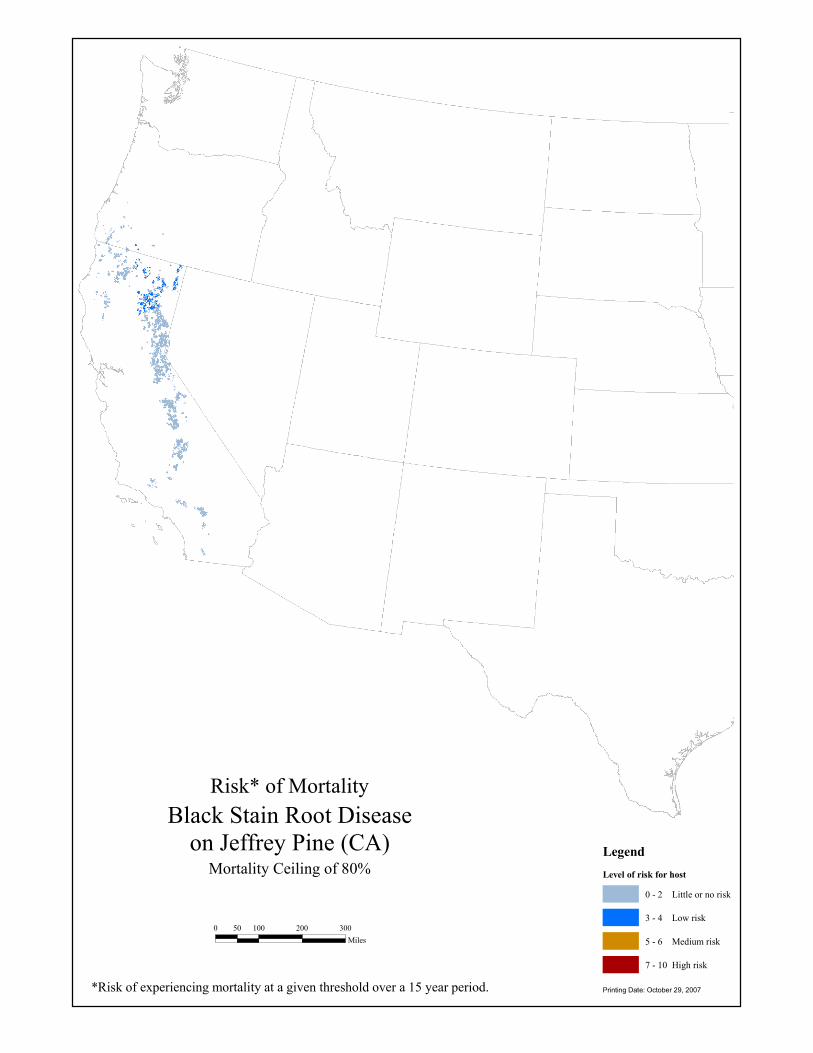
Jeffrey Pine (Pinus jeffreyi )
Risk Begins (a)
Risk Peaks (b)Criterion
Risk Decreases (c)
Risk Agent(s): Black Stain Root Disease
M261D and M261G
Criteria 1Criteria 2
40
presentCriterion
Risk Begins (a)
Risk Peaks (b)
Risk Decreases (c)
Risk* of Mortality
LegendLevel of risk for host
0 - 2 Little or no risk
3 - 4 Low risk
5 - 6 Medium risk
7 - 10 High risk
Black Stain Root Diseaseon Jeffrey Pine (CA)
Mortality Ceiling of 80%
*Risk of experiencing mortality at a given threshold over a 15 year period. Printing Date: October 29, 2007
0 100 200 30050Miles

Percent Contribution*
LegendPercent contribution
0 - 25
26 - 50
51 - 75
76 - 100
Black Stain Root Diseaseon Jeffrey Pine (CA)
*Percent contribution to composite basal area loss attributed to the individual risk agent. Printing Date: October 29, 2007
0 100 200 30050Miles

Risk Model Worksheet - CaliforniaHost(s):
Model Extent: Max Percent Mortality:
Susceptibility
0%
Vulnerability
1 100%Black Stain present present present Linear 1 100%
Comments
4, 54
presentCriterion
Risk Begins (a)
Risk Peaks (b)
Risk Decreases (c)
Risk Agent(s): Black Stain Root Disease
341D, 341F, M261E, and 322A
Criteria 1Criteria 2
M261E- Only southern portion
Risk Begins (a)
Risk Peaks (b)Criterion
Risk Decreases (c) Curve Rank Weight
70%
Risk Ends (d)
Pinyon Pine (P. monophylla, P. quadrifolia )
Weight
Model Certainity 1 - Data Driven
Risk Ends (d) Curve Rank
Model depedent on R5 root disease data.
Criteria 3Criteria 4Criteria 5Criteria 6Criteria 7Criteria 8
Criteria 5Criteria 6
Criteria 9Criteria 10
Criteria 1Criteria 2
Constraints
Citations
Rank/Weight
Rank/Weight
Criteria 7Criteria 8Criteria 9Criteria 10
Criteria 3Criteria 4

Risk* of Mortality
LegendLevel of risk for host
0 - 2 Little or no risk
3 - 4 Low risk
5 - 6 Medium risk
7 - 10 High risk
Black Stain Root Diseaseon Pinyon Pine (CA)
Mortality Ceiling of 70%
*Risk of experiencing mortality at a given threshold over a 15 year period. Printing Date: October 30, 2007
0 100 200 30050Miles
341D, F, M261E, 322A
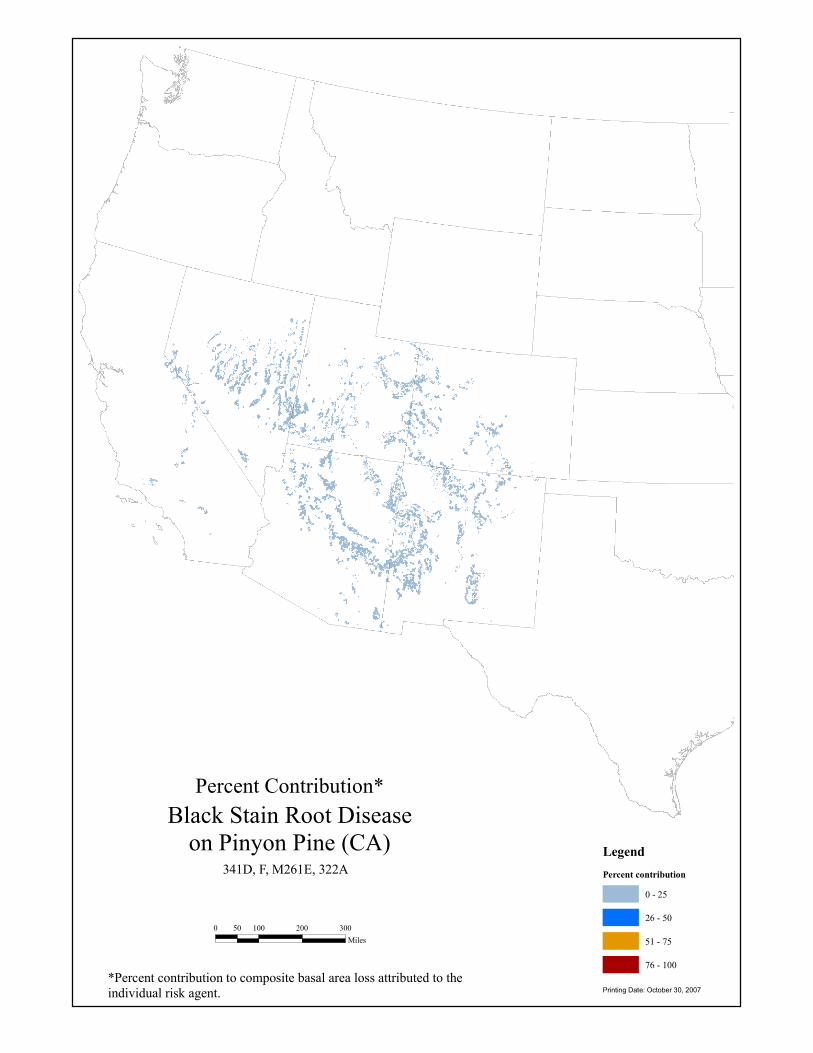
Percent Contribution*
LegendPercent contribution
0 - 25
26 - 50
51 - 75
76 - 100
Black Stain Root Diseaseon Pinyon Pine (CA)
*Percent contribution to composite basal area loss attributed to the individual risk agent. Printing Date: October 30, 2007
0 100 200 30050Miles
341D, F, M261E, 322A
Risk Model Worksheet - CaliforniaHost(s):
Model Extent: Max Percent Mortality:
Susceptibility
0%
Vulnerability
1 100%Black stain present present present Linear 1 100%
CommentsConstraints
Citations
Rank/Weight
Rank/Weight
Criteria 7Criteria 8Criteria 9Criteria 10
Criteria 3Criteria 4
Criteria 7Criteria 8
Criteria 5Criteria 6
Criteria 9Criteria 10
Criteria 1Criteria 2
Criteria 3Criteria 4Criteria 5Criteria 6
Weight
Model Certainity 1 - Data Driven
Risk Ends (d) Curve Rank
Model dependent on R5 root disease data.
Curve Rank Weight
100%
Risk Ends (d)
Pinyon Pine (Pinus monophylla, P. quadrifolia )
Risk Begins (a)
Risk Peaks (b)Criterion
Risk Decreases (c)
Risk Agent(s): Black Stain Root Disease
M262B
Criteria 1Criteria 2
4, 54
presentCriterion
Risk Begins (a)
Risk Peaks (b)
Risk Decreases (c)

Risk* of Mortality
LegendLevel of risk for host
0 - 2 Little or no risk
3 - 4 Low risk
5 - 6 Medium risk
7 - 10 High risk
Black Stain Root Diseaseon Pinyon Pine (CA)
Mortality Ceiling of 100%
*Risk of experiencing mortality at a given threshold over a 15 year period. Printing Date: October 30, 2007
0 100 200 30050Miles
M262B

Percent Contribution*
LegendPercent contribution
0 - 25
26 - 50
51 - 75
76 - 100
Black Stain Root Diseaseon Pinyon Pine (CA)
*Percent contribution to composite basal area loss attributed to the individual risk agent. Printing Date: October 30, 2007
0 100 200 30050Miles
M262B

Risk Model Worksheet - CaliforniaHost(s):
Model Extent: Max Percent Mortality:
Susceptibility
0%
Vulnerability
1 100%Black Stain present present present Linear 1 100%
CommentsConstraints
Citations
Rank/Weight
Rank/Weight
Criteria 7Criteria 8Criteria 9Criteria 10
Criteria 3Criteria 4
Criteria 7Criteria 8
Criteria 5Criteria 6
Criteria 9Criteria 10
Criteria 1Criteria 2
Criteria 3Criteria 4Criteria 5Criteria 6
Weight
Model Certainity 1 - Data Driven
Risk Ends (d) Curve Rank
Model dependent on R5 root disease data.
Curve Rank Weight
70%
Risk Ends (d)
Ponderosa Pine (Pinus ponderosa )
Risk Begins (a)
Risk Peaks (b)Criterion
Risk Decreases (c)
Risk Agent(s): Black Stain Root Disease
M261A, M261B, M261C, M261D, M261E, and M261G
Criteria 1Criteria 2
40
presentCriterion
Risk Begins (a)
Risk Peaks (b)
Risk Decreases (c)

Risk* of Mortality
LegendLevel of risk for host
0 - 2 Little or no risk
3 - 4 Low risk
5 - 6 Medium risk
7 - 10 High risk
Black Stain Root Diseaseon Ponderosa Pine (CA)
Mortality Ceiling of 70%
*Risk of experiencing mortality at a given threshold over a 15 year period. Printing Date: October 30, 2007
0 100 200 30050Miles

Percent Contribution*
LegendPercent contribution
0 - 25
26 - 50
51 - 75
76 - 100
Black Stain Root Diseaseon Ponderosa Pine (CA)
*Percent contribution to composite basal area loss attributed to the individual risk agent. Printing Date: October 30, 2007
0 100 200 30050Miles

Risk Model Worksheet - CaliforniaHost(s):
Model Extent: Max Percent Mortality:
Susceptibility
0%
Vulnerability
1 100%Host Stocking (%) 25 25 75 Linear 1 100%
CommentsConstraints
Citations
Rank/Weight
Rank/Weight
Criteria 7Criteria 8Criteria 9Criteria 10
Criteria 3Criteria 4
Criteria 7Criteria 8
Criteria 5Criteria 6
Criteria 9Criteria 10
Criteria 1Criteria 2
Criteria 3Criteria 4Criteria 5Criteria 6
Weight
Model Certainity 3 - Informed Professional Judgement
Risk Ends (d) Curve Rank
Curve Rank Weight
5%
Risk Ends (d)
White Fir (Abies concolor )
Risk Begins (a)
Risk Peaks (b)Criterion
Risk Decreases (c)
Risk Agent(s): Douglas-fir Tussock Moth
M261E and M261G
Criteria 1Criteria 2
23, 57, 58, 59
75Criterion
Risk Begins (a)
Risk Peaks (b)
Risk Decreases (c)
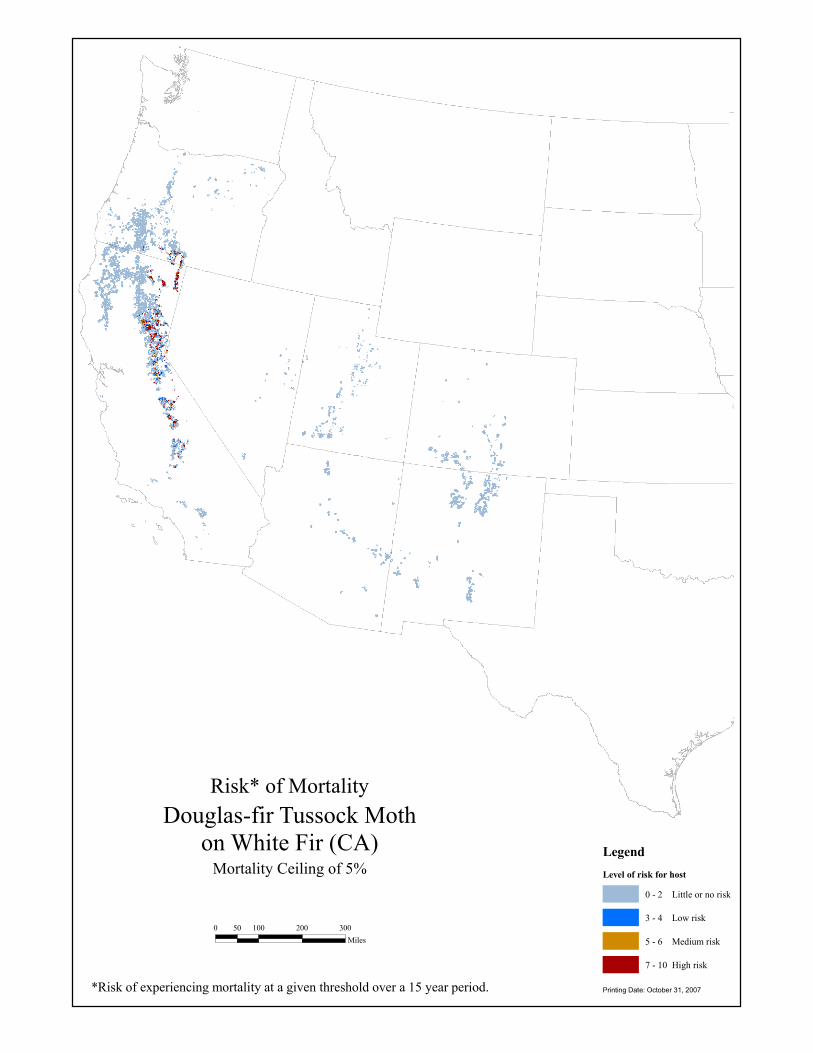
Risk* of Mortality
LegendLevel of risk for host
0 - 2 Little or no risk
3 - 4 Low risk
5 - 6 Medium risk
7 - 10 High risk
Douglas-fir Tussock Mothon White Fir (CA)
Mortality Ceiling of 5%
*Risk of experiencing mortality at a given threshold over a 15 year period. Printing Date: October 31, 2007
0 100 200 30050Miles

Percent Contribution*
LegendPercent contribution
0 - 25
26 - 50
51 - 75
76 - 100
Douglas-fir Tussock Mothon White Fir (CA)
*Percent contribution to composite basal area loss attributed to the individual risk agent. Printing Date: October 31, 2007
0 100 200 30050Miles

Risk Model Worksheet - CaliforniaHost(s):
Model Extent: Max Percent Mortality:
Susceptibility
0%
Vulnerability
1 100%Hawksworth Rating 1 6 6 Linear 1 100%
CommentsConstraints
Citations
Rank/Weight
Rank/Weight
Criteria 7Criteria 8Criteria 9Criteria 10
Criteria 3Criteria 4
Criteria 7Criteria 8
Criteria 5Criteria 6
Criteria 9Criteria 10
Criteria 1Criteria 2
Criteria 3Criteria 4Criteria 5Criteria 6
Weight
Model Certainity 3 - Informed Professional Judgement
Risk Ends (d) Curve Rank
Curve Rank Weight
10%
Risk Ends (d)
Douglas-fir (Pseudotsuga menziesii )
Risk Begins (a)
Risk Peaks (b)Criterion
Risk Decreases (c)
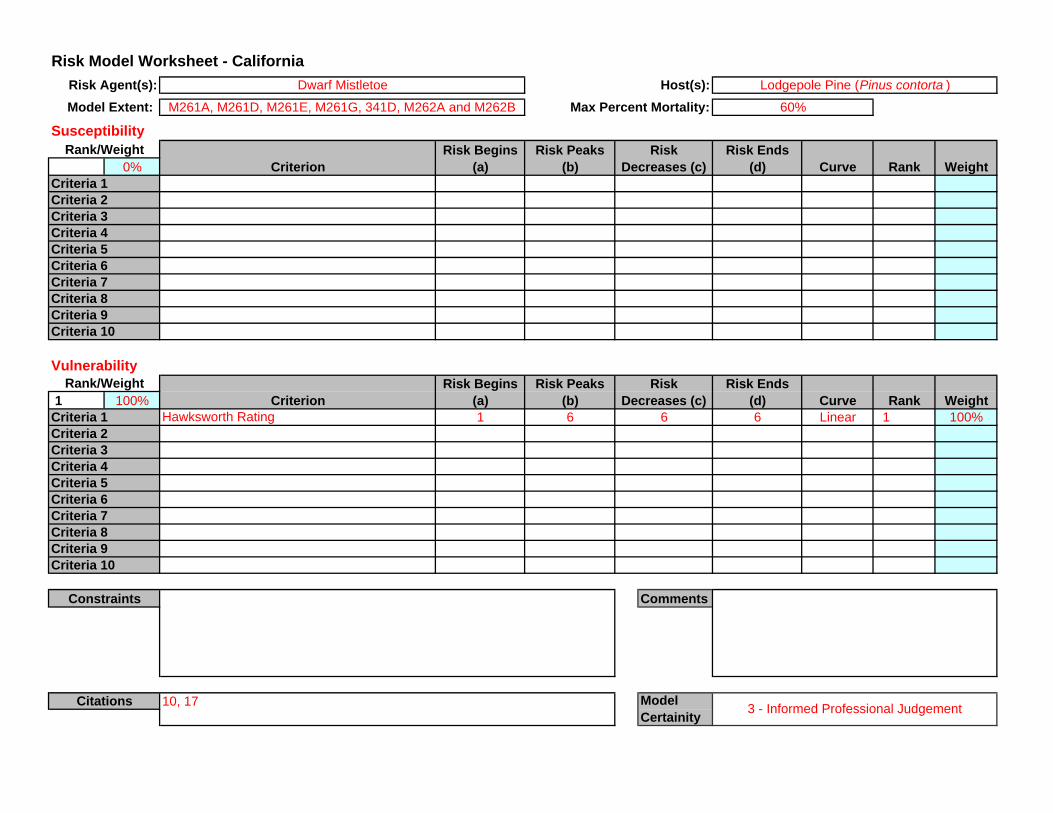
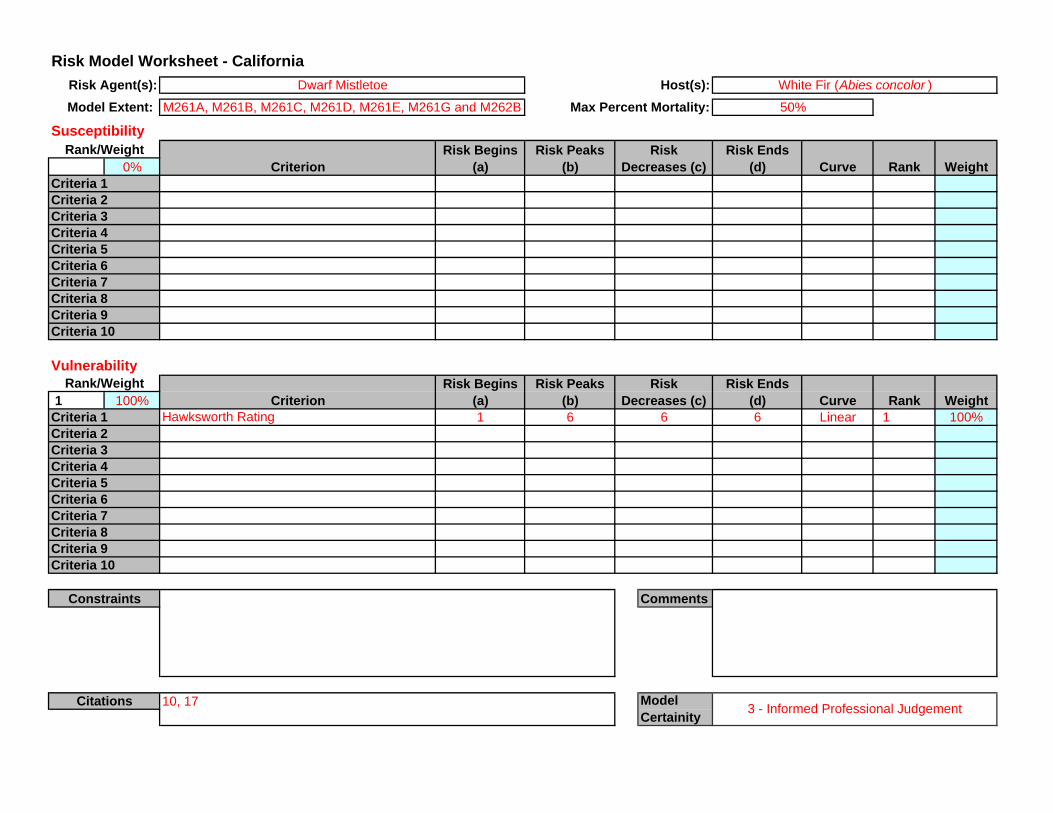
Risk Agent(s): Dwarf Mistletoe
M261A and M261D
Criteria 1Criteria 2
10, 17
6Criterion
Risk Begins (a)
Risk Peaks (b)
Risk Decreases (c)
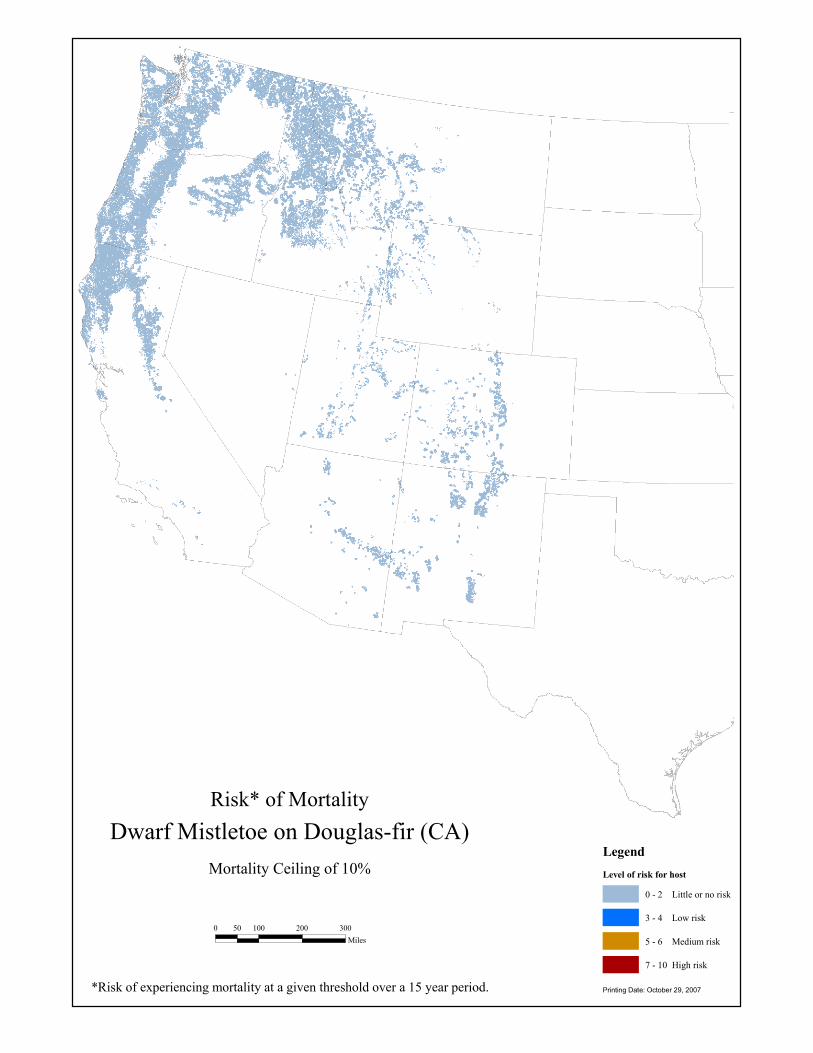
Risk* of Mortality
LegendLevel of risk for host
0 - 2 Little or no risk
3 - 4 Low risk
5 - 6 Medium risk
7 - 10 High risk
Dwarf Mistletoe on Douglas-fir (CA)Mortality Ceiling of 10%
*Risk of experiencing mortality at a given threshold over a 15 year period. Printing Date: October 29, 2007
0 100 200 30050Miles
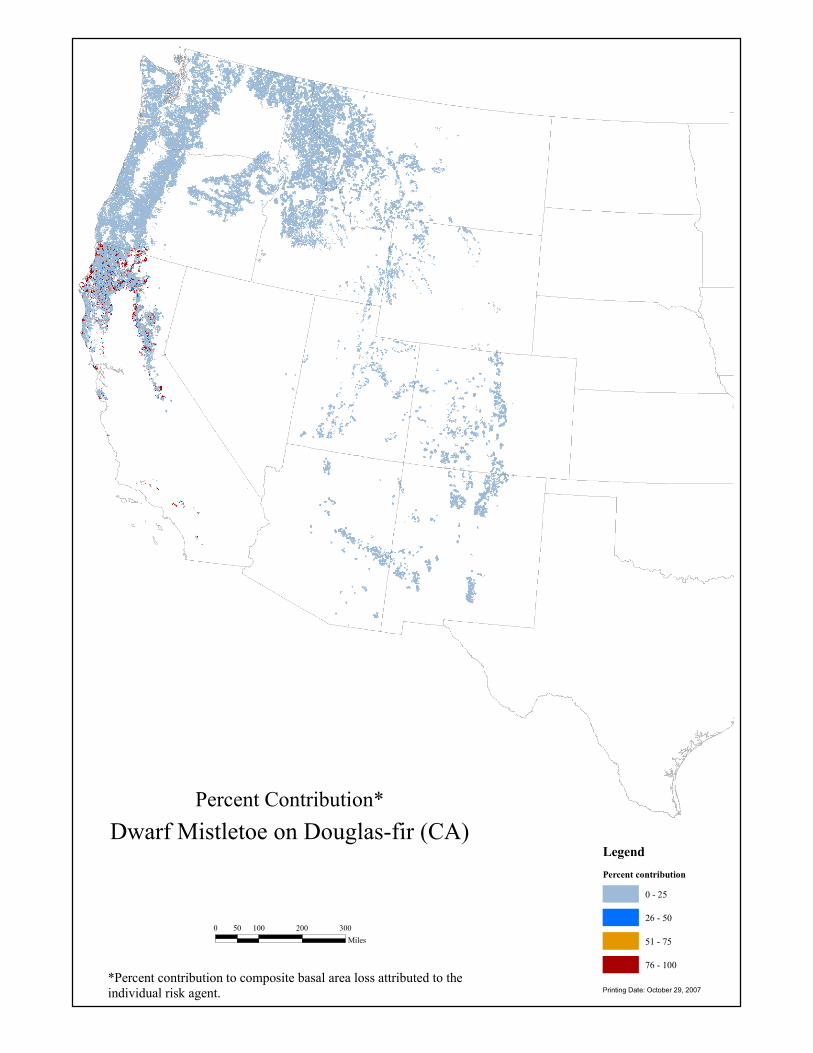
Percent Contribution*
LegendPercent contribution
0 - 25
26 - 50
51 - 75
76 - 100
Dwarf Mistletoe on Douglas-fir (CA)
*Percent contribution to composite basal area loss attributed to the individual risk agent. Printing Date: October 29, 2007
0 100 200 30050Miles

Risk Model Worksheet - CaliforniaHost(s):
Model Extent: Max Percent Mortality:
Susceptibility
0%
Vulnerability
1 100%Hawksworth Rating 1 6 6 Linear 1 100%
Comments
10, 17
6Criterion
Risk Begins (a)
Risk Peaks (b)
Risk Decreases (c)
Risk Agent(s): Dwarf Mistletoe
M262A and M262B
Criteria 1Criteria 2
Risk Begins (a)
Risk Peaks (b)Criterion
Risk Decreases (c) Curve Rank Weight
20%
Risk Ends (d)
Jeffrey Pine (Pinus jeffreyi )
Weight
Model Certainity 3 - Informed Professional Judgement
Risk Ends (d) Curve Rank
Criteria 3Criteria 4Criteria 5Criteria 6Criteria 7Criteria 8
Criteria 5Criteria 6
Criteria 9Criteria 10
Criteria 1Criteria 2
Constraints
Citations
Rank/Weight
Rank/Weight
Criteria 7Criteria 8Criteria 9Criteria 10
Criteria 3Criteria 4

Risk* of Mortality
LegendLevel of risk for host
0 - 2 Little or no risk
3 - 4 Low risk
5 - 6 Medium risk
7 - 10 High risk
Dwarf Mistletoe onJeffrey Pine (CA)
Mortality Ceiling of 20%
*Risk of experiencing mortality at a given threshold over a 15 year period. Printing Date: October 29, 2007
0 100 200 30050Miles
M262A, B

Percent Contribution*
LegendPercent contribution
0 - 25
26 - 50
51 - 75
76 - 100
Dwarf Mistletoe onJeffrey Pine (CA)
*Percent contribution to composite basal area loss attributed to the individual risk agent. Printing Date: October 29, 2007
0 100 200 30050Miles
M262A, B

Risk Model Worksheet - CaliforniaHost(s):
Model Extent: Max Percent Mortality:
Susceptibility
Vulnerability
Hawksworth Rating 1 6 6 Linear 1 100%
Comments
10, 17
6Criterion
Risk Begins (a)
Risk Peaks (b)
Risk Decreases (c)
Risk Agent(s): Dwarf Mistletoe
M261D, M261E and M261G
Criteria 1Criteria 2
Risk Begins (a)
Risk Peaks (b)Criterion
Risk Decreases (c) Curve Rank Weight
50%
Risk Ends (d)
Jeffrey Pine (Pinus jeffreyi )
Weight
Model Certainity 3 - Informed Professional Judgement
Risk Ends (d) Curve Rank
Criteria 3Criteria 4Criteria 5Criteria 6Criteria 7Criteria 8
Criteria 5Criteria 6
Criteria 9Criteria 10
Criteria 1Criteria 2
Constraints
Citations
Rank/Weight
Rank/Weight
Criteria 7Criteria 8Criteria 9Criteria 10
Criteria 3Criteria 4

Risk* of Mortality
LegendLevel of risk for host
0 - 2 Little or no risk
3 - 4 Low risk
5 - 6 Medium risk
7 - 10 High risk
Dwarf Mistletoe onJeffrey Pine (CA)
Mortality Ceiling of 50%
*Risk of experiencing mortality at a given threshold over a 15 year period. Printing Date: October 29, 2007
0 100 200 30050Miles
M261D, E, G

Percent Contribution*
LegendPercent contribution
0 - 25
26 - 50
51 - 75
76 - 100
Dwarf Mistletoe onJeffrey Pine (CA)
*Percent contribution to composite basal area loss attributed to the individual risk agent. Printing Date: October 29, 2007
0 100 200 30050Miles
M261D, E, G
Risk Model Worksheet - CaliforniaHost(s):
Model Extent: Max Percent Mortality:
Susceptibility
0%
Vulnerability
1 100%Hawksworth Rating 1 6 6 Linear 1 100%
CommentsConstraints
Citations
Rank/Weight
Rank/Weight
Criteria 7Criteria 8Criteria 9Criteria 10
Criteria 3Criteria 4
Criteria 7Criteria 8
Criteria 5Criteria 6
Criteria 9Criteria 10
Criteria 1Criteria 2
Criteria 3Criteria 4Criteria 5Criteria 6
Weight
Model Certainity 3 - Informed Professional Judgement
Risk Ends (d) Curve Rank
Curve Rank Weight
60%
Risk Ends (d)
Lodgepole Pine (Pinus contorta )
Risk Begins (a)
Risk Peaks (b)Criterion
Risk Decreases (c)
Risk Agent(s): Dwarf Mistletoe
M261A, M261D, M261E, M261G, 341D, M262A and M262B
Criteria 1Criteria 2
10, 17
6Criterion
Risk Begins (a)
Risk Peaks (b)
Risk Decreases (c)

Risk* of Mortality
LegendLevel of risk for host
0 - 2 Little or no risk
3 - 4 Low risk
5 - 6 Medium risk
7 - 10 High risk
Dwarf Mistletoeon Lodgepole Pine (CA)
Mortality Ceiling of 60%
*Risk of experiencing mortality at a given threshold over a 15 year period. Printing Date: October 30, 2007
0 100 200 30050Miles
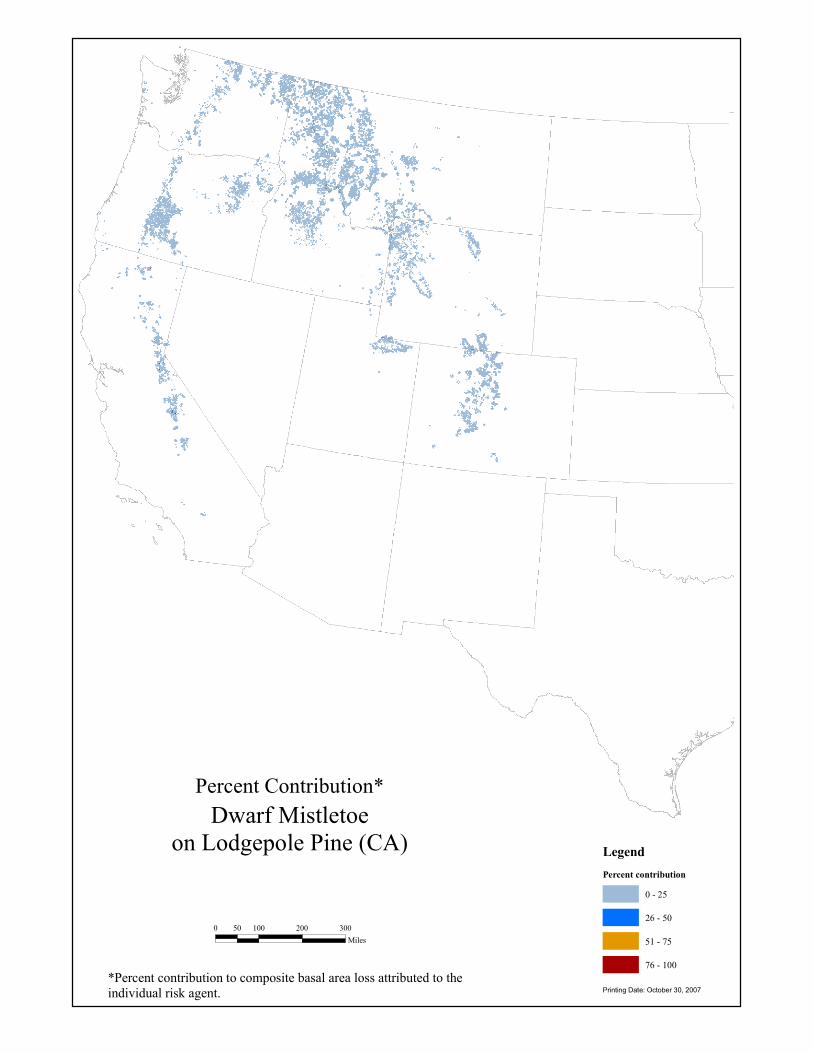
Percent Contribution*
LegendPercent contribution
0 - 25
26 - 50
51 - 75
76 - 100
Dwarf Mistletoeon Lodgepole Pine (CA)
*Percent contribution to composite basal area loss attributed to the individual risk agent. Printing Date: October 30, 2007
0 100 200 30050Miles

Risk Model Worksheet - CaliforniaHost(s):
Model Extent: Max Percent Mortality:
Susceptibility
0%
Vulnerability
1 100%Hawksworth Rating 1 6 6 Linear 1 100%
CommentsConstraints
Citations
Rank/Weight
Rank/Weight
Criteria 7Criteria 8Criteria 9Criteria 10
Criteria 3Criteria 4
Criteria 7Criteria 8
Criteria 5Criteria 6
Criteria 9Criteria 10
Criteria 1Criteria 2
Criteria 3Criteria 4Criteria 5Criteria 6
Weight
Model Certainity 3 - Informed Professional Judgement
Risk Ends (d) Curve Rank
Curve Rank Weight
50%
Risk Ends (d)
Pinyon Pine (Pinus monophylla, P. quadrifolia )
Risk Begins (a)
Risk Peaks (b)Criterion
Risk Decreases (c)
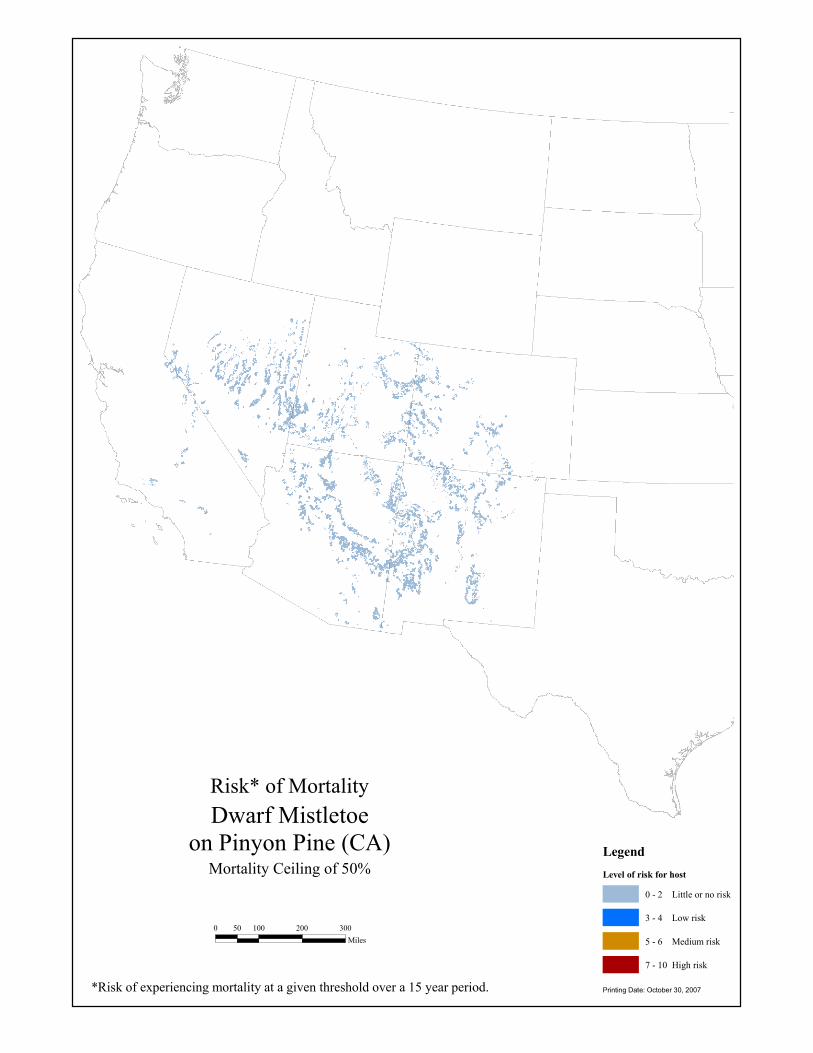
Risk Agent(s): Dwarf Mistletoe
M262B, 322A, B, C, 341D, and 341F
Criteria 1Criteria 2
10, 17
6Criterion
Risk Begins (a)
Risk Peaks (b)
Risk Decreases (c)
Risk* of Mortality
LegendLevel of risk for host
0 - 2 Little or no risk
3 - 4 Low risk
5 - 6 Medium risk
7 - 10 High risk
Dwarf Mistletoeon Pinyon Pine (CA)
Mortality Ceiling of 50%
*Risk of experiencing mortality at a given threshold over a 15 year period. Printing Date: October 30, 2007
0 100 200 30050Miles
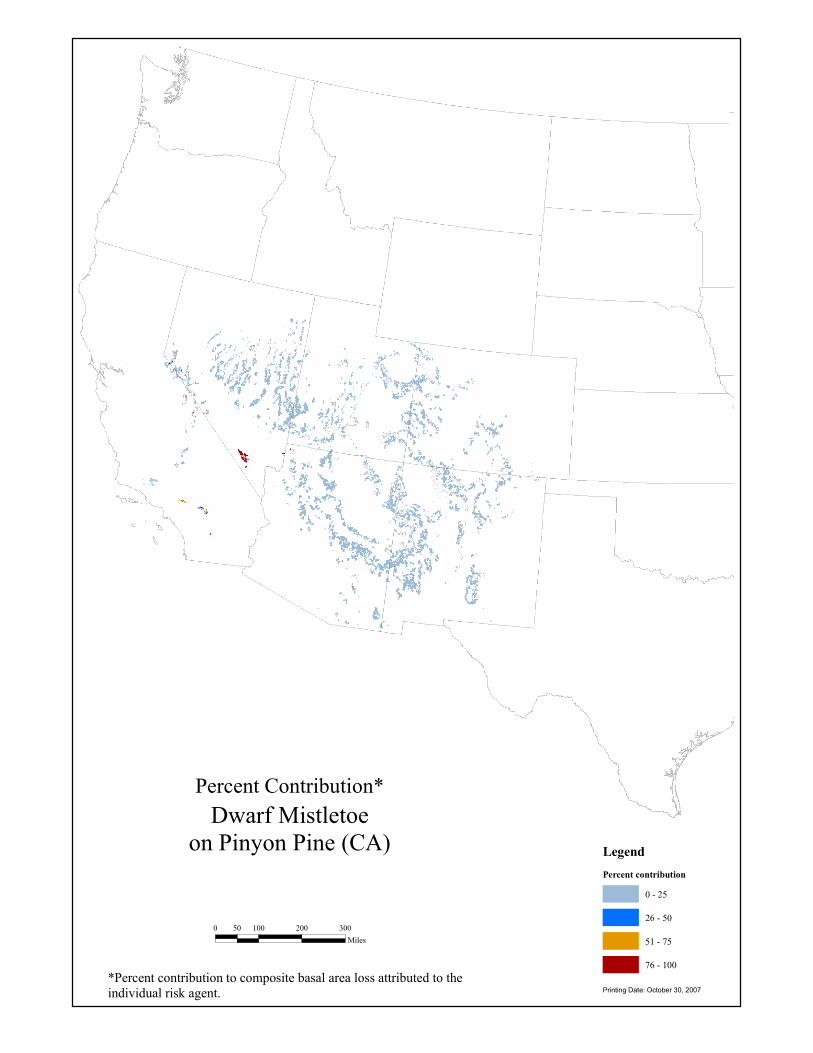
Percent Contribution*
LegendPercent contribution
0 - 25
26 - 50
51 - 75
76 - 100
Dwarf Mistletoeon Pinyon Pine (CA)
*Percent contribution to composite basal area loss attributed to the individual risk agent. Printing Date: October 30, 2007
0 100 200 30050Miles

Risk Model Worksheet - CaliforniaHost(s):
Model Extent: Max Percent Mortality:
Susceptibility
0 0%
Vulnerability
1 100%Hawksworth Rating 1 6 6 Linear 1 100%
CommentsConstraints
Citations
Rank/Weight
Rank/Weight
Criteria 7Criteria 8Criteria 9Criteria 10
Criteria 3Criteria 4
Criteria 7Criteria 8
Criteria 5Criteria 6
Criteria 9Criteria 10
Criteria 1Criteria 2
Criteria 3Criteria 4Criteria 5Criteria 6
Weight
Model Certainity 3 - Informed Professional Judgement
Risk Ends (d) Curve Rank
Curve Rank Weight
60%
Risk Ends (d)
Ponderosa Pine (Pinus ponderosa )
Risk Begins (a)
Risk Peaks (b)Criterion
Risk Decreases (c)
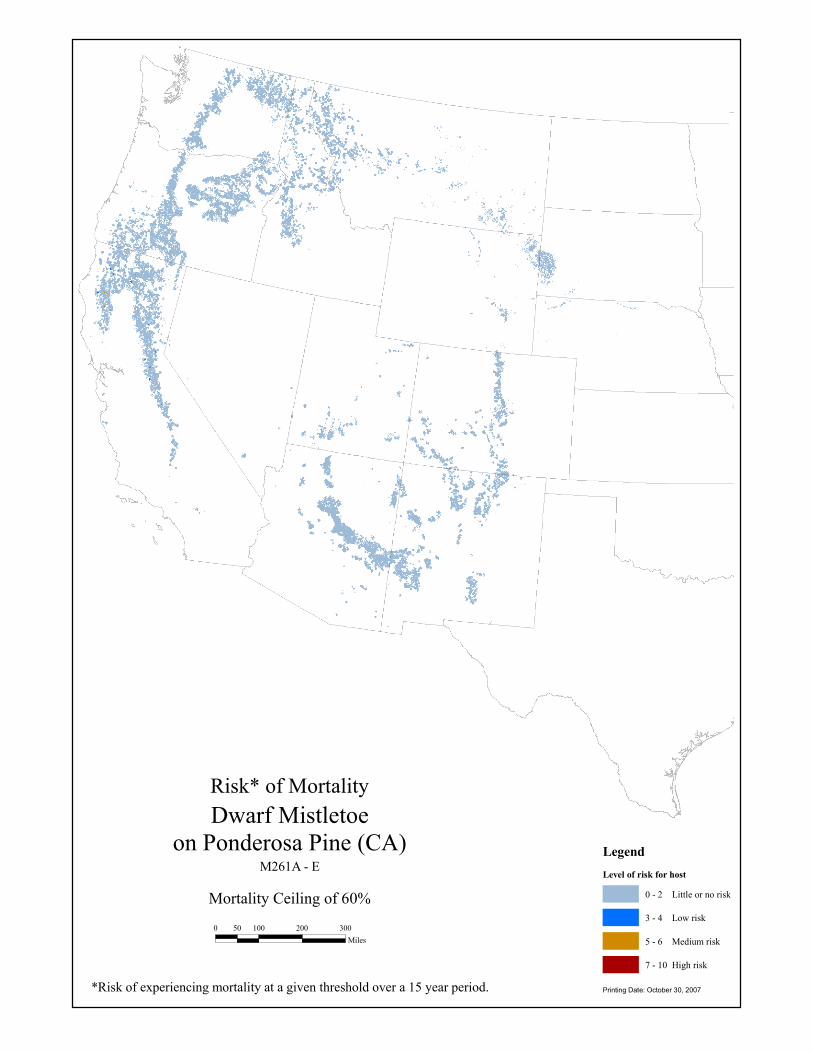
Risk Agent(s): Dwarf Mistletoe
M261A, M261B, M261D, M261C, and M261E
Criteria 1Criteria 2
10, 17
6Criterion
Risk Begins (a)
Risk Peaks (b)
Risk Decreases (c)
Risk* of Mortality
LegendLevel of risk for host
0 - 2 Little or no risk
3 - 4 Low risk
5 - 6 Medium risk
7 - 10 High risk
Dwarf Mistletoeon Ponderosa Pine (CA)
Mortality Ceiling of 60%
*Risk of experiencing mortality at a given threshold over a 15 year period. Printing Date: October 30, 2007
0 100 200 30050Miles
M261A - E
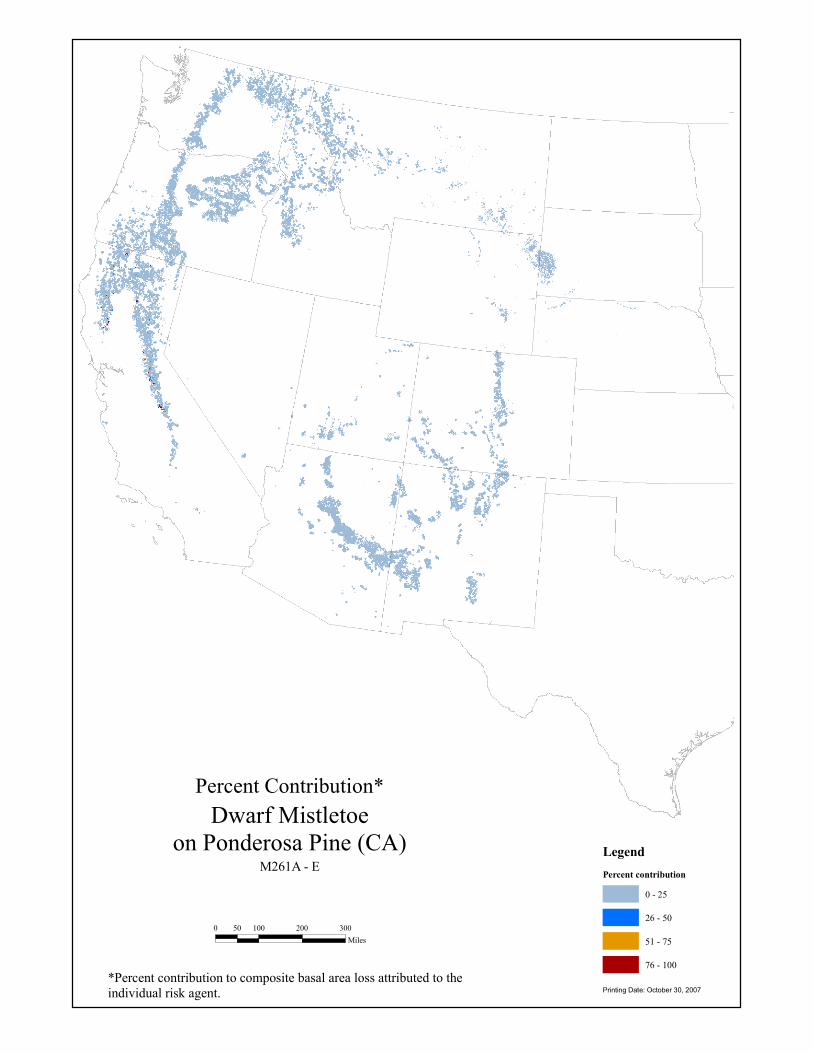
Percent Contribution*
LegendPercent contribution
0 - 25
26 - 50
51 - 75
76 - 100
Dwarf Mistletoeon Ponderosa Pine (CA)
*Percent contribution to composite basal area loss attributed to the individual risk agent. Printing Date: October 30, 2007
0 100 200 30050Miles
M261A - E

Risk Model Worksheet - CaliforniaHost(s):
Model Extent: Max Percent Mortality:
Susceptibility
0%
Vulnerability
1 100%Mistletoe Hawksworth Rating 1 6 6 Linear 1 100%
Comments
10, 17
6Criterion
Risk Begins (a)
Risk Peaks (b)
Risk Decreases (c)
Risk Agent(s): Dwarf Mistletoe
M262A and M262B
Criteria 1Criteria 2
Risk Begins (a)
Risk Peaks (b)Criterion
Risk Decreases (c) Curve Rank Weight
50%
Risk Ends (d)
Ponderosa Pine (Pinus ponderosa )
Weight
Model Certainity 3 - Informed Professional Judgement
Risk Ends (d) Curve Rank
Criteria 3Criteria 4Criteria 5Criteria 6Criteria 7Criteria 8
Criteria 5Criteria 6
Criteria 9Criteria 10
Criteria 1Criteria 2
Constraints
Citations
Rank/Weight
Rank/Weight
Criteria 7Criteria 8Criteria 9Criteria 10
Criteria 3Criteria 4

Risk* of Mortality
LegendLevel of risk for host
0 - 2 Little or no risk
3 - 4 Low risk
5 - 6 Medium risk
7 - 10 High risk
Dwarf Mistletoeon Ponderosa Pine (CA)
Mortality Ceiling of 50%
*Risk of experiencing mortality at a given threshold over a 15 year period. Printing Date: October 30, 2007
0 100 200 30050Miles
M262A, B
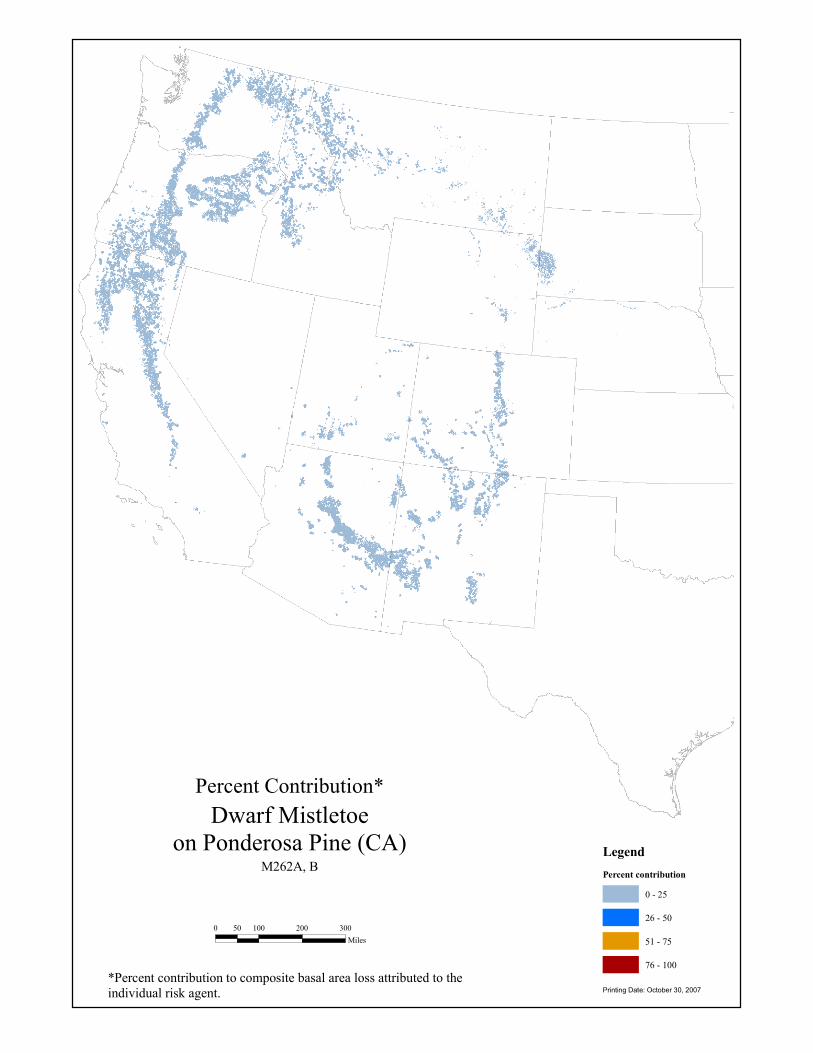
Percent Contribution*
LegendPercent contribution
0 - 25
26 - 50
51 - 75
76 - 100
Dwarf Mistletoeon Ponderosa Pine (CA)
*Percent contribution to composite basal area loss attributed to the individual risk agent. Printing Date: October 30, 2007
0 100 200 30050Miles
M262A, B

Risk Model Worksheet - CaliforniaHost(s):
Model Extent: Max Percent Mortality:
Susceptibility
0%
Vulnerability
1 100%Hawksworth Rating 1 6 6 Linear 1 100%
CommentsConstraints
Citations
Rank/Weight
Rank/Weight
Criteria 7Criteria 8Criteria 9Criteria 10
Criteria 3Criteria 4
Criteria 7Criteria 8
Criteria 5Criteria 6
Criteria 9Criteria 10
Criteria 1Criteria 2
Criteria 3Criteria 4Criteria 5Criteria 6
Weight
Model Certainity 3 - Informed Professional Judgement
Risk Ends (d) Curve Rank
Curve Rank Weight
50%
Risk Ends (d)
Red Fir (Abies magnifica )
Risk Begins (a)
Risk Peaks (b)Criterion
Risk Decreases (c)
Risk Agent(s): Dwarf Mistletoe
M261A, M261B, M261C, M261D, M261E and M261G
Criteria 1Criteria 2
10, 17
6Criterion
Risk Begins (a)
Risk Peaks (b)
Risk Decreases (c)
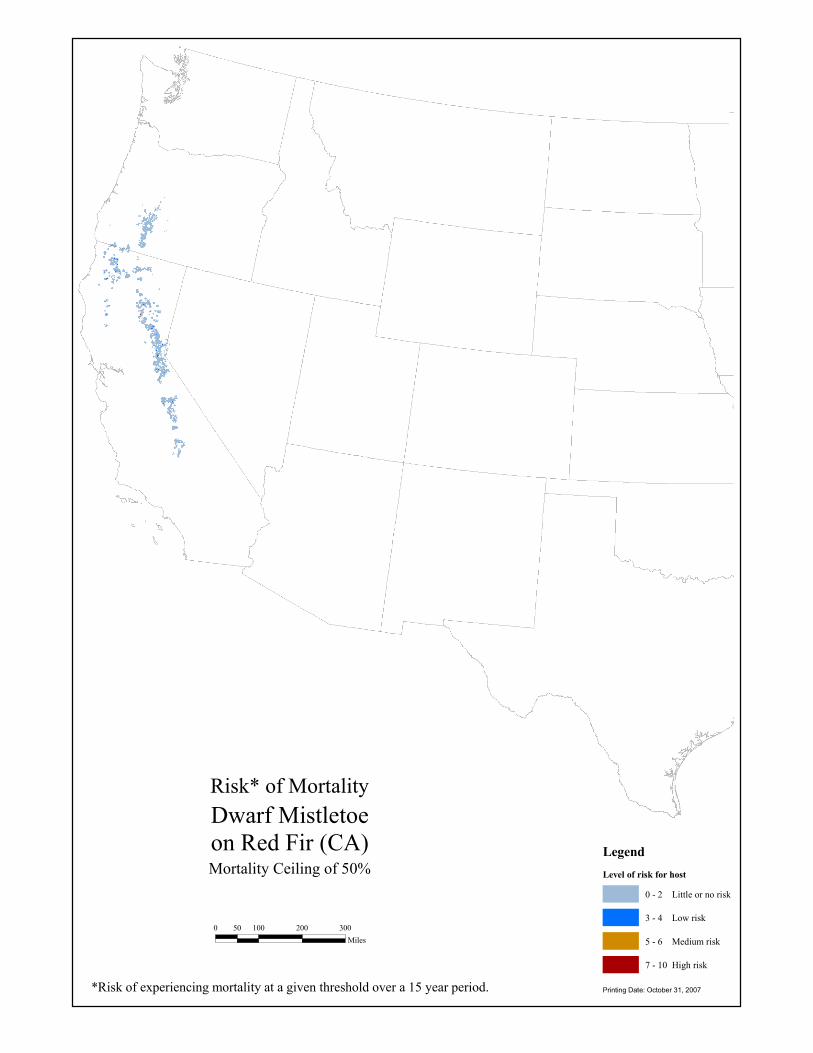
Risk* of Mortality
LegendLevel of risk for host
0 - 2 Little or no risk
3 - 4 Low risk
5 - 6 Medium risk
7 - 10 High risk
Dwarf Mistletoeon Red Fir (CA)Mortality Ceiling of 50%
*Risk of experiencing mortality at a given threshold over a 15 year period. Printing Date: October 31, 2007
0 100 200 30050Miles
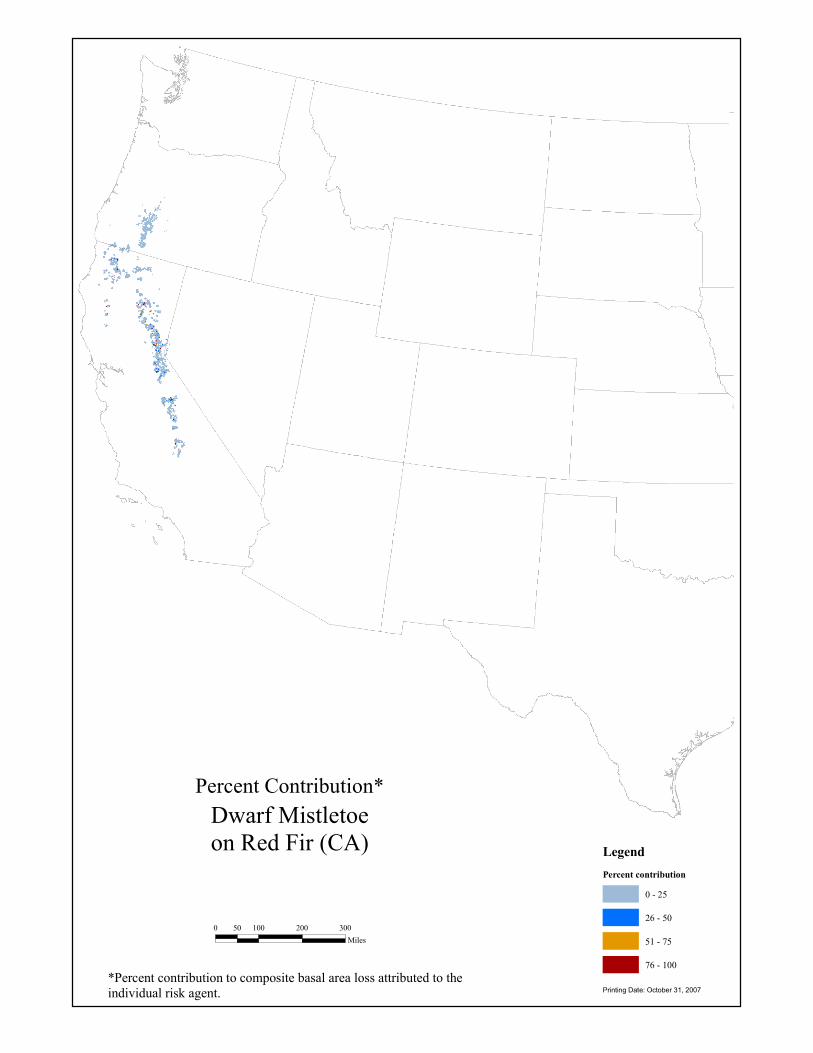
Percent Contribution*
LegendPercent contribution
0 - 25
26 - 50
51 - 75
76 - 100
Dwarf Mistletoeon Red Fir (CA)
*Percent contribution to composite basal area loss attributed to the individual risk agent. Printing Date: October 31, 2007
0 100 200 30050Miles
Risk Model Worksheet - CaliforniaHost(s):
Model Extent: Max Percent Mortality:
Susceptibility
0%
Vulnerability
1 100%Hawksworth Rating 1 6 6 Linear 1 100%
Comments
10, 17
6Criterion
Risk Begins (a)
Risk Peaks (b)
Risk Decreases (c)
Risk Agent(s): Dwarf Mistletoe
M261A, M261B, M261C, M261D, M261E, M261G and M262B
Criteria 1Criteria 2
Risk Begins (a)
Risk Peaks (b)Criterion
Risk Decreases (c) Curve Rank Weight
50%
Risk Ends (d)
White Fir (Abies concolor )
Weight
Model Certainity 3 - Informed Professional Judgement
Risk Ends (d) Curve Rank
Criteria 3Criteria 4Criteria 5Criteria 6Criteria 7Criteria 8
Criteria 5Criteria 6
Criteria 9Criteria 10
Criteria 1Criteria 2
Constraints
Citations
Rank/Weight
Rank/Weight
Criteria 7Criteria 8Criteria 9Criteria 10
Criteria 3Criteria 4
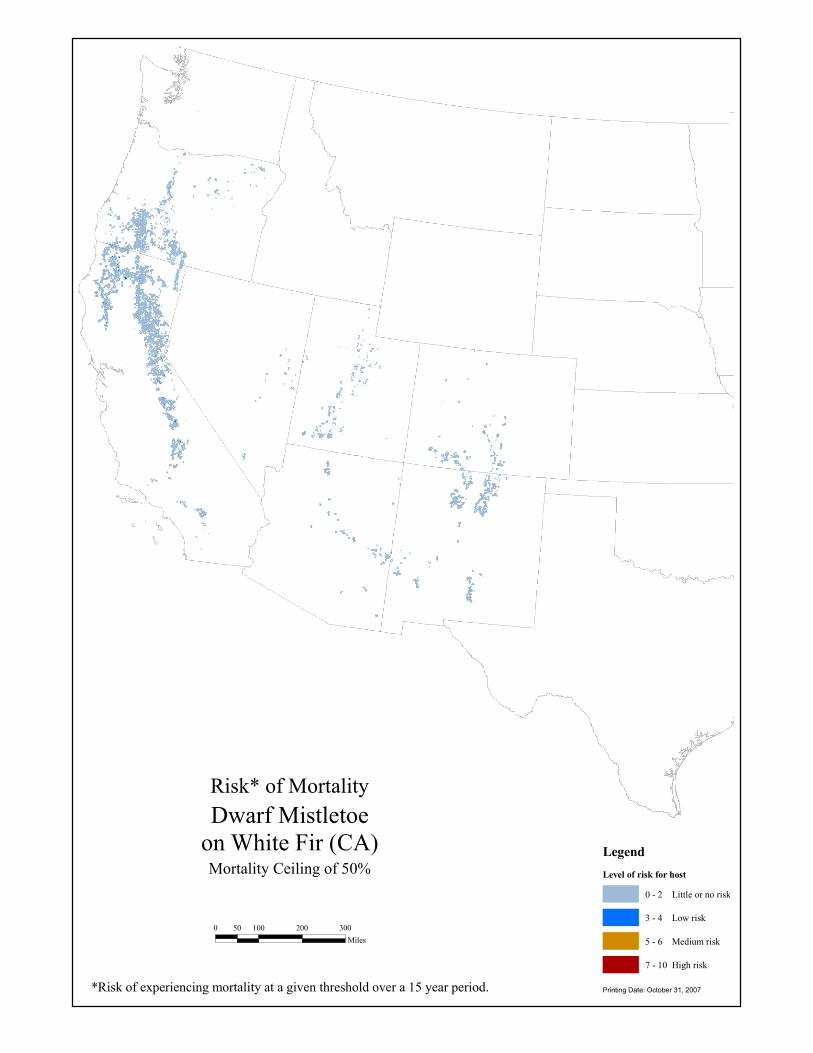
Risk* of Mortality
LegendLevel of risk for host
0 - 2 Little or no risk
3 - 4 Low risk
5 - 6 Medium risk
7 - 10 High risk
Dwarf Mistletoeon White Fir (CA)Mortality Ceiling of 50%
*Risk of experiencing mortality at a given threshold over a 15 year period. Printing Date: October 31, 2007
0 100 200 30050Miles
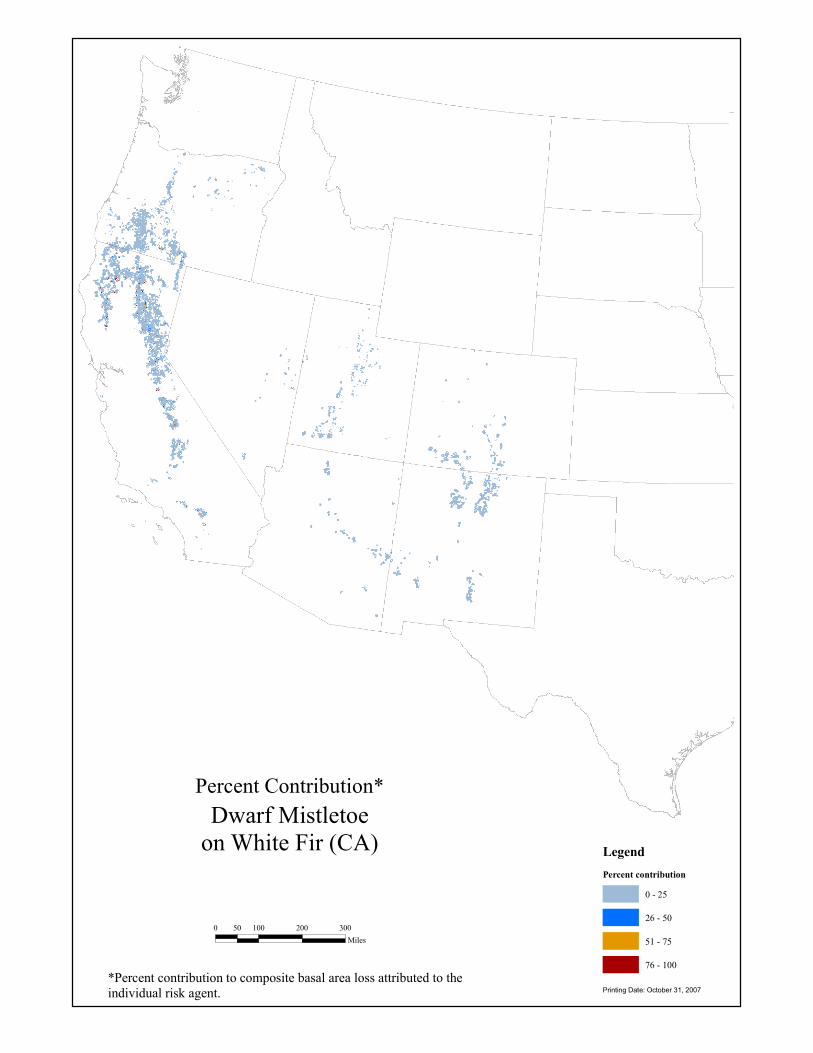
Percent Contribution*
LegendPercent contribution
0 - 25
26 - 50
51 - 75
76 - 100
Dwarf Mistletoeon White Fir (CA)
*Percent contribution to composite basal area loss attributed to the individual risk agent. Printing Date: October 31, 2007
0 100 200 30050Miles

Risk Model Worksheet - CaliforniaHost(s):
Model Extent: Max Percent Mortality:
Susceptibility
0%
Vulnerability
1 100%SDI 230 440 440 Linear 1 100%
Comments
43, 48
440Criterion
Risk Begins (a)
Risk Peaks (b)
Risk Decreases (c)
Risk Agent(s): Fir Engraver Beetle
M261A, M261B, and M261C
Criteria 1Criteria 2
Risk Begins (a)
Risk Peaks (b)Criterion
Risk Decreases (c) Curve Rank Weight
60%
Risk Ends (d)
Red Fir (Abies magnifica )
Weight
Model Certainity 3 - Informed Professional Judgement
Risk Ends (d) Curve Rank
Criteria 3Criteria 4Criteria 5Criteria 6Criteria 7Criteria 8
Criteria 5Criteria 6
Criteria 9Criteria 10
Criteria 1Criteria 2
Constraints
Citations
Rank/Weight
Rank/Weight
Criteria 7Criteria 8Criteria 9Criteria 10
Criteria 3Criteria 4

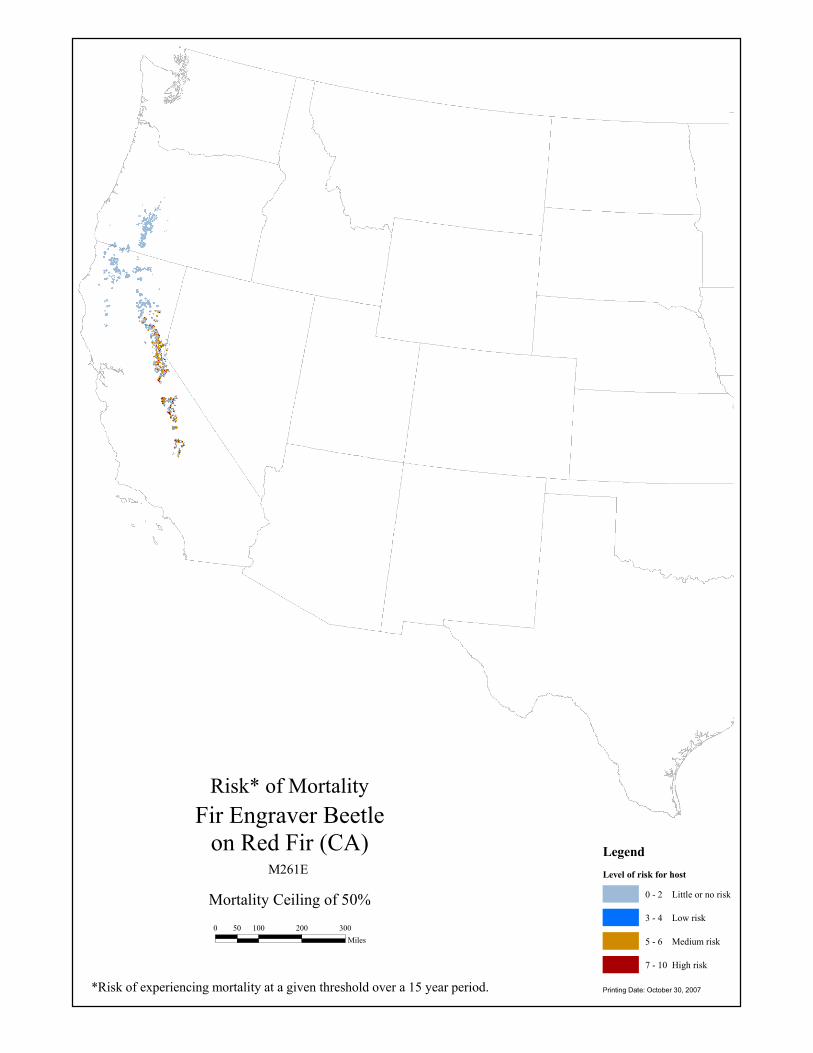
Risk* of Mortality
LegendLevel of risk for host
0 - 2 Little or no risk
3 - 4 Low risk
5 - 6 Medium risk
7 - 10 High risk
Fir Engraver Beetleon Red Fir (CA)
Mortality Ceiling of 60%
*Risk of experiencing mortality at a given threshold over a 15 year period. Printing Date: October 30, 2007
0 100 200 30050Miles
M261A, B, C
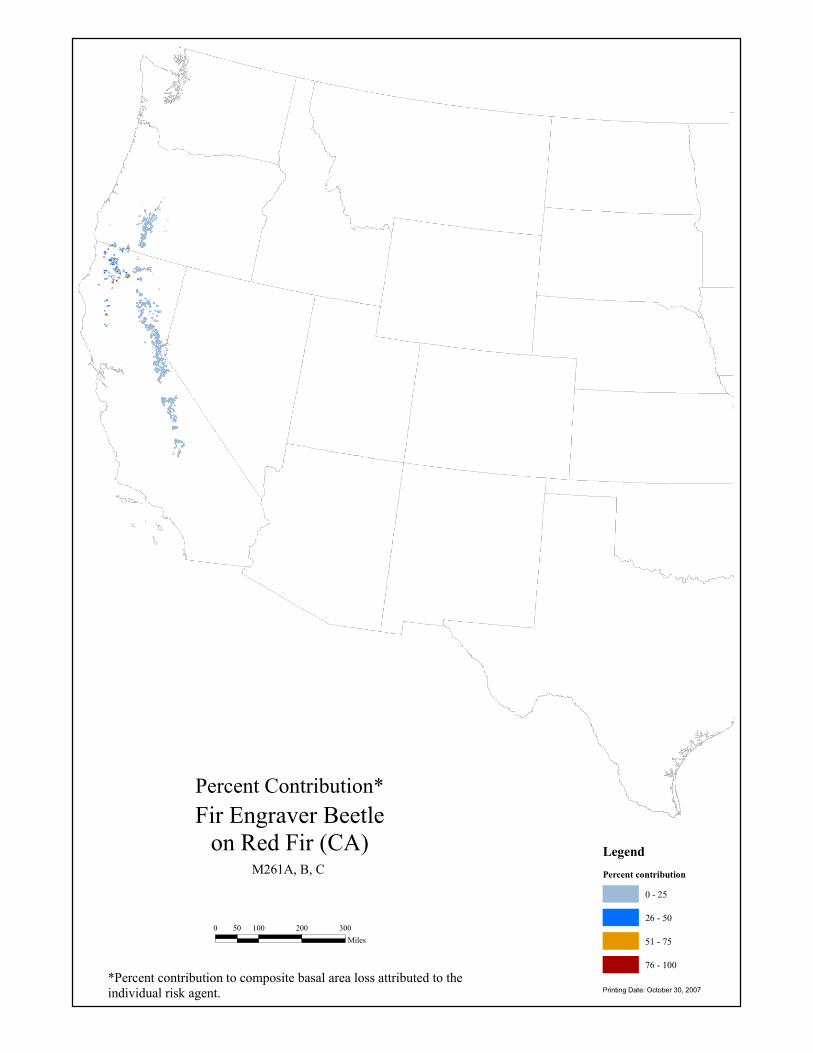
Percent Contribution*
LegendPercent contribution
0 - 25
26 - 50
51 - 75
76 - 100
Fir Engraver Beetleon Red Fir (CA)
*Percent contribution to composite basal area loss attributed to the individual risk agent. Printing Date: October 30, 2007
0 100 200 30050Miles
M261A, B, C
Risk Model Worksheet - CaliforniaHost(s):
Model Extent: Max Percent Mortality:
Susceptibility
0%
Vulnerability
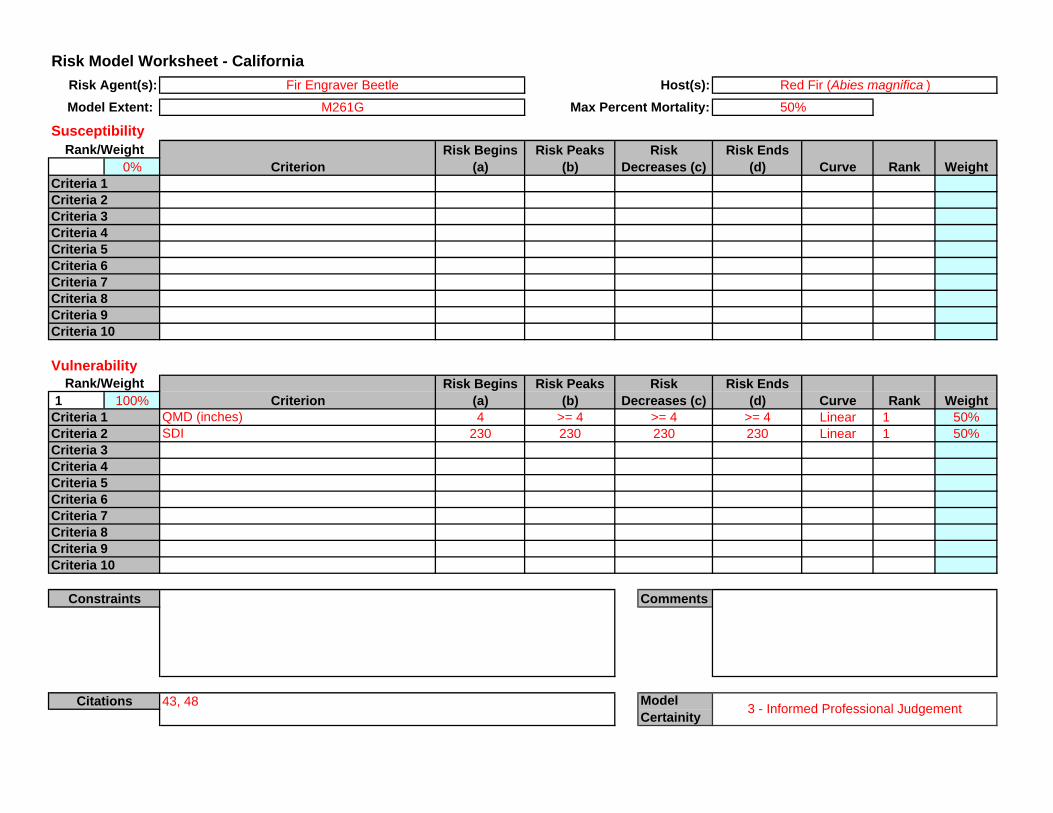
1 100%QMD (inches) 4 >= 4 >= 4 Linear 1 50%SDI 230 230 230 Linear 1 50%
CommentsConstraints
Citations
Rank/Weight
Rank/Weight
Criteria 7Criteria 8Criteria 9Criteria 10
Criteria 3Criteria 4
Criteria 7Criteria 8
Criteria 5Criteria 6
Criteria 9Criteria 10
Criteria 1Criteria 2
Criteria 3Criteria 4Criteria 5Criteria 6
Weight
Model Certainity 3 - Informed Professional Judgement
Risk Ends (d) Curve Rank
230
Curve Rank Weight
50%
Risk Ends (d)
Red Fir (Abies magnifica )
Risk Begins (a)
Risk Peaks (b)Criterion
Risk Decreases (c)
Risk Agent(s): Fir Engraver Beetle
M261G
Criteria 1Criteria 2
43, 48
>= 4Criterion
Risk Begins (a)
Risk Peaks (b)
Risk Decreases (c)

Risk* of Mortality
LegendLevel of risk for host
0 - 2 Little or no risk
3 - 4 Low risk
5 - 6 Medium risk
7 - 10 High risk
Fir Engraver Beetleon Red Fir (CA)
Mortality Ceiling of 50%
*Risk of experiencing mortality at a given threshold over a 15 year period. Printing Date: October 30, 2007
0 100 200 30050Miles
M261G

Percent Contribution*
LegendPercent contribution
0 - 25
26 - 50
51 - 75
76 - 100
Fir Engraver Beetleon Red Fir (CA)
*Percent contribution to composite basal area loss attributed to the individual risk agent. Printing Date: October 30, 2007
0 100 200 30050Miles
M261G
Risk Model Worksheet - CaliforniaHost(s):
Model Extent: Max Percent Mortality:
Susceptibility
0%
Vulnerability
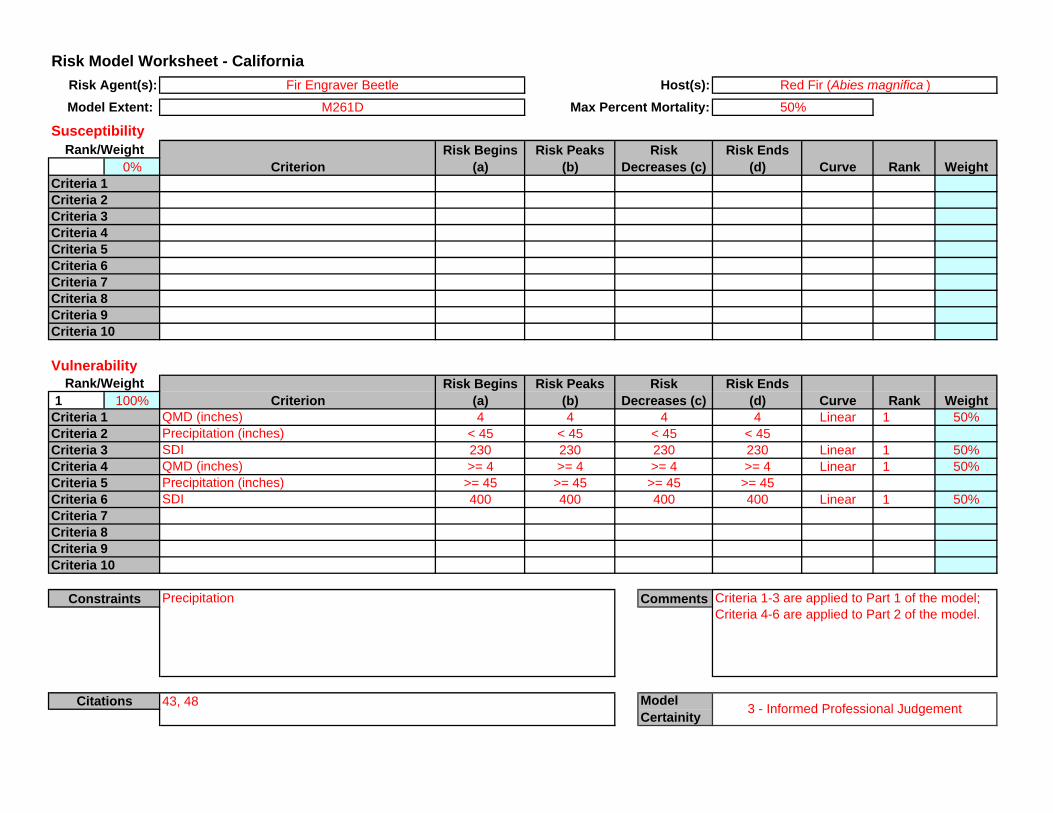
1 100%QMD (inches) 4 4 4 Linear 1 50%Precipitation (inches) < 45 < 45 < 45SDI 230 230 230 Linear 1 50%QMD (inches) >= 4 >= 4 >= 4 Linear 1 50%Precipitation (inches) >= 45 >= 45 >= 45SDI 400 400 400 Linear 1 50%
Comments
43, 48
4Criterion
Risk Begins (a)
Risk Peaks (b)
Risk Decreases (c)
Risk Agent(s): Fir Engraver Beetle
M261D
Criteria 1Criteria 2
Precipitation
230>= 4
>= 45400
Risk Begins (a)
Risk Peaks (b)Criterion
Risk Decreases (c) Curve Rank Weight
50%
Risk Ends (d)
Red Fir (Abies magnifica )
Weight
Model Certainity 3 - Informed Professional Judgement
Risk Ends (d) Curve Rank
Criteria 1-3 are applied to Part 1 of the model; Criteria 4-6 are applied to Part 2 of the model.
< 45
Criteria 3Criteria 4Criteria 5Criteria 6Criteria 7Criteria 8
Criteria 5Criteria 6
Criteria 9Criteria 10
Criteria 1Criteria 2
Constraints
Citations
Rank/Weight
Rank/Weight
Criteria 7Criteria 8Criteria 9Criteria 10
Criteria 3Criteria 4
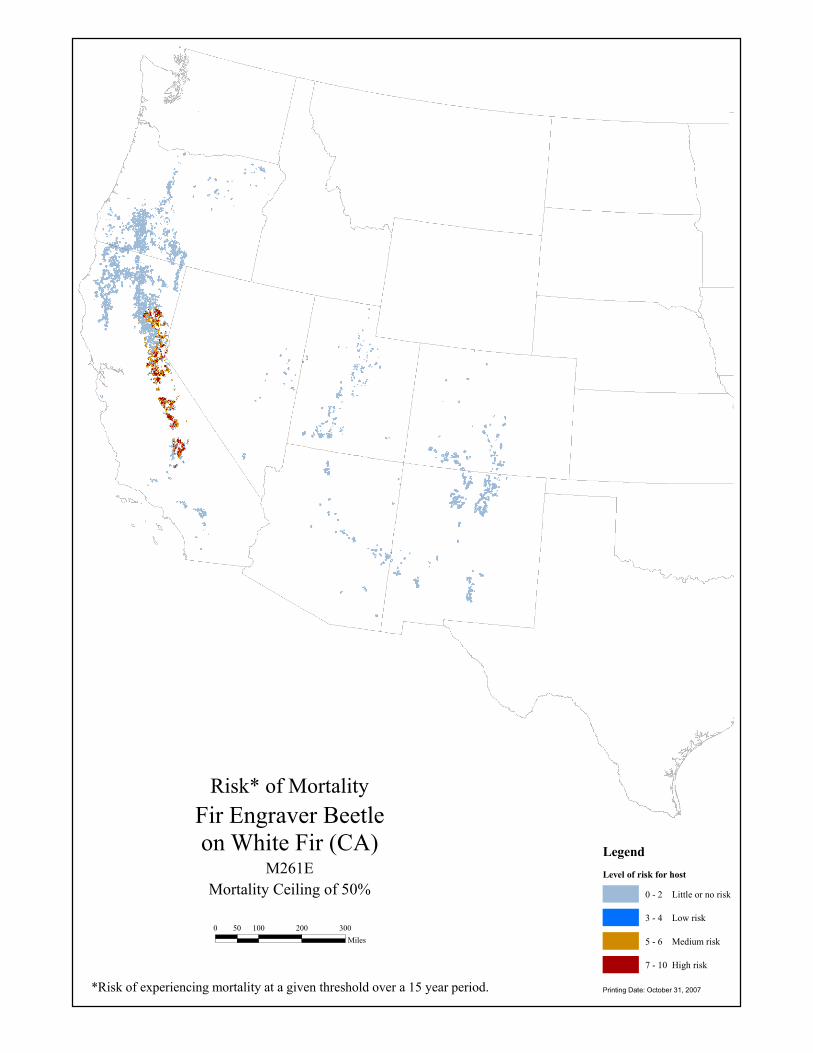
Risk* of Mortality
LegendLevel of risk for host
0 - 2 Little or no risk
3 - 4 Low risk
5 - 6 Medium risk
7 - 10 High risk
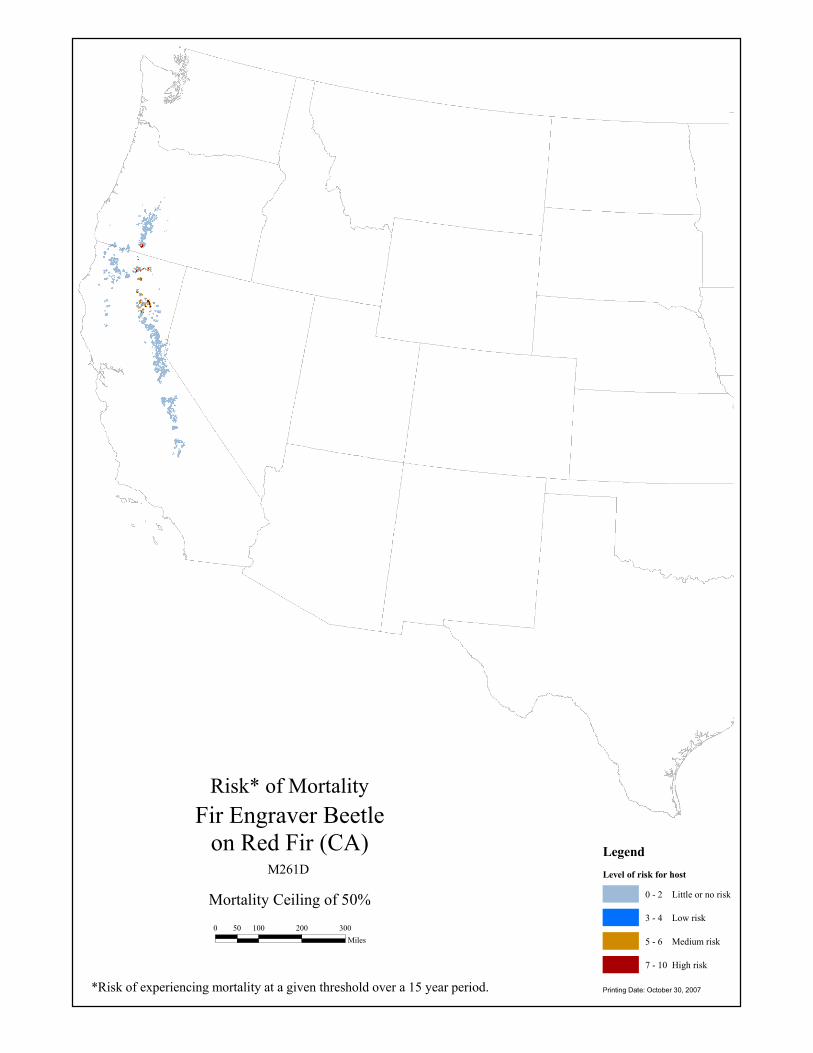
Fir Engraver Beetleon Red Fir (CA)
Mortality Ceiling of 50%
*Risk of experiencing mortality at a given threshold over a 15 year period. Printing Date: October 30, 2007
0 100 200 30050Miles
M261D

Percent Contribution*
LegendPercent contribution
0 - 25
26 - 50
51 - 75
76 - 100
Fir Engraver Beetleon Red Fir (CA)
*Percent contribution to composite basal area loss attributed to the individual risk agent. Printing Date: October 30, 2007
0 100 200 30050Miles
M261D
Risk Model Worksheet - CaliforniaHost(s):
Model Extent: Max Percent Mortality:
Susceptibility
0%
Vulnerability
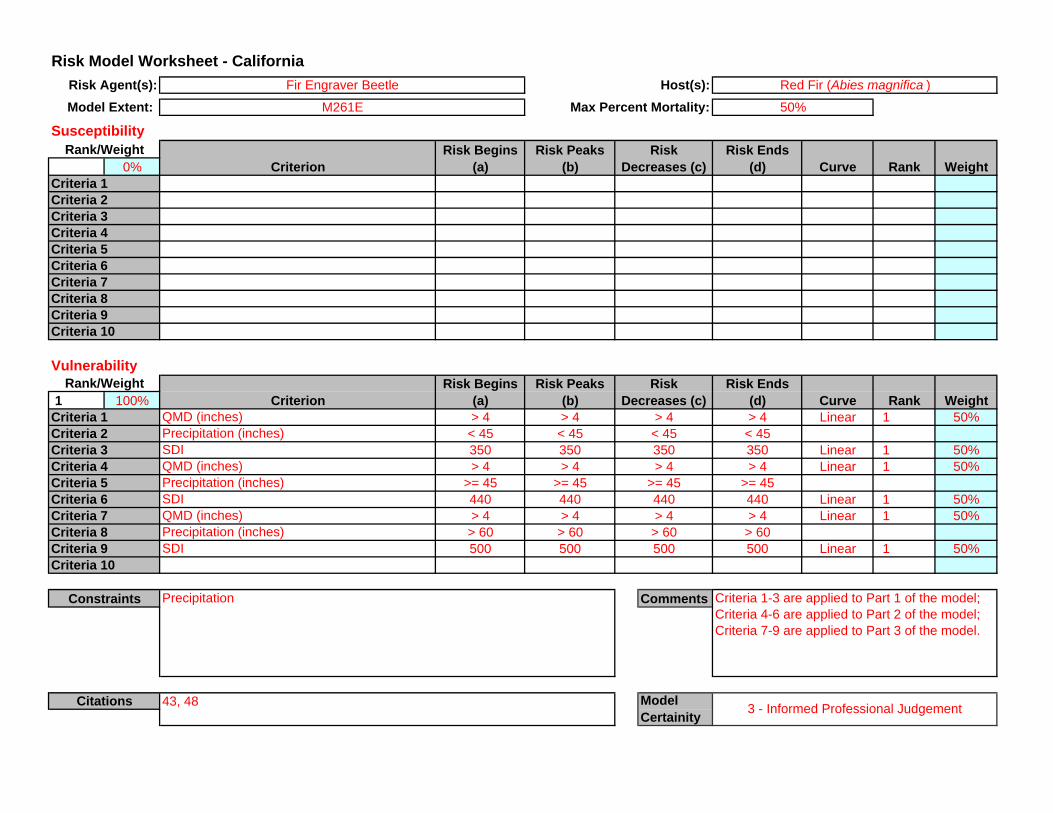
1 100%QMD (inches) > 4 > 4 > 4 Linear 1 50%Precipitation (inches) < 45 < 45 < 45SDI 350 350 350 Linear 1 50%QMD (inches) > 4 > 4 > 4 Linear 1 50%Precipitation (inches) >= 45 >= 45 >= 45SDI 440 440 440 Linear 1 50%QMD (inches) > 4 > 4 > 4 Linear 1 50%Precipitation (inches) > 60 > 60 > 60SDI 500 500 500 Linear 1 50%
Comments
43, 48
> 4Criterion
Risk Begins (a)
Risk Peaks (b)
Risk Decreases (c)
Risk Agent(s): Fir Engraver Beetle
M261E
Criteria 1Criteria 2
Precipitation
350> 4
>= 45440> 4
> 60500
Risk Begins (a)
Risk Peaks (b)Criterion
Risk Decreases (c) Curve Rank Weight
50%
Risk Ends (d)
Red Fir (Abies magnifica )
Weight
Model Certainity 3 - Informed Professional Judgement
Risk Ends (d) Curve Rank
Criteria 1-3 are applied to Part 1 of the model; Criteria 4-6 are applied to Part 2 of the model; Criteria 7-9 are applied to Part 3 of the model.
< 45
Criteria 3Criteria 4Criteria 5Criteria 6Criteria 7Criteria 8
Criteria 5Criteria 6
Criteria 9Criteria 10
Criteria 1Criteria 2
Constraints
Citations
Rank/Weight
Rank/Weight
Criteria 7Criteria 8Criteria 9Criteria 10
Criteria 3Criteria 4
Risk* of Mortality
LegendLevel of risk for host
0 - 2 Little or no risk
3 - 4 Low risk
5 - 6 Medium risk
7 - 10 High risk
Fir Engraver Beetleon Red Fir (CA)
Mortality Ceiling of 50%
*Risk of experiencing mortality at a given threshold over a 15 year period. Printing Date: October 30, 2007
0 100 200 30050Miles
M261E
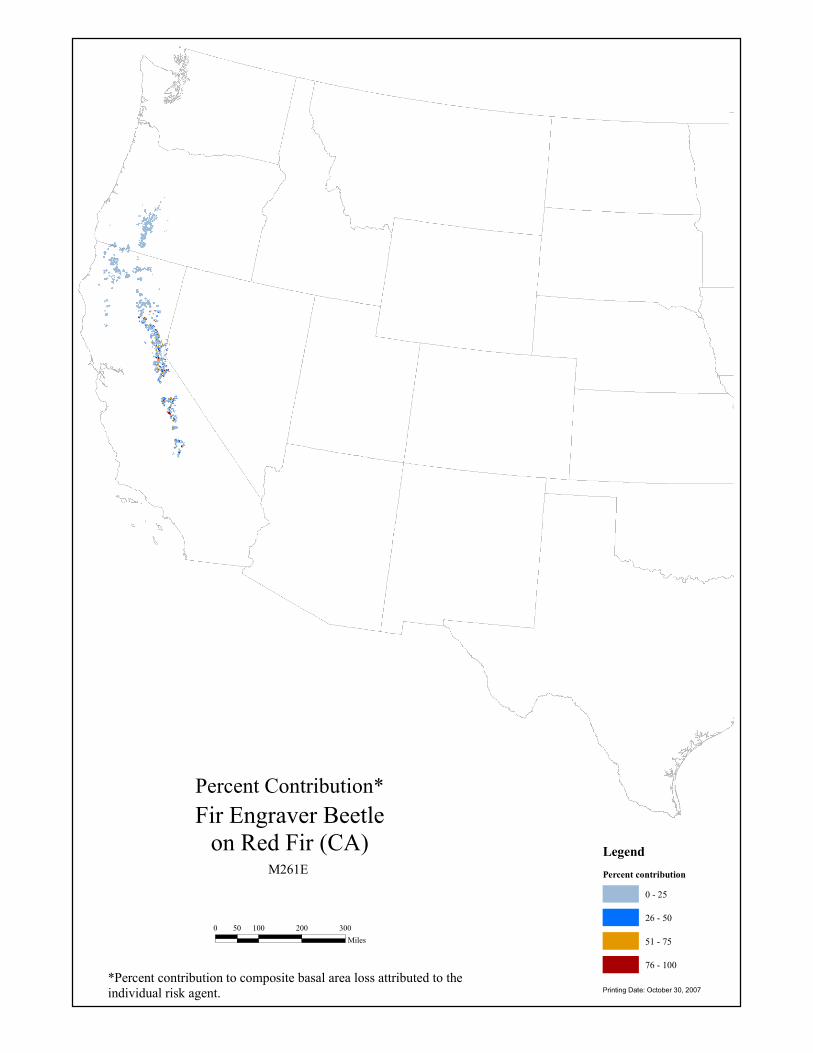
Percent Contribution*
LegendPercent contribution
0 - 25
26 - 50
51 - 75
76 - 100
Fir Engraver Beetleon Red Fir (CA)
*Percent contribution to composite basal area loss attributed to the individual risk agent. Printing Date: October 30, 2007
0 100 200 30050Miles
M261E

Risk Model Worksheet - CaliforniaHost(s):
Model Extent: Max Percent Mortality:
Susceptibility
0%
Vulnerability
1 100%SDI 200 200 200 Linear 1/2 29%Annosus present present present Linear 1 57%Hawksworth Rating 1 6 6 Linear 1/4 14%
Comments
42, 44, 47, 48
200Criterion
Risk Begins (a)
Risk Peaks (b)
Risk Decreases (c)
Risk Agent(s): Fir Engraver Beetle
M262A and M262B
Criteria 1Criteria 2
6
Risk Begins (a)
Risk Peaks (b)Criterion
Risk Decreases (c) Curve Rank Weight
50%
Risk Ends (d)
White Fir (Abies concolor )
Weight
Model Certainity 3 - Informed Professional Judgement
Risk Ends (d) Curve Rank
present
Criteria 3Criteria 4Criteria 5Criteria 6Criteria 7Criteria 8
Criteria 5Criteria 6
Criteria 9Criteria 10
Criteria 1Criteria 2
Constraints
Citations
Rank/Weight
Rank/Weight
Criteria 7Criteria 8Criteria 9Criteria 10
Criteria 3Criteria 4

Risk* of Mortality
LegendLevel of risk for host
0 - 2 Little or no risk
3 - 4 Low risk
5 - 6 Medium risk
7 - 10 High risk
Fir Engraver Beetleon White Fir (CA)
Mortality Ceiling of 50%
*Risk of experiencing mortality at a given threshold over a 15 year period. Printing Date: October 31, 2007
0 100 200 30050Miles
M262A, B

Percent Contribution*
LegendPercent contribution
0 - 25
26 - 50
51 - 75
76 - 100
Fir Engraver Beetleon White Fir (CA)
*Percent contribution to composite basal area loss attributed to the individual risk agent. Printing Date: October 31, 2007
0 100 200 30050Miles
M262A, B

Risk Model Worksheet - CaliforniaHost(s):
Model Extent: Max Percent Mortality:
Susceptibility
0%
Vulnerability
1 100%SDI 200 200 200 Linear 1 100%
Comments
42, 44, 47, 48
200Criterion
Risk Begins (a)
Risk Peaks (b)
Risk Decreases (c)
Risk Agent(s): Fir Engraver Beetle
M261A, M261B, M261C and M261G
Criteria 1Criteria 2
Risk Begins (a)
Risk Peaks (b)Criterion
Risk Decreases (c) Curve Rank Weight
50%
Risk Ends (d)
White Fir (Abies concolor )
Weight
Model Certainity 3 - Informed Professional Judgement
Risk Ends (d) Curve Rank
Criteria 3Criteria 4Criteria 5Criteria 6Criteria 7Criteria 8
Criteria 5Criteria 6
Criteria 9Criteria 10
Criteria 1Criteria 2
Constraints
Citations
Rank/Weight
Rank/Weight
Criteria 7Criteria 8Criteria 9Criteria 10
Criteria 3Criteria 4
Risk* of Mortality
LegendLevel of risk for host
0 - 2 Little or no risk
3 - 4 Low risk
5 - 6 Medium risk
7 - 10 High risk
Fir Engraver Beetleon White Fir (CA)
Mortality Ceiling of 50%
*Risk of experiencing mortality at a given threshold over a 15 year period. Printing Date: October 31, 2007
0 100 200 30050Miles
M261A, B, C, G
Percent Contribution*
LegendPercent contribution
0 - 25
26 - 50
51 - 75
76 - 100
Fir Engraver Beetleon White Fir (CA)
*Percent contribution to composite basal area loss attributed to the individual risk agent. Printing Date: October 31, 2007
0 100 200 30050Miles
M261A, B, C, G
Risk Model Worksheet - CaliforniaHost(s):
Model Extent: Max Percent Mortality:
Susceptibility
0%
Vulnerability
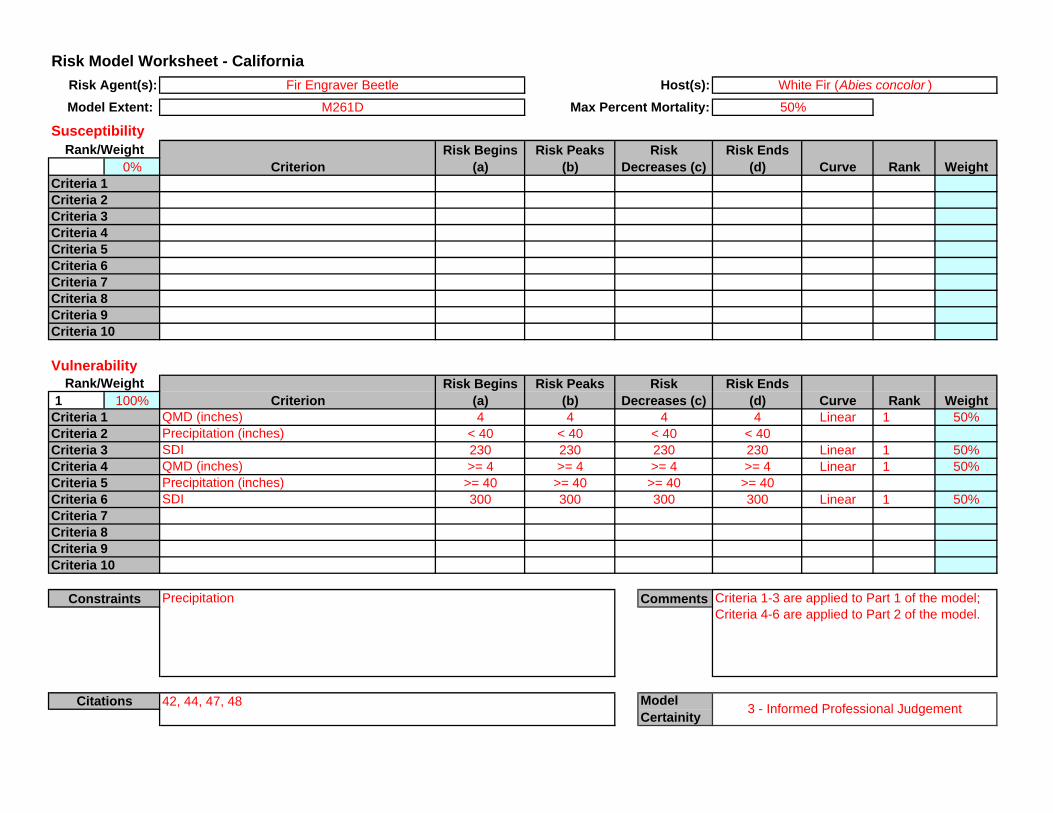
1 100%QMD (inches) 4 4 4 Linear 1 50%Precipitation (inches) < 40 < 40 < 40SDI 230 230 230 Linear 1 50%QMD (inches) >= 4 >= 4 >= 4 Linear 1 50%Precipitation (inches) >= 40 >= 40 >= 40SDI 300 300 300 Linear 1 50%
CommentsConstraints
Citations
Rank/Weight
Rank/Weight
Criteria 7Criteria 8Criteria 9Criteria 10
Criteria 3Criteria 4
Criteria 7Criteria 8
Criteria 5Criteria 6
Criteria 9Criteria 10
Criteria 1Criteria 2
Criteria 3Criteria 4Criteria 5Criteria 6
Weight
Model Certainity 3 - Informed Professional Judgement
Risk Ends (d) Curve Rank
Criteria 1-3 are applied to Part 1 of the model; Criteria 4-6 are applied to Part 2 of the model.
< 40
Curve Rank Weight
50%
Risk Ends (d)
White Fir (Abies concolor )
Risk Begins (a)
Risk Peaks (b)Criterion
Risk Decreases (c)
Precipitation
230>= 4
>= 40300
Risk Agent(s): Fir Engraver Beetle
M261D
Criteria 1Criteria 2
42, 44, 47, 48
4Criterion
Risk Begins (a)
Risk Peaks (b)
Risk Decreases (c)
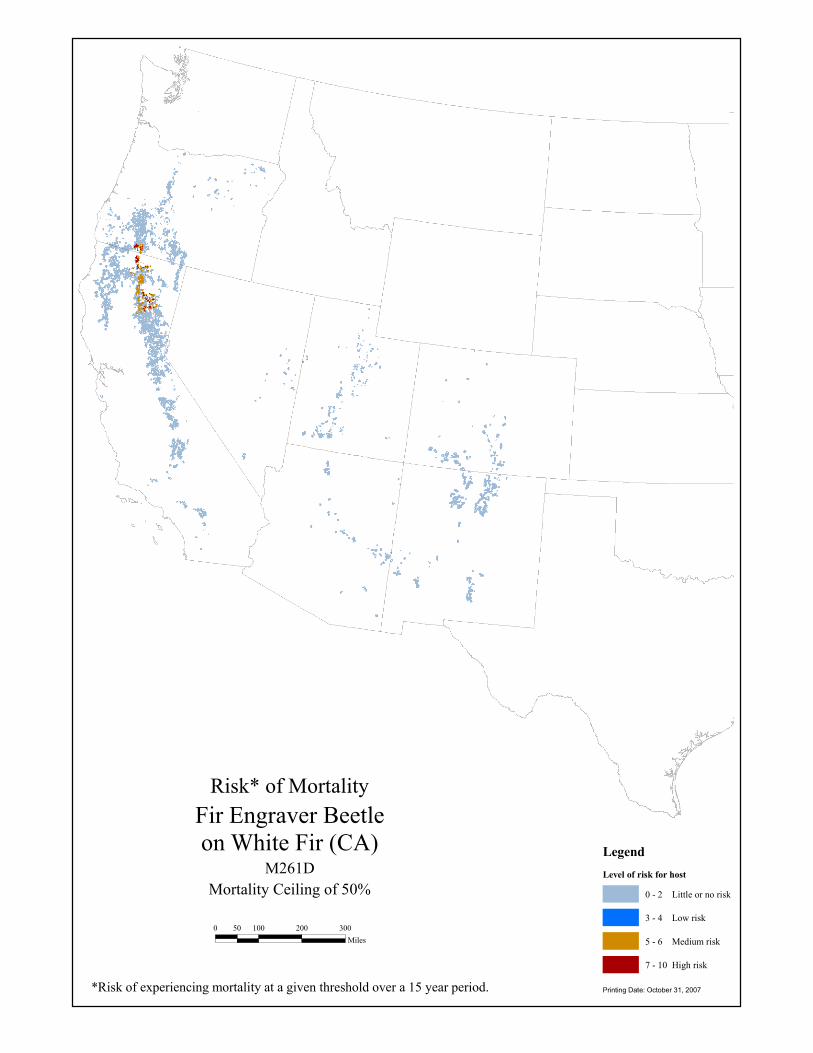
Risk* of Mortality
LegendLevel of risk for host
0 - 2 Little or no risk
3 - 4 Low risk
5 - 6 Medium risk
7 - 10 High risk
Fir Engraver Beetleon White Fir (CA)
Mortality Ceiling of 50%
*Risk of experiencing mortality at a given threshold over a 15 year period. Printing Date: October 31, 2007
0 100 200 30050Miles
M261D
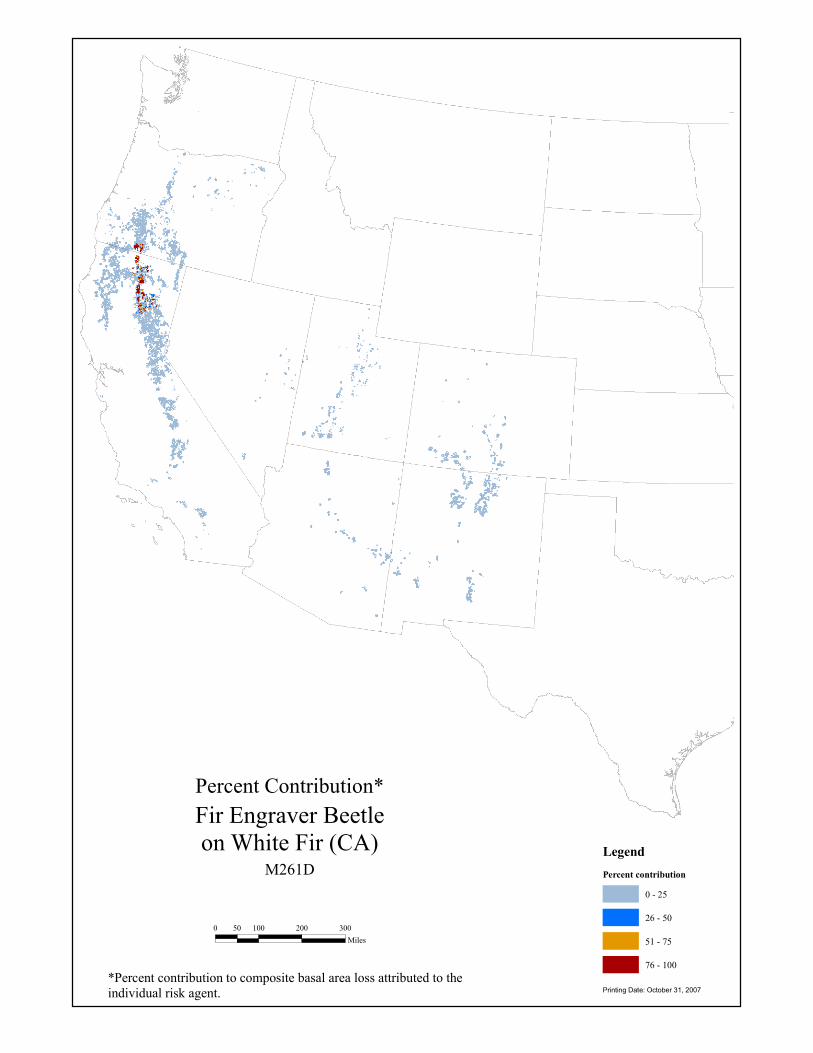
Percent Contribution*
LegendPercent contribution
0 - 25
26 - 50
51 - 75
76 - 100
Fir Engraver Beetleon White Fir (CA)
*Percent contribution to composite basal area loss attributed to the individual risk agent. Printing Date: October 31, 2007
0 100 200 30050Miles
M261D
Risk Model Worksheet - CaliforniaHost(s):
Model Extent: Max Percent Mortality:
Susceptibility
0%
Vulnerability
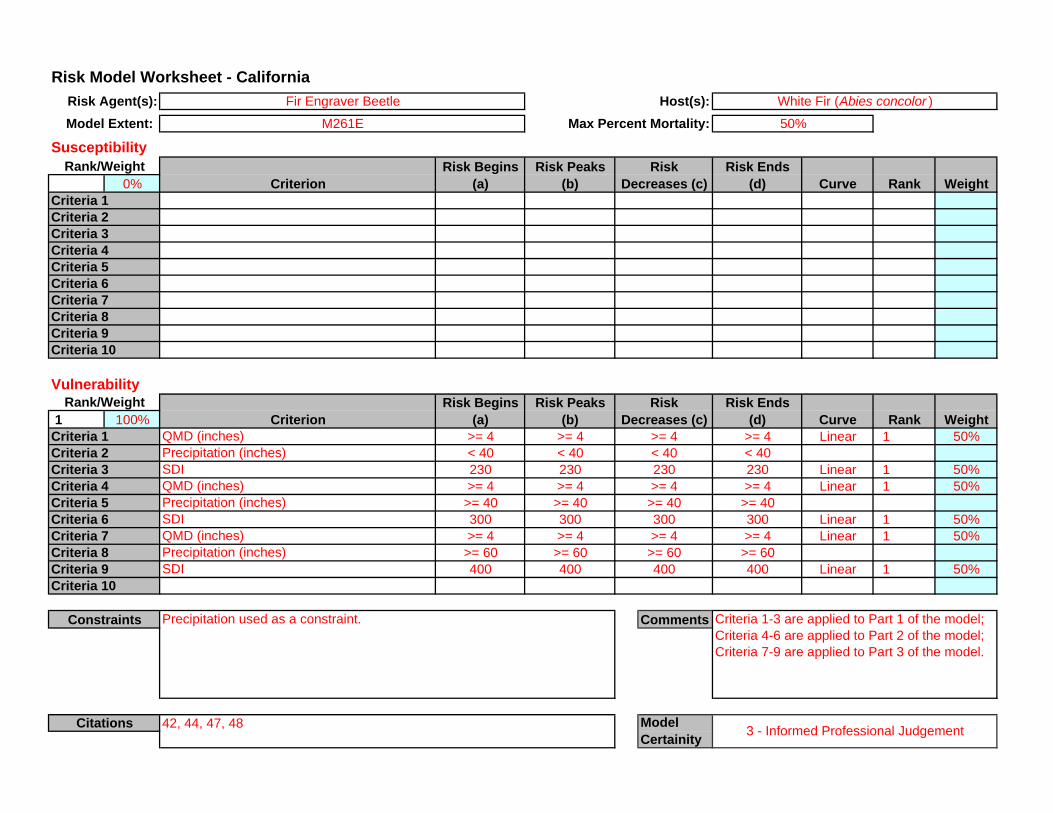
1 100%QMD (inches) >= 4 >= 4 >= 4 Linear 1 50%Precipitation (inches) < 40 < 40 < 40SDI 230 230 230 Linear 1 50%QMD (inches) >= 4 >= 4 >= 4 Linear 1 50%Precipitation (inches) >= 40 >= 40 >= 40SDI 300 300 300 Linear 1 50%QMD (inches) >= 4 >= 4 >= 4 Linear 1 50%Precipitation (inches) >= 60 >= 60 >= 60SDI 400 400 400 Linear 1 50%
CommentsConstraints
Citations
Rank/Weight
Rank/Weight
Criteria 7Criteria 8Criteria 9Criteria 10
Criteria 3Criteria 4
Criteria 7Criteria 8
Criteria 5Criteria 6
Criteria 9Criteria 10
Criteria 1Criteria 2
Criteria 3Criteria 4Criteria 5Criteria 6
Weight
Model Certainity 3 - Informed Professional Judgement
Risk Ends (d) Curve Rank
Criteria 1-3 are applied to Part 1 of the model; Criteria 4-6 are applied to Part 2 of the model; Criteria 7-9 are applied to Part 3 of the model.
< 40
Curve Rank Weight
50%
Risk Ends (d)
White Fir (Abies concolor )
Risk Begins (a)
Risk Peaks (b)Criterion
Risk Decreases (c)
Precipitation used as a constraint.
230>= 4>= 40300>= 4>= 60400
Risk Agent(s): Fir Engraver Beetle
M261E
Criteria 1Criteria 2
42, 44, 47, 48
>= 4Criterion
Risk Begins (a)
Risk Peaks (b)
Risk Decreases (c)
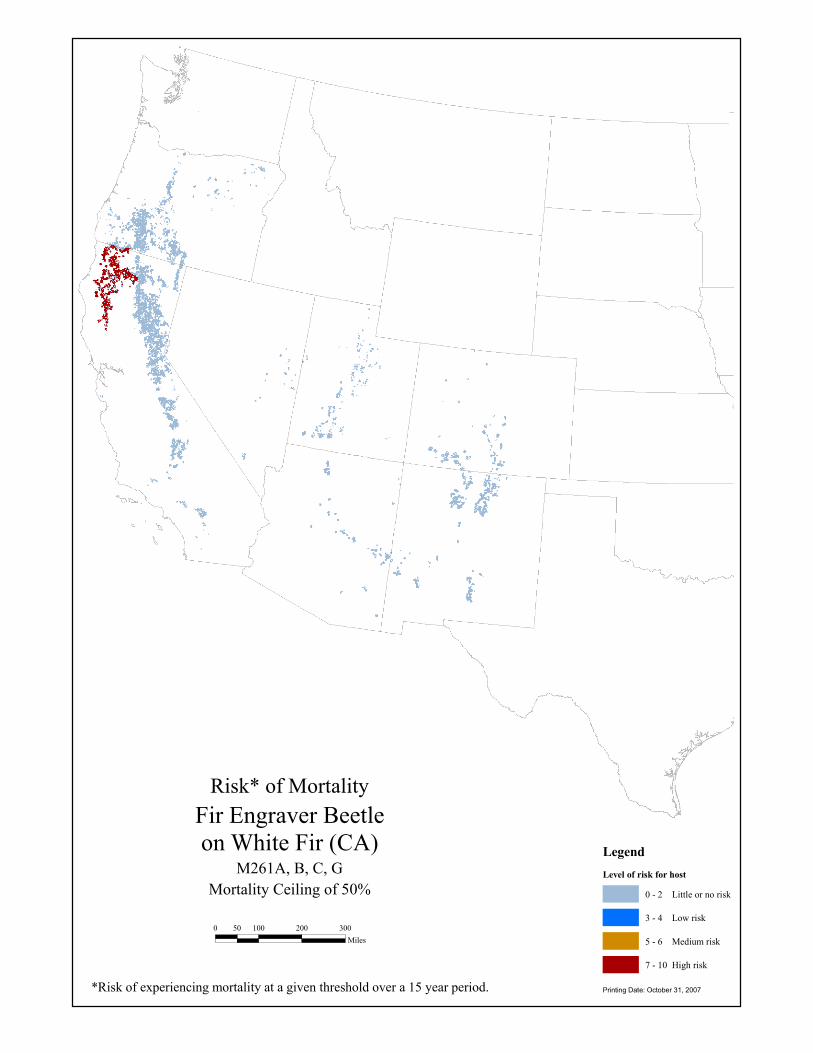
Risk* of Mortality
LegendLevel of risk for host
0 - 2 Little or no risk
3 - 4 Low risk
5 - 6 Medium risk
7 - 10 High risk
Fir Engraver Beetleon White Fir (CA)
Mortality Ceiling of 50%
*Risk of experiencing mortality at a given threshold over a 15 year period. Printing Date: October 31, 2007
0 100 200 30050Miles
M261E
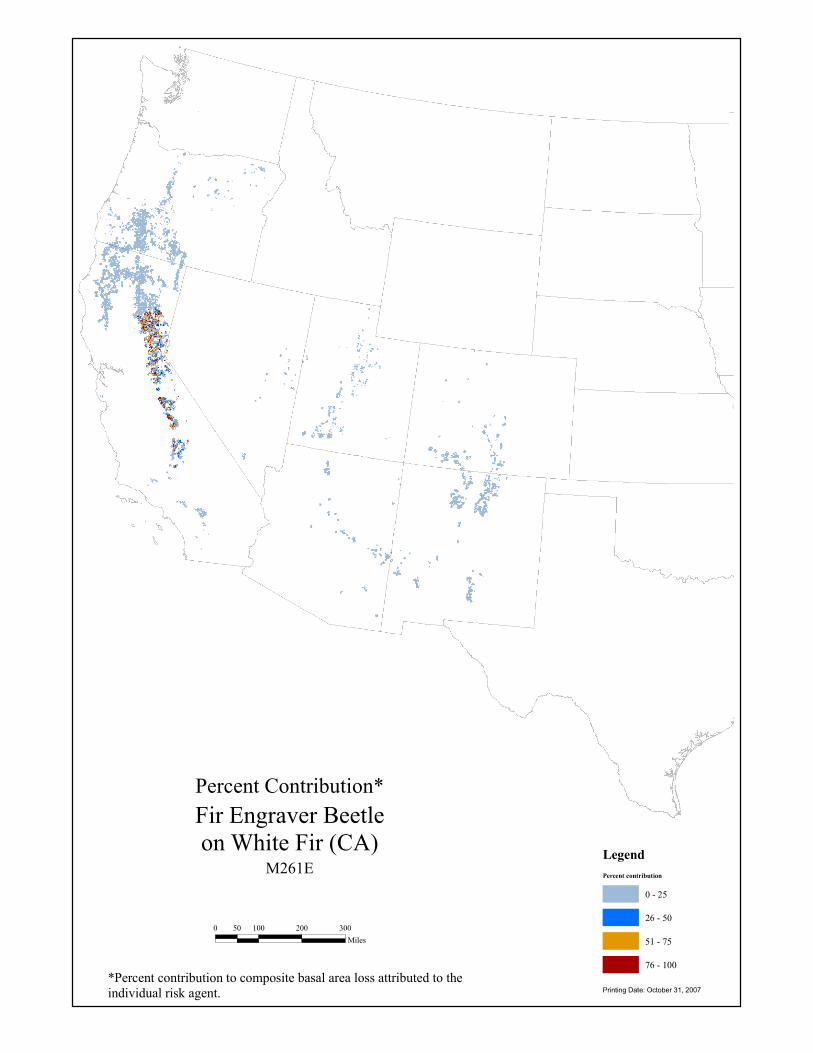
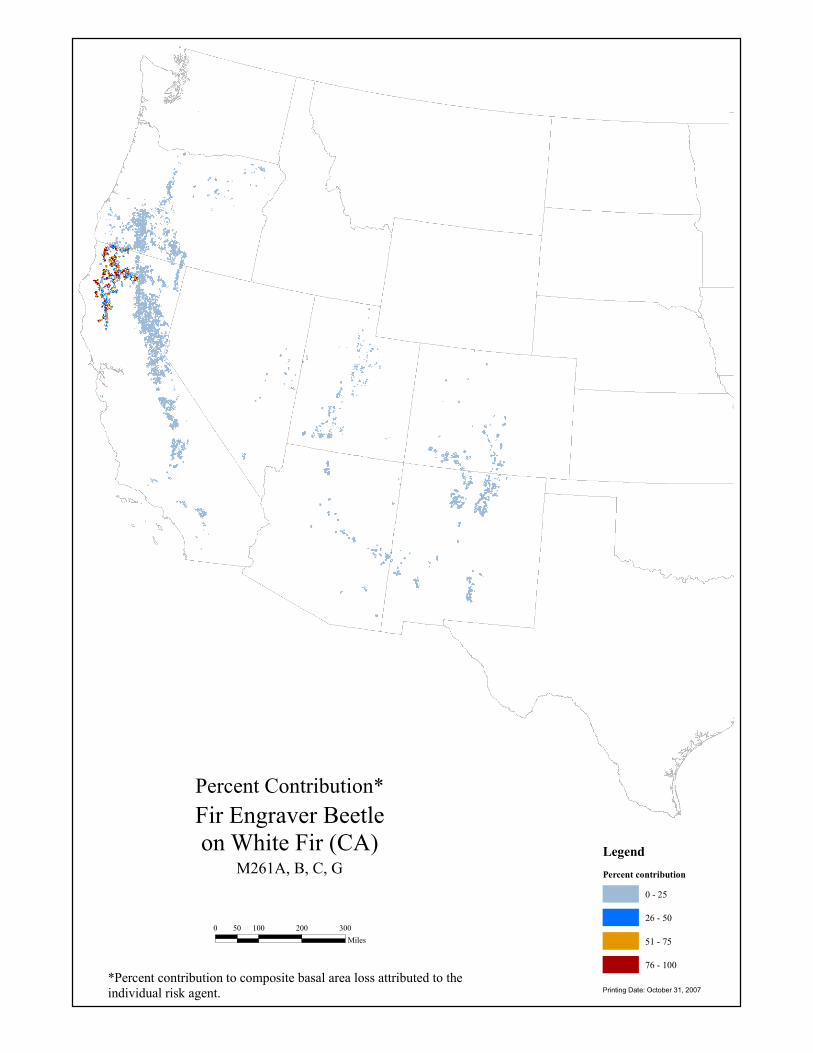
Percent Contribution*
LegendPercent contribution
0 - 25
26 - 50
51 - 75
76 - 100
Fir Engraver Beetleon White Fir (CA)
*Percent contribution to composite basal area loss attributed to the individual risk agent. Printing Date: October 31, 2007
0 100 200 30050Miles
M261E

Risk Model Worksheet - CaliforniaHost(s):
Model Extent: Max Percent Mortality:
Susceptibility
0%
Vulnerability
1 100%QMD (inches) 5.5 > 5.5 > 5.5 Linear 1 100%
Comments
4
> 5.5Criterion
Risk Begins (a)
Risk Peaks (b)
Risk Decreases (c)
Risk Agent(s): Ips Engraver Beetle (Ips spp.)
M261A, M261B, M261C, M261D, and M261E
Criteria 1Criteria 2
Risk Begins (a)
Risk Peaks (b)Criterion
Risk Decreases (c) Curve Rank Weight
100%
Risk Ends (d)
Knobcone Pine (Pinus attenuata )
Weight
Model Certainity 3 - Informed Professional Judgement
Risk Ends (d) Curve Rank
Criteria 3Criteria 4Criteria 5Criteria 6Criteria 7Criteria 8
Criteria 5Criteria 6
Criteria 9Criteria 10
Criteria 1Criteria 2
Constraints
Citations
Rank/Weight
Rank/Weight
Criteria 7Criteria 8Criteria 9Criteria 10
Criteria 3Criteria 4
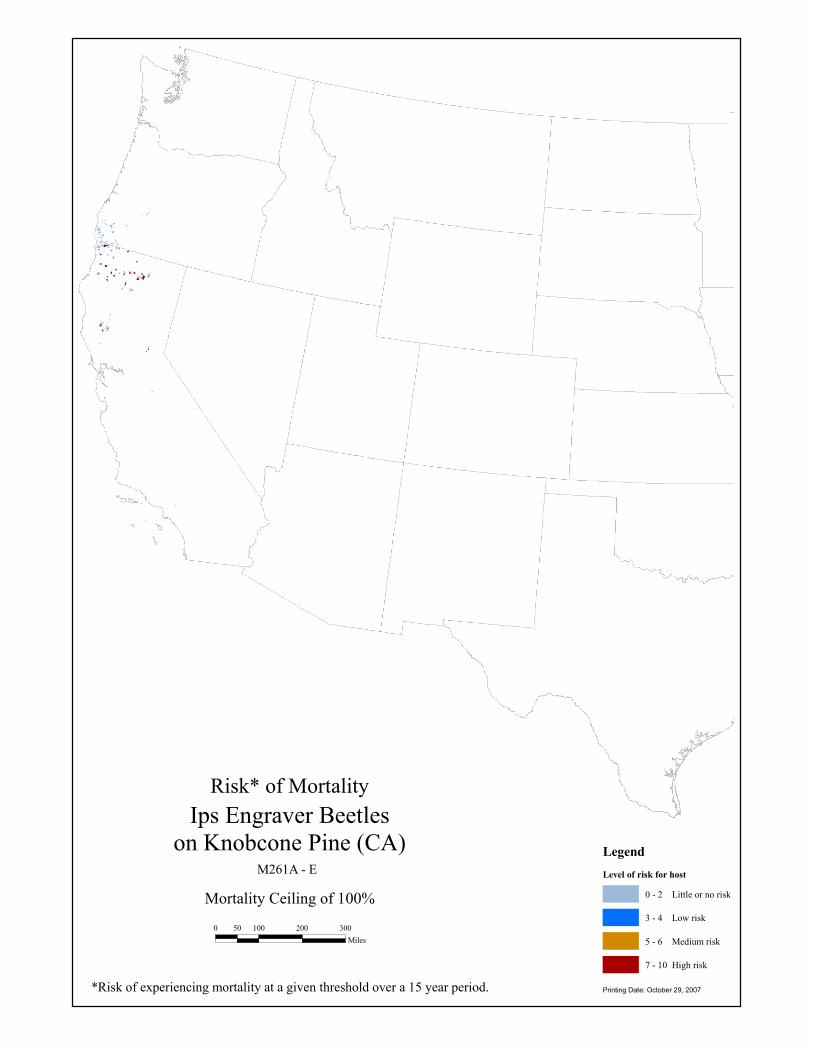
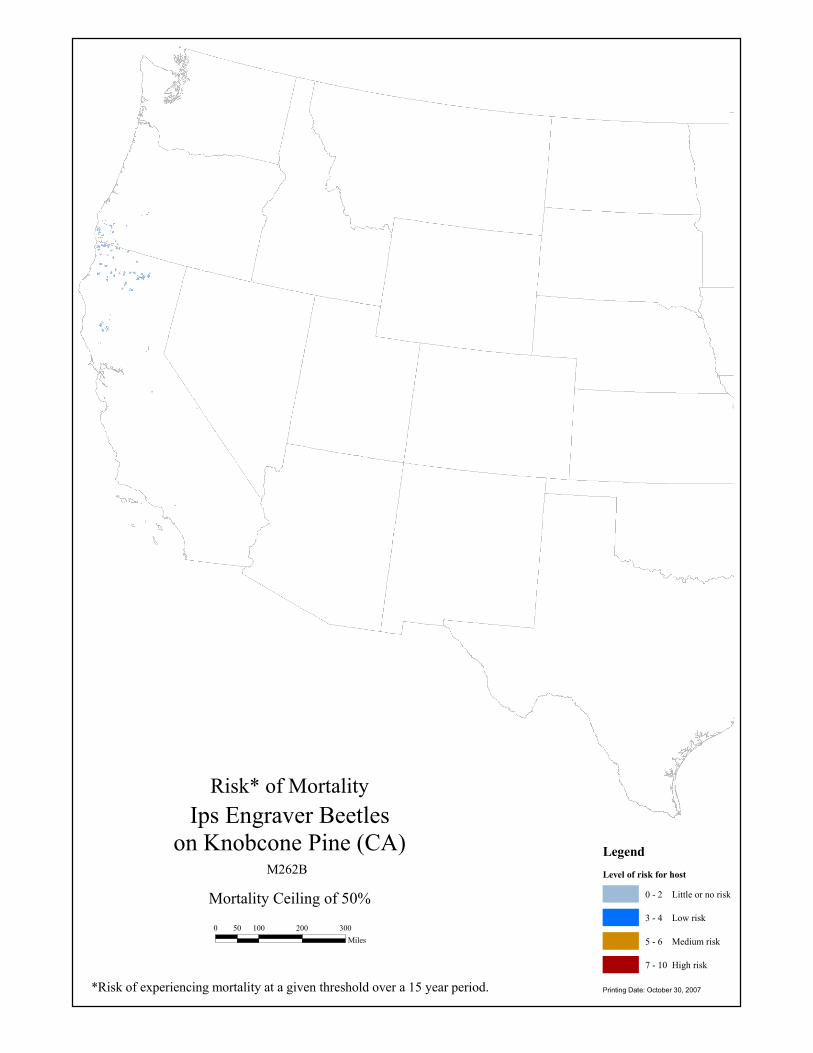
Risk* of Mortality
LegendLevel of risk for host
0 - 2 Little or no risk
3 - 4 Low risk
5 - 6 Medium risk
7 - 10 High risk
Ips Engraver Beetleson Knobcone Pine (CA)
Mortality Ceiling of 100%
*Risk of experiencing mortality at a given threshold over a 15 year period. Printing Date: October 29, 2007
0 100 200 30050Miles
M261A - E
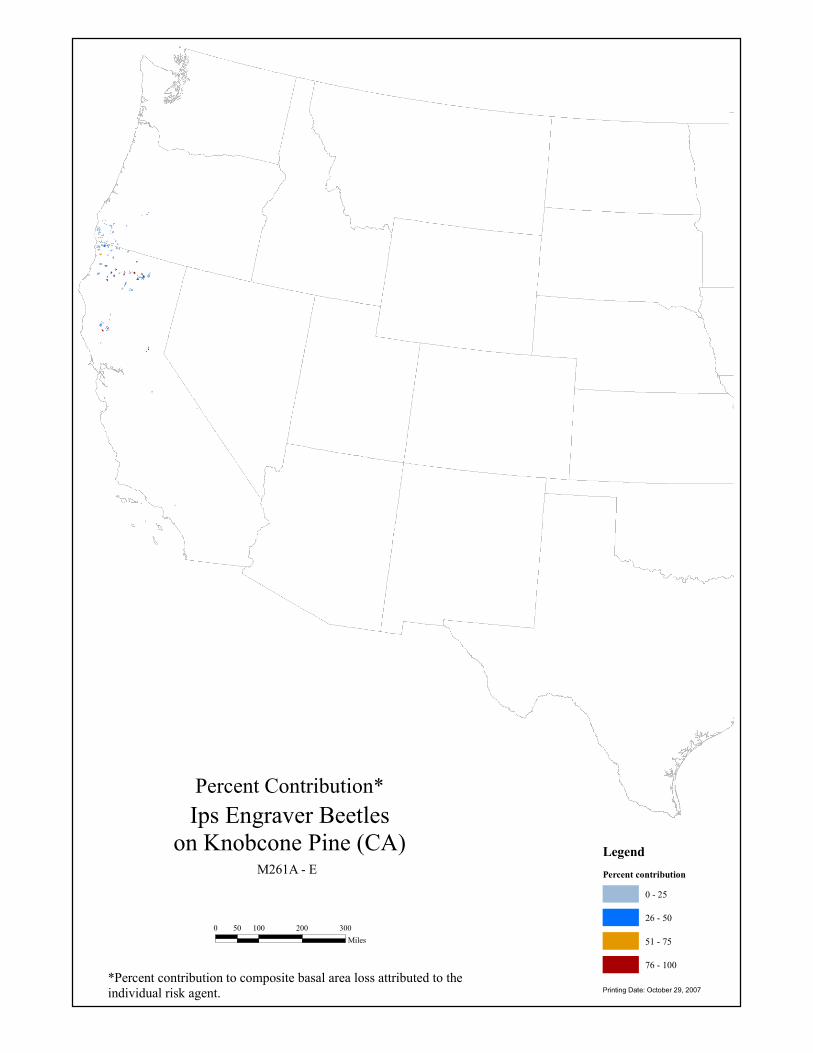
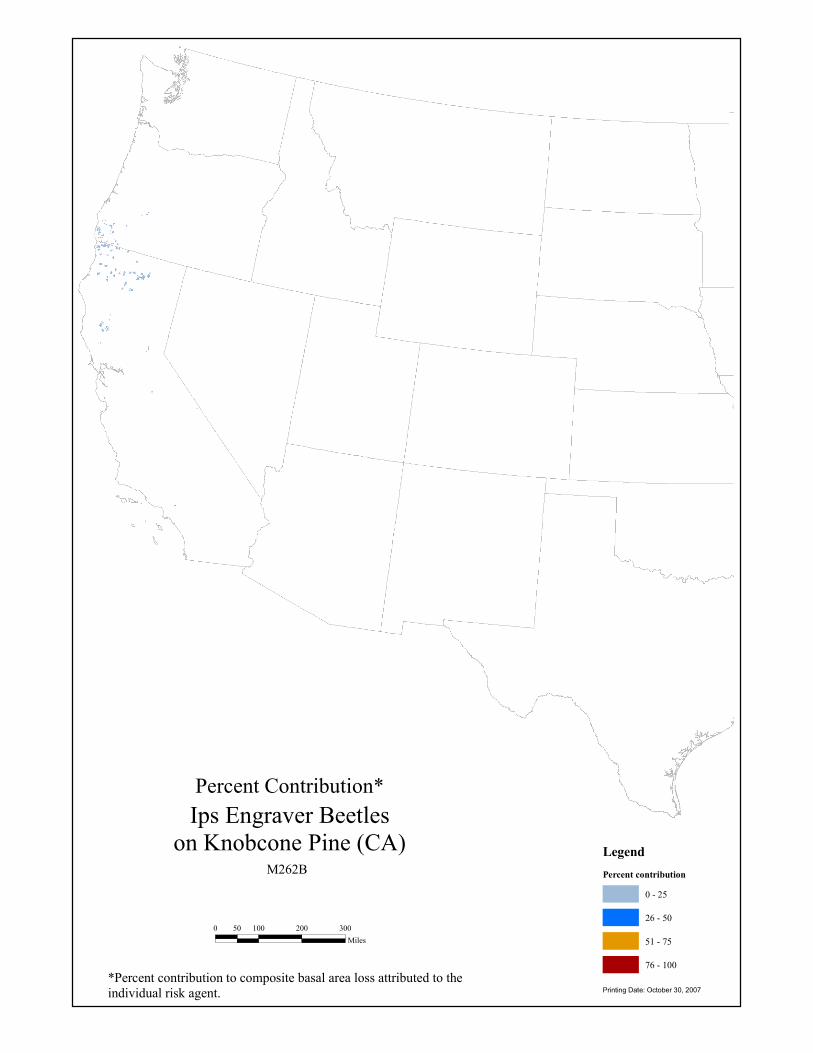
Percent Contribution*
LegendPercent contribution
0 - 25
26 - 50
51 - 75
76 - 100
Ips Engraver Beetleson Knobcone Pine (CA)
*Percent contribution to composite basal area loss attributed to the individual risk agent. Printing Date: October 29, 2007
0 100 200 30050Miles
M261A - E

Risk Model Worksheet - CaliforniaHost(s):
Model Extent: Max Percent Mortality:
Susceptibility
0 0%
Vulnerability
1 100%QMD (inches) 5.5 > 5.5 > 5.5 Linear 1 50%SDI 200 200 200 Linear 1 50%
Comments
4
> 5.5Criterion
Risk Begins (a)
Risk Peaks (b)
Risk Decreases (c)
Risk Agent(s): Ips Engraver Beetle (Ips spp.)
M262B
Criteria 1Criteria 2
Risk Begins (a)
Risk Peaks (b)Criterion
Risk Decreases (c) Curve Rank Weight
50%
Risk Ends (d)
Knobcone Pine (Pinus attenuata )
Weight
Model Certainity 3 - Informed Professional Judgement
Risk Ends (d) Curve Rank
200
Criteria 3Criteria 4Criteria 5Criteria 6Criteria 7Criteria 8
Criteria 5Criteria 6
Criteria 9Criteria 10
Criteria 1Criteria 2
Constraints
Citations
Rank/Weight
Rank/Weight
Criteria 7Criteria 8Criteria 9Criteria 10
Criteria 3Criteria 4
Risk* of Mortality
LegendLevel of risk for host
0 - 2 Little or no risk
3 - 4 Low risk
5 - 6 Medium risk
7 - 10 High risk
Ips Engraver Beetleson Knobcone Pine (CA)
Mortality Ceiling of 50%
*Risk of experiencing mortality at a given threshold over a 15 year period. Printing Date: October 30, 2007
0 100 200 30050Miles
M262B
Percent Contribution*
LegendPercent contribution
0 - 25
26 - 50
51 - 75
76 - 100
Ips Engraver Beetleson Knobcone Pine (CA)
*Percent contribution to composite basal area loss attributed to the individual risk agent. Printing Date: October 30, 2007
0 100 200 30050Miles
M262B

Risk Model Worksheet - CaliforniaHost(s):
Model Extent: Max Percent Mortality:
Susceptibility
0%
Vulnerability
1 100%BA 5 5 5 Linear 1 50%QMD (inches) >= 3 >= 3 >= 3 Linear 1 50%
CommentsConstraints
Citations
Rank/Weight
Rank/Weight
Criteria 7Criteria 8Criteria 9Criteria 10
Criteria 3Criteria 4
Criteria 7Criteria 8
Criteria 5Criteria 6
Criteria 9Criteria 10
Criteria 1Criteria 2
Criteria 3Criteria 4Criteria 5Criteria 6
Weight
Model Certainity 3 - Informed Professional Judgement
Risk Ends (d) Curve Rank
>= 3
Curve Rank Weight
50%
Risk Ends (d)
Pinyon Pine (P. monophylla, P. quadrifolia )
Risk Begins (a)
Risk Peaks (b)Criterion
Risk Decreases (c)
Risk Agent(s): Ips Engraver Beetle (Ips confusus)
341D, E, M261E, F, 342B, 341F
Criteria 1Criteria 2
27, 60
5Criterion
Risk Begins (a)
Risk Peaks (b)
Risk Decreases (c)

Risk* of Mortality
LegendLevel of risk for host
0 - 2 Little or no risk
3 - 4 Low risk
5 - 6 Medium risk
7 - 10 High risk
Ips Engraver Beetle (Ips confusus)on Pinyon Pine (CA)
Mortality Ceiling of 50%
*Risk of experiencing mortality at a given threshold over a 15 year period. Printing Date: October 30, 2007
0 100 200 30050Miles
341D, E, M261E, F 342B, 341F
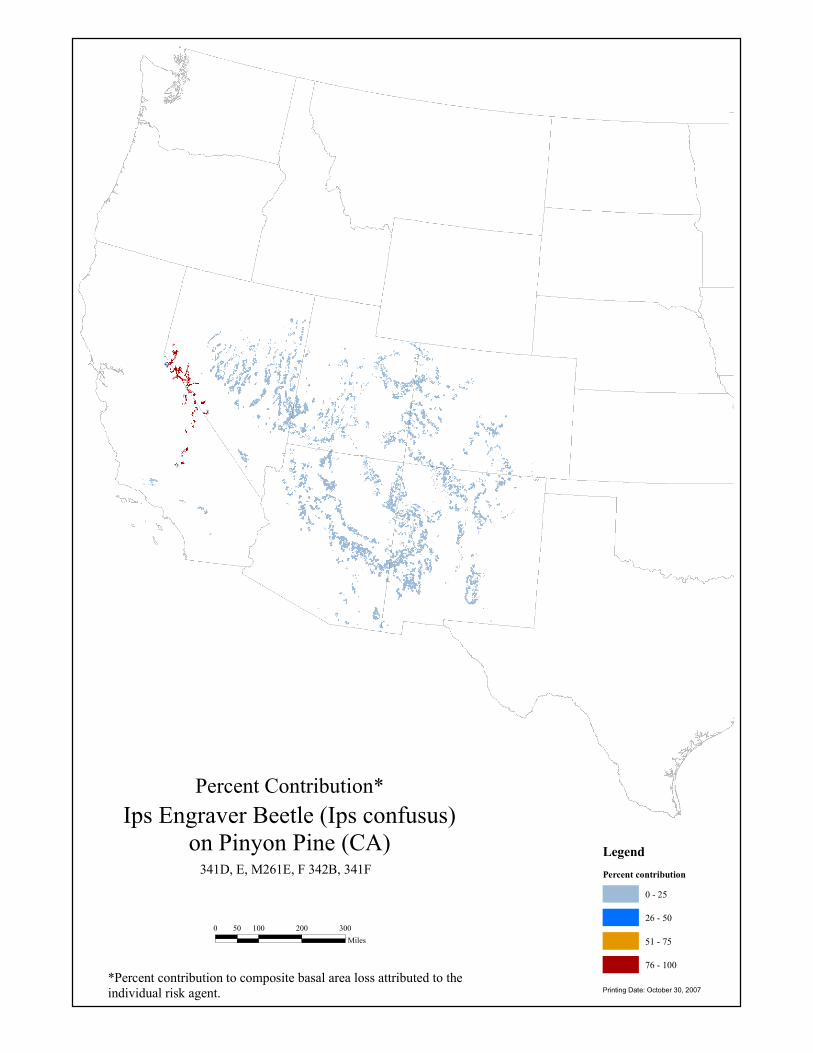
Percent Contribution*
LegendPercent contribution
0 - 25
26 - 50
51 - 75
76 - 100
Ips Engraver Beetle (Ips confusus)on Pinyon Pine (CA)
*Percent contribution to composite basal area loss attributed to the individual risk agent. Printing Date: October 30, 2007
0 100 200 30050Miles
341D, E, M261E, F 342B, 341F
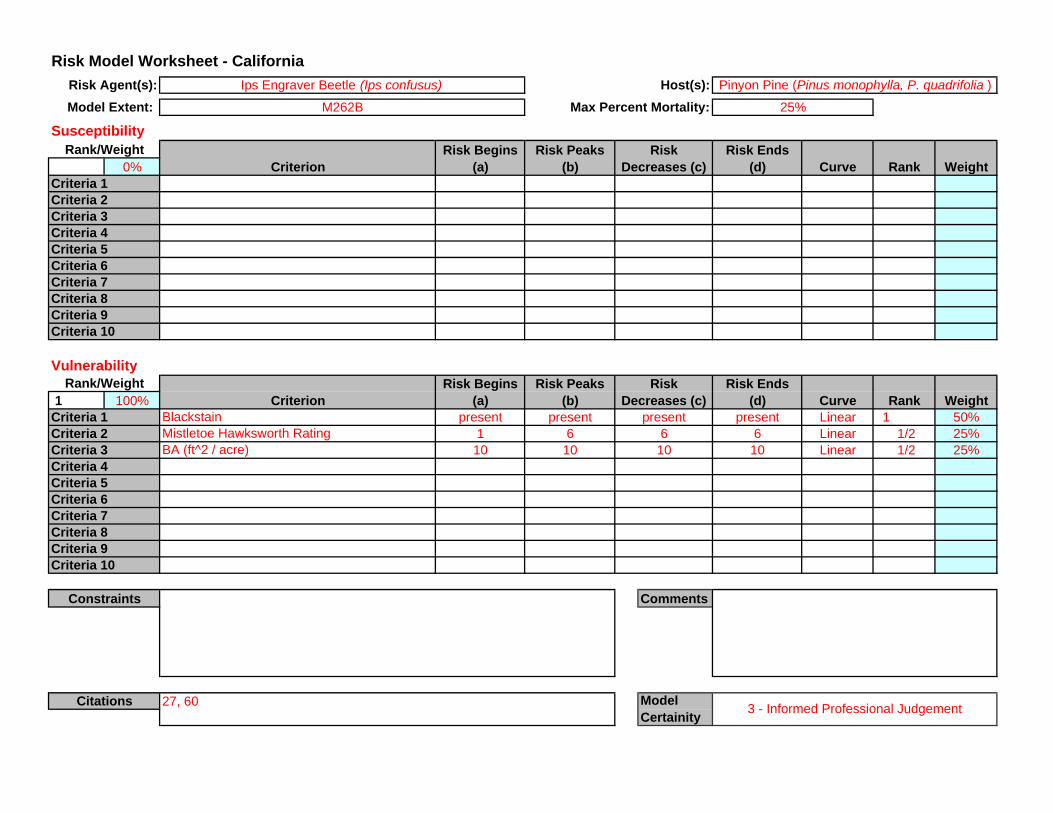
Risk Model Worksheet - CaliforniaHost(s):
Model Extent: Max Percent Mortality:
Susceptibility
0%
Vulnerability
1 100%Blackstain present present present Linear 1 50%Mistletoe Hawksworth Rating 1 6 6 Linear 1/2 25%BA (ft^2 / acre) 10 10 10 Linear 1/2 25%
Comments
27, 60
presentCriterion
Risk Begins (a)
Risk Peaks (b)
Risk Decreases (c)
Risk Agent(s): Ips Engraver Beetle (Ips confusus)
M262B
Criteria 1Criteria 2
10
Risk Begins (a)
Risk Peaks (b)Criterion
Risk Decreases (c) Curve Rank Weight
25%
Risk Ends (d)
Pinyon Pine (Pinus monophylla, P. quadrifolia )
Weight
Model Certainity 3 - Informed Professional Judgement
Risk Ends (d) Curve Rank
6
Criteria 3Criteria 4Criteria 5Criteria 6Criteria 7Criteria 8
Criteria 5Criteria 6
Criteria 9Criteria 10
Criteria 1Criteria 2
Constraints
Citations
Rank/Weight
Rank/Weight
Criteria 7Criteria 8Criteria 9Criteria 10
Criteria 3Criteria 4

Risk* of Mortality
LegendLevel of risk for host
0 - 2 Little or no risk
3 - 4 Low risk
5 - 6 Medium risk
7 - 10 High risk
Ips Engraver Beetle (Ips confusus)on Pinyon Pine (CA)
Mortality Ceiling of 25%
*Risk of experiencing mortality at a given threshold over a 15 year period. Printing Date: October 30, 2007
0 100 200 30050Miles
M262B

Percent Contribution*
Legend
Percent contribution
0 - 25
26 - 50
51 - 75
76 - 100
Ips Engraver Beetle (Ips confusus)on Pinyon Pine (CA)
*Percent contribution to composite basal area loss attributed to the individual risk agent. Printing Date: October 30, 2007
0 100 200 30050Miles
M262B

Risk Model Worksheet - CaliforniaHost(s):
Model Extent: Max Percent Mortality:
Susceptibility
0%
Vulnerability
1 100%SDI 230 230 230 Linear 1/2 33%QMD (inches) 6 6 6 Linear 1 67%
Comments
28, 29
230Criterion
Risk Begins (a)
Risk Peaks (b)
Risk Decreases (c)
Risk Agent(s): Jeffrey Pine Beetle
M261D, M261E and M261G
Criteria 1Criteria 2
Risk Begins (a)
Risk Peaks (b)Criterion
Risk Decreases (c) Curve Rank Weight
40%
Risk Ends (d)
Jeffrey Pine (Pinus jeffreyi )
Weight
Model Certainity 3 - Informed Professional Judgement
Risk Ends (d) Curve Rank
6
Criteria 3Criteria 4Criteria 5Criteria 6Criteria 7Criteria 8
Criteria 5Criteria 6
Criteria 9Criteria 10
Criteria 1Criteria 2
Constraints
Citations
Rank/Weight
Rank/Weight
Criteria 7Criteria 8Criteria 9Criteria 10
Criteria 3Criteria 4
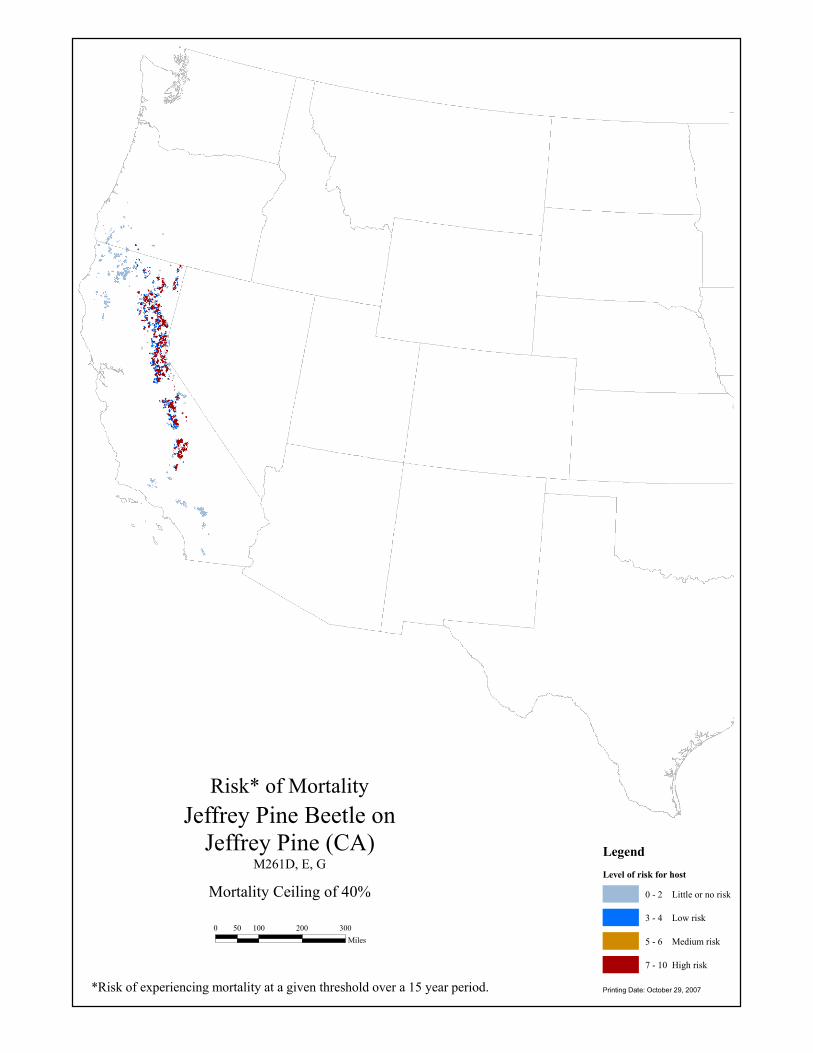
Risk* of Mortality
LegendLevel of risk for host
0 - 2 Little or no risk
3 - 4 Low risk
5 - 6 Medium risk
7 - 10 High risk
Jeffrey Pine Beetle onJeffrey Pine (CA)
Mortality Ceiling of 40%
*Risk of experiencing mortality at a given threshold over a 15 year period. Printing Date: October 29, 2007
0 100 200 30050Miles
M261D, E, G
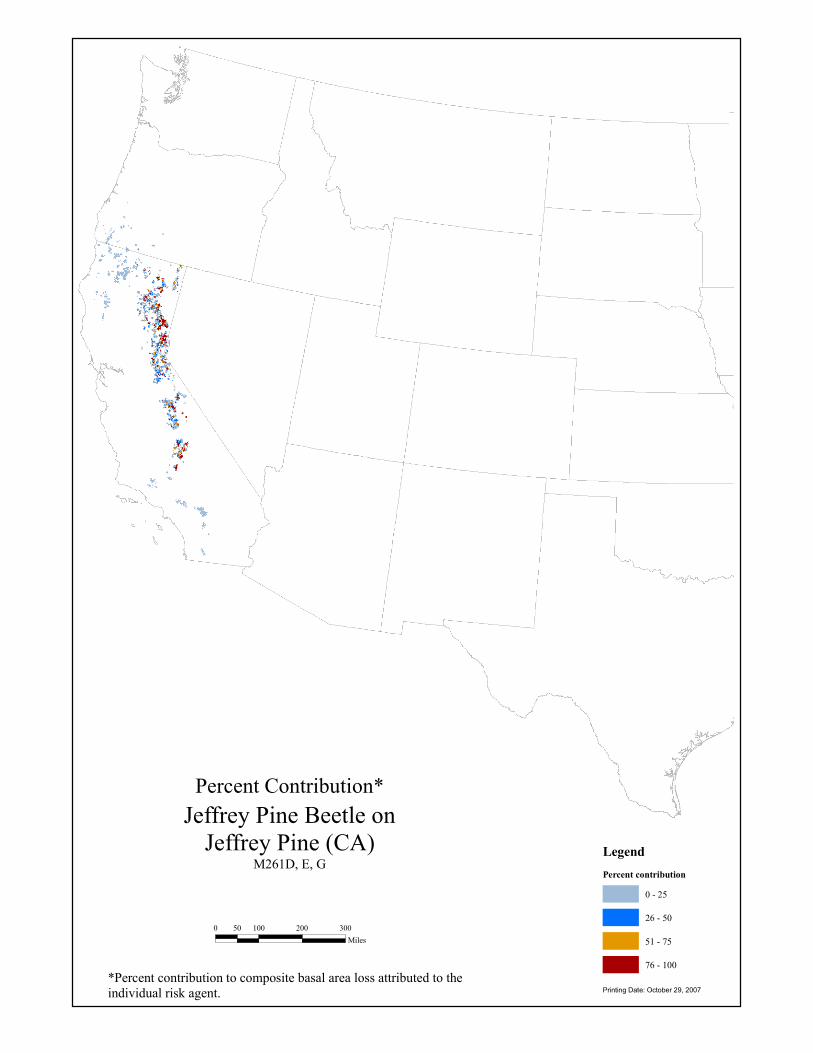
Percent Contribution*
LegendPercent contribution
0 - 25
26 - 50
51 - 75
76 - 100
Jeffrey Pine Beetle onJeffrey Pine (CA)
*Percent contribution to composite basal area loss attributed to the individual risk agent. Printing Date: October 29, 2007
0 100 200 30050Miles
M261D, E, G

Risk Model Worksheet - CaliforniaHost(s):
Model Extent: Max Percent Mortality:
Susceptibility
0%
Vulnerability
1 100%Crown Closure (%) 40 50 50 Linear 1/2 33%QMD (inches) 6 6 6 Linear 1 67%
CommentsConstraints
Citations
Rank/Weight
Rank/Weight
Criteria 7Criteria 8Criteria 9Criteria 10
Criteria 3Criteria 4
Criteria 7Criteria 8
Criteria 5Criteria 6
Criteria 9Criteria 10
Criteria 1Criteria 2
Criteria 3Criteria 4Criteria 5Criteria 6
Weight
Model Certainity 3 - Informed Professional Judgement
Risk Ends (d) Curve Rank
6
Curve Rank Weight
25%
Risk Ends (d)
Jeffrey Pine (Pinus jeffreyi )
Risk Begins (a)
Risk Peaks (b)Criterion
Risk Decreases (c)
Risk Agent(s): Jeffrey Pine Beetle
M262B
Criteria 1Criteria 2
28, 29
50Criterion
Risk Begins (a)
Risk Peaks (b)
Risk Decreases (c)

Risk* of Mortality
LegendLevel of risk for host
0 - 2 Little or no risk
3 - 4 Low risk
5 - 6 Medium risk
7 - 10 High risk
Jeffrey Pine Beetle onJeffrey Pine (CA)
Mortality Ceiling of 25%
*Risk of experiencing mortality at a given threshold over a 15 year period. Printing Date: October 29, 2007
0 100 200 30050Miles
M262B

Percent Contribution*
LegendPercent contribution
0 - 25
26 - 50
51 - 75
76 - 100
Jeffrey Pine Beetle onJeffrey Pine (CA)
*Percent contribution to composite basal area loss attributed to the individual risk agent. Printing Date: October 29, 2007
0 100 200 30050Miles
M262B

Risk Model Worksheet - CaliforniaHost(s):
Model Extent: Max Percent Mortality:
Susceptibility
0%
Vulnerability
1 100%Host % 10% 10% 10% Linear 1 67%QMD (inches) 6 6 6 Linear 1/2 33%
Comments
9
10%Criterion
Risk Begins (a)
Risk Peaks (b)
Risk Decreases (c)
Risk Agent(s): Mountain Pine Beetle
M262A, M262B and 261B
Criteria 1Criteria 2
Risk Begins (a)
Risk Peaks (b)Criterion
Risk Decreases (c) Curve Rank Weight
45%
Risk Ends (d)
Coulter Pine (Pinus coulteri )
Weight
Model Certainity 3 - Informed Professional Judgement
Risk Ends (d) Curve Rank
6
Criteria 3Criteria 4Criteria 5Criteria 6Criteria 7Criteria 8
Criteria 5Criteria 6
Criteria 9Criteria 10
Criteria 1Criteria 2
Constraints
Citations
Rank/Weight
Rank/Weight
Criteria 7Criteria 8Criteria 9Criteria 10
Criteria 3Criteria 4

Risk* of Mortality
LegendLevel of risk for host
0 - 2 Little or no risk
3 - 4 Low risk
5 - 6 Medium risk
7 - 10 High risk
Mountain Pine Beetleon Coulter Pine (CA)
Mortality Ceiling of 45%
*Risk of experiencing mortality at a given threshold over a 15 year period. Printing Date: October 29, 2007
0 100 200 30050Miles

Percent Contribution*
LegendPercent contribution
0 - 25
26 - 50
51 - 75
76 - 100
Mountain Pine Beetleon Coulter Pine (CA)
*Percent contribution to composite basal area loss attributed to the individual risk agent. Printing Date: October 29, 2007
0 100 200 30050Miles
Risk Model Worksheet - CaliforniaHost(s):
Model Extent: Max Percent Mortality:
Susceptibility
0%
Vulnerability
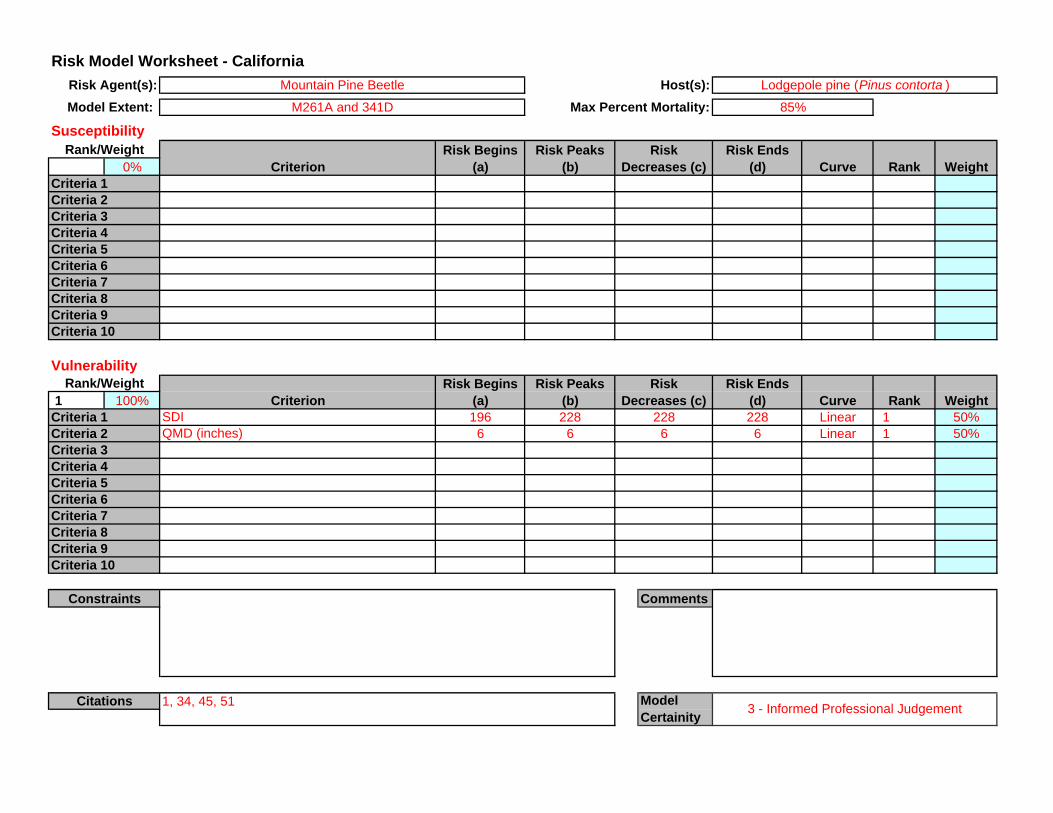
1 100%SDI 196 228 228 Linear 1 50%QMD (inches) 6 6 6 Linear 1 50%
CommentsConstraints
Citations
Rank/Weight
Rank/Weight
Criteria 7Criteria 8Criteria 9Criteria 10
Criteria 3Criteria 4
Criteria 7Criteria 8
Criteria 5Criteria 6
Criteria 9Criteria 10
Criteria 1Criteria 2
Criteria 3Criteria 4Criteria 5Criteria 6
Weight
Model Certainity 3 - Informed Professional Judgement
Risk Ends (d) Curve Rank
6
Curve Rank Weight
85%
Risk Ends (d)
Lodgepole pine (Pinus contorta )
Risk Begins (a)
Risk Peaks (b)Criterion
Risk Decreases (c)
Risk Agent(s): Mountain Pine Beetle
M261A and 341D
Criteria 1Criteria 2
1, 34, 45, 51
228Criterion
Risk Begins (a)
Risk Peaks (b)
Risk Decreases (c)
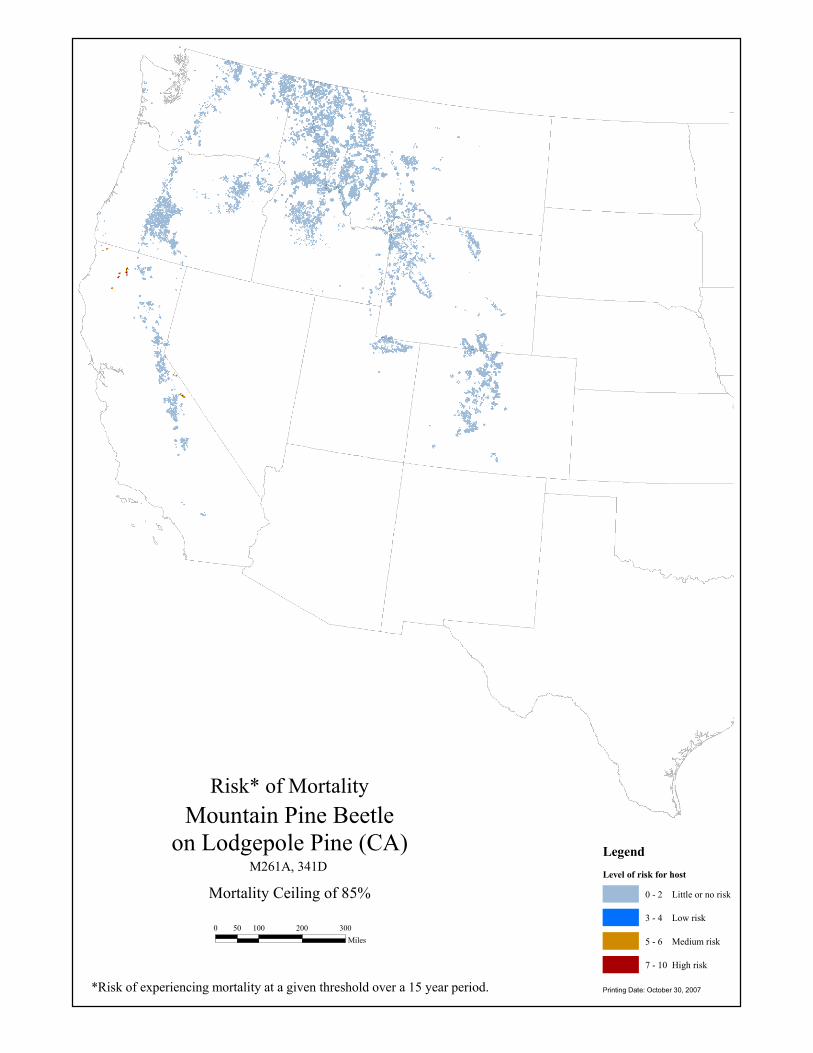
Risk* of Mortality
LegendLevel of risk for host
0 - 2 Little or no risk
3 - 4 Low risk
5 - 6 Medium risk
7 - 10 High risk
Mountain Pine Beetleon Lodgepole Pine (CA)
Mortality Ceiling of 85%
*Risk of experiencing mortality at a given threshold over a 15 year period. Printing Date: October 30, 2007
0 100 200 30050Miles
M261A, 341D
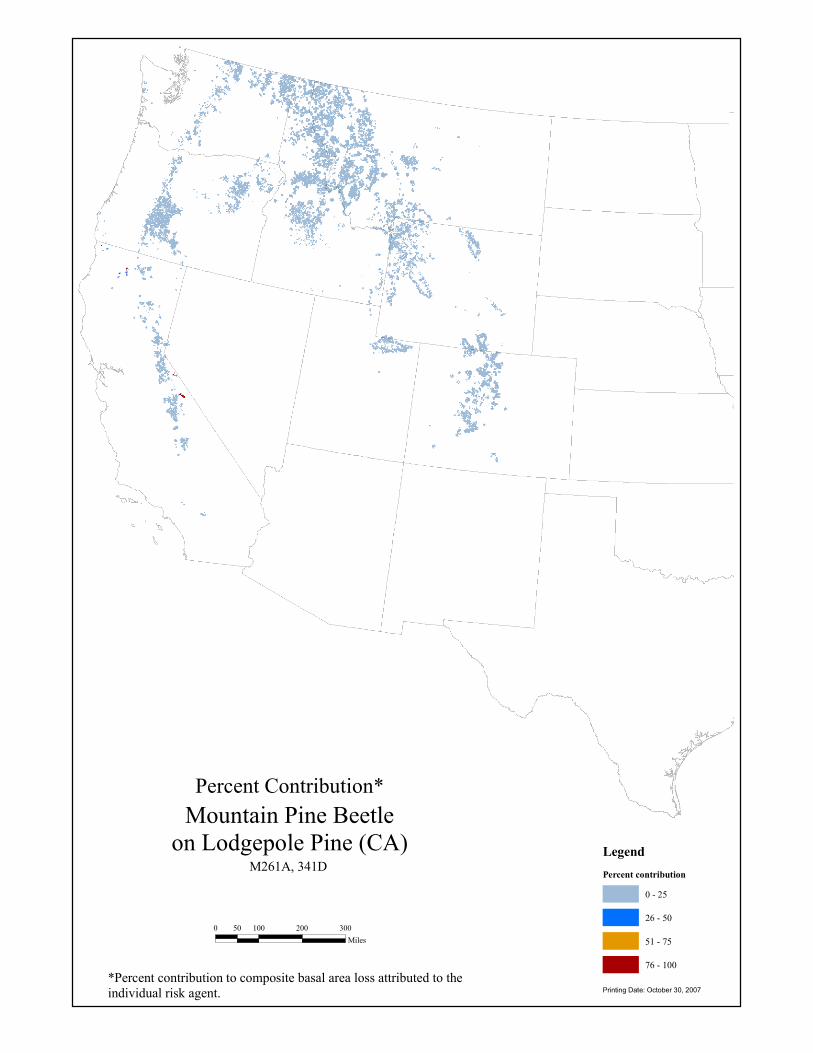
Percent Contribution*
LegendPercent contribution
0 - 25
26 - 50
51 - 75
76 - 100
Mountain Pine Beetleon Lodgepole Pine (CA)
*Percent contribution to composite basal area loss attributed to the individual risk agent. Printing Date: October 30, 2007
0 100 200 30050Miles
M261A, 341D

Risk Model Worksheet - CaliforniaHost(s):
Model Extent: Max Percent Mortality:
Susceptibility
0%
Vulnerability
1 100%SDI 196 196 196 Linear 1/2 33%QMD (inches) 6 6 6 Linear 1 67%
CommentsConstraints
Citations
Rank/Weight
Rank/Weight
Criteria 7Criteria 8Criteria 9Criteria 10
Criteria 3Criteria 4
Criteria 7Criteria 8
Criteria 5Criteria 6
Criteria 9Criteria 10
Criteria 1Criteria 2
Criteria 3Criteria 4Criteria 5Criteria 6
Weight
Model Certainity 3 - Informed Professional Judgement
Risk Ends (d) Curve Rank
6
Curve Rank Weight
85%
Risk Ends (d)
Lodgepole pine (Pinus contorta )
Risk Begins (a)
Risk Peaks (b)Criterion
Risk Decreases (c)
Risk Agent(s): Mountain Pine Beetle
M261D, E, G, M262A and B
Criteria 1Criteria 2
1, 34, 45, 51
196Criterion
Risk Begins (a)
Risk Peaks (b)
Risk Decreases (c)

Risk* of Mortality
LegendLevel of risk for host
0 - 2 Little or no risk
3 - 4 Low risk
5 - 6 Medium risk
7 - 10 High risk
Mountain Pine Beetleon Lodgepole Pine (CA)
Mortality Ceiling of 85%
*Risk of experiencing mortality at a given threshold over a 15 year period. Printing Date: October 30, 2007
0 100 200 30050Miles
M261D, E, G, M262A, B
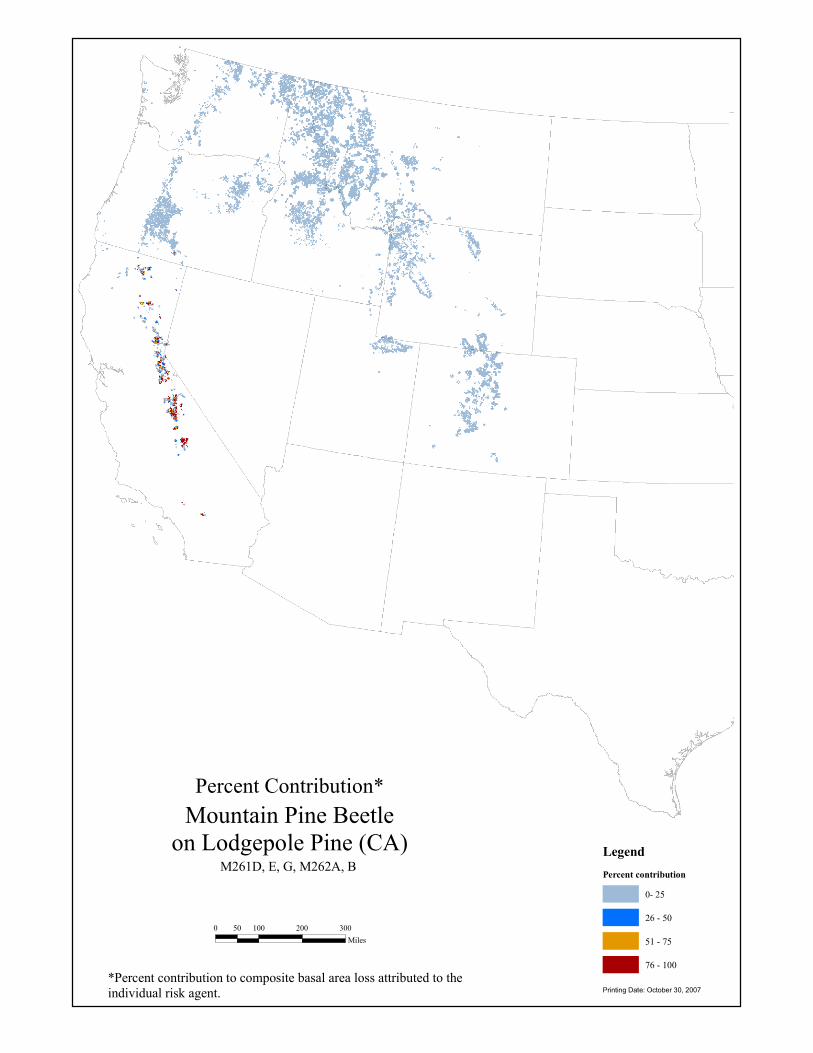
Percent Contribution*
LegendPercent contribution
0- 25
26 - 50
51 - 75
76 - 100
Mountain Pine Beetleon Lodgepole Pine (CA)
*Percent contribution to composite basal area loss attributed to the individual risk agent. Printing Date: October 30, 2007
0 100 200 30050Miles
M261D, E, G, M262A, B
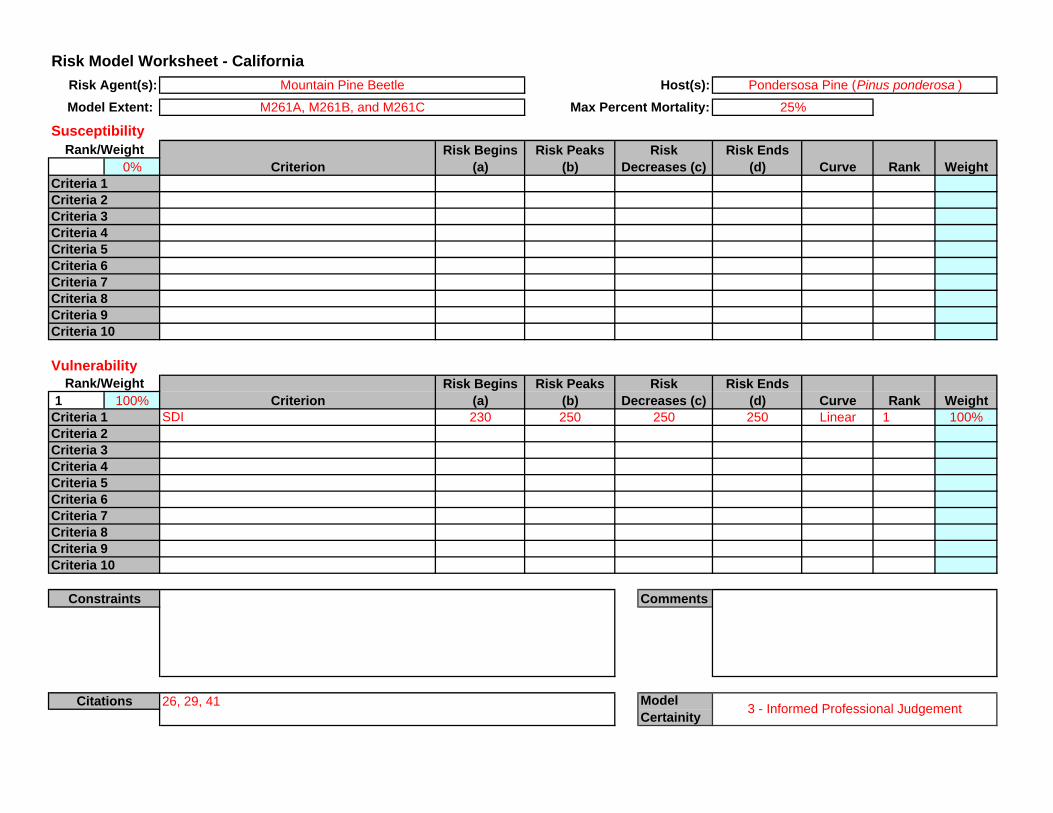
Risk Model Worksheet - CaliforniaHost(s):
Model Extent: Max Percent Mortality:
Susceptibility
0%
Vulnerability
1 100%SDI 230 250 250 Linear 1 100%
Comments
26, 29, 41
250Criterion
Risk Begins (a)
Risk Peaks (b)
Risk Decreases (c)
Risk Agent(s): Mountain Pine Beetle
M261A, M261B, and M261C
Criteria 1Criteria 2
Risk Begins (a)
Risk Peaks (b)Criterion
Risk Decreases (c) Curve Rank Weight
25%
Risk Ends (d)
Pondersosa Pine (Pinus ponderosa )
Weight
Model Certainity 3 - Informed Professional Judgement
Risk Ends (d) Curve Rank
Criteria 3Criteria 4Criteria 5Criteria 6Criteria 7Criteria 8
Criteria 5Criteria 6
Criteria 9Criteria 10
Criteria 1Criteria 2
Constraints
Citations
Rank/Weight
Rank/Weight
Criteria 7Criteria 8Criteria 9Criteria 10
Criteria 3Criteria 4
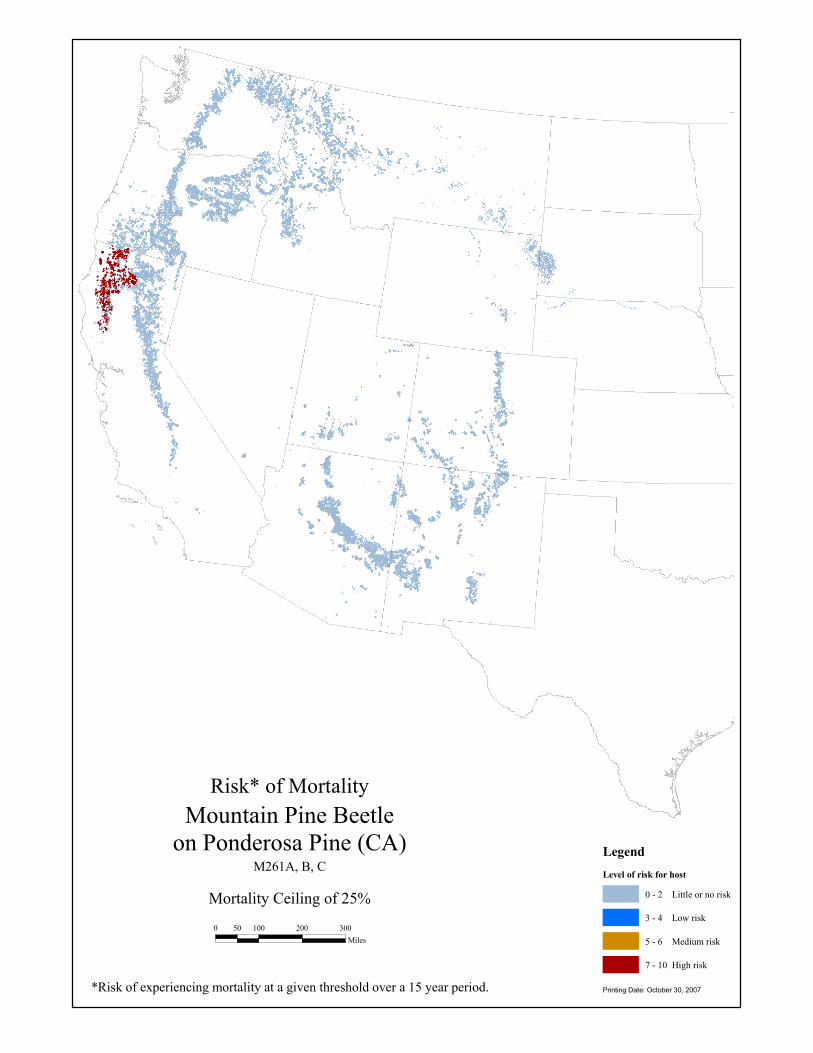
Risk* of Mortality
LegendLevel of risk for host
0 - 2 Little or no risk
3 - 4 Low risk
5 - 6 Medium risk
7 - 10 High risk
Mountain Pine Beetleon Ponderosa Pine (CA)
Mortality Ceiling of 25%
*Risk of experiencing mortality at a given threshold over a 15 year period. Printing Date: October 30, 2007
0 100 200 30050Miles
M261A, B, C

Percent Contribution*
LegendPercent contribution
0 - 25
26 - 50
51 - 75
76 - 100
Mountain Pine Beetleon Ponderosa Pine (CA)
*Percent contribution to composite basal area loss attributed to the individual risk agent. Printing Date: October 30, 2007
0 100 200 30050Miles
M261A, B, C

Risk Model Worksheet - CaliforniaHost(s):
Model Extent: Max Percent Mortality:
Susceptibility
0%
Vulnerability
1 100%SDI 230 250 250 Linear 1/2 33%QMD (inches) 8 8 8 Linear 1 67%
Comments
26, 29, 41
250Criterion
Risk Begins (a)
Risk Peaks (b)
Risk Decreases (c)
Risk Agent(s): Mountain Pine Beetle
M261D, M261E, and M261G
Criteria 1Criteria 2
Risk Begins (a)
Risk Peaks (b)Criterion
Risk Decreases (c) Curve Rank Weight
20%
Risk Ends (d)
Pondersosa Pine (Pinus ponderosa )
Weight
Model Certainity 2 - Literature/Research Based
Risk Ends (d) Curve Rank
8
Criteria 3Criteria 4Criteria 5Criteria 6Criteria 7Criteria 8
Criteria 5Criteria 6
Criteria 9Criteria 10
Criteria 1Criteria 2
Constraints
Citations
Rank/Weight
Rank/Weight
Criteria 7Criteria 8Criteria 9Criteria 10
Criteria 3Criteria 4
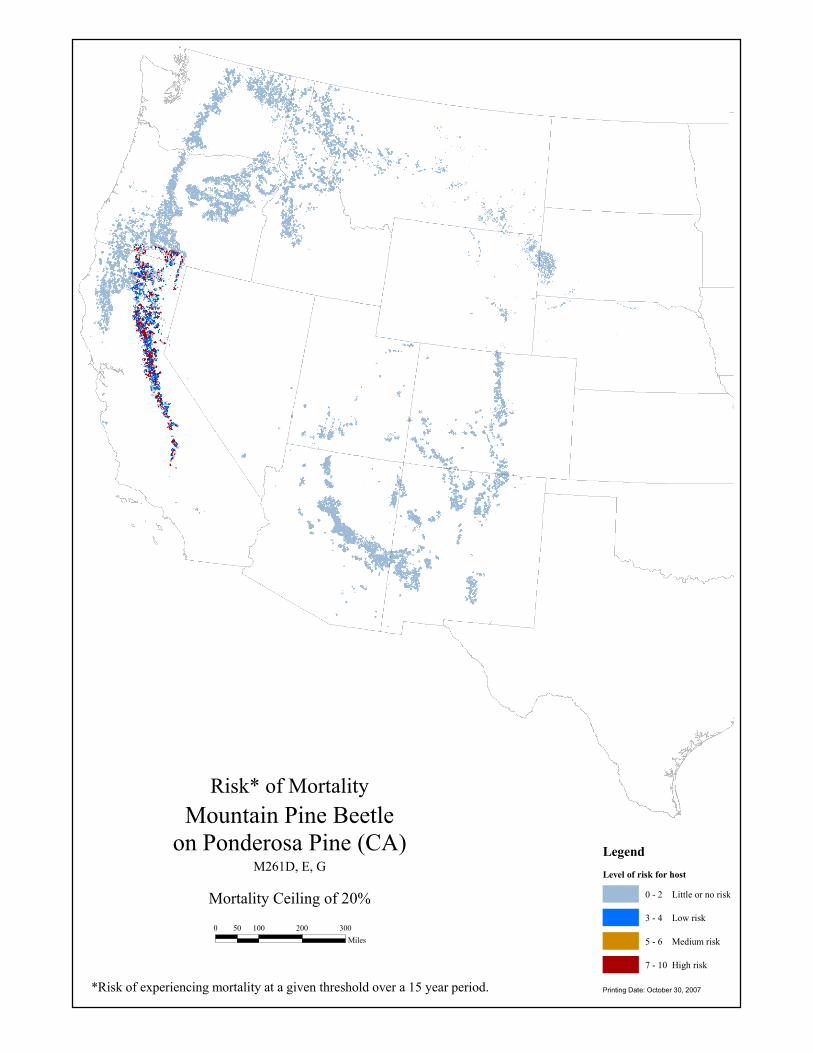
Risk* of Mortality
LegendLevel of risk for host
0 - 2 Little or no risk
3 - 4 Low risk
5 - 6 Medium risk
7 - 10 High risk
Mountain Pine Beetleon Ponderosa Pine (CA)
Mortality Ceiling of 20%
*Risk of experiencing mortality at a given threshold over a 15 year period. Printing Date: October 30, 2007
0 100 200 30050Miles
M261D, E, G

Percent Contribution*
LegendPercent contribution
0 - 25
26 - 50
51 - 75
76 - 100
Mountain Pine Beetleon Ponderosa Pine (CA)
*Percent contribution to composite basal area loss attributed to the individual risk agent. Printing Date: October 30, 2007
0 100 200 30050Miles
M261D, E, G

Risk Model Worksheet - CaliforniaHost(s):
Model Extent: Max Percent Mortality:
Susceptibility
0%
Vulnerability
1 100%SDI 230 250 250 Linear 1/2 33%QMD (inches) 6 6 6 Linear 1 67%
Comments
26, 29, 41
250Criterion
Risk Begins (a)
Risk Peaks (b)
Risk Decreases (c)
Risk Agent(s): Mountain Pine Beetle
M262A and M262B
Criteria 1Criteria 2
Risk Begins (a)
Risk Peaks (b)Criterion
Risk Decreases (c) Curve Rank Weight
20%
Risk Ends (d)
Pondersosa Pine (Pinus ponderosa )
Weight
Model Certainity 3 - Informed Professional Judgement
Risk Ends (d) Curve Rank
6
Criteria 3Criteria 4Criteria 5Criteria 6Criteria 7Criteria 8
Criteria 5Criteria 6
Criteria 9Criteria 10
Criteria 1Criteria 2
Constraints
Citations
Rank/Weight
Rank/Weight
Criteria 7Criteria 8Criteria 9Criteria 10
Criteria 3Criteria 4
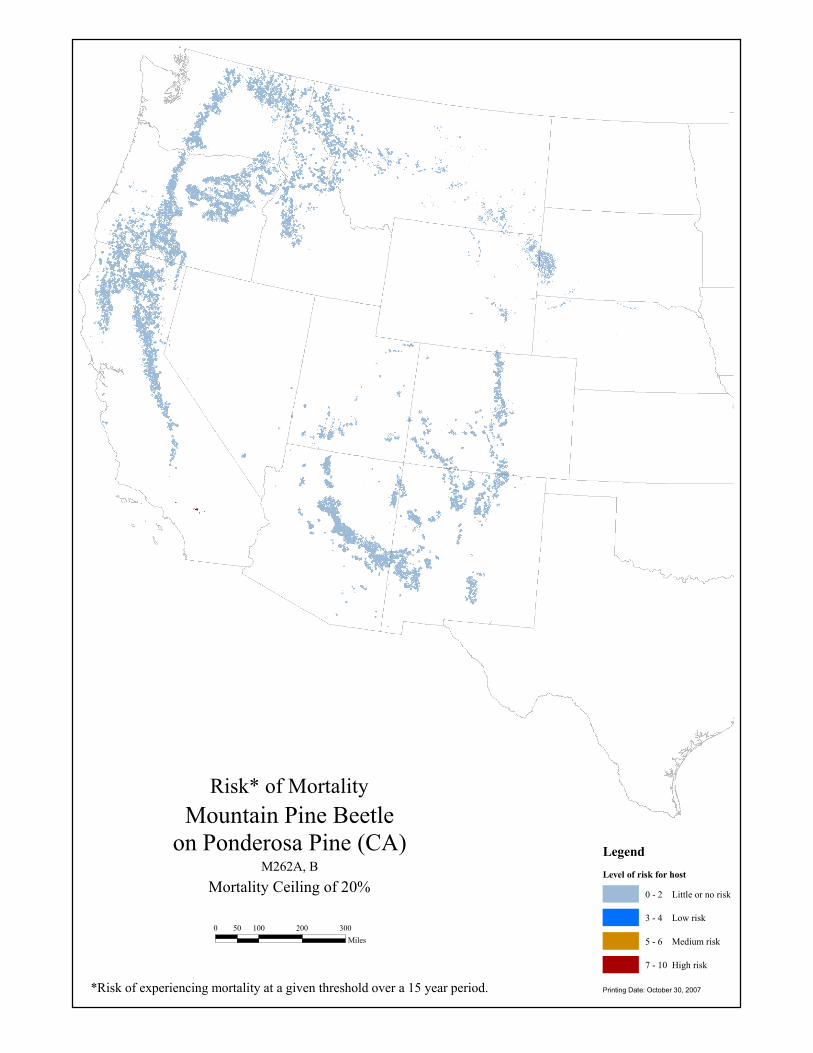
LegendLevel of risk for host
0 - 2 Little or no risk
3 - 4 Low risk
5 - 6 Medium risk
7 - 10 High risk
Mountain Pine Beetleon Ponderosa Pine (CA)
Printing Date: October 30, 2007
0 100 200 30050Miles
M262A, B
Risk* of Mortality
*Risk of experiencing mortality at a given threshold over a 15 year period.
Mortality Ceiling of 20%
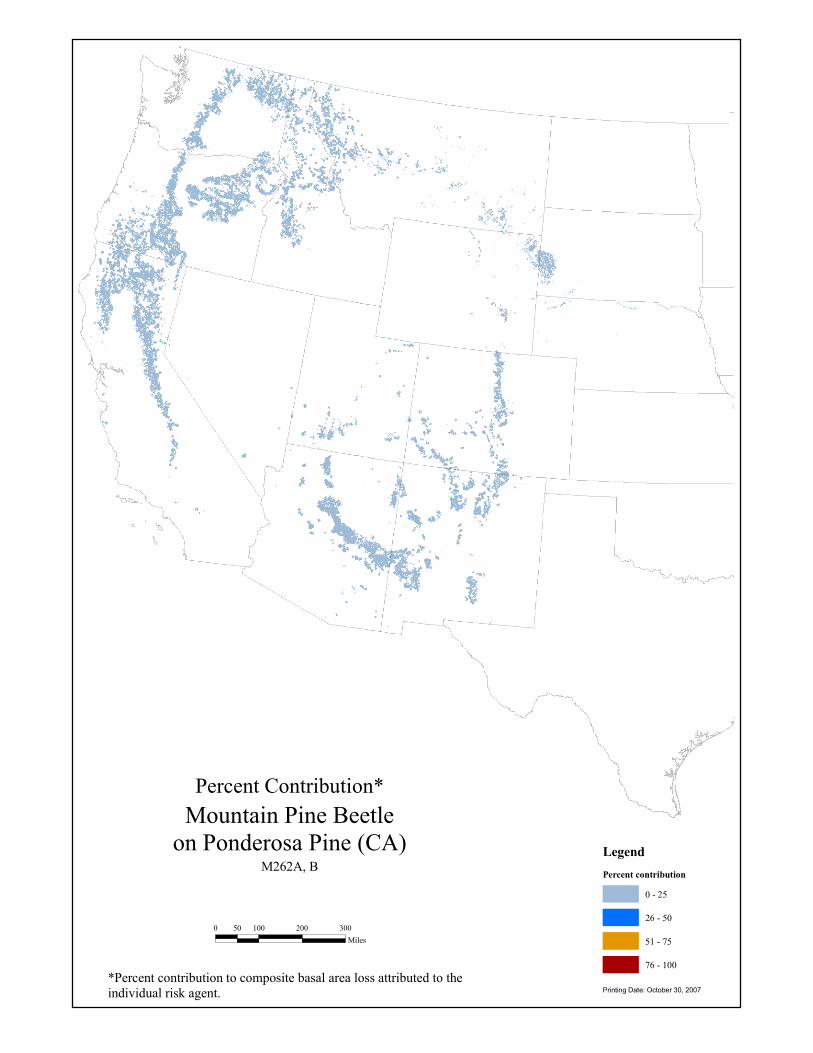
Percent Contribution*
LegendPercent contribution
0 - 25
26 - 50
51 - 75
76 - 100
Mountain Pine Beetleon Ponderosa Pine (CA)
*Percent contribution to composite basal area loss attributed to the individual risk agent. Printing Date: October 30, 2007
0 100 200 30050Miles
M262A, B

Risk Model Worksheet - CaliforniaHost(s):
Model Extent: Max Percent Mortality:
Susceptibility
0%
Vulnerability
1 100%SDI 200 200 200 Linear 1/2 33%DBH (inches) 6 6 6 Linear 1 67%
Comments
15, 41, 51, 52
200Criterion
Risk Begins (a)
Risk Peaks (b)
Risk Decreases (c)
Risk Agent(s): Mountain Pine Beetle
M261A, M261B, M261C, M262A & M262B
Criteria 1Criteria 2
Risk Begins (a)
Risk Peaks (b)Criterion
Risk Decreases (c) Curve Rank Weight
50%
Risk Ends (d)
Sugar Pine (Pinus lambertiana )
Weight
Model Certainity 3 - Informed Professional Judgement
Risk Ends (d) Curve Rank
6
Criteria 3Criteria 4Criteria 5Criteria 6Criteria 7Criteria 8
Criteria 5Criteria 6
Criteria 9Criteria 10
Criteria 1Criteria 2
Constraints
Citations
Rank/Weight
Rank/Weight
Criteria 7Criteria 8Criteria 9Criteria 10
Criteria 3Criteria 4
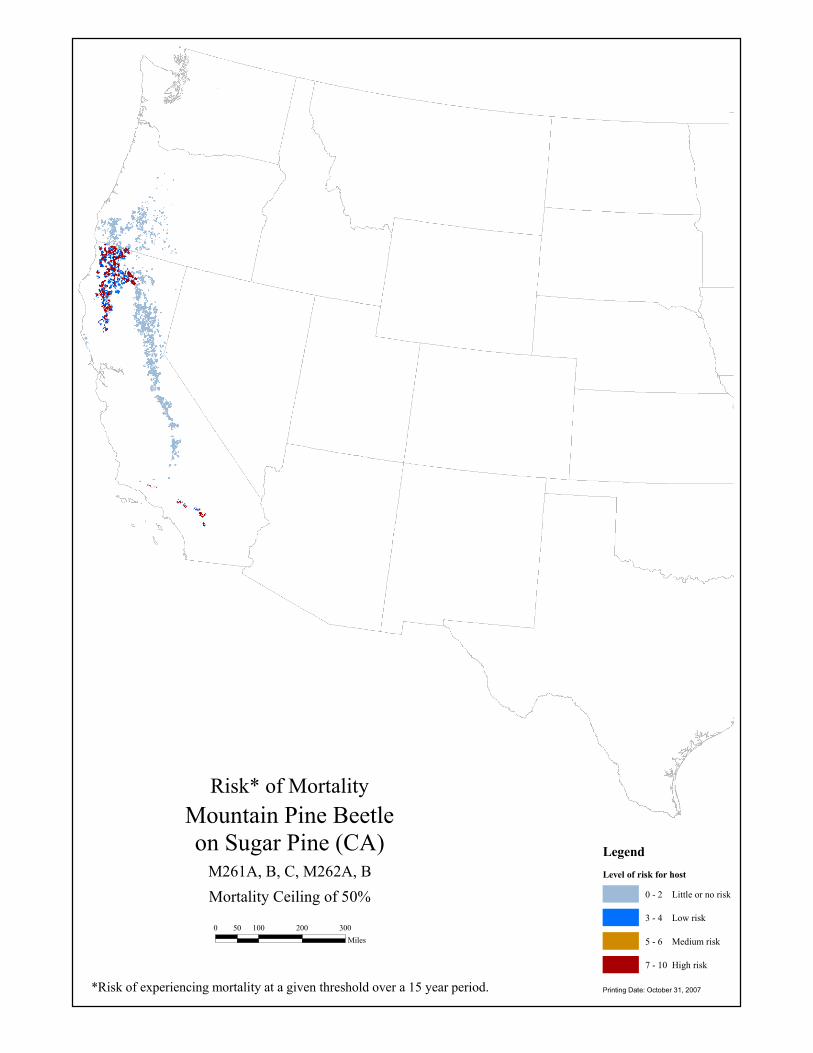
Risk* of Mortality
LegendLevel of risk for host
0 - 2 Little or no risk
3 - 4 Low risk
5 - 6 Medium risk
7 - 10 High risk
Mountain Pine Beetleon Sugar Pine (CA)
Mortality Ceiling of 50%
*Risk of experiencing mortality at a given threshold over a 15 year period. Printing Date: October 31, 2007
0 100 200 30050Miles
M261A, B, C, M262A, B
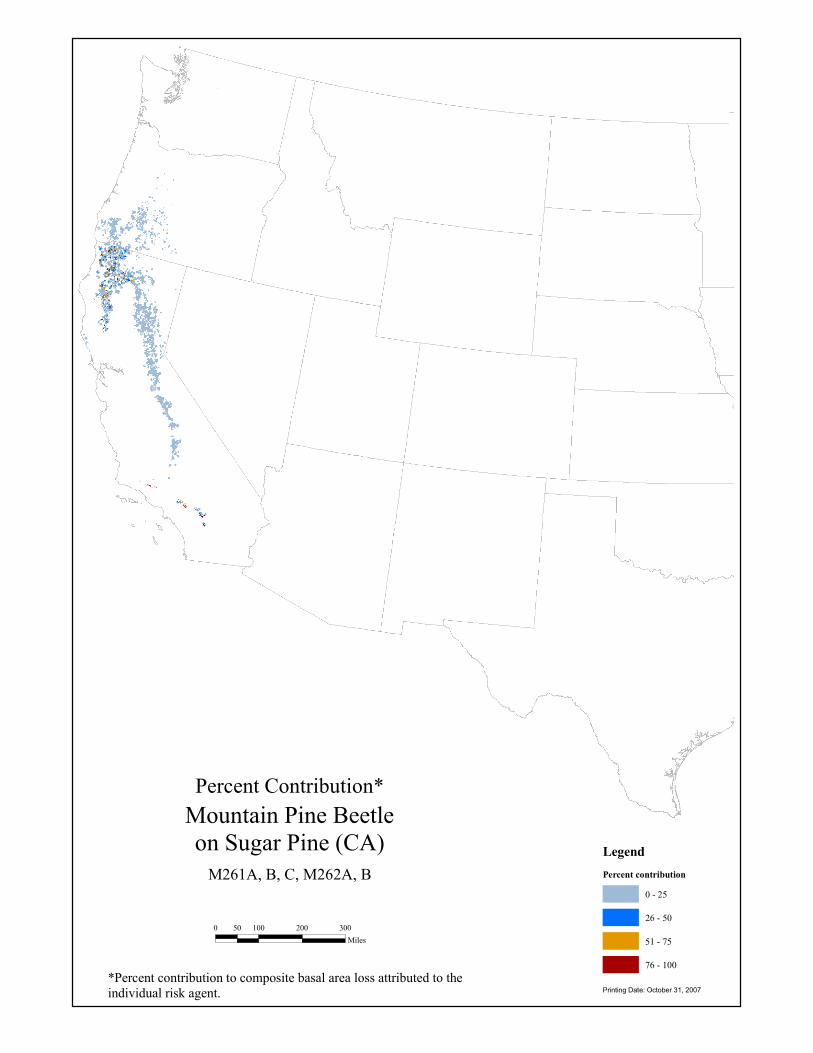
Percent Contribution*
LegendPercent contribution
0 - 25
26 - 50
51 - 75
76 - 100
Mountain Pine Beetleon Sugar Pine (CA)
*Percent contribution to composite basal area loss attributed to the individual risk agent. Printing Date: October 31, 2007
0 100 200 30050Miles
M261A, B, C, M262A, B

Risk Model Worksheet - CaliforniaHost(s):
Model Extent: Max Percent Mortality:
Susceptibility
0%
Vulnerability
1 100%SDI 200 200 200 Linear 1/2 33%DBH (inches) 6 6 6 Linear 1 67%
CommentsConstraints
Citations
Rank/Weight
Rank/Weight
Criteria 7Criteria 8Criteria 9Criteria 10
Criteria 3Criteria 4
Criteria 7Criteria 8
Criteria 5Criteria 6
Criteria 9Criteria 10
Criteria 1Criteria 2
Criteria 3Criteria 4Criteria 5Criteria 6
Weight
Model Certainity 3 - Informed Professional Judgement
Risk Ends (d) Curve Rank
6
Curve Rank Weight
50%
Risk Ends (d)
Sugar Pine (Pinus lambertiana )
Risk Begins (a)
Risk Peaks (b)Criterion
Risk Decreases (c)
Risk Agent(s): Mountain Pine Beetle
M261D, M261E and M261G
Criteria 1Criteria 2
15, 41, 51, 52
200Criterion
Risk Begins (a)
Risk Peaks (b)
Risk Decreases (c)
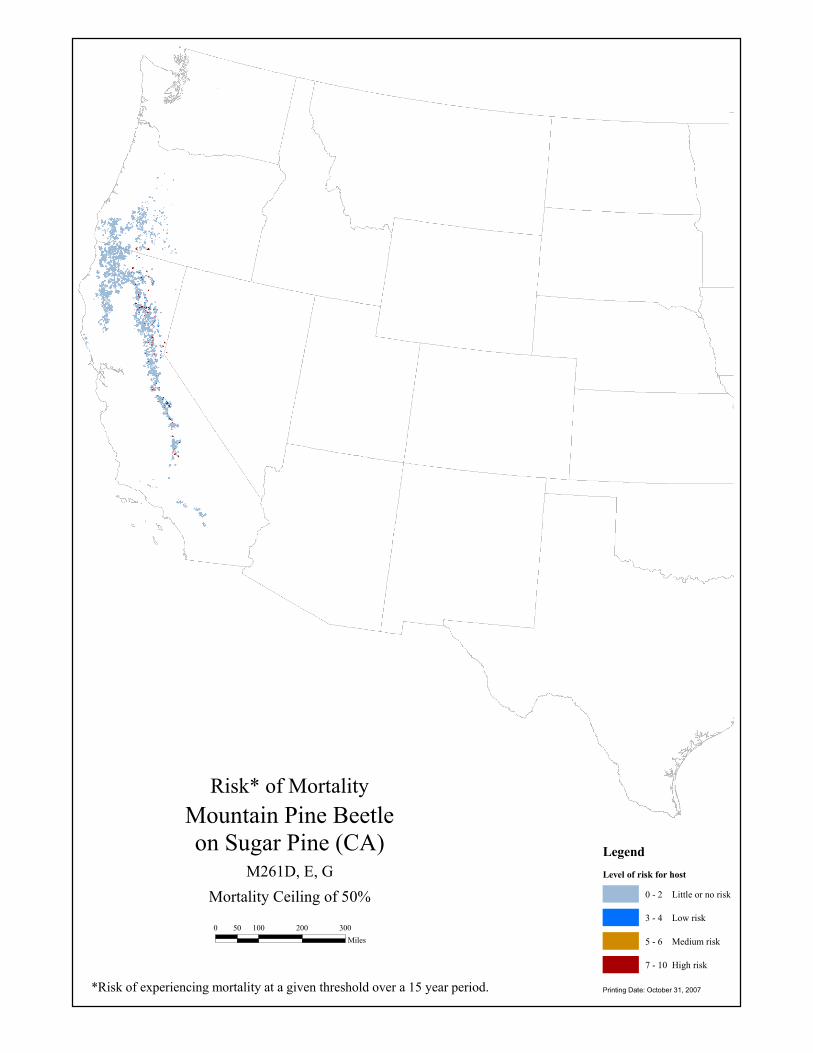
Risk* of Mortality
LegendLevel of risk for host
0 - 2 Little or no risk
3 - 4 Low risk
5 - 6 Medium risk
7 - 10 High risk
Mountain Pine Beetleon Sugar Pine (CA)
Mortality Ceiling of 50%
*Risk of experiencing mortality at a given threshold over a 15 year period. Printing Date: October 31, 2007
0 100 200 30050Miles
M261D, E, G
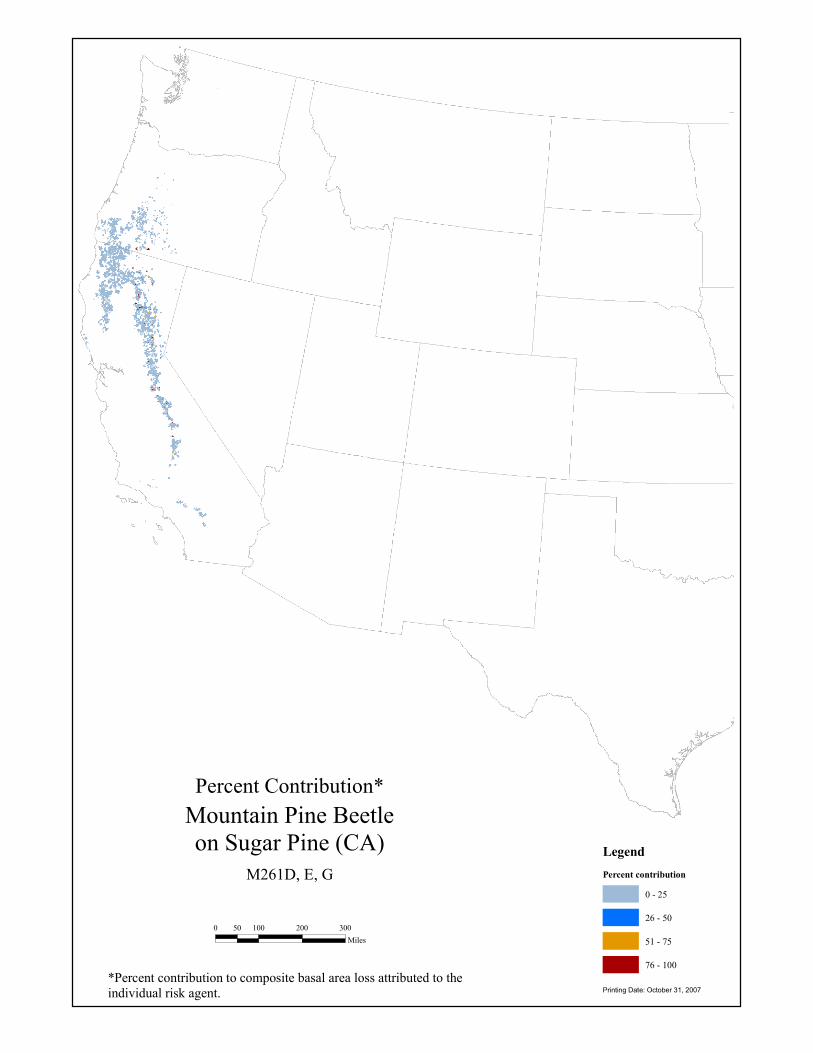
Percent Contribution*
LegendPercent contribution
0 - 25
26 - 50
51 - 75
76 - 100
Mountain Pine Beetleon Sugar Pine (CA)
*Percent contribution to composite basal area loss attributed to the individual risk agent. Printing Date: October 31, 2007
0 100 200 30050Miles
M261D, E, G

Risk Model Worksheet - CaliforniaHost(s):
Model Extent: Max Percent Mortality:
Susceptibility
0
Vulnerability
0SDI 200 365 365 Linear 1 100%
CommentsConstraints
Citations
Rank/Weight
Rank/Weight
Criteria 7Criteria 8Criteria 9Criteria 10
Criteria 3Criteria 4
Criteria 7Criteria 8
Criteria 5Criteria 6
Criteria 9Criteria 10
Criteria 1Criteria 2
Criteria 3Criteria 4Criteria 5Criteria 6
Weight
Model Certainity 3 - Informed Professional Judgement
Risk Ends (d) Curve Rank
Curve Rank Weight
50%
Risk Ends (d)
Western White Pine (Pinus monticola )
Risk Begins (a)
Risk Peaks (b)Criterion
Risk Decreases (c)
Risk Agent(s): Mountain Pine Beetle
M261A, M261D, M261G, M261E, 341D
Criteria 1Criteria 2
15
365Criterion
Risk Begins (a)
Risk Peaks (b)
Risk Decreases (c)
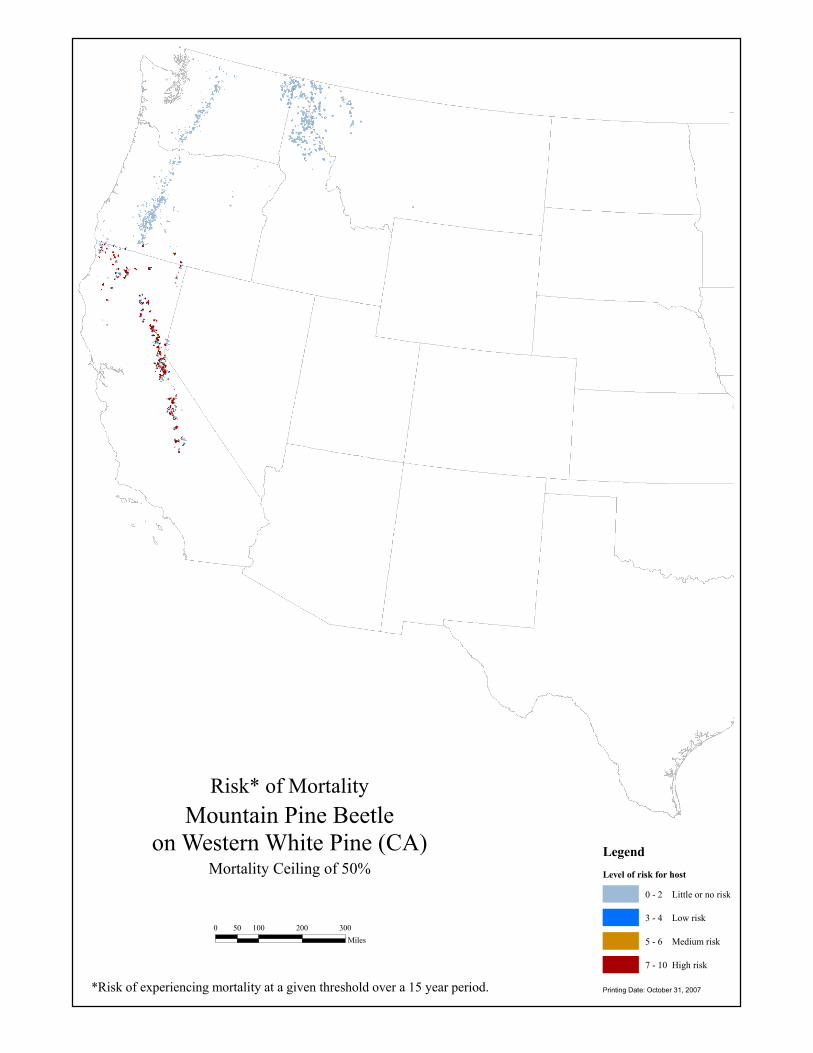
Risk* of Mortality
LegendLevel of risk for host
0 - 2 Little or no risk
3 - 4 Low risk
5 - 6 Medium risk
7 - 10 High risk
Mountain Pine Beetleon Western White Pine (CA)
Mortality Ceiling of 50%
*Risk of experiencing mortality at a given threshold over a 15 year period. Printing Date: October 31, 2007
0 100 200 30050Miles

Percent Contribution*
LegendPercent contribution
0 - 25
26 - 50
51 - 75
76 - 100
Mountain Pine Beetleon Western White Pine (CA)
*Percent contribution to composite basal area loss attributed to the individual risk agent. Printing Date: October 31, 2007
0 100 200 30050Miles

Risk Model Worksheet - CaliforniaHost(s):
Model Extent: Max Percent Mortality:
Susceptibility
0 0%
Vulnerability
1 100%Precipitation (mm) 25 125 125 Linear 1 33%Temperature (Celsius) 14 18 >26 J-4 1 33%Relative Humidity (%) 60 80 80 Linear 1 33%
Comments
22
125Criterion
Risk Begins (a)
Risk Peaks (b)
Risk Decreases (c)
Risk Agent(s): Sudden Oak Death (Phytopthera ramorum)
263A, 261A, 261B, M262A, M261B, M261A
Criteria 1Criteria 2
80
Risk Begins (a)
Risk Peaks (b)Criterion
Risk Decreases (c) Curve Rank Weight
50%
Risk Ends (d)
CA Black Oak (Quercus kelloggii)
Weight
Model Certainity 2 - Literature/Research Based
Risk Ends (d) Curve Rank
Adapted from Meentemeyer, et al. 2004.
22
Criteria 3Criteria 4Criteria 5Criteria 6Criteria 7Criteria 8
Criteria 5Criteria 6
Criteria 9Criteria 10
Criteria 1Criteria 2
Constraints
Citations
Rank/Weight
Rank/Weight
Criteria 7Criteria 8Criteria 9Criteria 10
Criteria 3Criteria 4
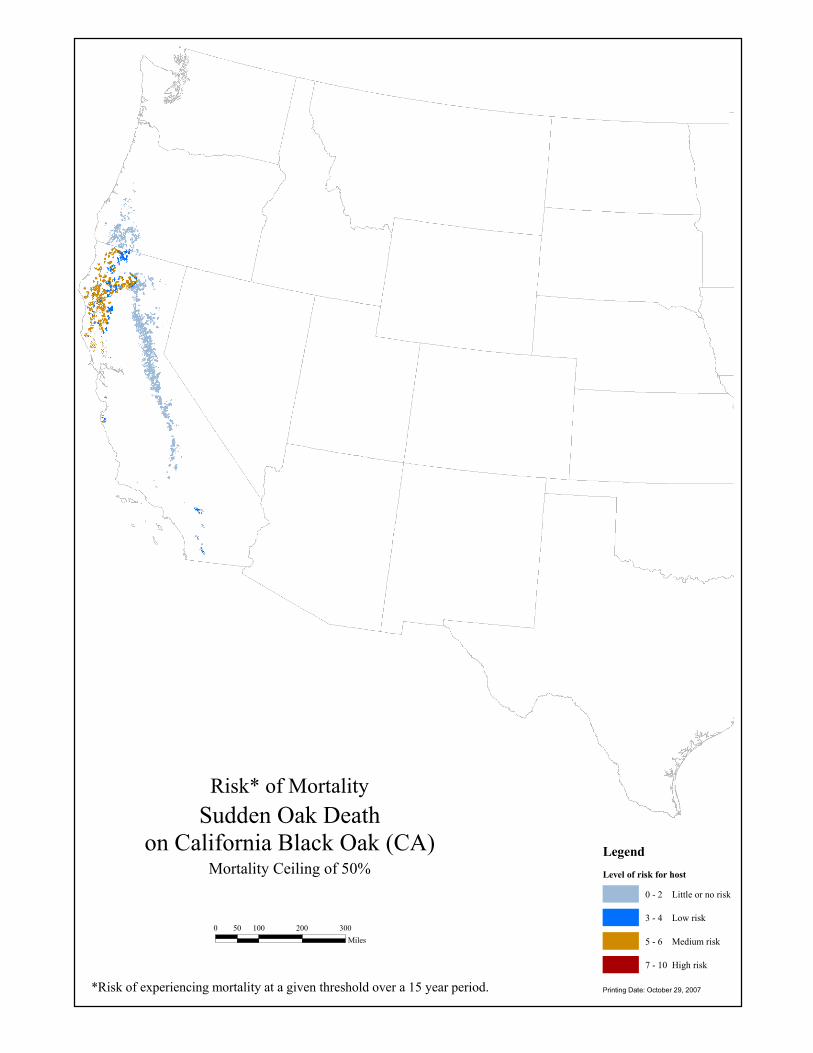
Risk* of Mortality
LegendLevel of risk for host
0 - 2 Little or no risk
3 - 4 Low risk
5 - 6 Medium risk
7 - 10 High risk
Sudden Oak Deathon California Black Oak (CA)
Mortality Ceiling of 50%
*Risk of experiencing mortality at a given threshold over a 15 year period. Printing Date: October 29, 2007
0 100 200 30050Miles
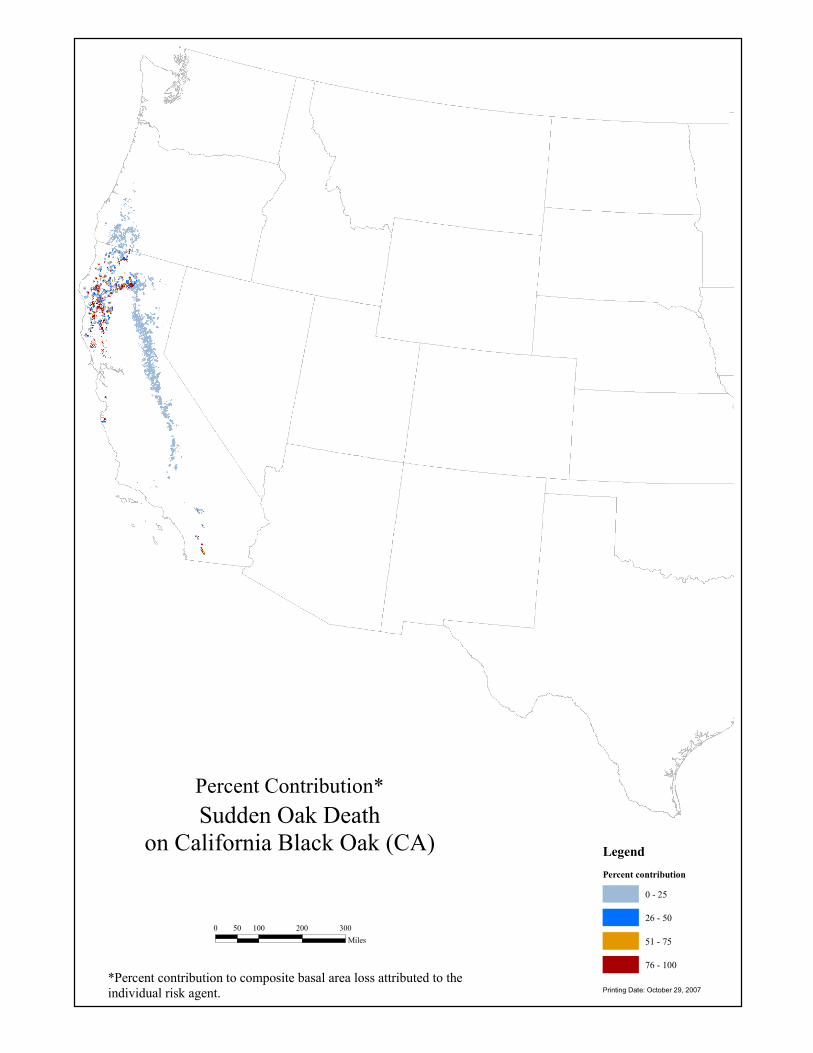
Percent Contribution*
LegendPercent contribution
0 - 25
26 - 50
51 - 75
76 - 100
Sudden Oak Deathon California Black Oak (CA)
*Percent contribution to composite basal area loss attributed to the individual risk agent. Printing Date: October 29, 2007
0 100 200 30050Miles

Risk Model Worksheet - CaliforniaHost(s):
Model Extent: Max Percent Mortality:
Susceptibility
0%
Vulnerability
1 100%Precipitation (mm) 25 125 125 Linear 1 33%Temperature (Celsius) 14 18 >26 J-4 1 33%Relative Humidity (%) 60 80 80 Linear 1 33%
CommentsConstraints
Citations
Rank/Weight
Rank/Weight
Criteria 7Criteria 8Criteria 9Criteria 10
Criteria 3Criteria 4
Criteria 7Criteria 8
Criteria 5Criteria 6
Criteria 9Criteria 10
Criteria 1Criteria 2
Criteria 3Criteria 4Criteria 5Criteria 6
Weight
Model Certainity 2 - Literature/Research Based
Risk Ends (d) Curve Rank
Adapted from Meentemeyer, et al. 2004.
22
Curve Rank Weight
50%
Risk Ends (d)
Canyon Live Oak (Quercus chrysolepis )
Risk Begins (a)
Risk Peaks (b)Criterion
Risk Decreases (c)
80
Risk Agent(s): Sudden Oak Death (Phytophthora ramorum)
263A, 261A, 261B, M262A, M261B, M261A
Criteria 1Criteria 2
22
125Criterion
Risk Begins (a)
Risk Peaks (b)
Risk Decreases (c)
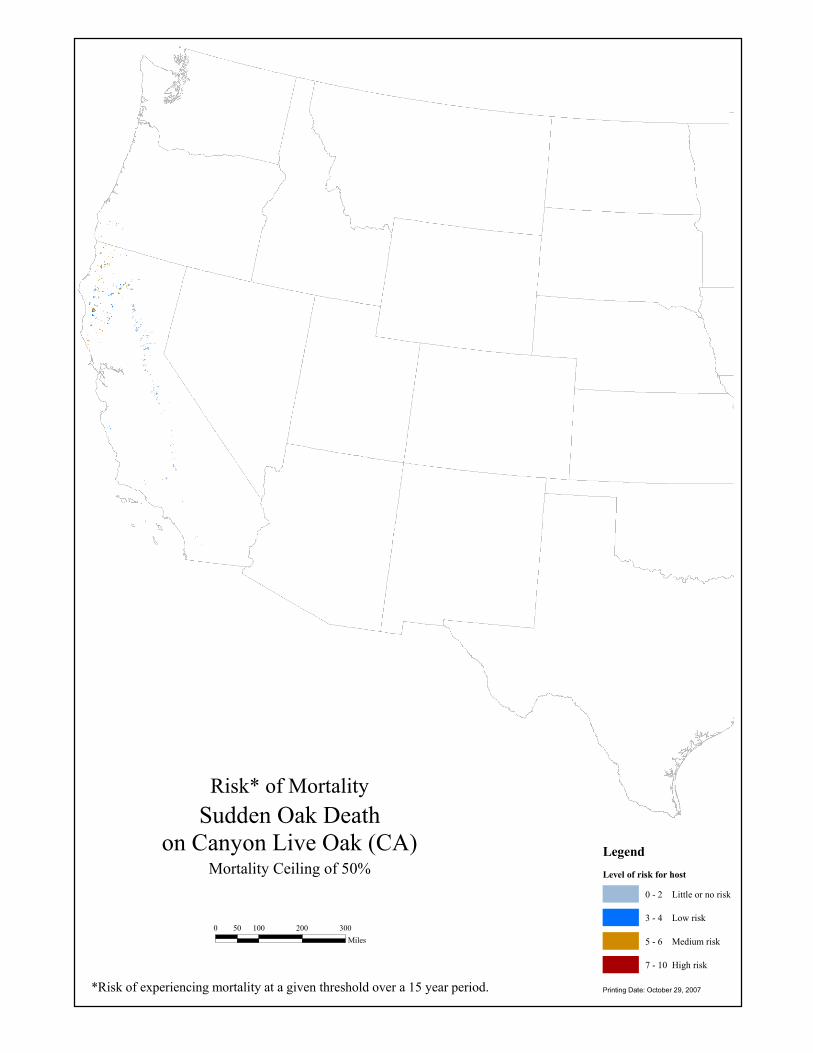
Risk* of Mortality
LegendLevel of risk for host
0 - 2 Little or no risk
3 - 4 Low risk
5 - 6 Medium risk
7 - 10 High risk
Sudden Oak Deathon Canyon Live Oak (CA)
Mortality Ceiling of 50%
*Risk of experiencing mortality at a given threshold over a 15 year period. Printing Date: October 29, 2007
0 100 200 30050Miles

Percent Contribution*
LegendPercent contribution
0 - 25
26 - 50
51 - 75
76 - 100
Sudden Oak Deathon Canyon Live Oak (CA)
*Percent contribution to composite basal area loss attributed to the individual risk agent. Printing Date: October 29, 2007
0 100 200 30050Miles
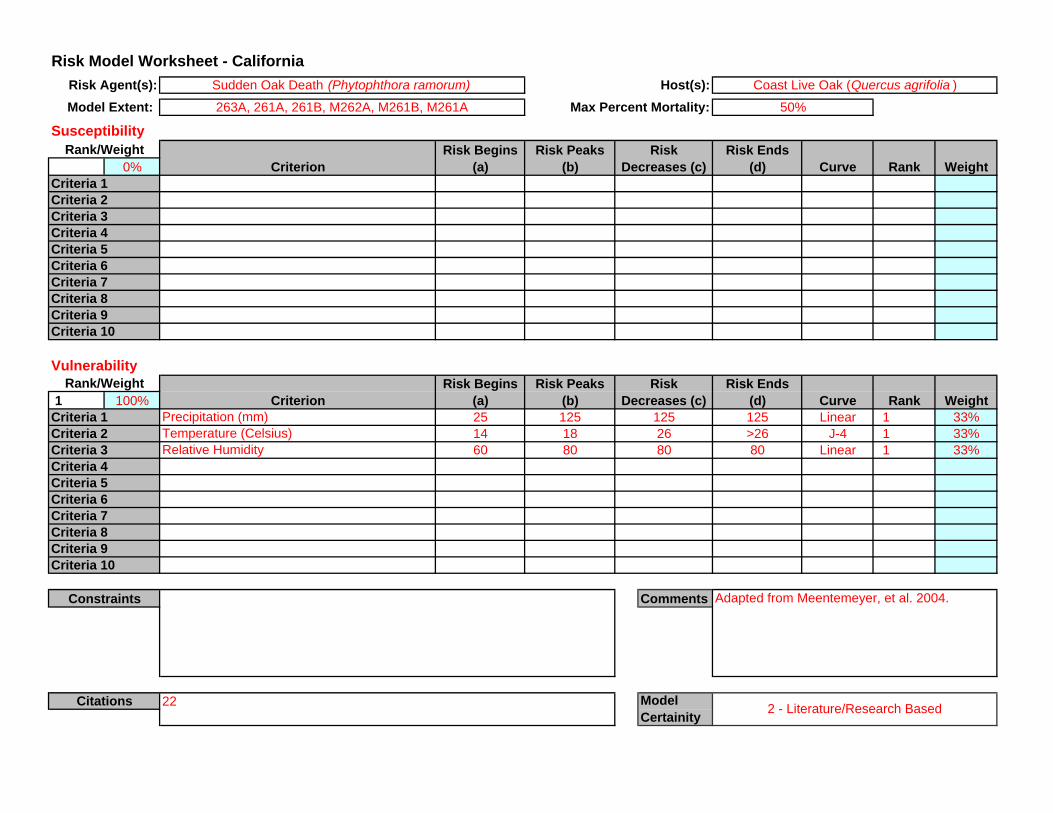
Risk Model Worksheet - CaliforniaHost(s):
Model Extent: Max Percent Mortality:
Susceptibility
0%
Vulnerability
1 100%Precipitation (mm) 25 125 125 Linear 1 33%Temperature (Celsius) 14 18 >26 J-4 1 33%Relative Humidity 60 80 80 Linear 1 33%
Comments
22
125Criterion
Risk Begins (a)
Risk Peaks (b)
Risk Decreases (c)
Risk Agent(s): Sudden Oak Death (Phytophthora ramorum)
263A, 261A, 261B, M262A, M261B, M261A
Criteria 1Criteria 2
80
Risk Begins (a)
Risk Peaks (b)Criterion
Risk Decreases (c) Curve Rank Weight
50%
Risk Ends (d)
Coast Live Oak (Quercus agrifolia )
Weight
Model Certainity 2 - Literature/Research Based
Risk Ends (d) Curve Rank
Adapted from Meentemeyer, et al. 2004.
26
Criteria 3Criteria 4Criteria 5Criteria 6Criteria 7Criteria 8
Criteria 5Criteria 6
Criteria 9Criteria 10
Criteria 1Criteria 2
Constraints
Citations
Rank/Weight
Rank/Weight
Criteria 7Criteria 8Criteria 9Criteria 10
Criteria 3Criteria 4
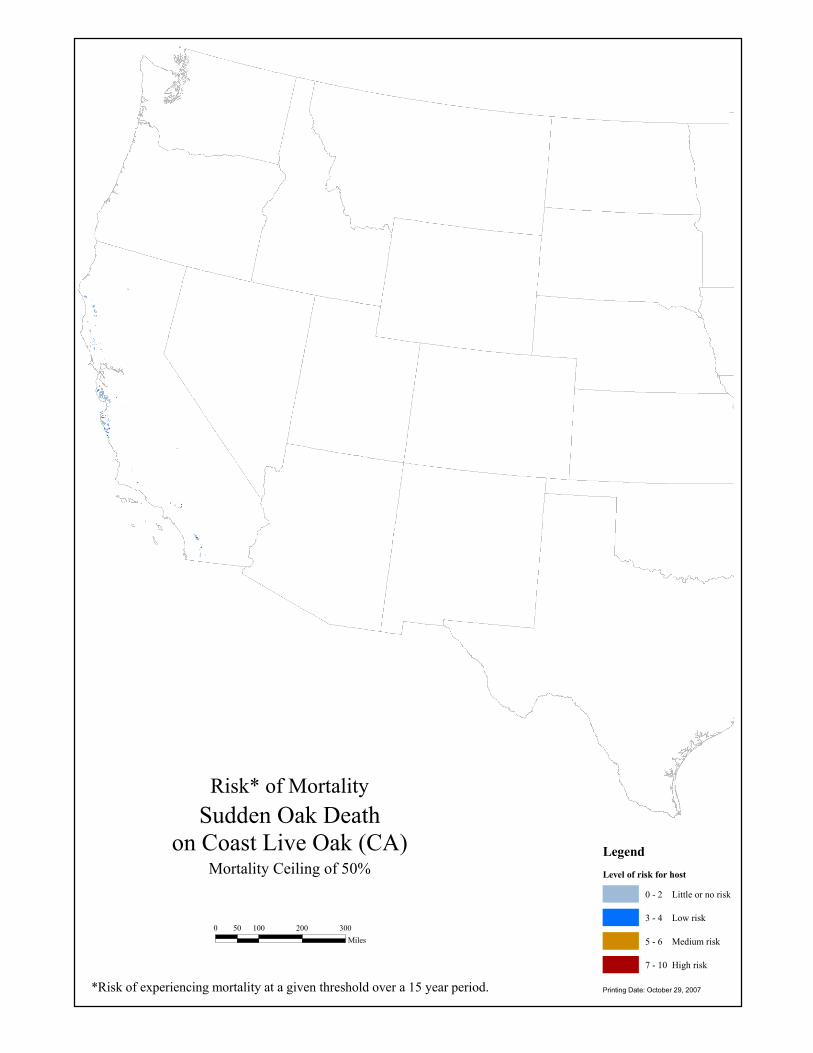
Risk* of Mortality
LegendLevel of risk for host
0 - 2 Little or no risk
3 - 4 Low risk
5 - 6 Medium risk
7 - 10 High risk
Sudden Oak Deathon Coast Live Oak (CA)
Mortality Ceiling of 50%
*Risk of experiencing mortality at a given threshold over a 15 year period. Printing Date: October 29, 2007
0 100 200 30050Miles
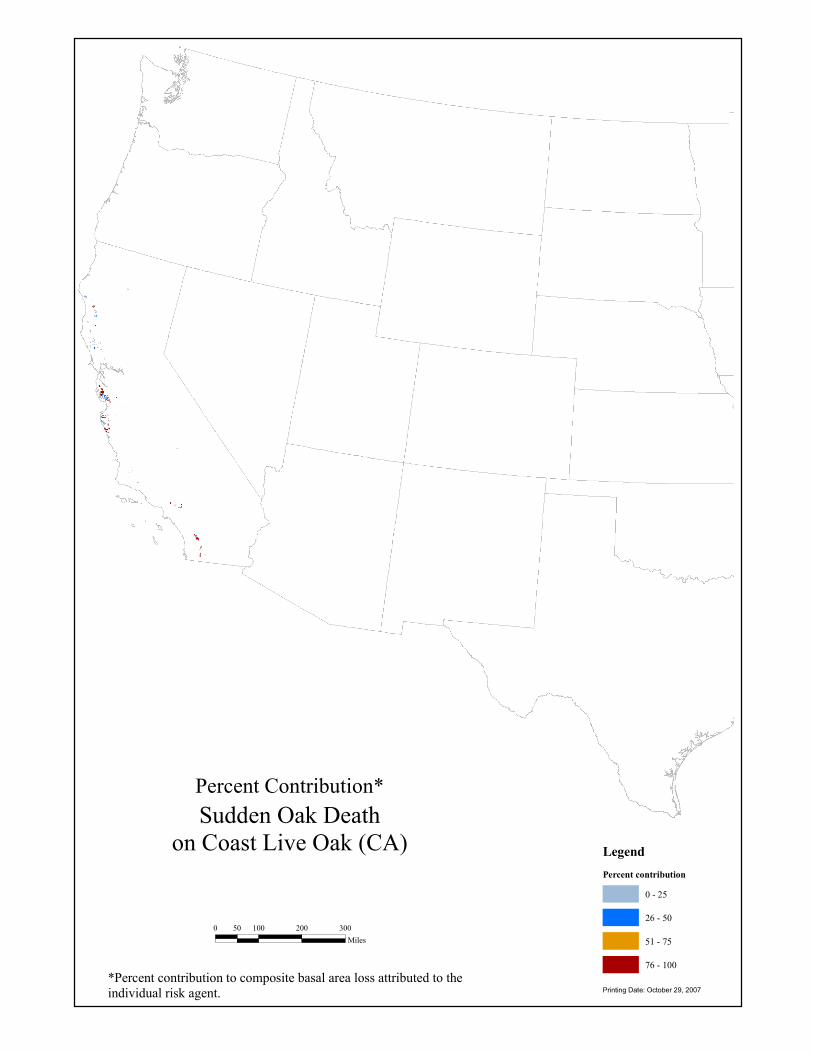
Percent Contribution*
LegendPercent contribution
0 - 25
26 - 50
51 - 75
76 - 100
Sudden Oak Deathon Coast Live Oak (CA)
*Percent contribution to composite basal area loss attributed to the individual risk agent. Printing Date: October 29, 2007
0 100 200 30050Miles
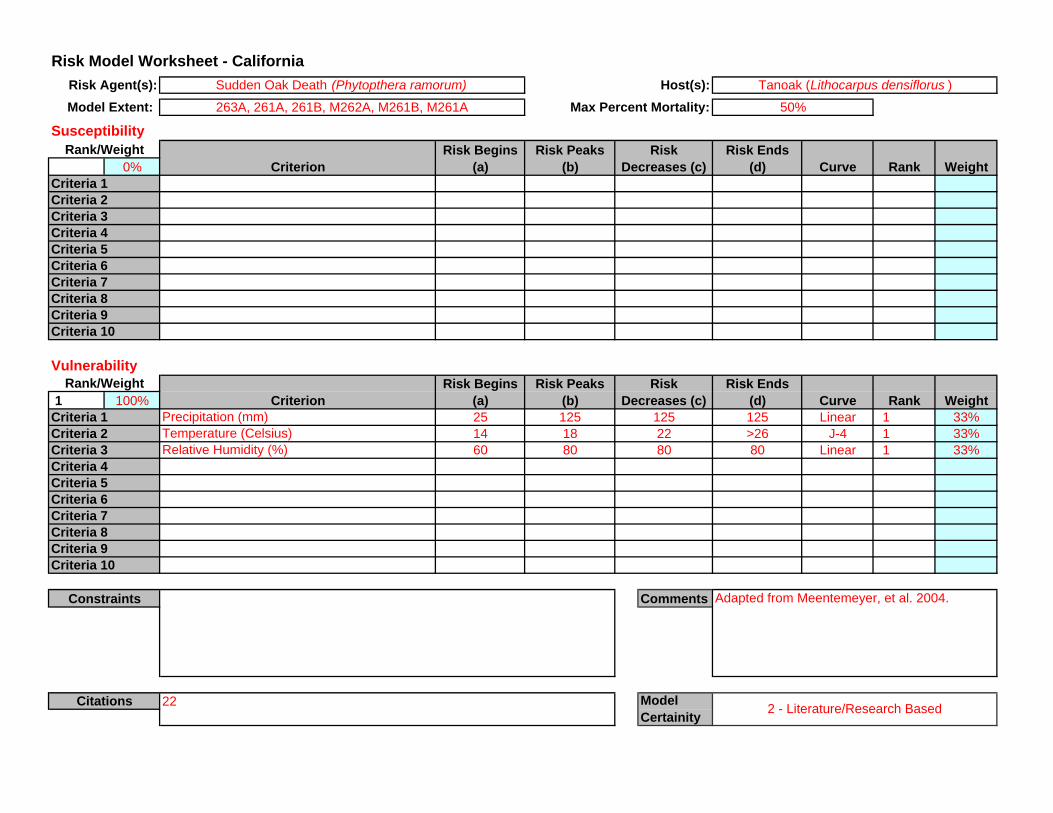
Risk Model Worksheet - CaliforniaHost(s):
Model Extent: Max Percent Mortality:
Susceptibility
0%
Vulnerability
1 100%Precipitation (mm) 25 125 125 Linear 1 33%Temperature (Celsius) 14 18 >26 J-4 1 33%Relative Humidity (%) 60 80 80 Linear 1 33%
CommentsConstraints
Citations
Rank/Weight
Rank/Weight
Criteria 7Criteria 8Criteria 9Criteria 10
Criteria 3Criteria 4
Criteria 7Criteria 8
Criteria 5Criteria 6
Criteria 9Criteria 10
Criteria 1Criteria 2
Criteria 3Criteria 4Criteria 5Criteria 6
Weight
Model Certainity 2 - Literature/Research Based
Risk Ends (d) Curve Rank
Adapted from Meentemeyer, et al. 2004.
22
Curve Rank Weight
50%
Risk Ends (d)
Tanoak (Lithocarpus densiflorus )
Risk Begins (a)
Risk Peaks (b)Criterion
Risk Decreases (c)
80
Risk Agent(s): Sudden Oak Death (Phytopthera ramorum)
263A, 261A, 261B, M262A, M261B, M261A
Criteria 1Criteria 2
22
125Criterion
Risk Begins (a)
Risk Peaks (b)
Risk Decreases (c)
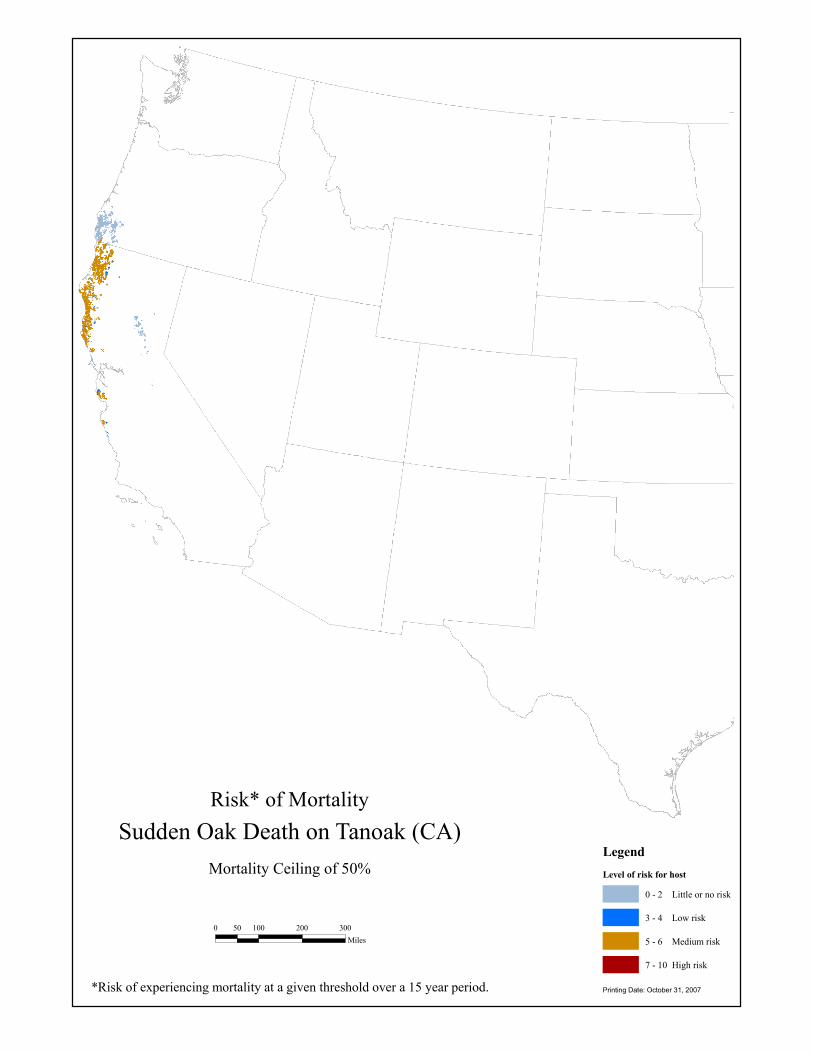
Risk* of Mortality
LegendLevel of risk for host
0 - 2 Little or no risk
3 - 4 Low risk
5 - 6 Medium risk
7 - 10 High risk
Sudden Oak Death on Tanoak (CA)Mortality Ceiling of 50%
*Risk of experiencing mortality at a given threshold over a 15 year period. Printing Date: October 31, 2007
0 100 200 30050Miles

Percent Contribution*
LegendPercent contribution
0 - 25
26 - 50
51 - 75
76 - 100
Sudden Oak Death on Tanoak (CA)
*Percent contribution to composite basal area loss attributed to the individual risk agent. Printing Date: October 31, 2007
0 100 200 30050Miles
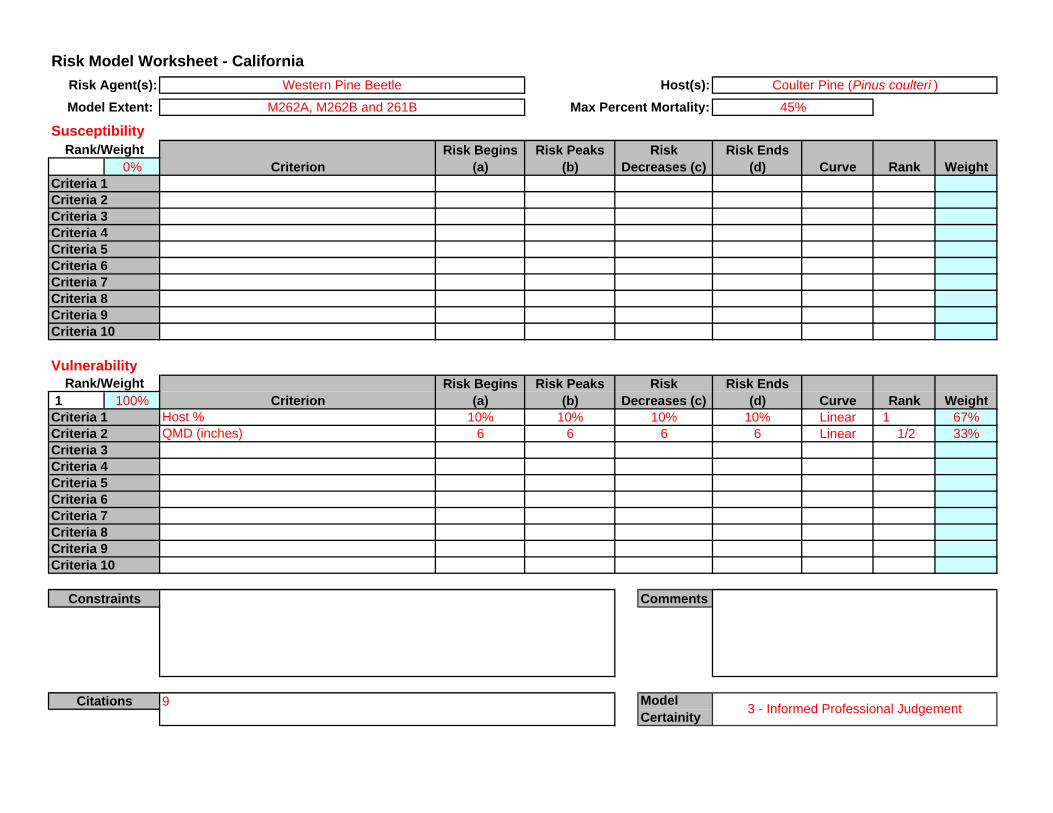
Risk Model Worksheet - CaliforniaHost(s):
Model Extent: Max Percent Mortality:
Susceptibility
0%
Vulnerability
1 100%Host % 10% 10% 10% Linear 1 67%QMD (inches) 6 6 6 Linear 1/2 33%
CommentsConstraints
Citations
Rank/Weight
Rank/Weight
Criteria 7Criteria 8Criteria 9Criteria 10
Criteria 3Criteria 4
Criteria 7Criteria 8
Criteria 5Criteria 6
Criteria 9Criteria 10
Criteria 1Criteria 2
Criteria 3Criteria 4Criteria 5Criteria 6
Weight
Model Certainity 3 - Informed Professional Judgement
Risk Ends (d) Curve Rank
6
Curve Rank Weight
45%
Risk Ends (d)
Coulter Pine (Pinus coulteri )
Risk Begins (a)
Risk Peaks (b)Criterion
Risk Decreases (c)
Risk Agent(s): Western Pine Beetle
M262A, M262B and 261B
Criteria 1Criteria 2
9
10%Criterion
Risk Begins (a)
Risk Peaks (b)
Risk Decreases (c)

Risk* of Mortality
LegendLevel of risk for host
0 - 2 Little or no risk
3 - 4 Low risk
5 - 6 Medium risk
7 - 10 High risk
Western Pine Beetleon Coulter Pine (CA)
Mortality Ceiling of 45%
*Risk of experiencing mortality at a given threshold over a 15 year period. Printing Date: October 29, 2007
0 100 200 30050Miles
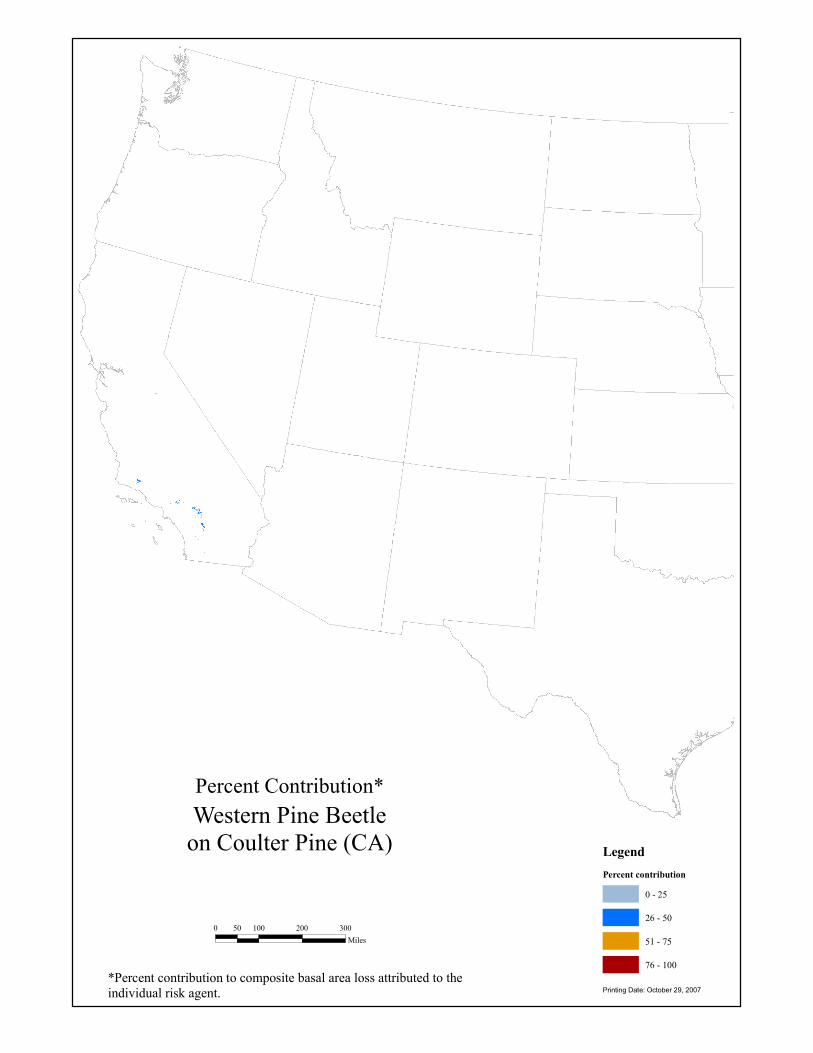
Percent Contribution*
LegendPercent contribution
0 - 25
26 - 50
51 - 75
76 - 100
Western Pine Beetleon Coulter Pine (CA)
*Percent contribution to composite basal area loss attributed to the individual risk agent. Printing Date: October 29, 2007
0 100 200 30050Miles

Risk Model Worksheet - CaliforniaHost(s):
Model Extent: Max Percent Mortality:
Susceptibility
0%
Vulnerability
1 100%SDI 230 250 250 Linear 1 100%
CommentsConstraints
Citations
Rank/Weight
Rank/Weight
Criteria 7Criteria 8Criteria 9Criteria 10
Criteria 3Criteria 4
Criteria 7Criteria 8
Criteria 5Criteria 6
Criteria 9Criteria 10
Criteria 1Criteria 2
Criteria 3Criteria 4Criteria 5Criteria 6
Weight
Model Certainity 3 - Informed Professional Judgement
Risk Ends (d) Curve Rank
Curve Rank Weight
25%
Risk Ends (d)
Ponderosa Pine (Pinus ponderosa )
Risk Begins (a)
Risk Peaks (b)Criterion
Risk Decreases (c)
Risk Agent(s): Western Pine Beetle
M261A, M261B, and M261C
Criteria 1Criteria 2
26, 29, 41
250Criterion
Risk Begins (a)
Risk Peaks (b)
Risk Decreases (c)

Risk* of Mortality
LegendLevel of risk for host
0 - 2 Little or no risk
3 - 4 Low risk
5 - 6 Medium risk
7 - 10 High risk
Western Pine Beetleon Ponderosa Pine (CA)
Mortality Ceiling of 25%
*Risk of experiencing mortality at a given threshold over a 15 year period. Printing Date: October 30, 2007
0 100 200 30050Miles
M261A, B, C

Percent Contribution*
LegendPercent contribution
0 - 25
26 - 50
51 - 75
76 - 100
Western Pine Beetleon Ponderosa Pine (CA)
*Percent contribution to composite basal area loss attributed to the individual risk agent. Printing Date: October 30, 2007
0 100 200 30050Miles
M261A, B, C

Risk Model Worksheet - CaliforniaHost(s):
Model Extent: Max Percent Mortality:
Susceptibility
0%
Vulnerability
1 100%SDI 230 250 250 Linear 1/2 33%QMD (inches) 8 8 8 Linear 1 67%
CommentsConstraints
Citations
Rank/Weight
Rank/Weight
Criteria 7Criteria 8Criteria 9Criteria 10
Criteria 3Criteria 4
Criteria 7Criteria 8
Criteria 5Criteria 6
Criteria 9Criteria 10
Criteria 1Criteria 2
Criteria 3Criteria 4Criteria 5Criteria 6
Weight
Model Certainity 2 - Literature/Research Based
Risk Ends (d) Curve Rank
8
Curve Rank Weight
20%
Risk Ends (d)
Ponderosa Pine (Pinus ponderosa )
Risk Begins (a)
Risk Peaks (b)Criterion
Risk Decreases (c)
Risk Agent(s): Western Pine Beetle
M261D, M261E, and M261G
Criteria 1Criteria 2
26, 29, 41
250Criterion
Risk Begins (a)
Risk Peaks (b)
Risk Decreases (c)

Risk* of Mortality
LegendLevel of risk for host
0 - 2 Little or no risk
3 - 4 Low risk
5 - 6 Medium risk
7 - 10 High risk
Western Pine Beetleon Ponderosa Pine (CA)
Mortality Ceiling of 20%
*Risk of experiencing mortality at a given threshold over a 15 year period. Printing Date: October 30, 2007
0 100 200 30050Miles
M261D, E, G

Percent Contribution*
LegendPercent contribution
0 - 25
26 - 50
51 - 75
76 - 100
Western Pine Beetleon Ponderosa Pine (CA)
*Percent contribution to composite basal area loss attributed to the individual risk agent. Printing Date: October 30, 2007
0 100 200 30050Miles
M261D, E, G

Risk Model Worksheet - CaliforniaHost(s):
Model Extent: Max Percent Mortality:
Susceptibility
0%
Vulnerability
1 100%SDI 230 250 250 Linear 1/2 33%QMD (inches) 6 6 6 Linear 1 67%
CommentsConstraints
Citations
Rank/Weight
Rank/Weight
Criteria 7Criteria 8Criteria 9Criteria 10
Criteria 3Criteria 4
Criteria 7Criteria 8
Criteria 5Criteria 6
Criteria 9Criteria 10
Criteria 1Criteria 2
Criteria 3Criteria 4Criteria 5Criteria 6
Weight
Model Certainity 3 - Informed Professional Judgement
Risk Ends (d) Curve Rank
6
Curve Rank Weight
20%
Risk Ends (d)
Ponderosa Pine (Pinus ponderosa )
Risk Begins (a)
Risk Peaks (b)Criterion
Risk Decreases (c)
Risk Agent(s): Western Pine Beetle
M262A and M262B
Criteria 1Criteria 2
26, 29, 41
250Criterion
Risk Begins (a)
Risk Peaks (b)
Risk Decreases (c)

Risk* of Mortality
LegendLevel of risk for host
0 - 2 Little or no risk
3 - 4 Low risk
5 - 6 Medium risk
7 - 10 High risk
Western Pine Beetleon Ponderosa Pine (CA)
Mortality Ceiling of 20%
*Risk of experiencing mortality at a given threshold over a 15 year period. Printing Date: October 30, 2007
0 100 200 30050Miles
M262A, B

Percent Contribution*
LegendPercent contribution
0 - 25
26 - 50
51 - 75
76 - 100
Western Pine Beetleon Ponderosa Pine (CA)
*Percent contribution to composite basal area loss attributed to the individual risk agent. Printing Date: October 30, 2007
0 100 200 30050Miles
M262A, B