importance of second-order difference-frequency … · deepcwind wind/wave basin model test ......
TRANSCRIPT
NREL is a national laboratory of the U.S. Department of Energy Office of Energy Efficiency & Renewable Energy Operated by the Alliance for Sustainable Energy, LLC. This report is available at no cost from the National Renewable Energy Laboratory (NREL) at www.nrel.gov/publications.
Contract No. DE-AC36-08GO28308
Importance of Second-Order Difference-Frequency Wave-Diffraction Forces in the Validation of a Fast Semi-Submersible Floating Wind Turbine Model Preprint Alexander J. Coulling and Andrew J. Goupee University of Maine
Amy N. Robertson and Jason M. Jonkman National Renewable Energy Laboratory
Presented at the ASME 2013 32nd International Conference on Ocean, Offshore and Arctic Engineering Nantes, France June 9-14, 2013
Conference Paper NREL/CP-5000-57697 June 2013

NOTICE
The submitted manuscript has been offered by an employee of the Alliance for Sustainable Energy, LLC (Alliance), a contractor of the US Government under Contract No. DE-AC36-08GO28308. Accordingly, the US Government and Alliance retain a nonexclusive royalty-free license to publish or reproduce the published form of this contribution, or allow others to do so, for US Government purposes.
This report was prepared as an account of work sponsored by an agency of the United States government. Neither the United States government nor any agency thereof, nor any of their employees, makes any warranty, express or implied, or assumes any legal liability or responsibility for the accuracy, completeness, or usefulness of any information, apparatus, product, or process disclosed, or represents that its use would not infringe privately owned rights. Reference herein to any specific commercial product, process, or service by trade name, trademark, manufacturer, or otherwise does not necessarily constitute or imply its endorsement, recommendation, or favoring by the United States government or any agency thereof. The views and opinions of authors expressed herein do not necessarily state or reflect those of the United States government or any agency thereof.
This report is available at no cost from the National Renewable Energy Laboratory (NREL) at www.nrel.gov/publications.
Available electronically at http://www.osti.gov/bridge
Available for a processing fee to U.S. Department of Energy and its contractors, in paper, from:
U.S. Department of Energy Office of Scientific and Technical Information P.O. Box 62 Oak Ridge, TN 37831-0062 phone: 865.576.8401 fax: 865.576.5728 email: mailto:[email protected]
Available for sale to the public, in paper, from:
U.S. Department of Commerce National Technical Information Service 5285 Port Royal Road Springfield, VA 22161 phone: 800.553.6847 fax: 703.605.6900 email: [email protected] online ordering: http://www.ntis.gov/help/ordermethods.aspx
Cover Photos: (left to right) photo by Pat Corkery, NREL 16416, photo from SunEdison, NREL 17423, photo by Pat Corkery, NREL 16560, photo by Dennis Schroeder, NREL 17613, photo by Dean Armstrong, NREL 17436, photo by Pat Corkery, NREL 17721.
Printed on paper containing at least 50% wastepaper, including 10% post consumer waste.

1 This report is available at no cost from the National Renewable Energy Laboratory (NREL) at www.nrel.gov/publications.
IMPORTANCE OF SECOND-ORDER DIFFERENCE-FREQUENCY WAVE-DIFFRACTION FORCES IN THE VALIDATION OF A FAST SEMI-SUBMERSIBLE
FLOATING WIND TURBINE MODEL
Alexander J. Coulling University of Maine
Orono, Maine, U.S.A.
Andrew J. Goupee University of Maine
Orono, Maine, U.S.A.
Amy N. Robertson National Renewable Energy Laboratory
Golden, Colorado, U.S.A.
Jason M. Jonkman National Renewable Energy Laboratory
Golden, Colorado, U.S.A.
ABSTRACT
To better access the abundant offshore wind resource, efforts are being made across the world to develop and improve floating offshore wind turbine technologies. A critical aspect of creating reliable, mature floating wind turbine technology is the development, verification, and validation of efficient computer-aided-engineering (CAE) tools. The National Renewable Energy Laboratory (NREL) has created FAST, a comprehensive, coupled analysis CAE tool for floating wind turbines, which has been verified and utilized in numerous floating wind turbine studies. Several efforts are underway to validate the floating platform functionality of FAST to complement its already validated aerodynamic and structural simulation capabilities. The research employs the 1/50th-scale DeepCwind wind/wave basin model test dataset, which was obtained at the Maritime Research Institute Netherlands (MARIN) in 2011. This paper describes further work being undertaken to continue this validation. These efforts focus on FAST’s ability to replicate global response behaviors associated with dynamic wind forces and second-order difference-frequency wave-diffraction forces separately and simultaneously.
The first step is the construction of a FAST numerical model of the DeepCwind semi-submersible floating wind turbine that includes alterations for the addition of second-order difference-frequency wave-diffraction forces. The implementation of these second-order wave forces, which are not currently standard in FAST, are outlined and discussed. After construction of the FAST model, the calibration of the FAST model’s wind turbine aerodynamics, tower-bending
dynamics, and platform hydrodynamic damping using select test data is discussed. Subsequently, select cases with coupled dynamic wind and irregular wave loading are simulated in FAST, and these results are compared to test data. Particular attention is paid to global motion and load responses associated with the interaction of the wind and wave environmental loads. These loads are most prevalent in the vicinity of the rigid-body motion natural frequencies for the DeepCwind semi-submersible, with dynamic wind forces and the second-order difference-frequency wave-diffraction forces driving the global system response at these low frequencies. Studies are also performed to investigate the impact of neglecting the second-order wave forces on the predictive capabilities of the FAST model. The comparisons of the simulation and test results highlight the ability of FAST to accurately capture many of the important coupled global response behaviors of the DeepCwind semi-submersible floating wind turbine.
INTRODUCTION
The next frontier in offshore wind energy is that of floating offshore wind technology, as evidenced by the multiple research efforts being put forth by entities across the world (e.g., see [1-6]). Floating technologies vastly expand the opportunity for capturing offshore wind energy compared to current fixed-bottom technologies that require shallow-water sites; suitable shallow-water sites are not as prevalent as suitable deep-water sites. In addition to harnessing the higher energy winds in deeper water, floating wind turbine technology provides opportunities for reducing the cost of offshore wind energy by eliminating many of the expensive installation

2 This report is available at no cost from the National Renewable Energy Laboratory (NREL) at www.nrel.gov/publications.
procedures employed in current fixed-bottom systems. To bring floating offshore wind turbine technology to maturity, however, efficient, accurate computer-aided-engineering (CAE) tools must be created, verified, and validated.
In this paper, the focus is on FAST [7, 8], the popular open-source floating wind turbine CAE tool that was created by the National Renewable Energy Laboratory (NREL). FAST has been previously verified [1, 2], and current efforts focus on validating its coupled aero-hydro-servo-elastic predictive capabilities for floating wind turbines. Recently, progress has been made in validating FAST for floating wind turbine systems that are supported by a tension-leg platform [9], a spar-buoy [10], and a semi-submersible platform [11] that uses the DeepCwind 1/50th-scale wind/wave basin model test data [5, 6, 12-14]. In the investigations of the DeepCwind semi-submersible floating wind turbine system, strong correlations were observed between the FAST predictions and test data in many scenarios. However, one major exception was an absence of low-frequency responses associated with second-order difference-frequency wave-diffraction loads in the FAST output [11]. The low-frequency response of the DeepCwind semi-submersible is driven by dynamic wind loading, second-order difference-frequency wave loads, and their interaction with one another [5, 14]. Exclusion of the second-order wave forcing in the current version of FAST prevents a proper prediction of the system response in this frequency range. To better assess the importance of FAST’s omission of these physics, this work revisits the semi-submersible validation while including second-order wave-diffraction forces using the simple-to-implement Newman’s approximation [15, 16].
This paper is organized as follows: In the first section, a brief overview of the semi-submersible floating wind turbine model is given along with the methods employed to construct a calibrated FAST model of the system. The next section discusses the implementation of the second-order difference-frequency wave-diffraction forces into the FAST tool. Subsequently, the environmental conditions employed in this work are detailed. Afterward, the improvement in the FAST simulation predictions when including second-order wave diffraction effects is assessed. Then, the ability of the improved FAST model to predict the interaction of the second-order wave forcing and dynamic wind loads for the floating wind turbine global response is evaluated. The paper concludes with a discussion of the results presented.
MODEL DESCRIPTION
In this section, a brief description of the DeepCwind semi-submersible floating wind turbine is presented. In addition, a short discussion on tuning the FAST model with key pieces of test data is also given. This tuning is required to account for unknown test parameters and some imperfections in the numerical model. Fig. 1 depicts the degrees of freedom (DOF) and the general wind and wave orientations used in this study.
Fig. 1 Depiction of degrees of freedom, wind orientations and wave orientations.
Photo by: Andrew Goupee, University of Maine
Fig. 2 Image of 1/50th-scale model of the DeepCwind semi-submersible floating wind turbine.
Froude scaling (e.g. see [17]) was employed to create a 1/50th-scale model of the DeepCwind semi-submersible, shown in Fig. 2, in addition to an assortment of scaled environmental conditions, for testing in the Maritime Research Institute Netherlands (MARIN) offshore basin. The properties of the DeepCwind semi-submersible, and the corresponding test results discussed in this paper, are all presented at full scale. More information on the specific scaling methods employed for the DeepCwind tests can be found in [12, 18].
As illustrated in Fig. 2, the DeepCwind semi-submersible floating platform consists of three outer columns connected through a series of slender pontoons and braces to a central column. The platform, which was designed to be rigid, supports a modified version of the NREL 5-MW reference wind turbine [19]. The wind turbine modifications include zero blade precone, zero shaft-tilt, a slightly larger mass, and finally, rigid blades to eliminate the aero-elastic complexities of flexible blades during testing. The wind turbine is connected to the platform via a flexible tower. The entire system is moored via three slack, catenary lines attached to the outer columns. An overview of key system properties is given in Tables 1-3.
3 This report is available at no cost from the National Renewable Energy Laboratory (NREL) at www.nrel.gov/publications.
Wind turbine and tower properties are given in Table 1, floating platform properties in Table 2, and mooring properties in Table 3.
Table 1 Wind turbine and tower gross properties.
Rotor Orientation, Configuration Upwind, 3 Blades Rotor, Hub Diameter 126.0 m, 3.0 m Hub Height Above Still-water Line (SWL)
90.0 m
Height of Tower-Top Flange Above SWL 87.6 m Overhang, Shaft Tilt, Precone 10.58 m, 0°, 0° Vertical Distance Along Tower Centerline Between Tower Top and Shaft
2.4 m
Total Tower-Top Mass 397,160 kg Tower Height 77.6 m Tower-Base Elevation Above SWL 10.0 m Total Tower Mass 302,240 kg
Table 2 Floating platform gross properties.
Total Draft 20.0 m Elevation to Platform Top (Tower Base) Above SWL
10.0 m
Platform Mass, Including Ballast 13,444,000 kg Displacement 13,986.8 m3 Center of Mass (CM) Location Below SWL Along Platform Centerline
14.4 m
Platform Roll Inertia About CM 8.011×10⁹ kgm2 Platform Pitch Inertia About CM 8.011×10⁹ kgm2 Platform Yaw Inertia About Platform Centerline
1.391×10¹⁰ kgm2
Table 3 Mooring system properties.
Number of Mooring Lines 3 Angle Between Adjacent Lines 120° Depth to Anchors Below SWL (Water Depth) 200.0 m Depth to Fairleads Below SWL 14.0 m Radius to Anchors from Platform Centerline 837.6 m Radius to Fairleads from Platform Centerline 40.868 m Unstretched Mooring Line Length 835.5 m Equivalent Mooring Line Mass in Water 108.63 kg/m Equivalent Mooring Line Cross Section Extensional Stiffness 753.6×10⁶ N
Additional information on system properties, such as platform geometry, hydrodynamic parameters, and mooring restoring forces, can be found in [11, 13]. Information on the model wind turbine performance is detailed in [11, 12].
As a final step in the completion of the FAST floating wind turbine model, certain aspects of the model must be tuned. These include wind turbine aerodynamics, tower-bending dynamics, and platform hydrodynamic damping. Tuning of the wind turbine aerodynamics is required to emulate the correct wind turbine torque, and more importantly, the thrust because this is the major aerodynamic global response driver, under
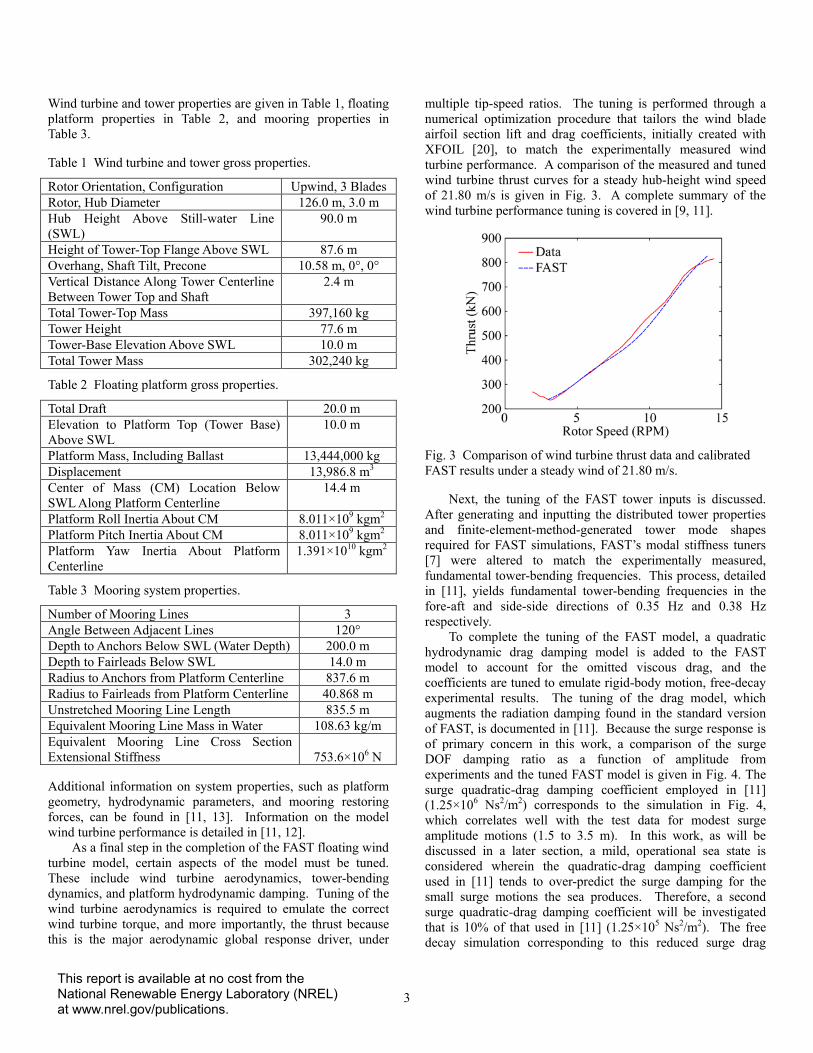
multiple tip-speed ratios. The tuning is performed through a numerical optimization procedure that tailors the wind blade airfoil section lift and drag coefficients, initially created with XFOIL [20], to match the experimentally measured wind turbine performance. A comparison of the measured and tuned wind turbine thrust curves for a steady hub-height wind speed of 21.80 m/s is given in Fig. 3. A complete summary of the wind turbine performance tuning is covered in [9, 11].
Fig. 3 Comparison of wind turbine thrust data and calibrated FAST results under a steady wind of 21.80 m/s.
Next, the tuning of the FAST tower inputs is discussed. After generating and inputting the distributed tower properties and finite-element-method-generated tower mode shapes required for FAST simulations, FAST’s modal stiffness tuners [7] were altered to match the experimentally measured, fundamental tower-bending frequencies. This process, detailed in [11], yields fundamental tower-bending frequencies in the fore-aft and side-side directions of 0.35 Hz and 0.38 Hz respectively.
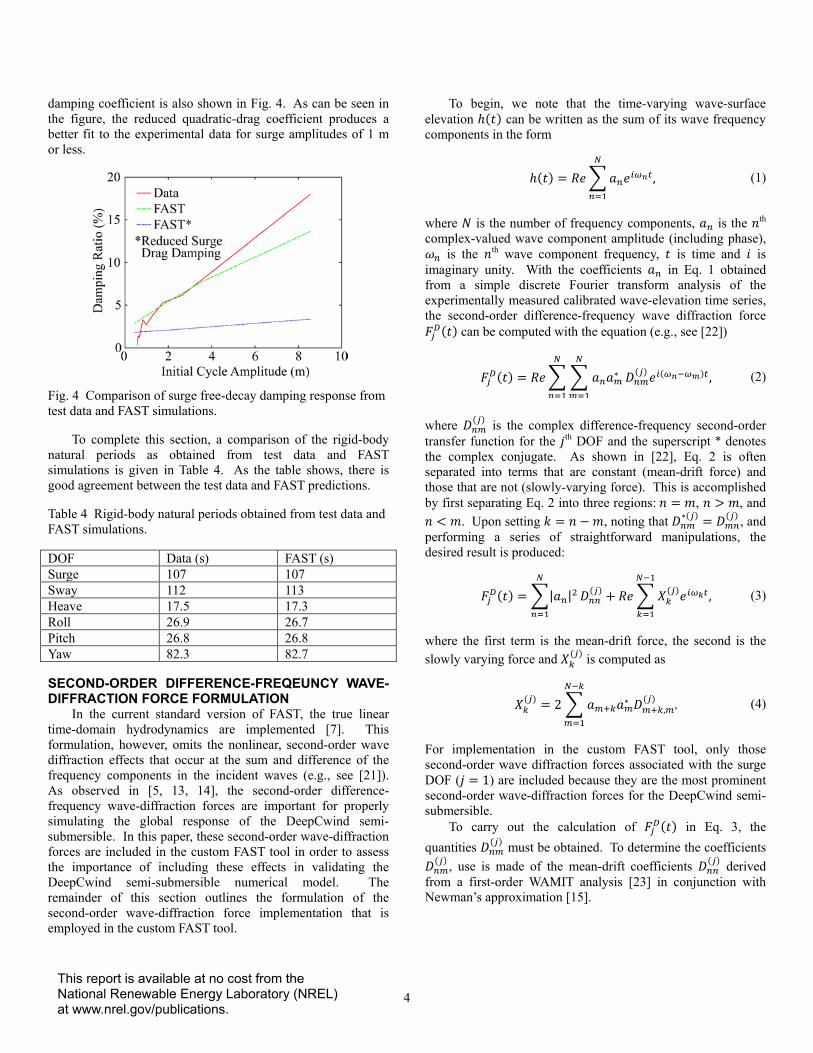
To complete the tuning of the FAST model, a quadratic hydrodynamic drag damping model is added to the FAST model to account for the omitted viscous drag, and the coefficients are tuned to emulate rigid-body motion, free-decay experimental results. The tuning of the drag model, which augments the radiation damping found in the standard version of FAST, is documented in [11]. Because the surge response is of primary concern in this work, a comparison of the surge DOF damping ratio as a function of amplitude from experiments and the tuned FAST model is given in Fig. 4. The surge quadratic-drag damping coefficient employed in [11] (1.25×10⁶ Ns2/m2) corresponds to the simulation in Fig. 4, which correlates well with the test data for modest surge amplitude motions (1.5 to 3.5 m). In this work, as will be discussed in a later section, a mild, operational sea state is considered wherein the quadratic-drag damping coefficient used in [11] tends to over-predict the surge damping for the small surge motions the sea produces. Therefore, a second surge quadratic-drag damping coefficient will be investigated that is 10% of that used in [11] (1.25×10⁵ Ns2/m2). The free decay simulation corresponding to this reduced surge drag
4 This report is available at no cost from the National Renewable Energy Laboratory (NREL) at www.nrel.gov/publications.
damping coefficient is also shown in Fig. 4. As can be seen in the figure, the reduced quadratic-drag coefficient produces a better fit to the experimental data for surge amplitudes of 1 m or less.
Fig. 4 Comparison of surge free-decay damping response from test data and FAST simulations.
To complete this section, a comparison of the rigid-body natural periods as obtained from test data and FAST simulations is given in Table 4. As the table shows, there is good agreement between the test data and FAST predictions.
Table 4 Rigid-body natural periods obtained from test data and FAST simulations.
DOF Data (s) FAST (s) Surge 107 107 Sway 112 113 Heave 17.5 17.3 Roll 26.9 26.7 Pitch 26.8 26.8 Yaw 82.3 82.7
SECOND-ORDER DIFFERENCE-FREQEUNCY WAVE-DIFFRACTION FORCE FORMULATION
In the current standard version of FAST, the true linear time-domain hydrodynamics are implemented [7]. This formulation, however, omits the nonlinear, second-order wave diffraction effects that occur at the sum and difference of the frequency components in the incident waves (e.g., see [21]). As observed in [5, 13, 14], the second-order difference-frequency wave-diffraction forces are important for properly simulating the global response of the DeepCwind semi-submersible. In this paper, these second-order wave-diffraction forces are included in the custom FAST tool in order to assess the importance of including these effects in validating the DeepCwind semi-submersible numerical model. The remainder of this section outlines the formulation of the second-order wave-diffraction force implementation that is employed in the custom FAST tool.
To begin, we note that the time-varying wave-surface elevation ℎ(𝑡) can be written as the sum of its wave frequency components in the form
ℎ(𝑡) = 𝑅𝑅�𝑎𝑛𝑅𝑖𝜔𝑛𝑡𝑁
𝑛=1
, (1)
where 𝑁 is the number of frequency components, 𝑎𝑛 is the 𝑛th complex-valued wave component amplitude (including phase), 𝜔𝑛 is the 𝑛th wave component frequency, 𝑡 is time and 𝑖 is imaginary unity. With the coefficients 𝑎𝑛 in Eq. 1 obtained from a simple discrete Fourier transform analysis of the experimentally measured calibrated wave-elevation time series, the second-order difference-frequency wave diffraction force 𝐹𝑗𝐷(𝑡) can be computed with the equation (e.g., see [22])
𝐹𝑗𝐷(𝑡) = 𝑅𝑅� � 𝑎𝑛𝑎𝑚∗𝑁
𝑚=1
𝐷𝑛𝑚(𝑗)𝑅𝑖(𝜔𝑛−𝜔𝑚)𝑡
𝑁
𝑛=1
, (2)
where 𝐷𝑛𝑚
(𝑗) is the complex difference-frequency second-order transfer function for the 𝑗th DOF and the superscript * denotes the complex conjugate. As shown in [22], Eq. 2 is often separated into terms that are constant (mean-drift force) and those that are not (slowly-varying force). This is accomplished by first separating Eq. 2 into three regions: 𝑛 = 𝑚, 𝑛 > 𝑚, and 𝑛 < 𝑚. Upon setting 𝑘 = 𝑛 −𝑚, noting that 𝐷𝑛𝑚
∗(𝑗) = 𝐷𝑚𝑛(𝑗) , and
performing a series of straightforward manipulations, the desired result is produced:
𝐹𝑗𝐷(𝑡) = �|𝑎𝑛|2𝑁
𝑛=1
𝐷𝑛𝑛(𝑗) + 𝑅𝑅�𝑋𝑘
(𝑗)𝑅𝑖𝜔𝑘𝑡𝑁−1
𝑘=1
, (3)
where the first term is the mean-drift force, the second is the slowly varying force and 𝑋𝑘
(𝑗) is computed as
𝑋𝑘(𝑗) = 2 � 𝑎𝑚+𝑘𝑎𝑚∗ 𝐷𝑚+𝑘,𝑚
(𝑗)𝑁−𝑘
𝑚=1
. (4)
For implementation in the custom FAST tool, only those second-order wave diffraction forces associated with the surge DOF (𝑗 = 1) are included because they are the most prominent second-order wave-diffraction forces for the DeepCwind semi-submersible. To carry out the calculation of 𝐹𝑗𝐷(𝑡) in Eq. 3, the quantities 𝐷𝑛𝑚
(𝑗) must be obtained. To determine the coefficients 𝐷𝑛𝑚
(𝑗) , use is made of the mean-drift coefficients 𝐷𝑛𝑛(𝑗) derived
from a first-order WAMIT analysis [23] in conjunction with Newman’s approximation [15].

5 This report is available at no cost from the National Renewable Energy Laboratory (NREL) at www.nrel.gov/publications.
The particular formulation used is that developed in [16], which approximates 𝐷𝑛𝑚
(𝑗) from 𝐷𝑛𝑛(𝑗) using the relation
𝐷𝑛𝑚(𝑗) =
(5) �𝑠𝑠𝑛 �𝐷𝑛𝑛
(𝑗)���𝐷𝑛𝑛(𝑗)𝐷𝑚𝑚
(𝑗) � 𝑖𝑖 𝑠𝑠𝑛 �𝐷𝑛𝑛(𝑗)� = 𝑠𝑠𝑛 �𝐷𝑚𝑚
(𝑗) �
0 𝑖𝑖 𝑠𝑠𝑛 �𝐷𝑛𝑛(𝑗)� ≠ 𝑠𝑠𝑛 �𝐷𝑚𝑚
(𝑗) �,
where 𝑠𝑠𝑛(∙) indicates the sign (either positive or negative) of the argument. It is worth stating that it would be best if 𝐷𝑛𝑚
(𝑗) were computed from a second-order WAMIT analysis. However, Newman’s approximation is justified for this work for the following two reasons:
1) Performing the second-order WAMIT analysis requires significant computational expense, whereas computing the coefficients 𝐷𝑛𝑛
(𝑗) requires solution of only the first-order wave-diffraction problem.
2) Assuming that the second-order transfer function 𝐷𝑛𝑚(𝑗) is
continuous, and also assuming that only slowly-varying loads associated with resonance of the surge DOF (natural frequency of 0.0093 Hz) are important (i.e., only 𝐷𝑛𝑚
(𝑗) near the diagonal 𝐷𝑛𝑛
(𝑗) terms need be approximated accurately).
Therefore, Newman’s approximation should yield suitable results for the DeepCwind semi-submersible study conducted here.
To complete this section, the magnitude of the approximated second-order transfer function 𝐷𝑛𝑚
(1) = 𝐷(1)(𝜔1,𝜔2) is shown via a surface plot in Fig. 5.
Fig. 5 Surface plot of the 𝐷(1)(𝜔1,𝜔2) second-order difference-frequency transfer function.
ENVIRONMENTAL CONDITIONS
To investigate the impact of including second-order difference-frequency wave-diffraction forcing in FAST for analyzing the DeepCwind semi-submersible, a particular wind and wave condition is chosen. The details of these environmental conditions comprise the remainder of this section.
In this analysis, the chosen wind condition is temporally dynamic and follows a Norwegian Petroleum Directorate (NPD) [24] spectrum. In the basin, the mean wind speed at the hub height was 𝑈𝑚 = 20.6 m/s, the standard deviation was 2.04 m/s, the maximum wind speed was 28.7 m/s, and the minimum wind speed was 12.9 m/s. This wind is chosen because it produces thrust loads similar to those experienced in the rated wind speed condition of the NREL 5-MW reference wind turbine when paired with the low thrust coefficient turbine employed in the wind/wave basin tests [12].
For the purposes of simulation, FAST hub-height wind files are employed which possess a constant spatial variation in wind profile, albeit, wind speed magnitudes that are time-varying. Based on surveys of the wind-generation machine output, which were recorded in the wind/wave basin [5, 13], the FAST hub-height wind file is created by multiplying the measured hub-height velocity by 0.952 and employing a wind shear exponent of 0.0912. The tested wind field possessed some spatial variation in wind speed. Hence, these hub-height wind file choices yielded the best possible representation of the wind field utilized during testing, using only the simple hub-height wind file option in the FAST simulations. The spectrum of the NPD wind used in this study is given in Fig. 6.
Fig. 6 Spectra for the 𝑈𝑚 = 20.6 m/s NPD dynamic wind and 𝐻𝑠 = 2.0 m JONSWAP wave conditions.
Regarding the wave condition, an operational sea with a significant wave height of 𝐻𝑠 = 2.0 m and a peak-spectral period of 𝑇𝑝 = 7.5 s following a Joint North Sea Wave Project (JONSWAP) [25] spectrum is chosen for this work. This condition is selected because it produced large responses associated with the second-order difference-frequency wave-diffraction forces relative to those caused by the linear wave

6 This report is available at no cost from the National Renewable Energy Laboratory (NREL) at www.nrel.gov/publications.
forces. In addition, this sea state will produce wave loadings that are in decent proportion to the wind loads expected with the chosen wind, based on typical joint probabilities (e.g., see [8]). For the waves tested in the basin, the wave-elevation standard deviation was 0.49 m, the maximum crest 2.14 m, the minimum trough 1.87 m and the maximum wave height 3.64 m. The spectrum of the JONSWAP wave considered here is given in Fig. 6.
WAVE-ONLY COMPARISONS In this section, the calibrated FAST model is used to
simulate the response of the DeepCwind semi-submersible subjected to the 𝐻𝑠 = 2.0 m sea state in the absence of wind. Because there is no wind, the wind turbine rotor is parked (0 rpm) and the blades are feathered. Simulations are conducted with and without the inclusion of the second-order difference-frequency wave-diffraction forces and compared to test data. All simulations are 3 hr in length with 1000 s of additional settling-in time prior to recording data. This timing is similar to the actual model tests, which were 3 hr in length with 1800 s of settling-in time.
Fig. 7 Comparison of surge frequency-domain response from test data and three different FAST simulations.
A comparison of the surge frequency-domain response, computed as a power spectral density, is given in Fig. 7 for the test data and three different FAST simulations. The FAST simulations consist of a standard analysis with linear wave-diffraction wave forces, an analysis including the second-order difference-frequency wave-diffraction forces, and lastly, another analysis including the second-order wave forces, albeit with a reduction in the surge quadratic-drag model coefficient to 10% of the initial calibrated value from Ref. [11]. Noting that the ordinate axis is displayed on a logarithmic scale, it is clearly seen by the test data shown in Fig. 7 that the low-frequency response at the rigid-body surge natural frequency (0.0093 Hz) dominates the entire surge response of the system. When comparing the test data to the FAST analyses, it is evident that the FAST model that uses only linear wave-diffraction forcing severely under-predicts the low-frequency response of the system. Including the second-order difference-
frequency wave-diffraction forces improves the correlation between the simulation and test data significantly, as seen in Fig. 7. However, because the large response is created via resonance with relatively small second-order wave loads, the magnitude of the response at the surge natural frequency is highly dependent on the damping employed in the FAST model. As seen in Fig. 7, the model using the calibrated surge drag model coefficient of Ref. [11] under-predicts the response near surge resonance. Utilization of the reduced quadratic-drag model damping coefficient, which was discussed in the Model Description section, yields simulation results that compare much better with experimental values, as shown in Fig. 7. The final observation to be made from Fig. 7 is that the test data and all simulations correspond well with one another in the wave-energy frequency range (approximately 0.1 Hz to 0.3 Hz shown in Fig. 6). Although there is some discrepancy at frequencies higher than 0.2 Hz, the magnitude of the response is much lower and the error appears larger due to the log scaling.
To continue the wave-only comparison, Figs. 8 and 9 show two examples of surge response time-series comparisons between the test data and various FAST simulations for the same 𝐻𝑠 = 2.0 m sea state.
Fig. 8 Comparison of surge time-series response for 0 to 500 s from test data and three different FAST simulations.
Fig. 9 Comparison of surge time-series response for 8000 to 8500 s from test data and three different FAST simulations.

7 This report is available at no cost from the National Renewable Energy Laboratory (NREL) at www.nrel.gov/publications.
As can be seen in the figures, the inclusion of the second-order difference-frequency forces greatly improves the correlation between the test data and simulations. This stated, the simulations that include the second-order wave-diffraction effects using Newman’s approximation do not always capture the appropriate local time-domain response that is measured in the basin. As can be seen in Fig. 8, the FAST simulation over-predicts the amplitude of the second-order response in the noted time range 0 to 500 s, and in Fig. 9, the FAST simulation under-predicts the second-order wave-diffraction-associated response and predicts the incorrect phase of this response in another time range (8000 to 8500 s) of the same simulation.
Table 5 Surge motion statistics for the wave-only case.
Statistic Data Linear 2nd-Ord. 2nd-Ord.* Mean (m) 0.735 0.000 0.307 0.307 Std. Dev. (m) 0.354 0.103 0.218 0.343 Max. (m) 2.200 0.486 1.137 1.385 Min. (m) -0.507 -0.382 -0.378 -0.711 Range (m) 2.707 0.868 1.515 2.096 *Reduced Surge Drag Damping
As a next step in this wave-only simulation discussion, the statistics for the surge response from the test data and three simulations is given in Table 5. As shown in the table, without inclusion of the second-order difference-frequency wave-diffraction forces, very poor predictions of the surge behavior are obtained. For the simulation using only linear wave-diffraction forces, the mean surge is zero, and the standard deviation and range of the surge DOF over the simulation are only 29.1% and 32.1% of those measured from the test. For the best simulation, which includes the reduced surge quadratic-drag damping coefficient, the surge mean, standard deviation, and range are 42.3%, 96.9%, and 77.4% of the experimental values, respectively.
To complete the wave-only comparison, the response of the upwind mooring line (which lies along the negative surge axis) fairlead tension is investigated. Figure 10 compares the test data and the three FAST simulations for the fairlead tension in the frequency domain.
Fig. 10 Comparison of upwind mooring line fairlead tension response from test data and three different FAST simulations.
Table 6 compares the fairlead tension statistics of the test data and three simulations. As can be seen in Fig. 10, the frequency-domain fairlead tension comparison is similar to the surge comparison at low frequencies.
Table 6 Upwind fairlead tension force statistics for the wave only case.
Statistic Data Linear 2nd-Ord. 2nd-Ord.* Mean (kN) 1161 1105 1120 1120 Std. Dev. (kN) 18.6 4.7 10.1 16.0 Max. (kN) 1247 1128 1160 1173 Min. (kN) 1097 1089 1090 1075 Range (kN) 150.0 39.0 70.0 98.0 *Reduced Surge Drag Damping
This indicates that the mooring tension response is accurately predicted for the DeepCwind semi-submersible at low frequencies if the second-order difference-frequency wave-diffraction forces are included. However, the fairlead tension response in the linear wave-energy frequency range is significantly under-predicted. This is theorized to be a product of using a quasi-static catenary line solver in FAST [8], which ignores mooring line dynamics and direct wave particle excitation. The interplay of improved low-frequency prediction and poor linear wave-energy frequency range simulation is captured in the statistics of Table 6. For the best simulation, which includes second-order wave-diffraction loads and a reduced quadratic-drag damping coefficient, the standard deviation and range are 86.0% and 65.3%, respectively, of the experimental values. While these are improvements compared to the simulation that includes only linear wave loads, these improvements are less than what was found for the surge response earlier in this section.
COMBINED WIND/WAVE COMPARISONS With the wave-only comparisons complete, this section
describes the investigation of the interaction of the dynamic wind and second-order difference-frequency wave-diffraction loads, both of which influence the global response of the floating structure at low frequencies. The investigation will be conducted by comparing the response of the DeepCwind semi-submersible subjected to the following conditions: NPD wind-only, the irregular wave-only, and the simultaneous application of the wind and wave. Note that the 𝑈𝑚 = 20.6 m/s dynamic wind and 𝐻𝑠 = 2.0 m irregular wave are detailed in the Environmental Conditions section. For tests and simulations with wind, the rotor blade pitch is fixed in the operational position and the rotor speed is held constant at 12.7 rpm. For the test and simulations without wind, the blades are feathered and the rotor is parked. Finally, all simulations use the reduced surge quadratic-drag damping coefficient of 1.25×10⁵ Ns2/m2.
Fig. 11 depicts the frequency-domain surge response of the wind-only, wave-only and combined wind and wave case as computed from the model test data. As can be seen by comparing the combined condition case to the other two

8 This report is available at no cost from the National Renewable Energy Laboratory (NREL) at www.nrel.gov/publications.
scenarios in the figure, the dynamic wind loads control the response of the DeepCwind semi-submersible for frequencies less than 0.05 Hz, not the second-order wave-diffraction loads for the environments considered here. For frequencies between 0.05 to 0.25 Hz, the linear wave loads understandably control the response of the system.
Fig. 11 Comparison of model test data surge response from wind-only, wave-only, and combined wind and wave conditions.
Fig. 12 Comparison of FAST simulation surge response from wind-only, wave-only and combined wind and wave conditions.
With the comparative responses and trends established from model test data, the same three identical cases are simulated using the custom FAST tool. The frequency-domain surge response for the three cases, as computed from FAST simulations, is given in Fig. 12. As can be seen by comparing Figs. 11 and 12, it is clear that FAST captures the same trends observed in the model test data. For low frequencies, the dynamic wind loads control the response of the system, and for frequencies above 0.05 Hz, the linear wave loads dictate the DeepCwind semi-submersible surge response. To further emphasize the correlation between the combined wind and wave case and the model test data and simulation, the surge motion statistics for the combined environment cases are given
in Table 7. Table 7 clearly shows a fair agreement between the test data and the simulation including second-order wave-diffraction forces for this condition. However, comparing the values in Tables 5 and 7 indicates that most of the response in the combined wind and wave case is driven by the wind loads because the mean, standard deviation, and maximum values are all much larger when the wind loads are present.
Table 7 Surge motion statistics for the combined wind and wave case.
Statistic Data Linear 2nd-Ord.* Mean (m) 8.153 7.208 7.436 Std. Dev. (m) 1.131 1.221 1.232 Max. (m) 11.54 11.06 10.99 Min. (m) 4.281 3.073 2.882 Range (m) 7.259 7.987 8.108 *Reduced Surge Drag Damping
To complete this section, an additional simulation is performed for the combined wind and wave case, including only the linear wave-diffraction forces. The surge response statistics for this case are also given in Table 7, alongside the test data and simulation with second-order difference-frequency wave-diffraction forcing. As the table clearly shows, neglecting the second-order wave-diffraction forcing for the combined wind and wave case studied here is not of significant concern for the DeepCwind semi-submersible. Excluding the second-order difference-frequency wave-diffraction forces in the simulation results in reductions of only 3.1% for the mean surge, 0.9% for the surge standard deviation, and 1.5% for the surge range.
CONCLUSIONS
In this work, a numerical model of the DeepCwind semi-submersible floating wind turbine was created in the open-source coupled aero-hydro-servo-elastic CAE tool FAST. The model was calibrated using select DeepCwind model test data, and subsequently, was used to simulate wave-only and combined wind and wave cases from the model test program. Second-order difference-frequency wave-diffraction forcing played a significant role in the global response of the DeepCwind semi-submersible based on the analysis of model test data. This study included these forces in the FAST CAE simulator via Newman’s approximation in an effort to understand the importance of including these effects.
For wave-only simulations, the inclusion of second-order difference-frequency wave-diffraction forces greatly improved the frequency-domain and statistical correlation between the simulation output and test data for surge and mooring fairlead tension response. To best capture the low-frequency response near the surge resonance frequency, the coefficients employed for the quadratic surge damping model had to be tailored to suit the small amplitude motions created by the operational 𝐻𝑠 = 2.0 m sea state. This situation stemmed from two factors. First, the low-frequency resonant surge response is sensitive to the
9 This report is available at no cost from the National Renewable Energy Laboratory (NREL) at www.nrel.gov/publications.
quadratic-drag damping coefficient used in the simulation. Second, the quadratic-drag damping model employed here is unable to capture the damping characteristics of the DeepCwind semi-submersible over a large range of surge amplitudes, and can at best capture the damping response of the system over a limited range of motion amplitudes. It was also found that the Newman’s approximation implementation utilized here yielded improvements in the time-series comparisons of the surge response; however, the amplitudes and phases of the low-frequency response were often not in great agreement. In addition, while the inclusion of the second-order wave-diffraction forces improved the low-frequency correlation of the fairlead tension response, a significant discrepancy between the simulation and test data still persisted in the wave-energy frequency range, likely due to the hydrodynamic loading of the mooring line and mooring line dynamics that are currently excluded in the FAST CAE tool.
Upon completion of the wave-only portion of the study, simulations of a combined wind and wave environment were performed and compared to the test data. For the case studied, where the relationship of wind and wave environmental loads was considered to be representative of a realistic operating condition, the dynamic wind loads dominated the low-frequency surge response of the system, as opposed to the second-order difference-frequency wave-diffraction forces. This was confirmed by comparing FAST simulations with and without the second-order wave-diffraction forces. Excluding the second-order wave-diffraction forces for the combined wind and wave case resulted in a small 3.1% reduction in the mean surge value, and even smaller reductions in the surge standard deviation and range. These small reductions indicate that excluding the second-order wave forces, as is done in the current version of FAST, is likely a reasonable approach when simulating floating wind turbines subjected to simultaneous wind and wave loading. However, for instances where the rotor is parked/idling, and the rotor blades are feathered to reduce the rotor thrust coefficient, the response is driven by the wave loads with negligible influence of the wind loads, even in large winds. This conclusion is based on previous analysis of the DeepCwind semi-submersible test data. In other words, this turbine configuration leads to responses very similar to a wave-only condition. Therefore, neglecting the second-order wave-diffraction forces may no longer be advisable for parked/idling turbine scenarios, as supported by the results obtained from the wave-only analyses conducted in this work.
ACKNOWLEDGMENTS The authors gratefully acknowledge the financial support
from the Department of Energy through DeepCwind Grants DE-EE0002981 and DE-EE0003728 and National Renewable Energy Laboratory Grant DE-AC36-08GO28308, the National Science Foundation through Grant IIP-0917974 and the University of Maine. In addition, the expertise and support of MARIN in conducting the model test is greatly appreciated.
REFERENCES [1] Jonkman, J.M., 2009, “Dynamics of Offshore Floating Wind Turbines – Model Development and Verification,” Wind Energy 12(5), pp. 459-492. [2] Jonkman, J. and Musial, W., 2012, “IEA Wind Task 23: Offshore Wind Technology and Deployment, Subtask 2: The Offshore Code Comparison Collaboration (OC3),” Final Technical Report. [3] Nielsen, F.G., Hanson, T.D. and Skaare, B., 2006, “Integrated Dynamic Analysis of Floating Offshore Wind Turbines,” Proc. 25th ASME International Conference on Offshore Mechanics and Arctic Engineering, Hamburg, Germany, pp. 671-679. [4] Roddier, D., Cermelli, C., Aubault, A. and Weinstein, A., 2010, “WindFloat: A Floating Foundation for Offshore Wind Turbines,” Journal of Renewable and Sustainable Energy 2(3), 033104. [5] Goupee, A.J., Koo, B.J., Lambrakos, K.F. and Kimball, R.W., 2012, “Model Tests for Three Floating Wind Turbine Concepts,” Proc. 2012 Offshore Technology Conference, Houston, Texas. [6] Kimball, R.W., Goupee, A.J., Coulling, A.J. and Dagher, H.J., 2012, “Model Test Comparisons of TLP, Spar-buoy and Semi-submersible Floating Offshore Wind Turbine Systems,” Proc. 2012 SNAME Annual Meeting and Expo, Providence, Rhode Island. [7] Jonkman, J.M. and Buhl, Jr., M.L., 2005, “FAST User’s Guide,” NREL Technical Report No. EL-500-38230. [8] Jonkman, J.M., 2007, “Dynamics Modeling and Loads Analysis of an Offshore Floating Wind Turbine,” NREL Technical Report No. TP-500-41958. [9] Stewart, G., Lackner, M., Robertson, A., Jonkman, J. and Goupee, A., 2012, “Calibration and Validation of a FAST Floating Wind Turbine Model of the DeepCwind Scaled Tension-leg Platform,” Proc. 22nd International Offshore and Polar Engineering Conference, Rhodes, Greece, pp. 380-387. [10] Browning, J.R., Jonkman, J., Robertson, A. and Goupee, A.J., 2012, “Calibration and Validation of the FAST Dynamic Simulation Tool for a Spar-type Floating Offshore Wind Turbine,” Proc. 2012 Science of Making Torque from Wind Conference, Oldenburg, Germany. [11] Coulling, A.J., Goupee, A.J., Robertson, A.N., Jonkman, J.M. and Dagher, H.J., 2012 “Validation of a FAST Semi-submersible Floating Wind Turbine Model with DeepCwind Test Data,” Journal of Renewable and Sustainable Energy, in review. [12] Martin, H.R., Kimball, R.W., Viselli, A.M., and Goupee, A.J., 2012, “Methodology for Wind/wave Basin Testing of Floating Offshore Wind Turbines,” Proc. 31st ASME International Conference on Offshore Mechanics and Arctic Engineering, Rio de Janeiro, Brazil. [13] Koo, B., Goupee, A.J., Lambrakos, K. and Kimball, R.W., 2012, “Model Tests for a Floating Wind Turbine on Three Different Floaters,” Proc. 31st ASME International Conference on Offshore Mechanics and Arctic Engineering, Rio de Janeiro, Brazil.

10 This report is available at no cost from the National Renewable Energy Laboratory (NREL) at www.nrel.gov/publications.
[14] Goupee, A.J., Koo, B, Kimball, R.W., Lambrakos, K.F. and Dagher, H.J., “ Experimental Comparison of Three Floating Wind Turbine Concepts,” Proc. 31st ASME International Conference on Offshore Mechanics and Arctic Engineering, Rio de Janeiro, Brazil. [15] Newman, J.N., 1974, “Second-order, Slowly-varying Forces on Vessels in Irregular Waves,” Proc. Dynamics of Marine Vehicles and Structures in Waves, pp. 193-197. [16] Standing, R.G., Brendling, W.J. and Wilson, D., 1987, “Recent Developments in the Analysis of Wave Drift Forces, Low-Frequency Damping and Response,” Proc. 1987 Offshore Technology Conference, Houston, Texas. [17] Chakrabarti, S.K., 1994, Offshore Structure Modeling, World Scientific Publishing Co. Pte. Ltd., Singapore. [18] Jain, A., Robertson, A.N., Jonkman, J.M., Goupee, A.J. and Swift, R.W., 2012, “FAST Code Verification of Scaling Laws for DeepCwind Floating Wind System Tests,” Proc. 22nd International Offshore and Polar Engineering Conference, Rhodes, Greece, pp. 355-365. [19] Jonkman, J.M., Butterfield, S., Musial, W. and Scott, G., 2007, “Definition of a 5-MW Reference Wind Turbine for Offshore System Development,” NREL Technical Report No. TP-500-38060. [20] Drela, M., 1989, “XFOIL: An Analysis and Design System for Low Reynolds Number Airfoils,” Conference on Low Reynolds Number Airfoil Aerodynamics, University of Notre Dame. [21] Kim, M.H. and Yue, D.K.P., 1991, “Sum- and Difference-Frequency Wave Loads on a Body in Unidirectional Gaussian Seas,” Journal of Ship Research 35(2), pp. 127-140. [22] Langley, R.S., 1986, “On the Time Domain Simulation of Second Order Wave Forces and Induced Responses,” Applied Ocean Research 8(3), pp. 134-144. [23] Lee, C.H. and Newman, J.N., 2006, WAMIT® User Manual, Versions 6.4, 6.4PC, 6.3S, 6.3S-PC, WAMIT, Inc., Chestnut Hill, Massachusetts. [24] API Recommended Practice 2A-WSD, 21st Edition, Recommended Practice for Planning, Designing and Constructing Fixed Offshore Platforms – Working Stress Design, 2000. [25] IEC 61400-3, Wind turbines – Part 3: Design Requirements for Offshore Wind Turbines, 2009.