importance of energy efficiency in state climate action plans
DESCRIPTION
Importance of Energy Efficiency in State Climate Action Plans. Midwestern Governors Association Energy Efficiency Advisory Group Minneapolis, MN – April 23-24, 2008. Kenneth A. Colburn Center for Climate Strategies [email protected] 617-784-6975. www.azclimatechange.us. - PowerPoint PPT PresentationTRANSCRIPT

Importance of Energy Efficiency in State Climate Action Plans
Midwestern Governors AssociationEnergy Efficiency Advisory Group
Minneapolis, MN – April 23-24, 2008
Kenneth A. ColburnCenter for Climate Strategies
[email protected] 23-24, 2008 www.climatestrategies.us
1

+285,000
jobs
www.azclimatechange.us
April 23-24, 2008 www.climatestrategies.us2

GHG Reduction StrategiesAZ CCAG Options Ranked by $/ MTCO2e 2007-2020
-$100
-$80
-$60
-$40
-$20
$0
$20
$40
$60
$80
TLU-1RCI-3RCI-8ES-11RCI-1RCI-6ES-9TLU-4F-3aF-3bRCI-4RCI-5A-2
RCI-2ES-12TLU-2 TLU-9TLU-12TLU-13A-3A-1aES-1 A-9 F-1
RCI-7ES-3TLU- 14
F-2ES-6 A-8
AZ CCAG Policy Option
$/MTCO2e
$/ MTCO2e
Clean Cars
Appliance Efficiency Standards
Carbon Intensity Targets
Electricity Pricing
DG & CHP
Reduce Land Conversion
Truck Speed Limit
Increase ReforestationBuilding
Codes
DSM
RPS
April 23-24, 2008 www.climatestrategies.us3

Economy-Wide GHG Cost Curve
April 23-24, 2008 www.climatestrategies.us4

GHG Reduction Contributions by Sector
DRAFTApril 23-24, 2008 www.climatestrategies.us5

Potential US Net Economic Cost/Savings by Sector
Sector $ Billion
Energy Supply $16.2
Residential, Commercial & Industrial -$43.4
Agriculture, Forestry & Waste $3.8
Transportation & Land Use -$2.3
Total -$25.6
DRAFTApril 23-24, 2008 www.climatestrategies.us6
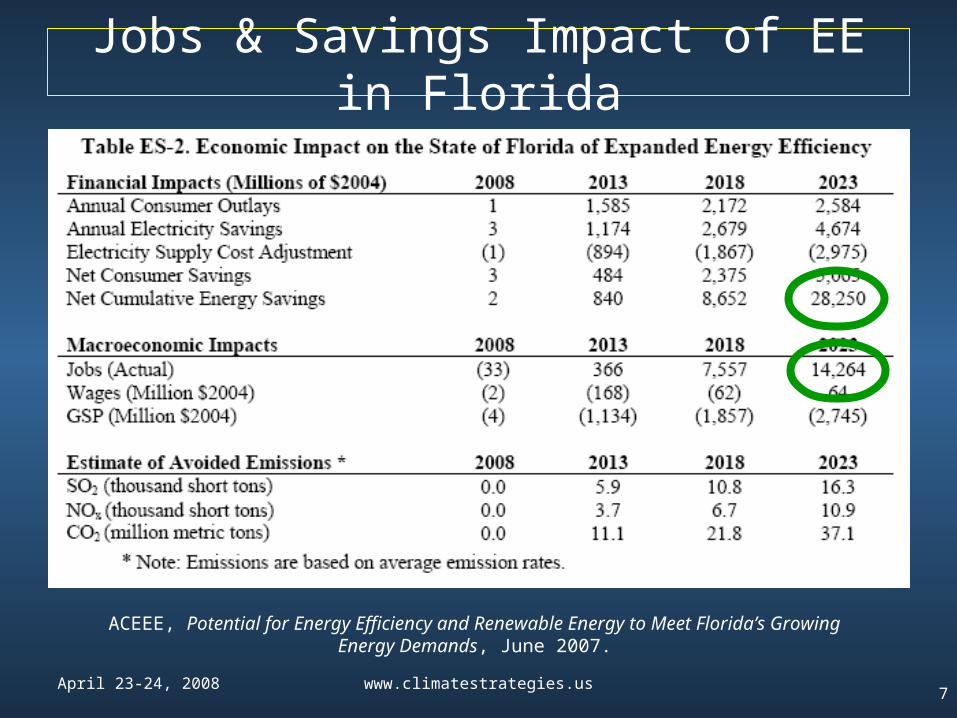
Jobs & Savings Impact of EE in Florida
ACEEE, Potential for Energy Efficiency and Renewable Energy to Meet Florida’s Growing Energy Demands, June 2007.
April 23-24, 2008 www.climatestrategies.us7

April 23-24, 2008 www.climatestrategies.us8

April 23-24, 2008 www.climatestrategies.us
R C I S e c t o r S t e p w i s e a n d F i t t e d
M a r g i n a l C o s t C u r v e s o f U S , 2 0 2 0
- 1 0 0
- 7 5
- 5 0
- 2 5
0
2 5
5 0
7 5
1 0 0
0 5 1 0 1 5 2 0 2 5 3 0 3 5 4 0 4 5
P e r c e n t a g e R e d u c t i o n o f G H G s E m i s s i o n s
Marginal Cost ($/CO
2
e)
DRAFT
9
Residential, Commercial, Industrial(Energy Demand)

April 23-24, 2008 www.climatestrategies.us
Energy Supply (Heat and Power)
E S S e c t o r S t e p w i s e a n d F i t t e d
M a r g i n a l C o s t C u r v e s o f U S , 2 0 2 0
- 6 0
- 4 0
- 2 0
0
2 0
4 0
6 0
8 0
1 0 0
1 2 0
1 4 0
0 5 1 0 1 5 2 0 2 5 3 0 3 5 4 0
P e r c e n t a g e R e d u c t i o n o f G H G s E m i s s i o n s
Marginal Cost ($/CO
2
e)
DRAFT10

April 23-24, 2008 www.climatestrategies.us
Transportation & Land Use
T L U S e c t o r S t e p w i s e a n d F i t t e d
M a r g i n a l C o s t C u r v e s o f U S , 2 0 2 0
- 1 5 0
- 1 2 5
- 1 0 0
- 7 5
- 5 0
- 2 5
0
2 5
5 0
7 5
1 0 0
1 2 5
1 5 0
0 2 4 6 8 1 0 1 2 1 4 1 6 1 8 2 0
P e r c e n t a g e R e d u c t i o n o f G H G s E m i s s i o n s
Marginal Cost ($/CO
2
e)
DRAFT11

April 23-24, 2008 www.climatestrategies.us
Agriculture, Forestry, Waste Management
A F W S e c t o r S t e p w i s e a n d F i t t e d
M a r g i n a l C o s t C u r v e s o f U S , 2 0 2 0
- 1 0 0
- 8 0
- 6 0
- 4 0
- 2 0
0
2 0
4 0
6 0
8 0
1 0 0
0 1 0 2 0 3 0 4 0 5 0 6 0 7 0 8 0 9 0 1 0 0 1 1 0 1 2 0 1 3 0
P e r c e n t a g e R e d u c t i o n o f G H G s E m i s s i o n s
Marginal Cost ($/CO
2
e)
DRAFT12

April 23-24, 2008 www.climatestrategies.us
States with GHG Mitigation Cost/Savings Data
13

April 23-24, 2008 www.climatestrategies.us
State GHG Abatement Cost Curves ($/Ton GHG Removed)
• 12 states with facilitated, comprehensive GHG plans (AZ, CO, CT, ME, MN, MT, NM, NY, NC, RI, VT, WA)
• Actions with $/ton for all sectors (excludes major non-quantified actions expected to yield net $ savings)
• Data is the product of facilitated stakeholder consensus processes (bottom up, transparent)
• Most recent data from plans; implementation results are included for past and some present actions
• Data reported for 2020 (with scaling as needed)
• Specific data sources, methods, assumptions in report appendices (available through CCS)
14

15
CALIFORNIA ENERGY COMMISSION
Draft 5.17.05 mlw
Per Capita Electricity Consumption
0
2,000
4,000
6,000
8,000
10,000
12,000
14,000
1960 1965 1970 1975 1980 1985 1990 1995 2000
kWh/person
Source: http://www.eia.doe.gov/emeu/states/sep_use/total/csv/use_csv.html
United States
California
Per Capita Electricity Consumption
California – It’s Already Working
April 23-24, 2008 www.climatestrategies.us15

Cleantech Venture Investments by Region
E2/Cleantech Venture Network, Cleantech Venture Capital: How Public Policy Has Stimulated Private Investment, May 2007.
April 23-24, 2008 www.climatestrategies.us16

E2/Cleantech Venture Network, Cleantech Venture Capital: How Public Policy Has Stimulated Private Investment, May 2007.
Cleantech Venture Investments by Sector
April 23-24, 2008 www.climatestrategies.us17

Thank Youfor Your
Time and Attention!
April 23-24, 2008 www.climatestrategies.us18

April 23-24, 2008 www.climatestrategies.us19