implementing and verifying offsets for trading and ... · form) trading/adaptive management plan...
TRANSCRIPT
Implementing and Verifying Offsets for Trading and Adaptive Management

• AB 680/SB 547 were recently passed by state senate and assembly to extend the timeline of adaptive management, allow adaptive management for TSS, and create a statewide variance process for phosphorus
• This webinar will solely address the water quality trading and adaptive management options
• If a statewide phosphorus variance option is established, this option will be discussed in other webinars/correspondence
• Questions on proposed legislation may be submitted to: Russ Rasmussen Deputy Water Division Administrator [email protected] (608) 267-7651

Webinar 1. Overview
Webinar 2. Finding and Quantifying Credits
Webinar 3. Developing a Plan
Webinar 4. Implementing and Verifying Offsets
http://dnr.wi.gov/topic/SurfaceWater/atlas.html

Adaptive Management Technical Handbook
Released: 01/07/2013
http://dnr.wi.gov/topic/SurfaceWater/AdaptiveManagement.html
(topic keyword: “adaptive management”)
Implementing Water Quality Trading in WPDES Permits Released: 08/21/2013
Water Quality Trading How-To Manual
Released: 09/09/2013
http://dnr.wi.gov/topic/SurfaceWater/WaterQualityTrading.html
(topic keyword: “water quality trading”)

Adaptive Management Trading
Pollutants Covered TP (and possibly TSS) All pollutants except BCCs
End Goals Attaining the water quality criteria
Compliance with WQBEL (offset load)
Calculated Reductions No trade ratios Trade ratios apply
Timing Implemented throughout the permit term
Generating credits as they can be used
In-Stream Monitoring Required Not required
Level of Documentation Needed
General watershed information
Field-by-field documentation
See Webinars 1 & 2 for additional information.
• Compliance Option for WPDES permit holder (i.e. ‘Point Sources’)

Trading/Adaptive Management selected as preferred compliance option (NOI/Request Form)
Trading/Adaptive Management plan developed
WDNR approves plan and reissues/modifies WPDES permit
Implementation & verification requirements built-in to WPDES permit

Permit Year
Step in Compliance Schedule
0 Permit Reissued
1 Operational Evaluation Report
2 Compliance alternatives, source reductions, and improvements status
3 Preliminary compliance alternatives plan
4 Final compliance alternatives plan
5 Progress report on plans & specifications
Submit NOI/ Preliminary Request Form
Submit Plan & Checklist
PERMIT REISSUED 6
Additional time to generate credits or comply with AM interim limits, as determined necessary by WDNR.
7
8
9
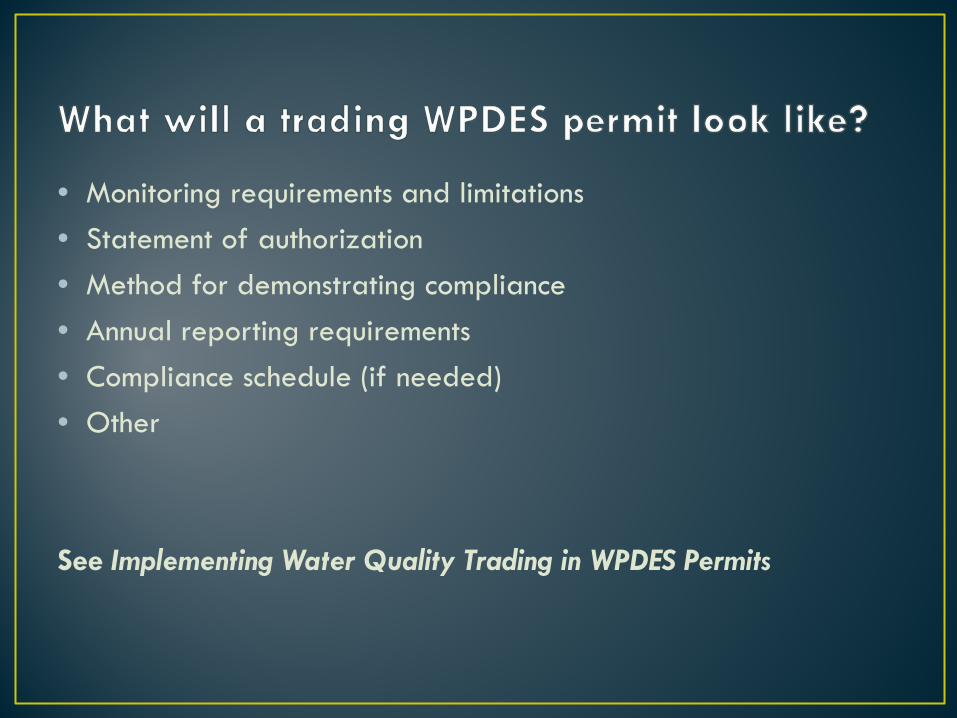
• Monitoring requirements and limitations • Statement of authorization • Method for demonstrating compliance • Annual reporting requirements • Compliance schedule (if needed) • Other
See Implementing Water Quality Trading in WPDES Permits
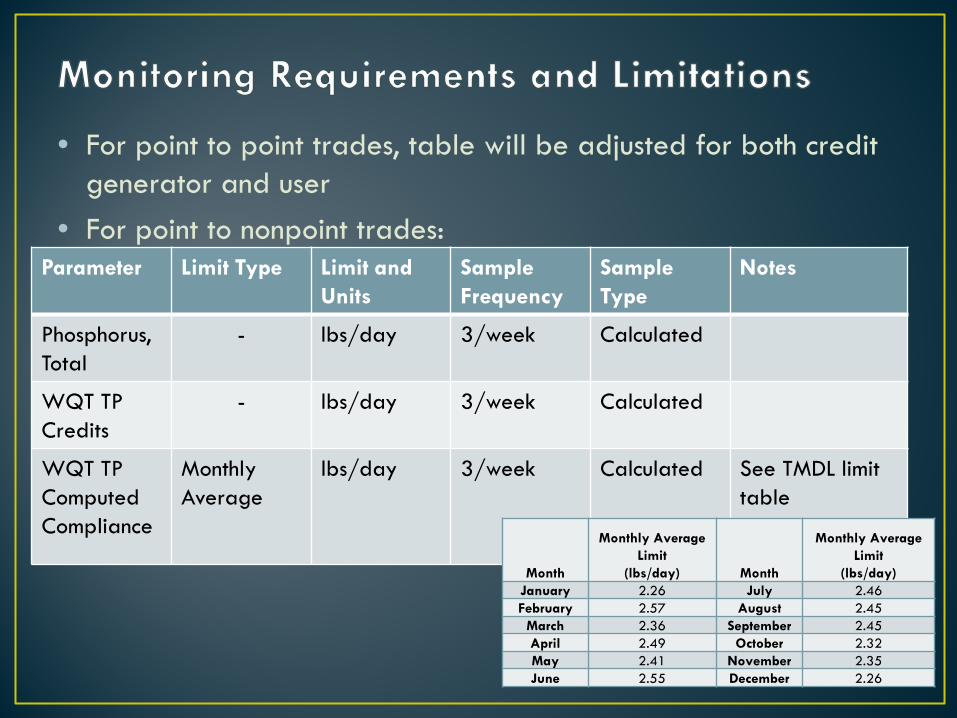
Parameter Limit Type Limit and Units
Sample Frequency
Sample Type
Notes
Phosphorus, Total
- lbs/day 3/week Calculated
WQT TP Credits
- lbs/day 3/week Calculated
WQT TP Computed Compliance
Monthly Average
lbs/day 3/week Calculated See TMDL limit table
• For point to point trades, table will be adjusted for both credit generator and user
• For point to nonpoint trades:
Month
Monthly Average Limit
(lbs/day) Month
Monthly Average Limit
(lbs/day) January 2.26 July 2.46 February 2.57 August 2.45
March 2.36 September 2.45 April 2.49 October 2.32 May 2.41 November 2.35 June 2.55 December 2.26

• Allows WQT to be used with identified limits • Refers to a specific trading plan number • Specifies number of credits that can be used in a calendar year • Only authorizes credits established in the plan & approved by
DNR to be used • May specify a time-period (for TMDL scenarios)
Example: The permittee may use WQT to demonstrate compliance with monthly average WQBELs specified in the Table 1.1.1.1. Credits equal to 950 pounds per calendar year for TP are available until June 30, 2020 as specified in Water Quality Trading Plan WQT-2013-00003.

• Monthly Calculation • Reported on monthly eDMR
• Number of credits used is reported in “WQT TP Credit” column • Adjusted effluent loading reported in “WQT TP Computed Compliance” column
• When to Use Credits • Credits generated from point sources must be used within same time period as
they were generated • Credits must be used in same month if limits are expressed monthly
• Credits generated each year by nonpoint source can be used throughout the year

• Point source 1 is located in Rock River TMDL
• Monthly Limitations apply
• Credits needed for select months
• Point source 1 works with County LCD to install buffer strips to generate credits
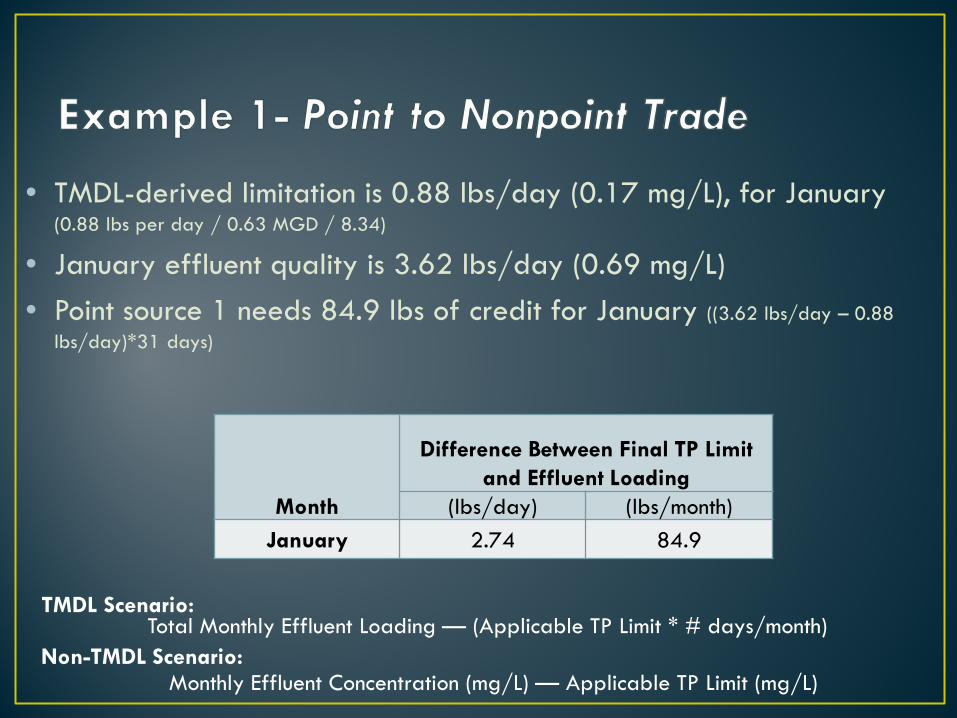
• TMDL-derived limitation is 0.88 lbs/day (0.17 mg/L), for January (0.88 lbs per day / 0.63 MGD / 8.34)
• January effluent quality is 3.62 lbs/day (0.69 mg/L) • Point source 1 needs 84.9 lbs of credit for January ((3.62 lbs/day – 0.88
lbs/day)*31 days)
Month
Difference Between Final TP Limit and Effluent Loading
(lbs/day) (lbs/month) January 2.74 84.9
Monthly Effluent Concentration (mg/L) — Applicable TP Limit (mg/L) Non-TMDL Scenario:
Total Monthly Effluent Loading — (Applicable TP Limit * # days/month) TMDL Scenario:

Total TP Load Reduction (lbs/yr)
Total Credits (lbs/yr) Total Credits Needed (lbs/mo)
~85
TP Load Reduction=(Current Condition — Improved Condition)*Acres
Pre-Buffer Condition:
Post-Buffer Condition:
TP Load Reduction=(8 — 2)*40 acres= 240 lbs/yr

Total TP Load Reduction (lbs/yr)
Total Credits (lbs/yr) Total Credits Needed (lbs/mo)
240 ~85
Trade Ratio= (Delivery + Downstream + Equivalency + Uncertainty - Habitat Adjustment) : 1
Trade Ratio= (Uncertainty - Habitat Adjustment) : 1
Trade Ratio= (2) : 1
Total TP Load Reduction generated from buffer strips, no-till, and cover crops:
Trade Credit= 240/2 = 120 lbs/yr

Total TP Load Reduction (lbs/yr)
Total Credits (lbs/yr) Total Credits Needed (lbs/yr)
2,200 1,100
Total TP Load Reduction (lbs/yr)
Total Credits (lbs/yr) Total Credits Needed (lbs/mo)
240 120 ~85
• January eDMR report • “WQT TP Credit” = 85 Credits Used • “WQT TP Computed Compliance” = 0.88 lbs/day
• 85 lbs per mo / 31 days= 2.74 lbs/day • 3.62 lbs/day – 2.74 lbs/day= 0.88 lbs/day
• Remaining credit = 35 lbs/yr

1. Create a “margin of safety” 2. Create a back up plan if
practices fail 3. Ease of verification
• Landowner certification • Field visits • Pictures • Other?
See Webinar 3 for additional detail.
Example: Barnyard Improvements

• Point source 1 needs 20 lbs of credit for March
• Point source 2 can provide 28 lbs of reduction
Credit User
Credit Generator
• Total credit available= 25 lbs (25lbs/1.1)
• Trade Ratio= (Delivery + Downstream + Equivalency + Uncertainty – Habitat Adjustment): 1
• Trade Ratio= (0 + 1) : 1 1 : 1 1.1 : 1
• Revised limit for point source 1= 104 lbs (79 lbs/mo + 25 lbs/mo)
• Revised limit for point source 2= 86 lbs (114 lbs/day - 28 lbs/day)
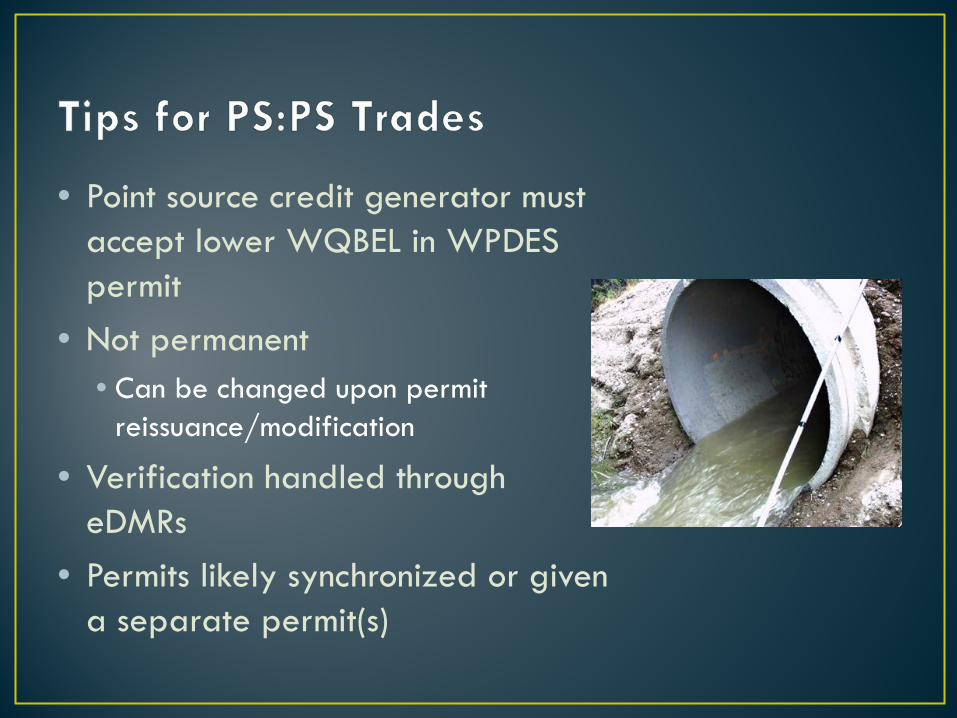
• Point source credit generator must accept lower WQBEL in WPDES permit
• Not permanent • Can be changed upon permit
reissuance/modification
• Verification handled through eDMRs
• Permits likely synchronized or given a separate permit(s)

• Requires reporting by January 31st each year of the WPDES permit • Number of credits (lbs/month) used each month of the previous year • Source of each month’s credits by identifying the approved water quality
trading plan that details the source • A summary of the annual inspection of each nonpoint source management
practice that generated credits • Identification of noncompliance or failure to implement

• Dnr.wi.gov, keyword “water quality trading”

• Submit with WQT plan or during compliance schedule • Type of credit generated (PS: NPS) • Trade agreement number • Practice used to generate credits • Anticipated load reduction • Trade ratio • Method of quantification • Location (land parcel ID)

• Submit ASAP, no later than annual report • Submit with management practice registration form, if practice
being replaced

• Reopener clause • Failure to implement • Failure to comply • New information becomes available that would change WDNR approval
• Annual inspection requirements • Number of credits used each month • Summary of inspections
• Certification statements • Minimum control level (TBEL or P99)

• If significant changes to WQT plan occur, WQT plan update will be public noticed as part of a permit modification
• Permit language may not necessarily change as part of the permit modification
• http://dnr.wi.gov/topic/wastewater/PublicNotices.html

• Effluent monitoring requirements and limitations
• In-stream monitoring requirements • Statement of authorization • Annual reporting requirements • Other
Monitoring Requirements and Effluent Limitations
Parameter Limit Type
Limit and Units
Sample Frequency
Sample Type Notes
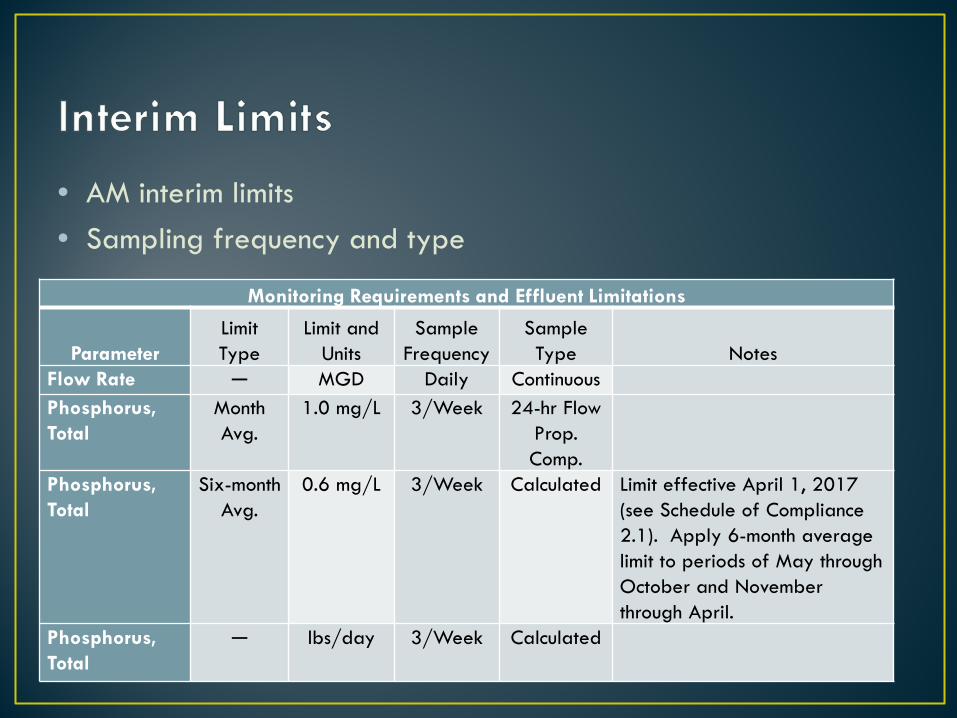
Flow Rate ─ MGD Daily Continuous Phosphorus, Total
Month Avg.
1.0 mg/L 3/Week 24-hr Flow Prop. Comp.
Phosphorus, Total
Six-month Avg.
0.6 mg/L 3/Week Calculated Limit effective April 1, 2017 (see Schedule of Compliance 2.1). Apply 6-month average limit to periods of May through October and November through April.
Phosphorus, Total
─ lbs/day 3/Week Calculated
• AM interim limits • Sampling frequency and type

Parameter Limit and
Units Sample
Frequency Sample Type Flow, River cfs Concurrently
with TP samples
Measure
Phosphorus, Total
mg/L Every other Monday
May through October
Grab
Phosphorus, Total
lbs/month Monthly Total Monthly
• Effluent monitoring location • In-stream monitoring location
• Furthest downstream point in the action area will be included in WPDES permit
• Other sample locations may be voluntary or included in WPDES permit

• Allows AM to be used • Refers to a specific AM plan number • Specifies minimum P reduction that must be achieved
Example: The permittee shall design and implement the actions identified in AM Plan No.1234-2014 in accordance with the goals and measures identified in the approved plan. If total phosphorus loadings within the Happy Creek action area, as identified in AM Plan No.1234-2014, are not reduced by at least 775 pounds per year by March 31, 2021, the watershed adaptive management option may not be available to the permittee when this permit is reissued in 2021.

• Current P load (stream load + effluent load) • (Qs*Cs*8.34*365)+(Qe*Ce*8.34*365) • (3.5 MGD*0.131mg/L*8.34*365)+(0.5 MGD*0.4mg/L*8.34*365) • Current P load=~2000 lbs/yr
• Allowable P load • (Qs+Qe)*WQC*8.34*365 • (3.5 MGD+0.5 MGD)*0.075 mg/L*8.34*365 • Allowable load=~915 lbs/yr
• Compare the difference • Needed Reduction= ~1,100 lbs/yr • PS contribution=40%
• Minimum P reduction at end of permit term 1= 440 lbs/yr (1100 * 40%)
• Minimum P reduction at end of permit term 2= 660 lbs/yr (1100– 440)

• Requires reporting by January 31st each year of the WPDES permit • Identify actions from plan completed during
the previous calendar • Identify actions in progress; • Evaluate collected monitoring data • Progress towards achieving the goals • Outreach and education • Offset practice verification
• 20%/year recommendation • Identify any corrections or adjustments to
the plan that are needed • Other?
AM Compliance
Pollutant Reductions
In-Stream Monitoring
Outreach & Education
Plan Improvement

Year 2 Goal= 20% nutrient management planning/year; 300 lb reduction
Companion Crop Installed on 150 ac.

• Reopener Clause • Provisions for Terminating AM
• Why? • Failure to Implement • New information becomes available making AM infeasible
• What happens? • Receive originally calculated effluent limits • May use WQT or other compliance option • Compliance schedule may be available

• Plan for full project life • Adjustments can be made over time
• Create reasonable assurances for plan success • Go above the minimum in-stream monitoring requirements specified in
WPDES permit • Apply trade ratio, at least to minimum P reduction • Apply credit threshold, at least to minimum P reduction
• Ensure reductions would “count” under trading • Utilize agreements and management practice registration forms

• Implementation and Inventories
• Quantifying Reductions
• How to Apply Trade ratios
• Verification
• TMDL Example

Adaptive Management
Water Quality Trading
Quantify Reductions Install Practices
Verify Reductions Maintain Practices

• Determine your eligibility for the programs and what works best for your situation.
• Evaluate information contained in TMDLs and use DNR screening tools to evaluate potential opportunities.
• Work with the county LCDs, crop consultants, and watershed groups to refine information and help make contact with potential land users.
• Perform field scale analysis to quantify reductions and convert reductions to credits (WQT).

Use sound scientific data and rationale Determine eligibility for AM and evaluate potential
for nonpoint reductions based on percentages. PRESTO
• Calculates basin specific average annual phosphorus loads from point and nonpoint sources
Watershed Delineation
Pollutant Runoff
Effluent Aggregation

• Conduct a watershed assessment to identify source areas.
• Estimate load reductions for installation of practices.
• Look for complementary practices and target beneficial areas such as wellhead protection areas.

• Size of watershed and location of point sources relative to potential credits.
• Relative location of point of standards application.
• Assess need for downstream trading or delivery factors due to lakes or impoundments – how will this impact trade ratios or attainment of water quality standards.

• Visit DNR website for information on TMDLs in the watersheds of interest:
http://dnr.wi.gov/topic/tmdls/
• Review TMDL reports to evaluate potential needed load reductions.
• TMDLs may have ranked watersheds by loadings or characterized different reductions scenarios.
• For WQT, TMDLs set the credit threshold and for AM provide an estimate of reductions needed to reach water quality criteria.

• A screening / potential index model developed by:
Aaron Ruesch and Theresa Nelson, P.E. Wisconsin Department of Natural Resources
• The model DOES NOT estimate a mass load (pounds/acre) of
pollutants.
• The model does reduce the need to inventory all fields in watershed every year and helps focus efforts on high risk areas.
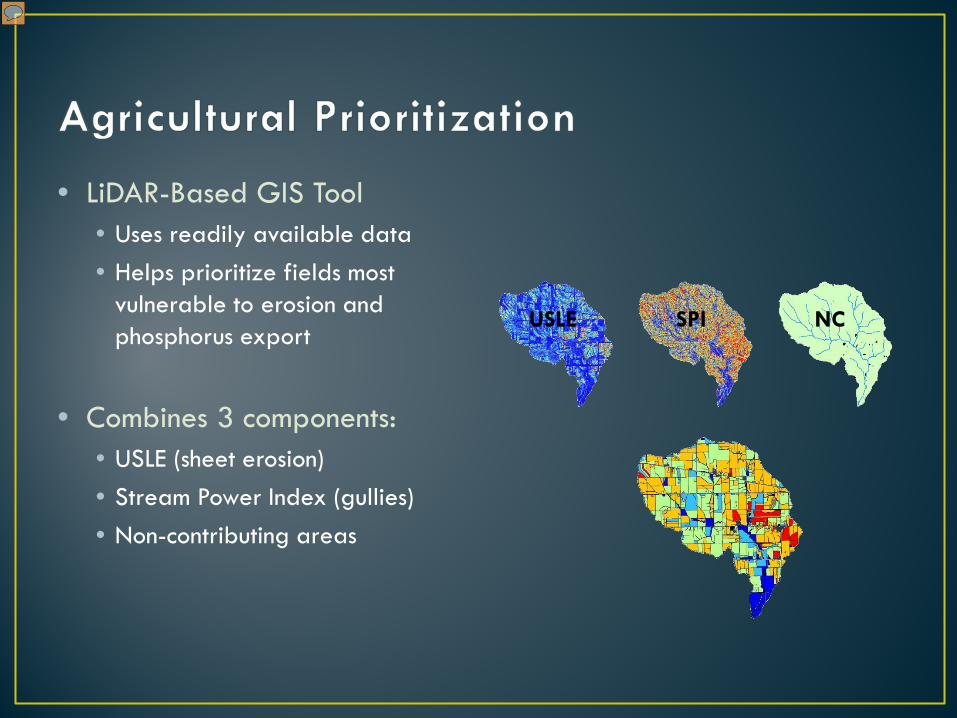
• LiDAR-Based GIS Tool • Uses readily available data • Helps prioritize fields most
vulnerable to erosion and phosphorus export
• Combines 3 components: • USLE (sheet erosion) • Stream Power Index (gullies) • Non-contributing areas
USLE SPI NC


Erosion “Score”
High
Low
Medium
Overall erosion “score”

Putting the Pieces Together
Continuous Corn Cash Grain Dairy Pasture/Hay/Grassland Not enough data
Crop Rotation
Distance from animal lot to stream
0 – 100 ft. 100 - 200 200 - 300 > 300
Non-contributing areas
High Erosion Score
LEGEND
Pot. Restorable Wetlands

Credits Generated by a Nonpoint Source • SNAP-Plus and RUSLE2 for agricultural field practices • New Barnyard Tools • SLAMM and P-8 for urban practices

• Models and tools developed to date are estimations of load reductions on an average annual basis.

Revised WI P Index compared to measured runoff losses for 86 site years using measured sediment and runoff volume in the equations
Testing “Source” Components of P Index Equations
y = 0.97x + 0.01r2 = 0.89
0
5
10
15
20
0 5 10 15 20
WPI
with
mea
s. s
edim
ent a
nd ru
noff
kg h
a-1
Measured total P kg ha-1
1:1
• P Index is working relatively well to rank fields by total P loss if the methods used to estimate average annual runoff and sediment loss are accurate.
Field
Stream
Source: Good, L.W., P. Vadas, J.C. Panuska, C.A. Bonilla, W.E. Jokela, 2012. Testing the Wisconsin Phosphorus Index with Year-Round Field-Scale Runoff Monitoring. Journal of Environmental Quality. 41:1730-1740.

• Trade ratios are used to ensure the amount of reduction resulting from the trade has the same effect as the reduction that would be required without the trade. Further requires an improvement in water quality.
• Trade ratio components include: 1. Location 2. Delivery 3. Uncertainty 4. Equivalency 5. Retirement

• Final Trade Ratio = Delivery + Equivalency + Uncertainty – Habitat Adjustment
For trades involving nonpoint sources the trade ratio cannot
be lower than 1.2:1 (1.2 pounds of nonpoint for every pound of point source pollutant). For trades located upstream in the same HUC-12 the equation generally simplifies to:
• Final Trade Ratio = Uncertainty : 1 ( add 0.2 if necessary)

• Delivery (distance between generator
and user) TMDL – Same factors used in TMDL or
USGS SPARROW
Non-TMDL – USGS SPARROW model for P, N and sediment and Not needed if trading within same HUC-12
A HUC or hydrologic unit code is a sequence of numbers or letters created by the USGS that identify the drainage area of a hydrological feature like a river or a lake. A HUC-12 is about 40 square miles in size.

Delivery Factor = (1/SPARROW delivery fraction) - 1

Downstream Trade Ratio Factor: Allow downstream trading in same HUC-12 but minimize
risk of exceedances of water quality criteria.
Percent Difference between Buyer’s Load
and Total Load at Point of Discharge
Downstream Trade Ratio Factor
< 25% 0.1 25 - 50% 0.2 50 - 75% 0.4
75% > 0.8

Nonpoint Source Credit Generator Uncertainty Factor: For the purpose of this uncertainty factor, MS4s and other permitted storm water sources are considered nonpoint because the pollutant source is diffuse and dependent on climatic factors. Generally, the nonpoint source uncertainty factor accounts for the effectiveness of management practices employed over various flow or precipitation regimes and the ease of verification that the management practice is in place and operating effectively.


• For Water Quality Trading • Monthly certification as part of DMR that practices are installed,
maintained, and functioning. • Annual verification of practices – permitee is the responsible party but
can contract with county LCD, consultant, or other able group.
• For Adaptive Management • Verify 20% of practices per year so that over permit term 100%
verification occurs.
• NRCS technical standards can be used to help evaluate practices – see maintenance and installation requirements.

TMDL = WLA (point source) + LA (nonpoint source) + MOS
Allocations for TMDL:
2000 lbs/yr = 800 lbs/yr + 1100 lbs/yr + 100 lbs/yr (fixed) (fixed)
Existing Conditions: Point source is at 1000 lbs/yr and wants to trade to meet requirements
Trading in TMDL (the math still needs to work): 2000 lbs/yr = 1000 lbs/yr + 900 lbs/yr + 100 lbs/yr

• 40 acre field
• Dairy Rotation with a buffer added (2:1 Uncertainty Trade Ratio)
• Credit Threshold: Annual PI = 3 (TMDL call for a 50% reduction from NR 151 standards of PI = 6)
• Not located downstream and no delivery factor needed

• Summary of PI for installation of buffer strip on a dairy rotation
• Field located in a TMDL watershed with Credit Threshold of 3
Year 1 Year 2 Year 3 Year 4 Year 5 Year 6 Year 7
Field 1 Dairy Rotation
(lb/ac/yr) 8 6 12 4 3 2 5
Field 1-A1 Dairy + Buffer
(lb/ac/yr) 2 2 5 3 2 1 1
Load Reduction (lb/ac/yr) 6 4 7 1 1 1 4
Interim Load Reduction (lb/ac/yr) 5 (8-3) 3 7 1 0 0 0
Long-term Load Reduction (lb/ac/yr) 1 (3-2) 1 0 0 1 1 2
Total Load Reduction 6 4 7 1 1 1 2

• Buffer strip installed on a 40 acre field within same TMDL reach • TMDL load reduction target is 50% • Credit threshold is 3.0 lbs/ac/yr (6*(1-50%))
• Trade ratio is 2:1
Current P Load 320 lbs/yr (Current PI=8lbs/a * 40 ac)
120 lbs/yr (Threshold PI=3.0 * 40 ac)
Credit Threshold
Buffer P Load 80 lbs/yr (Buffer Installed PI=2 * 40 ac)
Load Reduction 240 lbs
(‘interim credit’)= 120 lbs (240/2) Note: Calculation must be made for each year in crop rotation.

• Summary of PI for installation of buffer strip on a dairy rotation
• Field located in a TMDL watershed with Credit Threshold of 3
Year 1 Year 2 Year 3 Year 4 Year 5 Year 6 Year 7
Field 1 Dairy Rotation
(lb/ac/yr) 8 6 12 4 3 2 5
Field 1-A1 Dairy + Buffer
(lb/ac/yr) 2 2 5 3 2 1 1
Load Reduction (lb/ac/yr) 6 4 7 1 1 1 4
Interim Load Reduction (lb/ac/yr) 5 (8-3) 3 7 1 0 0 (Done) 0
Long-term Load Reduction (lb/ac/yr) 1 (3-2) 1 0 0 1 1 (2-1) 2
Total Load Reduction 6 4 7 1 1 1 2

• Buffer strip installed on a 40 acre field within same TMDL reach • TMDL load reduction target is 50% • Trade ratio is 2:1
Current P Load 80 lbs/yr (Current PI=2 lbs/a * 40 ac)
120 lbs/yr (Threshold PI=3.0 * 40 ac)
Credit Threshold
Buffer P Load 40 lbs/yr (Buffer Installed PI=1 * 40 ac)
Load Reduction 80 lbs
Long-term credit 20 lbs. (40 / 2)
Note: Calculation must be made for each year in crop rotation.

• Existing guidance is geared toward point source audiences
• DNR is developing separate guidance for implementation entities • County LCDs • Third party groups
• Utilizing a stakeholder advisory group to provide input • WLWCA • County LCDs • Clean Wisconsin • The Nature Conservancy • UWEX • NRCS

http://dnr.wi.gov keywords: “adaptive management”, “water quality trading”
Location Contact Information DNR Office/Email Statewide coordinators Amanda Minks
Kevin Kirsch Mike Hammers
[email protected] [email protected] [email protected]
Northern District Lonn Franson [email protected]
Southern District- West Amy Garbe [email protected]
Southern District- East Sharon Gayan Karen Nenahlo
[email protected] [email protected]
Eastern District Vacant Contact Statewide coordinators
Western District Mike Vollrath [email protected]

Adaptive Management Technical Handbook
Released: 01/07/2013
http://dnr.wi.gov/topic/SurfaceWater/AdaptiveManagement.html
(topic keyword: “adaptive management”)
Implementing Water Quality Trading in WPDES Permits Released: 08/21/2013
Water Quality Trading How-To Manual
Released: 09/09/2013
http://dnr.wi.gov/topic/SurfaceWater/WaterQualityTrading.html
(topic keyword: “water quality trading”)