trading to improve water quality - clu-in · trading to improve water quality webcast december 14,...
TRANSCRIPT
1
Trading to ImproveTrading to ImproveWater QualityWater Quality
WebcastWebcastDecember 14, 2005December 14, 2005
Lynda HallLynda HallU.S. Environmental Protection AgencyU.S. Environmental Protection Agency
andandSonja BiornSonja Biorn--HansenHansen
Oregon Department of Environmental QualityOregon Department of Environmental Quality
1

2
What We’ll CoverWhat We’ll Cover
What is trading? What is trading? How does trading work?How does trading work?–– Setting trading boundaries, defining Setting trading boundaries, defining
credits, identifying buyers and sellerscredits, identifying buyers and sellersProject examplesProject examplesWhere does trading work? For what Where does trading work? For what pollutants?pollutants?Benefits and challenges of tradingBenefits and challenges of trading
2
3
What We’ll CoverWhat We’ll Cover
Key functions for all trading programsKey functions for all trading programs–– CWA compliance, public information, CWA compliance, public information,
connecting buyers/sellersconnecting buyers/sellersTrading to reduce thermal load in the Trading to reduce thermal load in the Tualatin River, OregonTualatin River, OregonWhere is trading occurring now?Where is trading occurring now?What’s next for tradingWhat’s next for tradingWhere to get more informationWhere to get more information
3

4
What is “Trading”?What is “Trading”?
Cap and tradingCap and trading
Emissions tradingEmissions trading
Pollutant tradingPollutant trading
Effluent tradingEffluent trading
OffsetsOffsets
MitigationMitigation
4

5
‘‘Trading’ is a general approach Trading’ is a general approach useful for many environmental useful for many environmental problemsproblems
Lead in gasoline Lead in gasoline phasedown 1980’sphasedown 1980’sAcid rain Acid rain –– 1990’s1990’sWetlands mitigationWetlands mitigationEndangered species Endangered species habitathabitat
Streambank Streambank restoration restoration Greenhouse gas Greenhouse gas reductionreductionWater quality Water quality tradingtrading
5
Acid rain reductions XX tons over Y years at a cost savings of $$ vs. projected costs
6
What is Water Quality What is Water Quality Trading Trading (WQT)(WQT)??
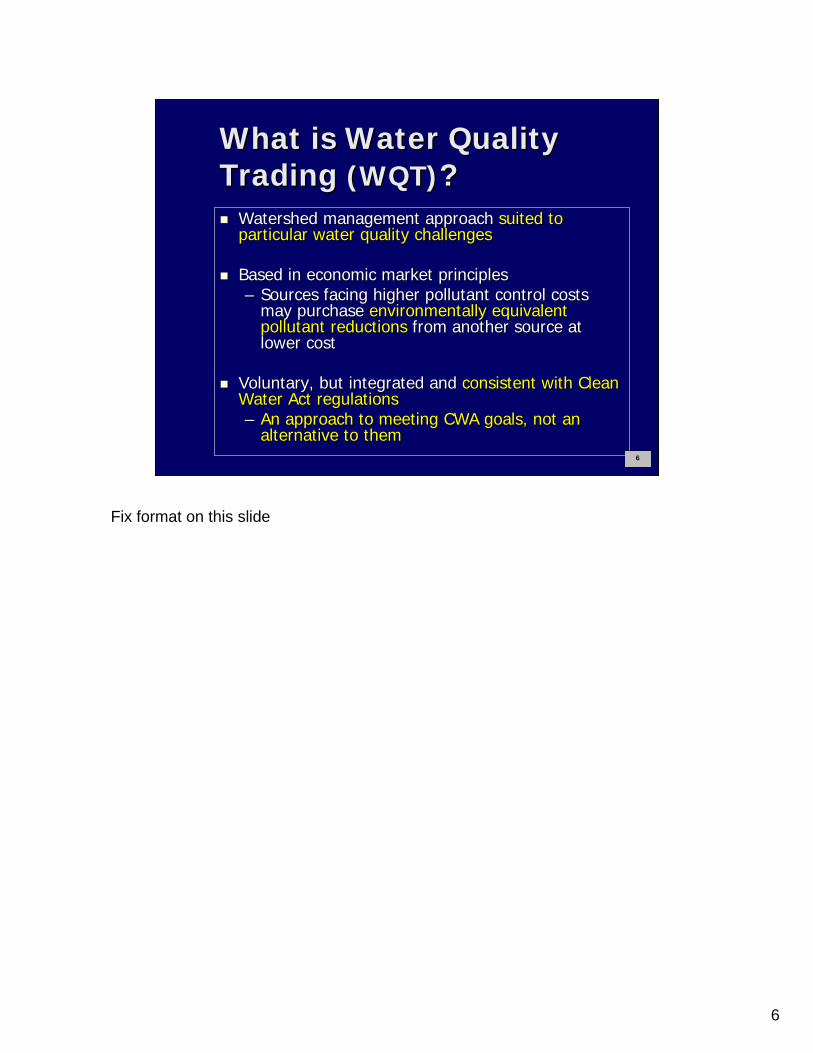
Watershed management approach Watershed management approach suited to suited to particular water quality challengesparticular water quality challenges
Based in economic market principlesBased in economic market principles–– Sources facing higher pollutant control costs Sources facing higher pollutant control costs
may purchase may purchase environmentally equivalent environmentally equivalent pollutant reductionspollutant reductions from another source at from another source at lower costlower cost
Voluntary, but integrated and Voluntary, but integrated and consistent with Clean consistent with Clean Water Act regulationsWater Act regulations–– An approach to meeting CWA goals, not an An approach to meeting CWA goals, not an
alternative to themalternative to them6
Fix format on this slide

7
How Trading WorksHow Trading Works
A A ‘‘capcap’’ or limitor limit is placed on the total amount of is placed on the total amount of pollutant that can be released from all sourcespollutant that can be released from all sources
–– Timeframe is established to meet capTimeframe is established to meet cap
Sources receive an Sources receive an allocationallocation, i.e.,, i.e., authorization authorization to release a given amount of pollutantto release a given amount of pollutantSources can meet their allocation by:Sources can meet their allocation by:
–– Making all necessary reductions onMaking all necessary reductions on--site ORsite OR–– Buying additional allocations Buying additional allocations -- creditscredits -- from other from other
sources that have reduced pollutants sources that have reduced pollutants below their own below their own allocationallocation
7
General description true for most types cap and trade programs; Bullet 2: authorized amts consistent with meeting WQSSources that supply credits must reduce BELOW their allocation - important

8
The WQT ‘cap’ is oftenThe WQT ‘cap’ is oftena TMDLa TMDLOr other consensus water quality goalOr other consensus water quality goalTMDLs are the most common WQT capsTMDLs are the most common WQT caps–– Establish pollutant ‘budget’ sufficient to achieve Establish pollutant ‘budget’ sufficient to achieve
water quality standards water quality standards –– PS are assigned individual PS are assigned individual wasteload allocationswasteload allocations–– Implemented via water qualityImplemented via water quality--based effluent limits based effluent limits
in NPDES permitsin NPDES permits
NPS are assigned NPS are assigned load allocationsload allocations by categoryby category–– Not enforceable under CWANot enforceable under CWA–– Trading can provide incentives for NPS pollutant Trading can provide incentives for NPS pollutant
reductionsreductions
Introduction 8
Say: Total Max. Daily Loads, TMDLs = to restore impaired waters to meet WQSCan be other established/consensus WQ goal, e.g., Chesapeake Bay established loading caps by tributary consistent with WQSEACH PS facility gets WQBEL derived from WLANPS group allocation by general source – all Ag, all forestry, etc. One reason PS/NPS trading more challenging to implement – more on that later. NPS not enforceable CWA, rely on voluntary EPA, state, USDA funding programs to achieve – one reason trading promising can be incentive for landowners, et al to install BMPs to achieve their LA then go beyond to generate credits for sale to NPS. Watershed scale PS/NPS trading programs could be significant way to achieve WQS in waters impaired by both PS and NPS

9
How Trading Works, cont’dHow Trading Works, cont’d
The exchange of credits to meet the water The exchange of credits to meet the water quality cap is quality cap is ‘‘tradingtrading’’–– BUYERS have high pollutant control costsBUYERS have high pollutant control costs–– SUPPLIERS have lower costsSUPPLIERS have lower costs
WQT takes different formsWQT takes different forms–– Point/point source tradesPoint/point source trades among NPDES facilitiesamong NPDES facilities
Watershed scale; implemented via group permitWatershed scale; implemented via group permit
–– Point/nonpoint sourcePoint/nonpoint source tradestradesSo far limited to offsets for a single NPDES facilitySo far limited to offsets for a single NPDES facility
–– Point/nonpoint Point/nonpoint source trading on a source trading on a watershed scalewatershed scale
9
PS/PS A few well-established programsPS/NPS offsets = one NPDES facility negotiates a trade to meet its permit requirementsPS/NPS on watershed scale, being explored in a number of watersheds – greater promise and challenges than other types of trading

10
PS/PS PS/PS PS/NPSPS/NPSSingle facilitySingle facility
10
Happy River basin; TMDL = reduce P loadings to Lake Content. Array of PS and NPS
1. Cluster of PS on tributary – trading under group permit2. Single PS, could purchase credits from upstream farm
11
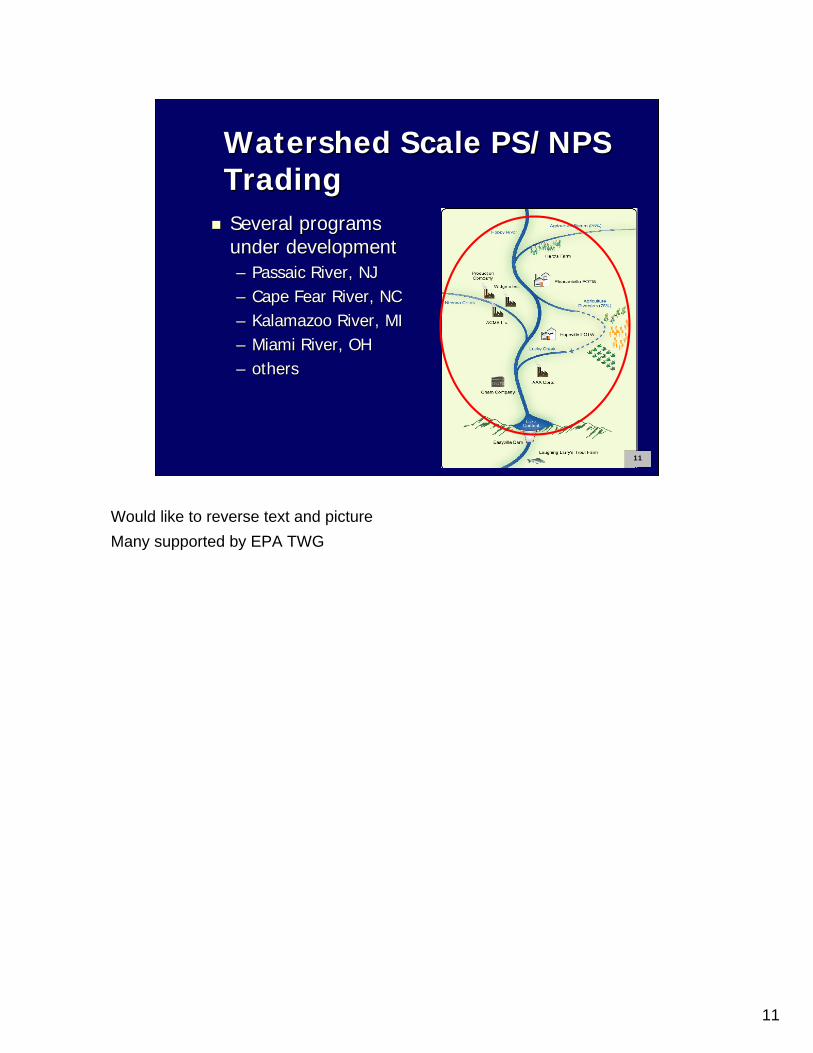
Watershed Scale PS/NPS Watershed Scale PS/NPS TradingTradingSeveral programs Several programs under developmentunder development–– Passaic River, NJ Passaic River, NJ –– Cape Fear River, NCCape Fear River, NC–– Kalamazoo River, MIKalamazoo River, MI–– Miami River, OHMiami River, OH–– othersothers
11
Would like to reverse text and pictureMany supported by EPA TWG

12
Questions?
12
13
Example: Seasonal Hypoxia Example: Seasonal Hypoxia in Long Island Soundin Long Island SoundExcessive nutrient loadings contribute to Excessive nutrient loadings contribute to hypoxic zone in Long Island Sound each hypoxic zone in Long Island Sound each summersummerTo eliminate hypoxia, Connecticut TMDL To eliminate hypoxia, Connecticut TMDL calls for 64% nitrogen reduction among calls for 64% nitrogen reduction among 79 wastewater treatment plants by 201479 wastewater treatment plants by 2014Challenging goal, potential price tag $1 Challenging goal, potential price tag $1 billion billion
13
14
14
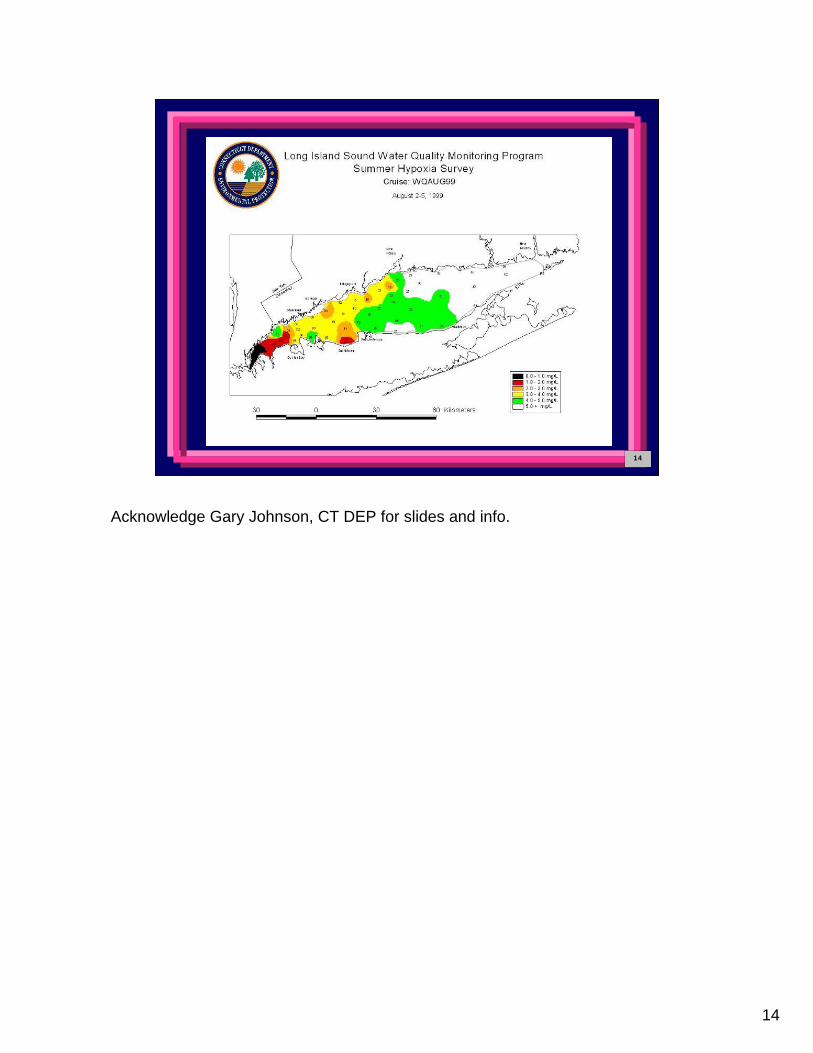
Acknowledge Gary Johnson, CT DEP for slides and info.
15
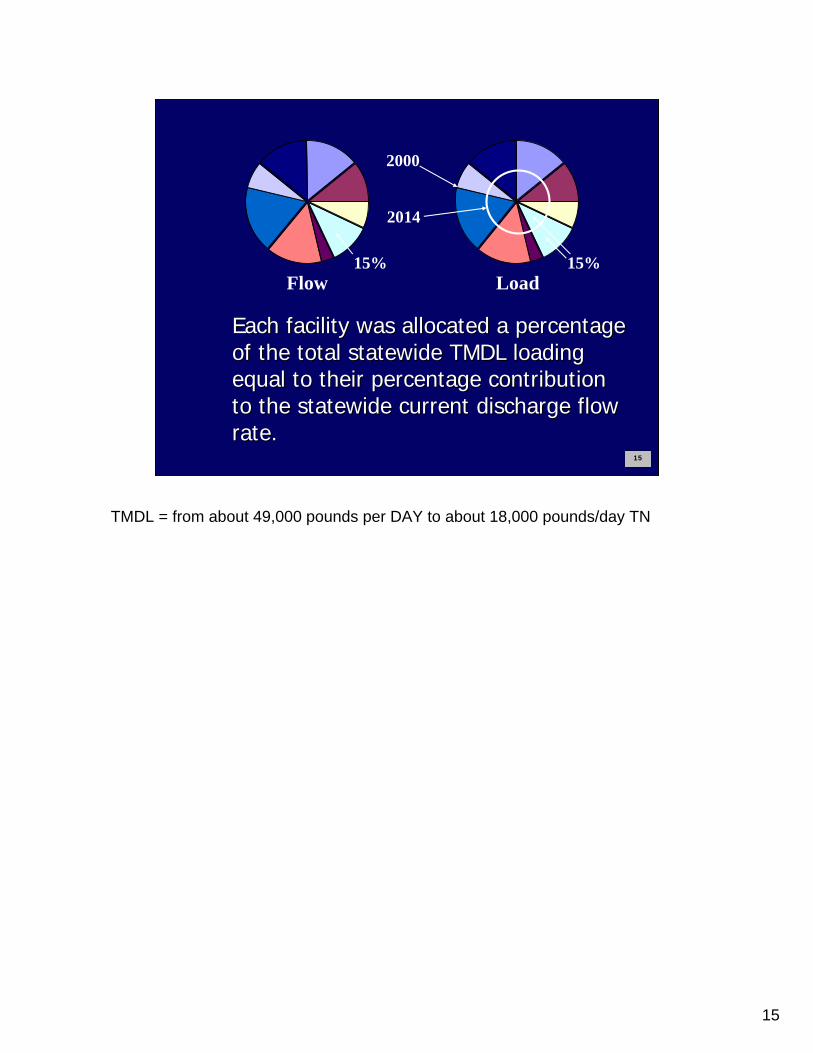
Each facility was allocated a percentage Each facility was allocated a percentage of the total statewide TMDL loading of the total statewide TMDL loading equal to their percentage contribution equal to their percentage contribution to the statewide current discharge flow to the statewide current discharge flow rate.rate.
Flow Load15% 15%
2000
2014
15
TMDL = from about 49,000 pounds per DAY to about 18,000 pounds/day TN

16
Nitrogen Cap and Trade:Nitrogen Cap and Trade:Long Island SoundLong Island SoundCT established a Nitrogen Exchange CT established a Nitrogen Exchange allowing WWTPs toallowing WWTPs to–– reduce nitrogen reduce nitrogen oror–– buy nitrogen reductions from the Exchange buy nitrogen reductions from the Exchange
oror–– overover--control nitrogen and sell reductions control nitrogen and sell reductions 79 WWTPs covered by one NPDES permit79 WWTPs covered by one NPDES permitPermit has aggregate cap that declines Permit has aggregate cap that declines every two years to meet 2014 goalevery two years to meet 2014 goal
16
Permit and cap is for TN; individual permit limits for all other parameters including N compounds with acute effects, e.g., ammonia

17
Water Quality EquivalenceWater Quality Equivalence
WQT WQT changes location of pollutant changes location of pollutant controlscontrols within a watershed within a watershed Water quality equivalence considers Water quality equivalence considers that the that the impact of pollutant control at impact of pollutant control at source A may differ from source Bsource A may differ from source BRatiosRatios, based on pollutant fate and , based on pollutant fate and transport models, transport models, account for different account for different WQ impactsWQ impacts
Suitability Analysis 17
Water quality equivalence is particularly relevant for situations with a specific downstream monitoring point or point of concern (like a reservoir or estuary)

18
0.14
0.18
1.00
0.32
0.46
0.17
0.19
0.11
0.93
18
Connecticut and LI Sound General Permit example -Facilities close by will have lower
Slide is animated to show map and then the way they set up contribution ratios based on which part of the state the discharge is from. Discharges from eastern and north eastern are given lower ratio than discharges from south west areas – this is based on relative impact driven by proximity to the area of impact. You will note that discharges that occur in the extreme south west area get a low ratio because of the flow into the Sound is not as heavy from that area.
In terms of trading, these relative contribution ratios are very important. For dischargers in the southwest part of CT, if they are able to accumulate one pound of credit, they can sell it for approximately the full one pound value. In the for north east area of the state, one pound of credit is only valued at about 0.14. So this has produced an incentive for dischargers in the southwest to invest in treatment and they have.
The TMDL had a 15 year schedule – current projections indicate that for the point source contributions, they may reach the needed reductions about 6 years ahead of schedule.
Program has been up and running for about 3-4 years now.

19
LIS TMDL IMPLEMENTATION
0
10,000
20,000
30,000
40,000
50,000
2000
2001
2002
2003
2004
2005
2006
2007
2008
2009
2010
2011
2012
2013
2014
Year
Nitr
ogen
(lbs
/day
)
19
Expect to reach nitrogen goal 5 to 6 years earlier than more traditional allocation and save $200 million

20
Questions?
20

21
Example:Example:South Nation River, OntarioSouth Nation River, Ontario
Trading to Trading to reduce total reduce total phosphorus in phosphorus in NPSNPS--dominated dominated watershedwatershed
21
Next example goes North to Canada. We have P/NPS trading in USA but not yet on watershed scale. This example 1) on a watershed scale and 2) employs a central ‘bank’ of NPS credits which could be a promising approach more generally.
Acknowledge Dennis O’Grady of SNC who provided these slides and leadership for the P reduction program90% of P from NPS

22
South Nation Water South Nation Water Quality ChallengeQuality Challenge
Phosphorus (P) Phosphorus (P) degradationdegradation–– Annual mean five Annual mean five
times greater than times greater than water quality water quality objective of .3 mg/lobjective of .3 mg/l
18 wastewater 18 wastewater treatment plants with treatment plants with several new or several new or expanding facilities expanding facilities High treatment costsHigh treatment costs
22
>$15M tertiary treatment per plant
23
Cap and Trade to Reduce PCap and Trade to Reduce P
Province capped loads at 1998 levelsProvince capped loads at 1998 levelsNew or expanded dischargers must New or expanded dischargers must achieve no net increase of P in watershed achieve no net increase of P in watershed by:by:–– treating their discharge to zero kg P ORtreating their discharge to zero kg P OR–– buying P credits to offset loads at 4:1 ratiobuying P credits to offset loads at 4:1 ratio
SNC Authority is the broker for all P tradesSNC Authority is the broker for all P trades
23
Wastewater discharge must still meet Provincial treatment standards for all other parameters Historical Clean Water Program
Since 1993, South Nation delivered 420 BMP projects worth over $5.4 million (> $1.6 million in grants)Approx 350 are P reduction projects
Allowed cost/kg of P to be calculatedVerified amount of P that can be removed (> 9,166 kg annually)Gave Province comfort level on P targetsAllowed TPM to proceed more quickly

24
How credits are generatedHow credits are generated
Calculations developed Calculations developed for a set of BMPsfor a set of BMPs–– Manure storageManure storage–– MilkMilk--house washwater house washwater
treatmenttreatment–– Barnyard runoff controlBarnyard runoff control–– Limiting livestock accessLimiting livestock access–– Buffer stripsBuffer strips
Ratio of 4 to 1 appliedRatio of 4 to 1 appliedCredits generated when Credits generated when project installedproject installed
24
If manure lagoon trapped 100 pounds/day P, only 25 pounds per day available to PS dischargers for purchase
Results 2000-2004 = 6900 kg/yr P (15,000 pounds) reduced through dozens of projects

25
Trading Process SummaryTrading Process Summary1. SNC Negotiates TPM Agreement with Discharger
2. Discharger pays SNC $/kg- SNC flows money into Clean Water Program
3. Clean Water Committee allocates $ to eligible projects- Farmer Field Reps do all site inspections, reporting to Committee
4. Landowners complete approved projects
5. SNC verifies project is complete- Invoices and photos of completed project
- Field Reps randomly inspect 10% of completed projects
25
P credits are allocated based on targets for each dischargerAchieving P reduction targets varies from 1 to 5 years
List of projects that make up the “bank” of P credits is provided, individual projects and landowners are not specifically identified
this format adopted to address initial stakeholder concerns regarding landowner liability for performance of P reducing projects
26
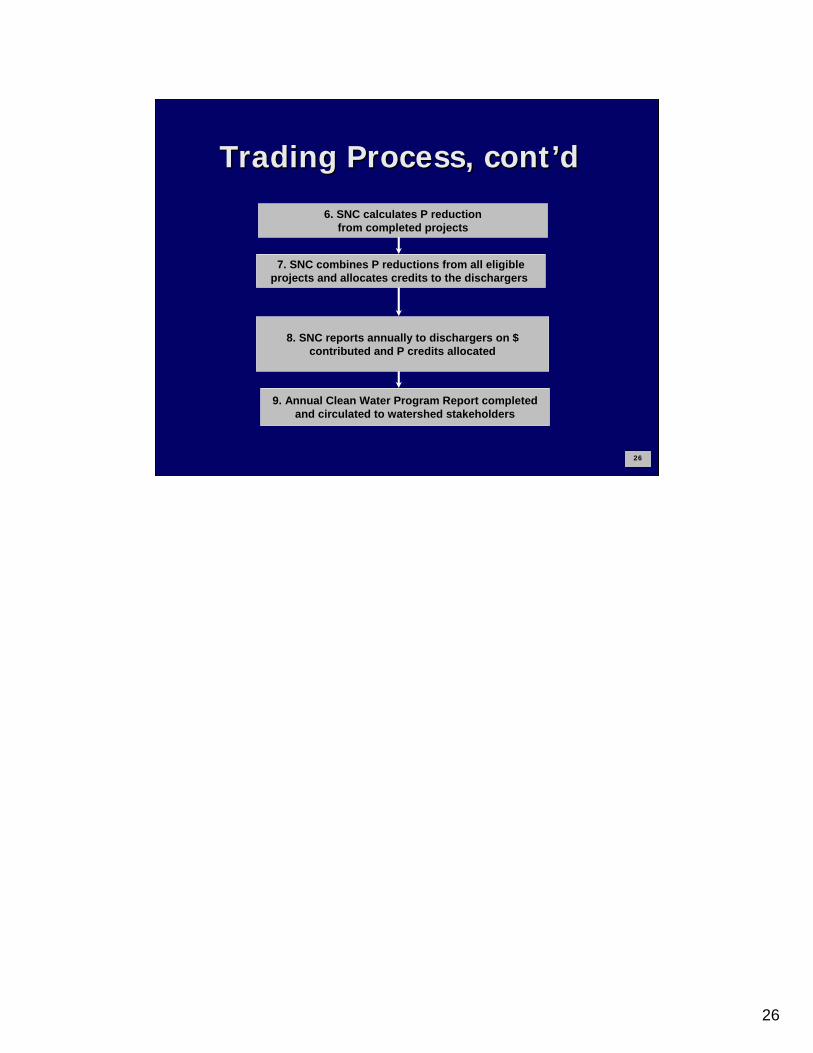
Trading Process, cont’dTrading Process, cont’d
6. SNC calculates P reductionfrom completed projects
7. SNC combines P reductions from all eligibleprojects and allocates credits to the dischargers
8. SNC reports annually to dischargers on $contributed and P credits allocated
9. Annual Clean Water Program Report completedand circulated to watershed stakeholders
26

27
MonitoringMonitoring
13 stations sampled 13 stations sampled monthly for surface water monthly for surface water quality (April quality (April –– Nov.)Nov.)Historical data>40 years at Historical data>40 years at some stations, provides some stations, provides baseline information to baseline information to track P trends over timetrack P trends over timeMonitoring provides data Monitoring provides data on WQ trends, not on on WQ trends, not on individual BMPsindividual BMPs
27

28
Avoiding “hot spots”Avoiding “hot spots”
Trading programs sometimes raise concerns Trading programs sometimes raise concerns about “hot spots” or about “hot spots” or locally high pollutant loadslocally high pollutant loadsCircumstancesCircumstances that potentially create hotspots that potentially create hotspots can be identified in advancecan be identified in advance–– Large credit buyers or increased discharge upstream Large credit buyers or increased discharge upstream
of an impoundment or slowof an impoundment or slow--moving reachmoving reach–– Large credit buyers or increased discharges into a Large credit buyers or increased discharges into a
highly impaired water segmenthighly impaired water segment–– Any purchase of credits directly upstream of drinking Any purchase of credits directly upstream of drinking
water reservoirwater reservoir–– Trades that become large by crossing numerous Trades that become large by crossing numerous
equivalency zonesequivalency zones28
These circumstances can be anticipated and avoided through program design and implementation. Note that these factors don’t guarantee a hot spot will be created but should be carefully evaluated to determine whether a hot spot may be created and, if so, program designed and implemented to avoid that situation.

29
Avoiding “hot spots” Avoiding “hot spots” through program designthrough program design
Trading program Trading program can and should be can and should be designed to avoid hot spotsdesigned to avoid hot spots. Some . Some approaches for doing so include:approaches for doing so include:–– For group permits, include For group permits, include individual permit individual permit
limits limits for parameters affecting local water for parameters affecting local water quality, e.g., ammonia nitrogenquality, e.g., ammonia nitrogen
–– Limit the number of creditsLimit the number of credits used within an areaused within an area–– Limit the Limit the direction of tradesdirection of trades, e.g., upstream , e.g., upstream
versus downstream, or weight trades to favor a versus downstream, or weight trades to favor a directiondirection
–– Apply minimum reductionsApply minimum reductions (before trading) on (before trading) on sources with high potential for creating local sources with high potential for creating local impacts impacts 29

30
Questions?
30

31
State or Regional Trading Policies
Ongoing Offset/Trading Programs
One-Time Offset Agreements
Other Projects and Recent Proposals Source: Morgan and Wolverton (2005) and Breetz and Fisher-Vanden (2004)
Water Quality Trading ActivityWater Quality Trading Activity
31

32
Where Do We Stand With Where Do We Stand With Water Quality Trading? Water Quality Trading? (Scale of trading)(Scale of trading)
So far most trades are single facility offsetsSo far most trades are single facility offsetsThree watershed scale PS trading programs in place, all to Three watershed scale PS trading programs in place, all to protect nutrientprotect nutrient--impaired estuariesimpaired estuaries–– Connecticut Long Island SoundConnecticut Long Island Sound–– Neuse River, NCNeuse River, NC–– TarTar--Pamlico, NCPamlico, NC
Watershed scale programs under developmentWatershed scale programs under development–– Passaic River NJPassaic River NJ–– Cape Fear River NCCape Fear River NC–– Kalamazoo River, MIKalamazoo River, MI–– Bear River, CO/WYBear River, CO/WY–– Lake TahoeLake Tahoe–– Lower Boise River, IDLower Boise River, ID–– Miami River, OHMiami River, OH
32
Why isn’t there more trading?
Regulatory drivers essential yet lacking in many placesBiggest ‘markets’ expected for phosphorus, nitrogen but…many states have not adopted numeric water quality standards for nutrientsAs more states adopt standards, water quality drivers will exist in more watersheds
Alternate driver of water quantity may emerge in some placesTrading is a significant shift in approach
requires education, time for scoping and assessment, infrastructure development, stakeholder engagement
A decision to proceed with WQT must be made watershed-by-watershed
Pollutant reductions made outside of a watershed will not help meet its water quality standardsDiversions, impoundments and other features significantly impact pollutant fate and transport
Analysis required to determine whether trading can succeed in a specific watershed, economically or environmentally

33
Water Quality Program
Water Quality Trading in Oregon
Experiences to Date, What’s Next
33

34
Water Quality Program
Perceptions of Trading• Proponents: Trading is a way to
bring free market efficiencies to reduce compliance costs
• Opponents: Trading is a way for polluters to get off the hook
• Alternate view: Trading can be a better way to protect the resource
34

35
Tualatin River
Gales Creek
McKay C
r eek
Rock Cr eek
Scoggins Creek
Eas t Fo rk Dai ry Creek
Wes
t Fo r
k D
airy
Cre
ek
Fanno
Creek
Dai ry C reek
B ronson Creek
Sain Creek
McF
ee C
ree k
Beaverton Creek
Iler Creek
Bea
ver
Cr e
e k
Roaring Creek
Denny Creek
Ch icken Creek
Burgholzer Creek
Ash
Cre
ek
Clear CreekAbbey Creek
Joh nso n Cree k
Menden
hall C
reek
Whi
t che
r Cre
e k
Sa dd C
reek
P aisley C
anyon
Willi
ams
Cre
ek
Sout h F ork G
ales Cr eek Jackson Creek
Da w
s on Cree k
Summer Creek
Bateman Creek
Cedar Cr eek
Butternut Creek
Cedar Canyon
Warble GulchR
ode r
i ck
Cre
e k
Whisky Creek
Rock Creek
Hillsboro
Tigard
Beaverton Portland
Tualatin
Forest Grove
Sherwood
Cornelius
West Linn
Lake Oswego
Banks
North Plains
River Grove
King City
Gaston
Tualatin Basin Boundary
Land UseDeveloped LandAgricultureForestlandWaterWetlandsBarren Land
CitiesOther StreamsSalmonid Migration Streams Salmonid Spawning StreamsTualatin Mainstem
Tualatin Basin: Salmonid Streams and Land Uses
35

36
Water Quality Program
Tualatin River Temperature Profile(Observed and Predicted for 7/27/99)
Left Bank
Right Bank
Forest Land Agriculture Lands Urban Lands Transportation
Land Use Gaston West Linn
Lee
Fal
ls
Sco
ggin
s C
r.
Gal
es C
r.S
prin
ghill
Pum
ping
Sta
tion
Dai
ry C
r. Roc
k C
r.R
ock
Cr.
WW
TP
Mat
sush
ita
Dur
ham
WW
TPFa
nno
Cr.
Some Reaches areStratified Between RiverMile 0 and River Mile 27
50
55
60
65
70
75
80
05101520253035404550556065707580
River Mile
Stre
am T
empe
ratu
re (o F)
Simulated Stream Temperature
FLIR Derived Stream Temperatures
FLIR Break4:00 PM5:00 PM
36
37
Water Quality Program
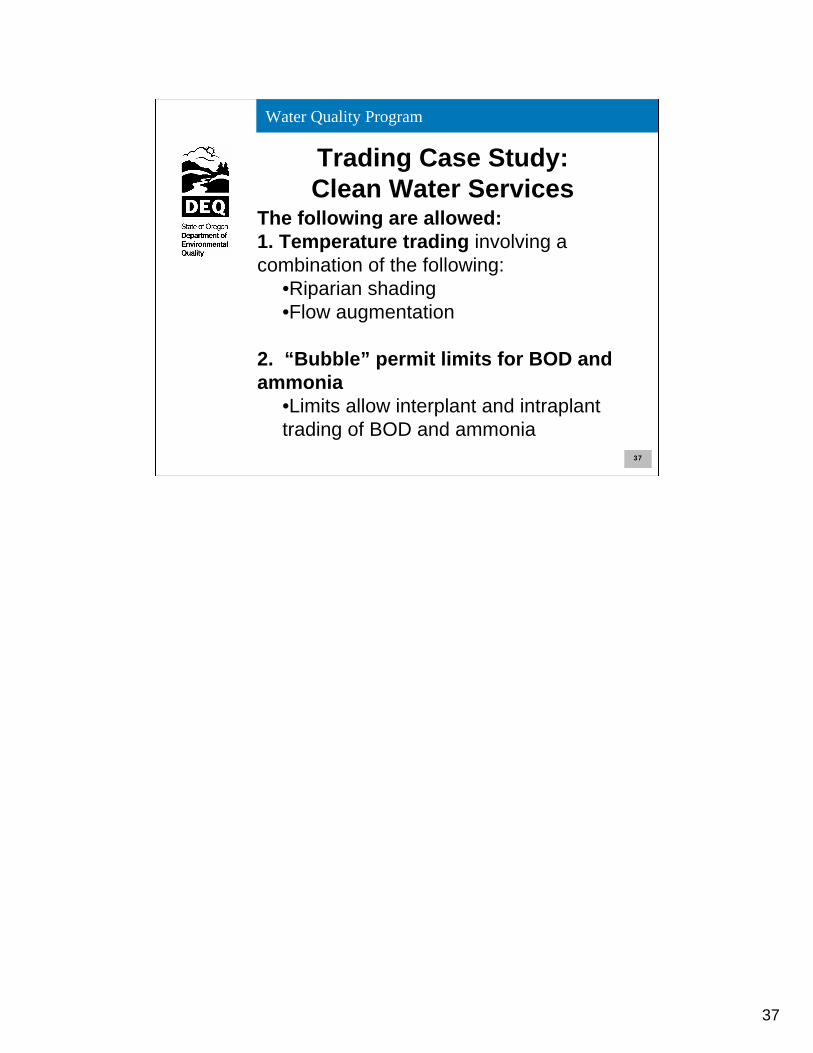
Trading Case Study: Clean Water Services
The following are allowed:1. Temperature trading involving a combination of the following:
•Riparian shading•Flow augmentation
2. “Bubble” permit limits for BOD and ammonia
•Limits allow interplant and intraplant trading of BOD and ammonia
37

38
Water Quality Program
CWS Trade: Advantages• Avoids the environmental
downsides to refrigeration (high need for electricity).
• Riparian shading via native plants + flow aug. = greater environmental benefit.
• Much cheaper for the source.
38

39
Water Quality Program
CWS Trade: A Side Benefit
We are getting good data on:• What it takes to get riparian areas planted on agricultural land. • What it takes/will take to keep it planted.
39
40
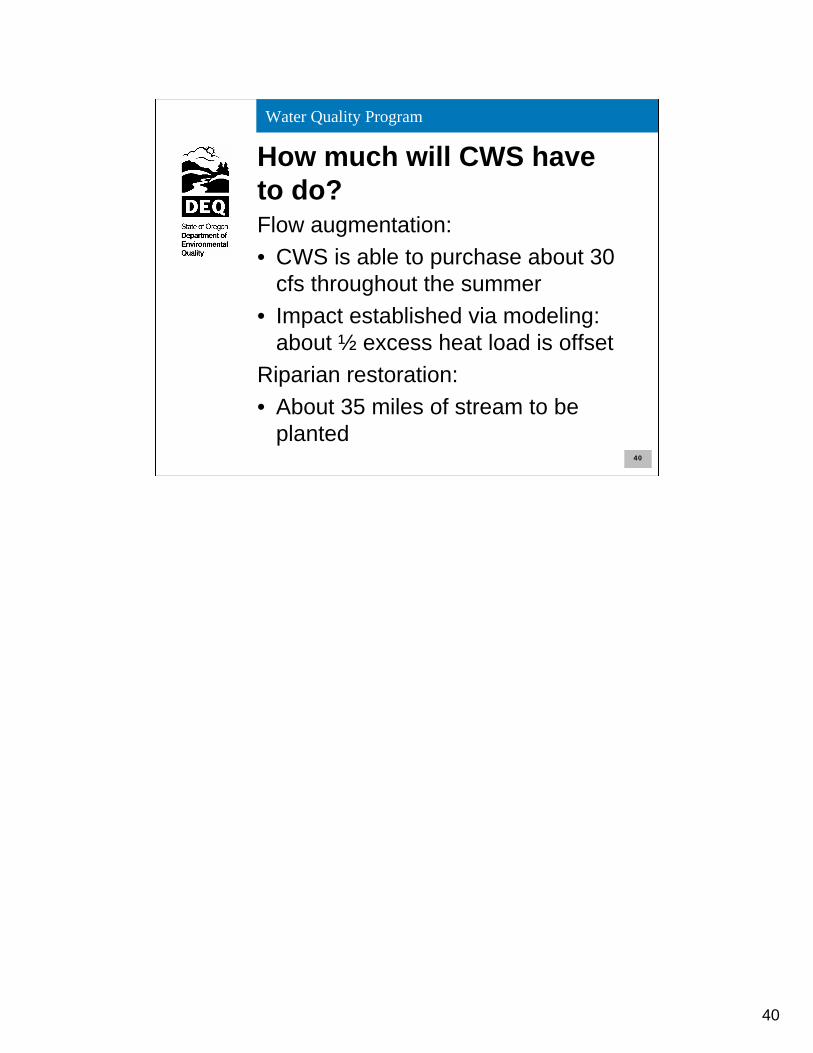
Water Quality Program
How much will CWS have to do? Flow augmentation: • CWS is able to purchase about 30
cfs throughout the summer• Impact established via modeling:
about ½ excess heat load is offset Riparian restoration:• About 35 miles of stream to be
planted40

41
Water Quality Program
How much… (cont’d)?
Riparian restoration:• Impact quantified by measuring
the amount of solar radiation that is blocked by shade-producing vegetation
41

42
Water Quality Program
“Good” Riparian Area
42

43
Water Quality Program
“Bad” Riparian Area
43

44
Water Quality Program
How do they get so “bad”?Streams are messy and unpredictable, they meander and flood.So, people try to control them.
--Methods: removal of streamside vegetation, channel straightening, installation of dikes, levees and riprap.
And… impervious area happens. As watersheds become increasingly built-up, peak flows increase.
44

45
Water Quality Program
What happens when people try to control streams?
The Law of Unintended Consequences kicks in. Some unintended consequences:
--Increased erosion rates.--Streamside vegetation becomes
dominated by nonnative invasives. Or riprap. Or concrete.
45

46
Water Quality Program
Back to how much is enough…
The Basic Equation:
Length of Stream Required =
Excess Heat Load (per day) (Reduced Solar Load x Stream Width)
46

47
Water Quality Program
Daily Solar Loading Rates
47

48
Right Bank
Forest Land Agriculture Lands
Land Use
Urban Lands Transportation
Left Bank
Forest Grove
0%
10%
20%
30%
40%
50%
60%
70%
80%
90%
100%
0123456789101112131415161718192021222324
River Mile
Surr
ogat
e M
easu
re (E
ffect
ive
Shad
e)
0
64
127
191
255
318
382
446
509
573
637
Sola
r Rad
iatio
n Fl
ux (l
y/da
y)
Current Condition
System Potential Condition
1/2 Mile Moving Average (Current Condition)
1/2 Mile Moving Average (System Potential Condition)
Effective Shade on Gales Creek
48

49
Water Quality Program
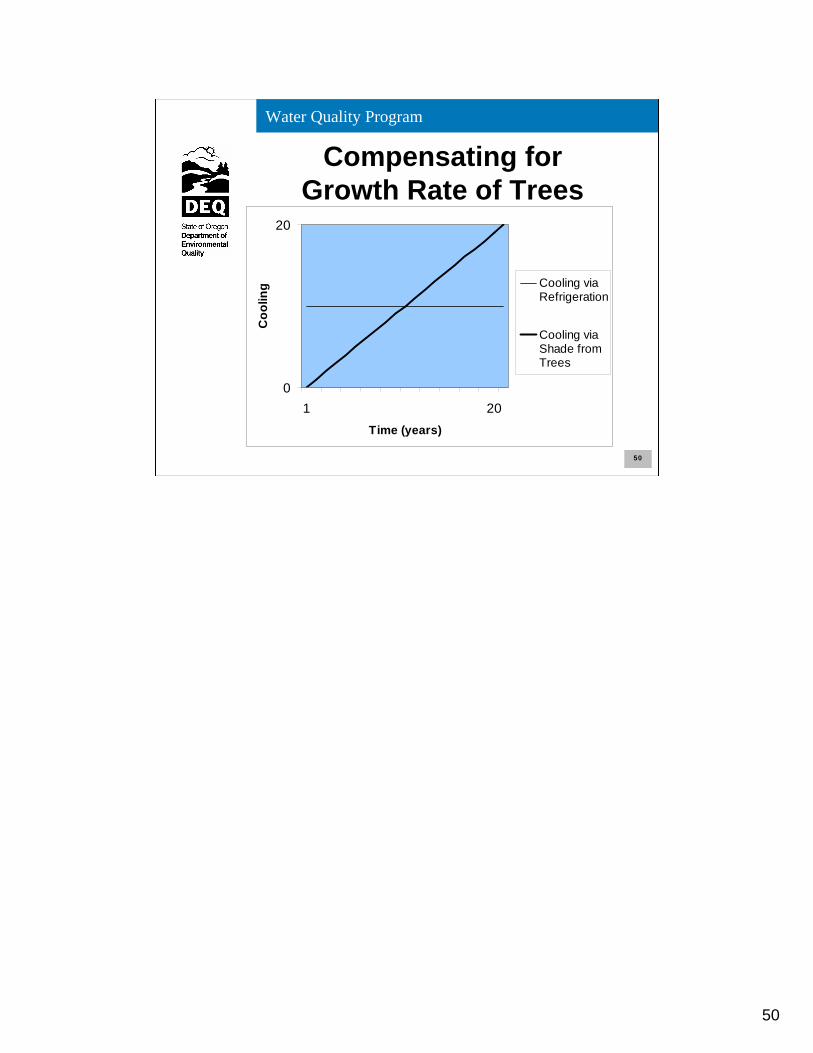
Problems…
• Trees will take a long time to grow • “You are giving CWS credit for
something the farmers should already be doing”
49
50
Water Quality Program
Compensating for Growth Rate of Trees
0
20
1 20Time (years)
Coo
ling Cooling via
Refrigeration
Cooling viaShade fromTrees
50

51
Water Quality Program
The equation modified…
Length of Stream Required
= 2 x Excess Heat Load (Reduced Daily Solar Load x River Width)
51

52
Water Quality Program
Getting riparian areas planted…
• CWS has developed two incentive programs: “Enhanced CREP” and VEGBACC
• CWS has a contract with NRCS to enroll farmers
• There are 1900 farmers in the basin
52

53
Water Quality Program
Alternative Approach
• City of Portland enters into non-binding agreements with (urban) landowners
• Landowner allows access, in exchange City installs plantings
• Homeowner gets free “naturescaping,” City has reduced admin. costs
53

54
Water Quality Program
Establishing ComplianceChallenges:• Stream temperature is highly
variable • Impact of restoration projects may
not be readily measurable at outfall • Possibility of natural disasters• Impact of global warming
54

55
Data courtesy of Philip W. Mote, JISAO/SMA Climate Impacts Group, University of Washington, Seattle, March 2003.
Evidence of Global Warming in Oregon: % Change in Snow Pack Since 1940 at 36 Sites
-80.00%
-60.00%
-40.00%
-20.00%
0.00%
20.00%
40.00%
60.00%
1 3 5 7 9 11 13 15 17 19 21 23 25 27 29 31 33 35
Site No.
% C
hang
e in
Sno
wpa
ck
0
1000
2000
3000
4000
5000
6000
7000
8000
9000
Site
Ele
vatio
n (ft
)
% change since 1940 elevation
55

56
Water Quality Program
Establishing Compliance
Compliance will be established as follows:
• First 5 years: adherence to planting plans
• After 5 years: plant survival rates and shade density measurements
56
57
Water Quality Program
Status of CWS Trade
Goals for year 1 have been met, and 5 miles of stream have been planted.
57

58
Water Quality Program
58
Clean Water Services Temperature Trade
• Motivation• Benefits• How to Quantify• Compliance
Questions???

59
Water Quality Program
What is next for trading?The Willamette Partnership: an effort to expand trading to the entire Willamette basin. Goal: to put together a “portfolio” of projects for sources to choose from to offset thermal and other impacts. Some projects may involve hyporheic flow.
59

60
Water Quality Program
What is hyporheic flow?• Hyporheic flow refers to flow
through the gravels below and at the margins of the river (the hyporheic zone).
• Cooling occurs via hyporheic flow. • Estimate: hyporheic flows in the
Willamette have been reduced by 80% due to bank hardening, loss of channel complexity. 60

61
The Willamette River: Channel Simplification
61

62
Water Quality Program
Achieving cooling via hyporheic flow…
Some approaches:• Direct discharge of effluent to
hyporheic gravels• Re-creating side channels• Floodplain restoration
62

63
Water Quality Program
Hyporheic Flow Issues
Need to insure the following:• Groundwater is not negatively
impacted.• Cooling is adequate.
63

64
Water Quality Program
What is (probably) Not next for trading…The following trading schemes have been proposed:• Trading in the context of UAAs.• Removal of contaminated sediments in lieu of better-than-background cleanup in uplands.
64

65
Water Quality Program
Impact of Dam on Temperature
30
40
50
60
70
80
Janu
ary
March
May July
Septem
ber
Novem
ber
Janu
ary
Month
Tem
pera
ture
(F)
No DamWith Dam
65
66
Water Quality Program
When is trading Not likely to work?
Trading probably won’t work if:• Regulators, permitted sources and
environmental groups do not trust each other.
• Parties do not feel a sense of urgency.
66
67
Water Quality Program
Trading: Lessons LearnedWork with stakeholders to design trades.Why? Because the CWA is silent on trading!Where you don’t have rules, you better have trust.
67
68
Water Quality Program
What we heard from the stakeholders…
• Pursue trades involving shade.• Limit duration of credit to 20
years. • Compensate for the time it
takes trees to grow.
68

69
Water Quality Program
Lessons Learned (cont’d)If stakeholders appreciate that trading can be a better way to protect the resource, they may accept:• Longer timeframe for implementation• Environmental benefit in a location other than at the outfall• Uncertainty
69

70
Water Quality Program
Last but not least…• With trading available as a
tool, we can ask “what is the best way to protect the resource?”
• Our perceptions of trading can limit the potential for trading.
70

71
Water Quality Program
DEQ Webpage on Trading
• Q&A• Trading Internal Management
Directive• Links to EPA trading policy,
manuals on trading
71

72
Questions?
72

73
Potential benefits of WQTPotential benefits of WQT
Substantial cost savings in meeting Substantial cost savings in meeting same water quality goalsame water quality goal
Chesapeake Bay Chesapeake Bay –– WQT could save $1 WQT could save $1 billion billion Miami River, OH Miami River, OH –– WQT could save WQT could save $370M$370MSavings accrue to credit buyers, e.g., Savings accrue to credit buyers, e.g., publiclypublicly--owned treatment plantsowned treatment plantsRevenue provided to credit suppliers, Revenue provided to credit suppliers, PS or NPS (e.g., landowner)PS or NPS (e.g., landowner)
73
Where suited to the situation, WQT is a way to get more TMDLs, WQ goals implemented. With tight resources, cost savings can make the difference between implementation and no implementation.
In nutrient trading credit buyers will often be public agencies, e.g. POTW, thus savings accrue to the public.
Ches. Bay Finance Panel – if “fully leveraged” (PS and NPS) could save estimated $1 billion, or about of 7% of total cost for 300 WWTP to reach WQ goal (timeframe not specified but likely 7-15 years)
Miami River, OH, preliminary estimates for 315 WWTP to meet N,P criteria over 20-year period These are preliminary estimates with many embedded assumptions – no one knows if they’re accurate. But even if the order of magnitude is correct, there is a real opportunity.

74
Potential benefits of WQTPotential benefits of WQT
For PS/NPS trading, For PS/NPS trading, environmental benefits in environmental benefits in addition to improved WQaddition to improved WQ–– Riparian improvement, Riparian improvement,
reduced erosionreduced erosion–– CoCo--control of multiple control of multiple
pollutantspollutants–– Improved habitat, flood Improved habitat, flood
retentionretention–– Potentially, restoration of Potentially, restoration of
more wetlandsmore wetlands74

75
Where is WQT likely? Where is WQT likely? wwatershed conditions that favor tradingatershed conditions that favor trading
Water quality problem andWater quality problem and pollutant sources pollutant sources are characterized are characterized Desired Desired water qualitywater quality target is in placetarget is in place, e.g., , e.g., consensus cap or TMDL consensus cap or TMDL DriverDriverMultiple point Multiple point sources face more stringent sources face more stringent permit limitspermit limits, i.e., water quality, i.e., water quality--based limits based limits Significant Significant pollutant control cost differences pollutant control cost differences existexist among PS or between PS and nonpoint among PS or between PS and nonpoint sources sources
75
Large scale trading is generally viable only when these circumstances alignCan have single facility trades virtually anywhere, where one facility secures credits to meet its WQBEL. But for watershed-scale trading (multiple buyers & sellers) to be successful, experience shows that these factors need to be in place. Many PS with high control costs make emergence of a ‘market’ for pollutant reductions more likely

76
Where is WQT likely? Where is WQT likely? wwatershed conditions that favor tradingatershed conditions that favor trading
Sufficient Sufficient modeling, data availablemodeling, data available to assess to assess relative water quality impact of tradesrelative water quality impact of tradesAppropriate pollutantAppropriate pollutant type type -- trading easier trading easier for pollutants that exert effects over longer for pollutants that exert effects over longer term, larger scaleterm, larger scaleTiming of pollutant reductions can be Timing of pollutant reductions can be aligned for generation/use of creditsaligned for generation/use of credits–– e.g., seasonal, annuale.g., seasonal, annual
States, States, stakeholders willing to take stakeholders willing to take nontraditional approachnontraditional approach
76
Bullet 1 = WQ equivalence point. Trading moves location of poll. Control thus must be able to assess relative effect of poll. Reduction at diff. Locations in watershed.
77
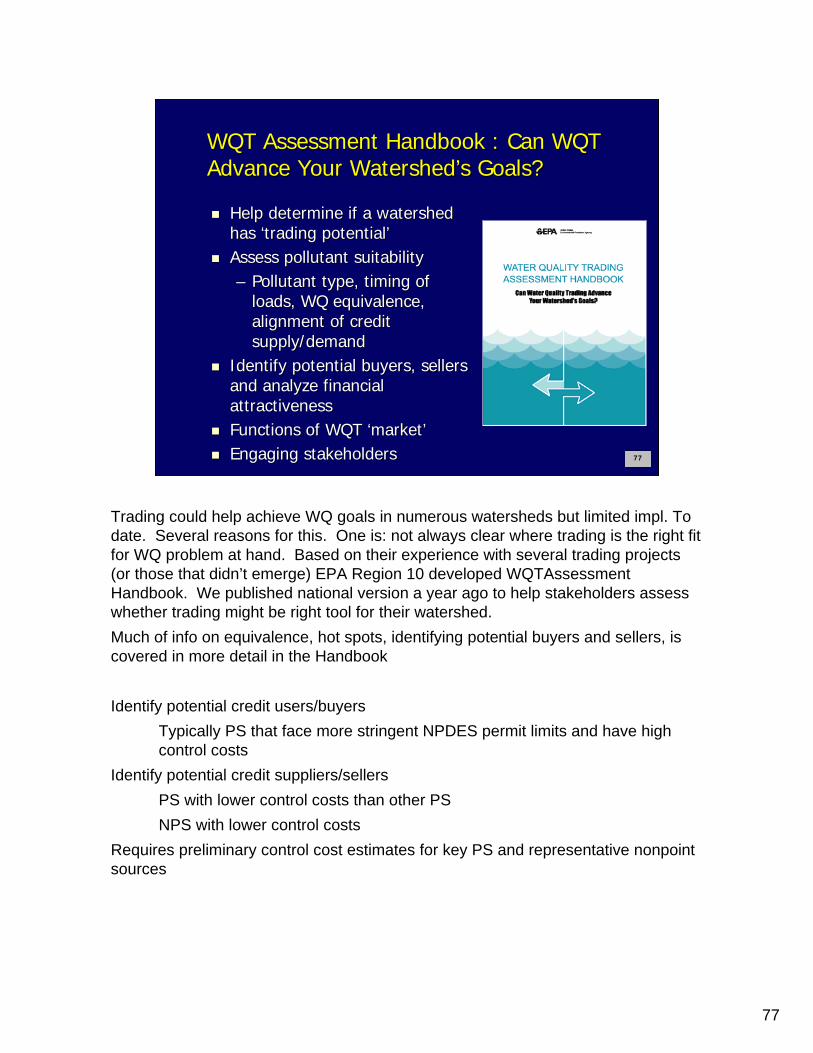
WQT Assessment Handbook : Can WQT WQT Assessment Handbook : Can WQT Advance Your Watershed’s Goals?Advance Your Watershed’s Goals?
Help determine if a watershed Help determine if a watershed has ‘trading potential’has ‘trading potential’Assess pollutant suitabilityAssess pollutant suitability–– Pollutant type, timing of Pollutant type, timing of
loads, WQ equivalence, loads, WQ equivalence, alignment of credit alignment of credit supply/demand supply/demand
Identify potential buyers, sellers Identify potential buyers, sellers and analyze financial and analyze financial attractivenessattractivenessFunctions of WQT ‘market’Functions of WQT ‘market’Engaging stakeholdersEngaging stakeholders 77
Trading could help achieve WQ goals in numerous watersheds but limited impl. To date. Several reasons for this. One is: not always clear where trading is the right fit for WQ problem at hand. Based on their experience with several trading projects (or those that didn’t emerge) EPA Region 10 developed WQTAssessment Handbook. We published national version a year ago to help stakeholders assess whether trading might be right tool for their watershed.Much of info on equivalence, hot spots, identifying potential buyers and sellers, is covered in more detail in the Handbook
Identify potential credit users/buyersTypically PS that face more stringent NPDES permit limits and have high control costs
Identify potential credit suppliers/sellersPS with lower control costs than other PSNPS with lower control costs
Requires preliminary control cost estimates for key PS and representative nonpoint sources

78
Key Functions Key Functions All WQT programs must:All WQT programs must:
Assure Assure CWA complianceCWA complianceDefine trading areaDefine trading area boundaries boundaries Define credits Define credits -- exchangeable pollutant exchangeable pollutant reductionsreductions–– e.g., average pounds/day total phosphorus e.g., average pounds/day total phosphorus
reduced during a onereduced during a one--year periodyear periodEnsure Ensure accountability for pollutant accountability for pollutant reductionsreductionsEnsure Ensure water quality equivalencewater quality equivalence and and avoidance of hotspotsavoidance of hotspotsEnable Enable communicationcommunication among credit buyers among credit buyers and sellersand sellers
78

79
Key Functions Key Functions All WQT programs must:All WQT programs must:
Track tradesTrack trades and progress towards and progress towards WQ goalsWQ goalsManage riskManage risk among parties to tradesamong parties to tradesProvide information to the publicProvide information to the public and and other stakeholdersother stakeholders
79

80
Defining PS CreditsDefining PS Credits
Facilities may not trade to meet technologyFacilities may not trade to meet technology--based NPDES limitsbased NPDES limitsA facility may A facility may purchase creditspurchase credits to meet more to meet more stringent water qualitystringent water quality--based limitsbased limits–– within limits needed to protect local water quality within limits needed to protect local water quality
A facility can A facility can create credits to sellcreate credits to sell if its discharge if its discharge is reduced is reduced belowbelow water qualitywater quality--based limitsbased limits–– If limit=100, a reduction to 75 could generate 25 If limit=100, a reduction to 75 could generate 25
creditscredits
80
EPA Water Quality Trading Policy, 2003
Another key issue which NPDES permit limits could be met throughtrading. PS may be subject two kinds of limits NPDES permits-technology-based effluent limits all must meet; developed for their industrial category by pollutant; many of these in place for decades-water quality-based effluent limits – more stringent, included in permits where waterway impaired for pollutant and PS is causing or contributing to impairment, whether or not TMDL for that water
May trade for latter but not technology standards – statutory minimums.
“Credits” created when discharge below WQBEL. Another facility can purchase credits to meet WQBEL; however may not do so if discharge threatens local WQ.

81
NPS Credits: Addressing NPS Credits: Addressing Measurement ChallengesMeasurement ChallengesNPS load estimates are less certain than PS loadsNPS load estimates are less certain than PS loads–– Loads are diffuse, variable based on weather, site conditionsLoads are diffuse, variable based on weather, site conditions–– Unlike PS discharges, distance from waterbody can varyUnlike PS discharges, distance from waterbody can vary–– Best Management Practices (BMPs) vary in effectiveness Best Management Practices (BMPs) vary in effectiveness
Approaches to address NPS uncertaintyApproaches to address NPS uncertainty–– Discount credits based on location, other factorsDiscount credits based on location, other factors–– Apply trading ratios (2 NPS:1PS) or retire portion of each crediApply trading ratios (2 NPS:1PS) or retire portion of each credit t
tradedtraded–– Use quantified management practices where feasible Use quantified management practices where feasible –– Use conservative assumptions on BMP effectivenessUse conservative assumptions on BMP effectiveness
Essential to Essential to engage agricultural professionalsengage agricultural professionals early and early and often in PS/NPS trading design and implementationoften in PS/NPS trading design and implementation
81
Measurements or BPJ used to establish ratios: Alton, IL BPJ 2:1 sediment offsetLower Boise: identified 8-9 practices for which reliable data available; if these practices usedReduce need for discounting by using demonstrated values or conservative assumptions
States, others developing trading programs that involve NPS – essential to bring Ag experts in early for technical and implementation credibility and expertise
82
Defining NPS CreditsDefining NPS Credits
2003 EPA Trading Policy 2003 EPA Trading Policy -- baseline for baseline for creating nonpoint source credits is creating nonpoint source credits is TMDL load allocation (LA)TMDL load allocation (LA)–– States have discretion to identify other States have discretion to identify other
environmentally appropriate baselinesenvironmentally appropriate baselines–– If TMDL, question becomes how to If TMDL, question becomes how to
equitably apply aggregate LA to individual equitably apply aggregate LA to individual land parcelsland parcels
82
Defining NPS credits trickier

83
Defining NPS Credits Defining NPS Credits –– An ApproachAn ApproachEstimating P credits Estimating P credits -- Lower Boise, ID programLower Boise, ID program
Identify eligible BMPs and efficienciesIdentify eligible BMPs and efficienciesEstimate current P load of land parcel using Estimate current P load of land parcel using soil slope and loss factorssoil slope and loss factorsEstimate P reductions achieved with BMPs Estimate P reductions achieved with BMPs including uncertainty factorincluding uncertainty factorFrom total P reduction achieved, deduct From total P reduction achieved, deduct contribution to TMDL LA or other WQ goalcontribution to TMDL LA or other WQ goalWhat remains are marketable ‘credits’What remains are marketable ‘credits’–– which may be further discounted for location or which may be further discounted for location or
to offset PS/NPS uncertaintyto offset PS/NPS uncertainty
83

84
Questions?
84

85
What Does the Future Hold?What Does the Future Hold?Uncertainty and Opportunity for WQTUncertainty and Opportunity for WQT
Uncertainty about when, where trading Uncertainty about when, where trading programs will developprograms will developTechnical challenges remain with nonpoint Technical challenges remain with nonpoint source tradingsource trading50,000 waters impaired by excess nutrients; 50,000 waters impaired by excess nutrients; more likely in coming yearsmore likely in coming years–– A much smaller subset will have favorable A much smaller subset will have favorable
conditions for tradingconditions for trading–– Where conditions are favorable, incentives for Where conditions are favorable, incentives for
trading can be largetrading can be largeIn these cases there may be a role for a central In these cases there may be a role for a central ‘banker’ to facilitate trades‘banker’ to facilitate trades
85
And uncertain about size and number of markets. But if it’s going to happen we need to start in earnest to address a number of challenges.Technical and implementation challenges NPS trading. Not subject of this talk but don’t want to minimize. Still need i.d. analytical methods and approaches to reliable NPS measurements.

86
Credit ‘Banks’ Could Be Credit ‘Banks’ Could Be Essential for NPS TradingEssential for NPS TradingTrading won’t happen unless credit buyers and sellers Trading won’t happen unless credit buyers and sellers can readily connectcan readily connect–– Multiple buyers, e.g., wastewater treatment plantsMultiple buyers, e.g., wastewater treatment plants–– Many potential sellers, e.g., landownersMany potential sellers, e.g., landowners
Most large buyers will need aggregated credits from Most large buyers will need aggregated credits from multiple locationsmultiple locationsNPS credits vary widely in performance and uncertainty NPS credits vary widely in performance and uncertainty and must be verified, discounted accordingly and must be verified, discounted accordingly Other potential banker/broker functionsOther potential banker/broker functions–– Optimize selection, location of BMPsOptimize selection, location of BMPs–– Provide escrow or backup credits in case of BMP failure Provide escrow or backup credits in case of BMP failure
86
Trading among PS is straightforward and partners can generally find one another.For PS/NPS trading, however, banker/brokers could be essential to its success. Unlikely to be large “single user” banks for NPS credits, where the buyer provides his own credits. In part b/c buyers generally won’t be state agencies (DOT) but will be large municipalities
In large watersheds, could be dozens of buyers; hundreds of sellers. POTWs and landowners don’t have a history of working together, may distrust. Landowners want arms-length (or more) from gov’t activities and are too busy, not necessarily qualified to assess credits, discount, market and sell.Likely need for credit aggregation and ‘insurance’ that individual landowners
unlikely to provide.
Other functions could be added, e.g., preferring measurable BMPs which result in higher-value (less discounted) credits; focusing BMPs in watershed areas that maximize their effectiveness in treating pollutants.

87
Works with landowner, or purchases land, to generate nutrient reduction credits
Nutrient reduction
Manure management
Riparian buffers
Aggregates credits and sells to credit bank or directly to buyers
Possible PSPossible PS--NPS FrameworkNPS Framework
NPS Credit Broker
87

88
In closing…In closing…
Like other watershed decisions, Like other watershed decisions, trading program design and trading program design and implementation can occur at regional, implementation can occur at regional, state and local levelsstate and local levelsEffective engagement of watershed Effective engagement of watershed stakeholders can greatly influence the stakeholders can greatly influence the success and outcomes of trading success and outcomes of trading programsprograms
88

89
Questions?
89